Shifts of the Mean Centers of Potential Vegetation Ecosystems under Future Climate Change in Eurasia

1
State Key Laboratory of Resources and Environmental Information System, Institute of Geographic Sciences and Natural Resources Research, Chinese Academy of Sciences, Beijing 100101, China
2
College of Resources and Environment, University of Chinese Academy of Sciences, Beijing 100049, China
3
Jiangsu Center for Collaborative Innovation in Geographical Information Resource Development and Application, Nanjing 210023, China
*
Author to whom correspondence should be addressed.
Forests 2019, 10(10), 873; https://doi.org/10.3390/f10100873
Submission received: 2 August 2019
/
Revised: 28 September 2019
/
Accepted: 2 October 2019
/
Published: 4 October 2019
(This article belongs to the Section Forest Ecology and Management)
Abstract
:Climate change dominantly controls the spatial distributions of potential vegetation ecosystems; the shift trends in the mean centers of potential vegetation ecosystems could be used to explain their responses to climate change. In terms of the climate observation data of Eurasia for the period from 1981 to 2010 and the climate scenario data for the period from 2011 to 2100 under the three Representative Concentration Pathways (RCPs) scenarios of RCP2.6, RCP4.5 and, RCP8.5, which were released by the Coupled Model Intercomparison Project Phase 5 (CMIP5), the Holdridge Life Zone (HLZ) ecosystem model was improved to quantitatively classify the potential vegetation types, and the shift model of mean center was adopted to compute the trends in the spatiotemporal shifts of potential vegetation types in Eurasia. The results showed that the mean centers of the major potential vegetation ecosystems would be distributed in the central and southern parts of Eurasia. Under the RCP2.6, RCP4.5, and RCP8.5 scenarios, the potential shift distances of the mean centers of the vegetation types under the RCP8.5 scenario would be the largest, and those of the polar/nival area, subpolar/alpine moist tundra, warm temperate dry forest, subtropical moist forest, cool temperate moist forest, cool temperate wet forest, subtropical wet forest, subtropical thorn woodland, warm temperate moist forest and subtropical dry forest would be larger than those in the other potential vegetation types in Eurasia. Moreover, the shift directions of the mean centers of the major potential vegetation types would generally shift northward, and subtropical dry forest, warm temperate moist forest and subpolar/alpine moist tundra would be the most sensitive to change among all vegetation types under the three scenarios for the period from 2011 to 2100.
1. Introduction
Changes in vegetation ecosystems, which are major indicators of global change on the Earth’s surface, play a crucial role in maintaining the human living environment and its sustainable development [1,2]. Climate change, as an important aspect of global change, has caused a series of changes in the spatiotemporal distribution of vegetation ecosystems [3,4,5]. The interactions between climate and vegetation ecosystems have always been a hot topic in global change research [6]. A long-term investigation of the correlation between climate change and vegetation ecosystem change [7] showed that there was a strong correlation between climate change and vegetation distributions [8], and that the climate exerts the dominant control on the distributions of the major vegetation types on a large scale [9]. The key climate parameters of biotemperature, precipitation and evaporation directly determine the changes in the spatial distribution of terrestrial ecosystems [10,11,12,13,14,15]. A series of models have been developed to simulate the spatial distributions of vegetation ecosystems [16], in which the dominant models include the Holdridge Life Zone ( HLZ) ecosystem model [9], the model of predicting physiognomic vegetation types with climate variables developed by Box E.O.(BOX) [17], Dynamic Global Phytogeography Model (DOLY) [8], Mapped Atmosphere-Plant Soil System (MAPSS) model [18] and Integrated BIosphere Simulator (IBIS) [19]. In particular, the HLZ ecosystem model has been widely used and is considered an effective method for simulating the potential distributions of vegetation ecosystems [20,21,22,23,24] because the model parameters only involve the three key climatic factors: Mean annual biotemperature (MAB), average total annual precipitation (TAP) and potential evapotranspiration ratio (PER) [25,26,27].
Since the early 2000s, a continuous effort has been made to understand the relationship between vegetation distributions and climate change [28,29,30], especially to reveal the response of vegetation to climate change [31,32]. For instance, an analysis of the historical vegetation and climate data showed that the forest distribution had shifted to the polar region [33]; grass distribution was more sensitive to change than any other vegetation ecosystems in Central Asia [34]; the mean centers of the different terrestrial ecosystems in China showed different shift trends from 1960 to 2002 [35]; the mean center shift of vegetation ecosystem would influence the ecosystem service value [36]; and the mean centers of vegetation ecosystems would show a different shift trend under different climate change scenarios [37]. However, current research mainly focuses on the responses of the shift in the mean center of vegetation ecosystems to historical climate change [38], and is rarely involved in analyzing the response relations between the different shift trends of vegetation ecosystems and climate change in the future.
To explicitly analyze the responses of the different shift trends in vegetation ecosystem types to the different climate change scenarios in Eurasia, the Holdridge Life Zone (HLZ) ecosystem model has been improved to quantitatively classify the potential vegetation types, and the shift model of mean center has been adopted to compute the spatiotemporal shift trends of potential vegetation types. The shift trends of the mean centers in different potential vegetation ecosystems from 2010 to 2100 were obtained from the climate observation data from 1981 to 2100 in Eurasia and the climate scenarios data released by CMIP5 from 2011 to 2100. The different shift distances and directions of the mean center in the different vegetation ecosystem types were compared under the three scenarios of RCP2.6, RCP4.5, and RCP8.5, and we discuss which vegetation ecosystem types will be more sensitive to climate change in Eurasia in the future.
2. Materials and Methods
2.1. Data Sources
The basic climate datasets include the observation data and the scenario data. The observational monthly climate data from 1981 to 2010 were collected from 1360 weather stations in Eurasia as seen in Figure 1. The climate scenario data for the CMIP5 RCP2.6, RCP4.5, and RCP8.5 scenarios from 2011 to 2100 were obtained from the IPCC website. The three climate scenarios of RCP2.6, RCP4.5 and RCP8.5 represent scenarios of low, middle and high emissions of greenhouse gases, respectively (http://www.ipcc-data.org) [39]. The Digital Elevation Model (DEM) data seen in Figure 1 was derived from the Shuttle Radar Topography Mission (SRTM) data (http://srtm.csi.cgiar.org) with a spatial resolution of 1 km × 1 km resampled to a resolution of 0.125° × 0.125°.
The accuracy of spatial distribution data of the climate variables obtained from the observational scatter data and low resolution scenario data is important to the HLZ ecosystem model and the shift model of mean center, which directly affects the quality of the results of the simulation of the shift trends of the mean centers of potential vegetation ecosystems under climate change [11].
The main interpolation and downscaling methods included the inverse distance weighted (IDW) model, kriging (Kriging) model, spline interpolation (Spline) model, triangulated irregular network (TIN) model and high accuracy surface modeling (HASM) method. The IDW model uses an inverse distance weighting function to determine the interpolation value while ignoring the information beyond the neighborhood. Although the Kriging model attempts to have an error equal to zero, this goal is nearly unattainable. The Spline model applies univariate cubic basis-splines to simulate surfaces, but few types of surfaces fit the splines. The TIN model uses a linear function to calculate the value of each point but ignores nonlinear information. HASM is a new method based on the differential geometry theory that could overcome the drawbacks of the IDW, Kriging, Spline and TIN methods [40], and the accuracy of the interpolated and downscaled climate data could be generally increased by 5% compared with that of the other three methods [41,42]. Thus, the HASM method was selected to obtain the spatial grid data of MAB, TAP and PER with a spatial resolution of 0.125° × 0.125° by combining the longitude, latitude and elevation data during the periods from 1981 to 2010 (T0), 2011 to 2040 (T1), 2041 to 2070 (T2) and 2071 to 2100 (T3); the specific methods are described in the references [40,41,42].
2.2. Methods
2.2.1. The HLZ Ecosystem Classification
The HLZ ecosystem model is a classification system for different HLZ ecosystem types in terms of the three bioclimatic factors: Mean annual biotemperature (MAB), average total annual precipitation (TAP) and potential evapotranspiration ratio (PER) [9,11,23,37]. The HLZ ecosystem model was improved to simulate the potential vegetation ecosystems throughout Eurasia and can be expressed as
where , and are the MAB (°C), TAP (mm) and PER, respectively, at grid in period t; and are respectively the accumulated temperature above 0 °C and below 30 °C and the total precipitation on the day; , and are respectively the values of the MAB logarithm, TAP logarithm and PER logarithm at the central point of the potential vegetation type in the HLZ ecosystem criterion; , , and ; and is the potential vegetation type.
2.2.2. Shift Model of Mean Center in Potential Vegetation Ecosystems
The original mean center model was developed to calculate the mean centers of the population distributions in the USA population census in 1870 [43] and has been mainly used in economic geography [44,45,46]. Since the 2000s, the mean center model has been improved gradually to compute the shift trends of the mean centers of terrestrial ecosystems [11,35,37] and land cover types [47]. In this study, the mean center model was improved to compute the spatial distribution of the mean centers of different potential vegetation ecosystem types in Eurasia during the periods from T0 to T3, which can be formulated as
where represents time; is the number of patches of the potential vegetation type; is the area of the patch in the potential vegetation type; is the total area of the potential vegetation type; are the longitude and latitude coordinates of the geometric center of the patch in the potential vegetation type; and is the mean center coordinate of the potential vegetation type.
To simulate the shift distance and direction of the mean center of different potential vegetation types, a shift trend model of mean center has been developed by extending the mean center model [11,48], which can be expressed as
where and are the coordinates of the mean center of the potential vegetation type in years and , respectively; is the shift distance of the mean center of the potential vegetation type during the period from to ; and is the value of the angle of the shift of the mean center in the potential vegetation type during the period from to . The shift directions were classified into 8 types: due east is , due north is , due west is and due south is . The shift directions are classified into these 8 types, as seen in Table 1, based on the range of values.
3. Results
3.1. Distribution of the Mean Centers of Potential Vegetation Ecosystems
The potential vegetation ecosystems simulation results showed that there were 32 vegetation ecosystem types in Eurasia from 1981 to 2010, as seen in Figure 2. Cold temperate wet forest, cool temperate moist forest and desert were the main vegetation ecosystem types, which covered 14.49%, 11.61% and 10.61% of the total area of Eurasia, respectively. The cold temperate wet forest was mainly distributed in the Central Siberian Plateau, the central part of the West Siberian Plain, and the northern part of the Eastern European Plain; the mean center of all patches of this ecosystem was located in the southeastern part of the West Siberian Plain. The cool temperate moist forest was mainly distributed in the Loess Plateau and Northeast China Plain, the Korean Peninsula, and the southern and western parts of the European Plain; the mean center of all patches of this ecosystem was located in the Turan Plain of Russia. The desert was mainly distributed in the western part of the Mongolian Plateau, the Turan Plain, the Arabian Peninsula and the eastern part of the Iranian Plateau, which include the Gobi Desert, Taklimakan Desert, Karakum Desert, Kyzylkum Desert, Arabian Desert and Thar Desert; the mean center of all patches of this ecosystem was located in the eastern part of the Iranian Plateau. The results indicate that the simulations of the spatial distributions of the potential vegetation types and their mean centers could be effectively used to understand the response of the potential vegetation types to climate change in Eurasia.
3.2. Shift Trends of the Mean Center of Potential Vegetation Types
The simulation results of the mean centers of potential vegetation types show that the mean centers of the subtropical dry forest, warm temperate moist forest, tropical thorn woodland and subtropical wet forest ecosystems would exhibit the largest shift distances of more than 150 km per decade during the period from T0 to T3 under the RCP2.6 scenario, as seen in Table 2, Figure 3. The mean centers of the cool temperate rain forest, tropical very dry forest, tropical thorn woodland, desert. and tropical moist forest ecosystems would shift less than 25 km per decade during these periods under the same scenario. The subtropical thorn woodland, cold temperate moist forest, subpolar/alpine dry tundra, and tropical very dry forest ecosystems would shift 1548 km northwest, 1199 km northeast, 286 km southwest, and 121 km northwest, respectively, during the period from T0 to T3.
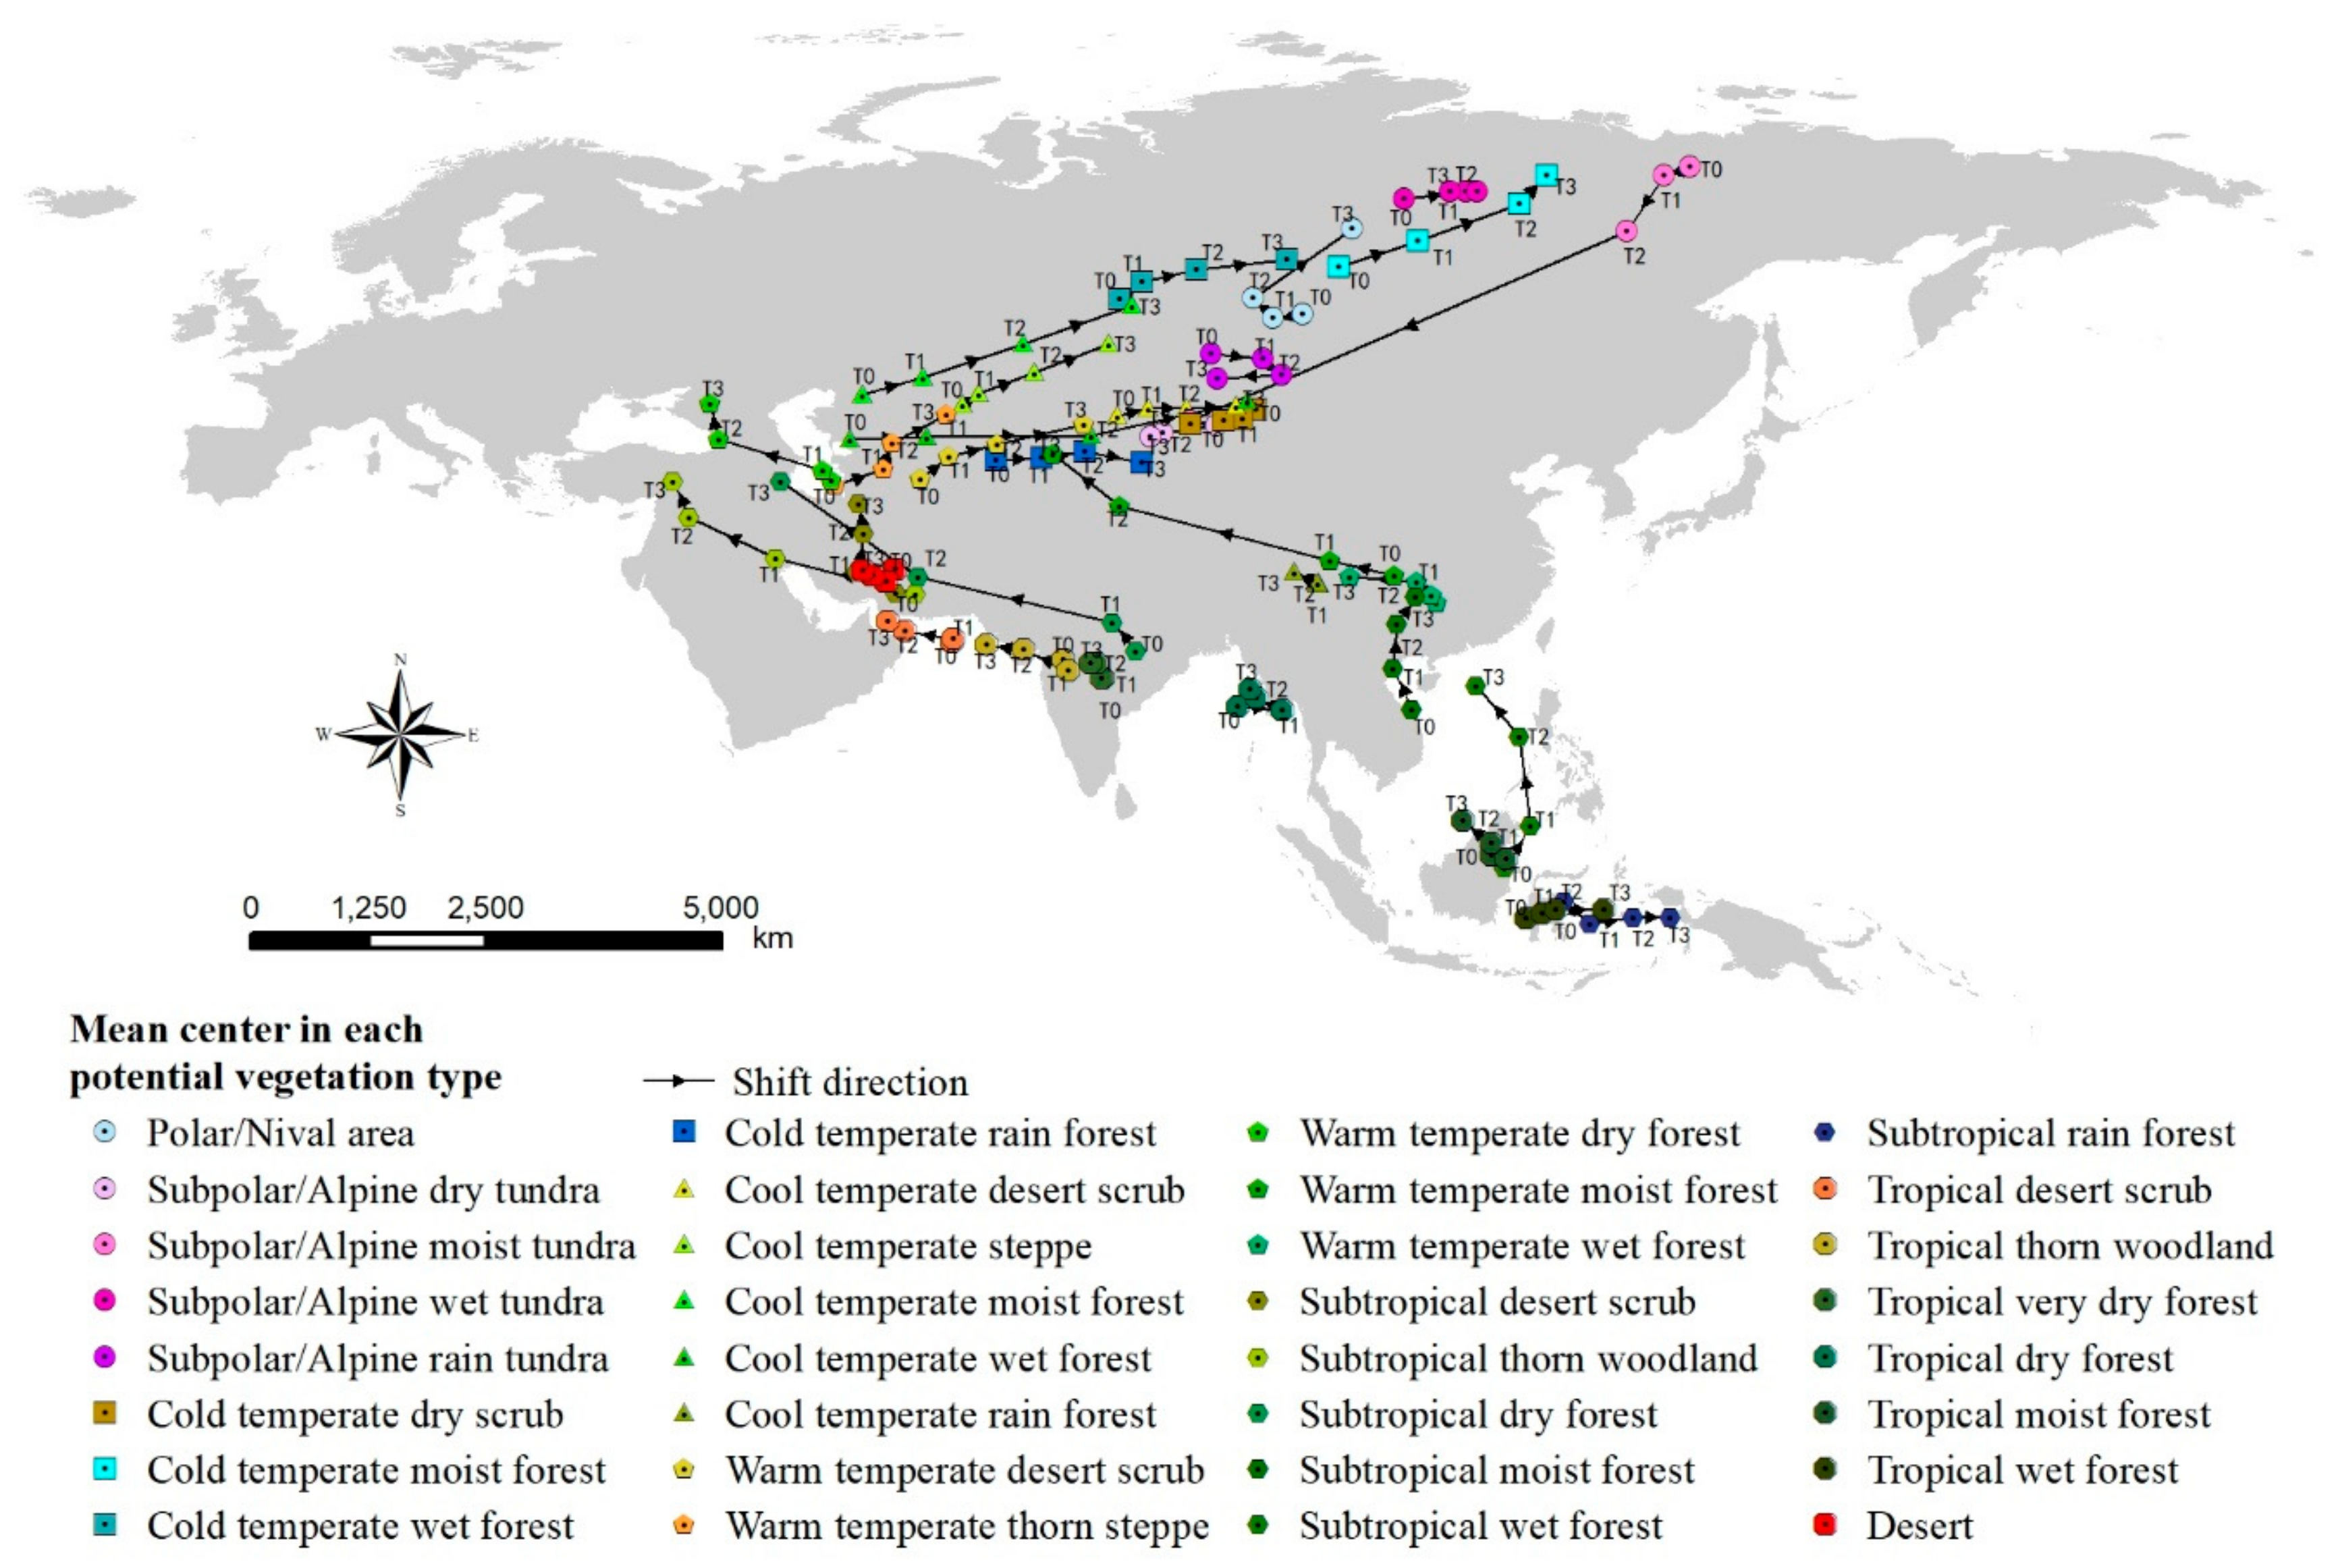
Under the RCP4.5 scenario seen in Table 3, Figure 4, the results show that the shift distances of the mean centers of the subpolar/alpine moist tundra, subtropical dry forest, warm temperate moist forest, cool temperate wet forest, subtropical thorn woodland, cool temperate moist forest, subtropical wet forest, and cold temperate moist forest would be larger than those in other potential vegetation types and would shift more than 200 km per decade on average, while those of the cool temperate rain forest, tropical very dry forest, desert, and tropical thorn woodland would shift less than 29 km per decade during the period from T0 to T3. The cool temperate wet forest, subtropical thorn woodland, cold temperate moist forest, and tropical wet forest ecosystems would continue to shift 1982 km east, 1741 km northwest, 1278 km northeast, and 264 km east, respectively, during the period from T0 to T3.
Under the RCP8.5 scenario seen in Table 4, Figure 5, the results showed that the shift distances of the mean centers of the subpolar/alpine moist tundra, subtropical dry forest, warm temperate moist forest, cool temperate wet forest, subtropical wet forest, subtropical thorn woodland, cool temperate moist forest, cold temperate moist forest, polar/nival area, and subtropical moist forest would be larger than those of other potential vegetation types with a shift distance of more than 200 km per decade on average, while those of the cool temperate rain forest, tropical very dry forest, desert, and cold temperate dry scrub would shift less than 45 km per decade during the period from T0 to T3. The subpolar/alpine moist tundra, cool temperate wet forest, cool temperate moist forest, cold temperate moist forest, and cool temperate desert scrub would continue to shift 3864 km southwest, 2188 km east, 1726 km northeast, 1506 km northeast, and 649 km east, respectively, during the period from T0 to T3.
In general, during the periods from T0 to T3, the mean centers of the subtropical dry forest and warm temperate moist forest ecosystems would show the largest shift distances; the subtropical dry forest would shift 249 km, 243 km, and 302 km per decade on average towards the northwest under the RCP2.6, RCP4.5, and RCP8.5 scenarios, respectively, and the warm temperate moist forest would generally shift 226 km, 223 km, and 254 km per decade towards the northwest under the three scenarios, respectively. These results indicate that the distributions of subtropical dry forest and warm temperate moist forest would be increased in southwest Europe, and decreased in the Indian Peninsula and China. The mean centers of both cool temperate rain forest and tropical very dry forest would generally shift less than 23 km north, which means that their distributions will move north under future climate change.
4. Discussion
The HASM method [11,41,42] was utilized to obtain high-resolution and high-accuracy climate data by interpolating the station observational climate data and downscaling the climate scenario data. The HLZ ecosystem model [9], as a bioclimatic classification scheme [48], has been widely used to simulate the distributions of terrestrial ecosystems [35,36,49], predict land cover change [47], and support land use planning [20,21,22,23,24,25]. In this paper, the HLZ ecosystem model was improved to simulate the distribution of the potential vegetation type. The shift model of mean center [11,37,47] was improved to quantitatively compute the shift distance and direction of the mean center of each potential vegetation type in Eurasia during the period from 1981 to 2100. The mean center of a given potential vegetation type represented the distribution center weighed by the area of that vegetation ecosystem type. Therefore, the shift distance and direction of the mean center of a vegetation ecosystem type could be used to explain the response of the potential vegetation distributions to climate change [37]. Moreover, related studies show that the existing biogeographical model of potential vegetation ecosystems could be used to predict the impacts of future climate change on different vegetation types [50]. A carbon storage/sequestration model of potential vegetation ecosystems could be used to estimate the changes in carbon storage and sequestration potential in response to climate change [51], and a shift model of mean center could be used to predict the shift intensity of the mean centers of different potential vegetation types [52,53,54].
Under future climate change, the subtropical dry forest, warm temperate moist forest and subpolar/alpine moist tundra would be more sensitive to climate change than the other vegetation ecosystem types, which can be identified from existing reports [37,55,56,57]. The amount of polar/nival area will be reduced and replaced by subpolar/alpine tundra between their transition zones [30,55]. Subpolar/alpine moist tundra may be reduced by more than 90% from T0 to T3 [56], which is consistent with the fact that the shift distance of the mean center of subpolar/alpine moist tundra will generally be larger than that of other potential vegetation types. Subpolar/alpine moist tundra would be the most sensitive vegetation type because its area would have the most rapid rate of decrease [56], and its mean center would shift the largest distance towards the southwest, which means that subpolar/alpine moist tundra could be selected as an indicator of climatic change [11,57]. The shift distances of the mean centers of subtropical dry forest and warm temperate moist forest would be the largest of all potential vegetation types and would generally shift to the northwest from T0 to T3, which means that their distributions would increase in Europe under climate change [58].
The distributions of potential vegetation are significantly controlled by changes in climate [59,60], especially changes in temperature [61]. In the three climate change scenarios, RCP8.5 is the scenario with the highest predicted change, RCP4.5 is the intermediate scenario, and RCP2.6 is the scenario with the lowest predicted change [23,39,62]. The results of the simulated shift trends of the mean centers of potential vegetation types were all similar in that the intensity of climate change directly affects the shift distances of the mean centers of the potential vegetation ecosystems. The mean centers of the potential vegetation types under the RCP8.5 scenario would have the largest shift distances and those under the RCP2.6 scenario would have the smallest shift distances. Under the three climate scenarios, the mean centers of the polar/nival area, subpolar/alpine moist tundra, warm temperate dry forest, subtropical moist forest, cool temperate moist forest, cool temperate wet forest, subtropical wet forest, subtropical thorn woodland, warm temperate moist forest, and subtropical dry forest would have larger shifts than those of other potential vegetation types in Eurasia, which means that these potential vegetation types would be more sensitive to climate change than the others. In contrast, the mean centers of the cool temperate rain forest, tropical very dry forest, desert, cold temperate dry scrub, subpolar/alpine dry tundra, tropical wet forest, tropical desert scrub, tropical dry forest, and tropical moist forest would shift less than those of other potential vegetation types in Eurasia, which means that these potential vegetation types would be the least vulnerable to climate change.
With increasing temperature and precipitation, the potential vegetation ecosystem types would generally show conversion from cool-dry to warm-wet and from cool to warm in Eurasia [56]; the distributions showed trends of shifting to higher latitudes and elevations [62,63], especially in the Northern Hemisphere between the latitudes of 35° and 75° [64]. The simulation results of the shift trends of the mean center of the potential vegetation types showed a similar response, in which the polar/nival area would decrease in the southeast part of the north polar area [56], leading to a mean center shift towards the west. The change in the desert distribution would mainly occur around the existing desert areas [56], and its mean center would generally shift less than 35 km per decade to the west. Moreover, the mean centers of the cold temperate moist forest and warm temperate thorn steppe would continuously shift towards the northeast, and the mean center of the cool temperate wet forest would continuously shift towards the east during the period from T0 to T3 under the three scenarios.
In summary, the simulation results of the shift in the mean center of the different potential vegetation ecosystem types could be used to explicitly analyze the responses of different shift trends in vegetation ecosystem types under different climate change scenarios in Eurasia.
5. Conclusions
The simulation results indicated that the distributions of potential vegetation types would shift northward under the three climate change scenarios of RCP2.6, RCP4.5, and RCP8.5 during the periods from 1981 to 2100. Based on the results of the shift trends of the mean center of the potential vegetation types, we recommend that the subpolar/alpine moist tundra, subtropical dry forest, and warm temperate moist forest be selected as indicators of the response of vegetation to climate change because their shift distances are generally larger than other vegetation types. Moreover, understanding the shift trends of the mean center of potential vegetation would be beneficial for researching the future carbon balance of vegetation ecosystems, which could be approved by the data support for planning the sustainable development of the countries in Belt and Road Initiative (BRI) regions.
Author Contributions
Conceptualization, Z.F.; methodology, Z.F.; software, Z.F. and B.F.; validation, Z.F.; formal analysis, Z.F.; investigation, Z.F. and B.F.; resources, Z.F.; data curation, Z.F. and B.F.; writing—original draft preparation, Z.F. and B.F.; writing—review and editing, Z.F.; visualization, Z.F. and B.F.; supervision, Z.F.; project administration, Z.F.; and funding acquisition, Z.F.
Funding
This research was funded by the National Key R&D Program of China (2017YFA0603702 and 2018YFC0507202), the Strategic Priority Research Program (A) of the Chinese Academy of Sciences (XDA20030203), the National Natural Science Foundation (41971358), and the Innovation Project of State Key Laboratory of Resources and Environmental Information System (O88RA600YA).
Conflicts of Interest
The authors declare no conflict of interest.
References
- Ye, D.Z.; Fu, C.B.; Dong, W.J. Progresses and future trends of global change sciences. Adv. Earth Sci. 2002, 17, 467–469. (In Chinese) [Google Scholar]
- Willis, K.J.; Jeffers, E.S.; Tovar, C. What makes a terrestrial ecosystem resilient? Science 2018, 359, 988–989. [Google Scholar] [CrossRef] [PubMed]
- Zhou, G.S.; Zhang, X.S. Feedback of vegetation on climate. Acta Bot. Sin. 1996, 38, 1–7. (In Chinese) [Google Scholar]
- Scholze, M.; Knorr, W.; Arnell, N.W.; Prentice, I.C. A climate-change risk analysis for world ecosystems. Proc. Natl. Acad. Sci. USA 2006, 103, 13116–13120. [Google Scholar] [CrossRef] [PubMed] [Green Version]
- Biermann, F. ‘Earth system governance’ as a crosscutting theme of global change research. Glob. Environ. Chang. 2007, 17, 326–337. [Google Scholar] [CrossRef]
- Nemani, R.R.; Keeling, C.D.; Hashimoto, H.; Jolly, W.M.; Piper, S.C.; Tucker, C.J.; Myneni, R.B.; Running, S.W. Climate-driven increases in global terrestrial net primary production from 1982 to 1999. Science 2003, 300, 1560–1563. [Google Scholar] [CrossRef] [PubMed]
- Schouw, J.F. Grundzuege einer Allgemeinen Pflanzengeographie; Reimer: Berlin, Germany, 1823. [Google Scholar]
- Woodward, F.I. Climate and Plant Distribution; Cambridge University Press: Cambridge, UK, 1987. [Google Scholar]
- Holdridge, L.R. Life Zone Ecology; Tropical Science Center: San José, Costa Rica, 1967. [Google Scholar]
- Yue, T.X.; Liu, J.Y.; Jørgensen, S.E.; Gao, Z.Q.; Zhang, S.H.; Deng, X.Z. Changes of Holdridge life zone diversity in all of China over a half century. Ecol. Model. 2001, 144, 153–162. [Google Scholar] [CrossRef]
- Yue, T.X.; Fan, Z.M.; Chen, C.F.; Sun, X.F.; Li, B.L. Surface modelling of global terrestrial ecosystems under three climate change scenarios. Ecol. Model. 2011, 222, 2342–2361. [Google Scholar] [CrossRef]
- Leemans, R.; Eickhout, B. Another reason for concern: Regional and global impacts on ecosystems for different levels of climate change. Glob. Environ. Chang. 2004, 14, 219–228. [Google Scholar] [CrossRef]
- Li, N.; Xie, G.D.; Zhang, C.S.; Xiao, Y.; Zhang, B.A.; Chen, W.H.; Sun, Y.Z.; Wang, S. Biomass Resources Distribution in the Terrestrial Ecosystem of China. Sustainability 2015, 7, 8548–8564. [Google Scholar] [CrossRef] [Green Version]
- Zhu, Z.C.; Piao, S.L.; Myneni, R.B.; Huang, M.T.; Zeng, Z.Z.; Canadell, J.G.; Ciais, P.; Sitch, S.; Friedlingstein, P.; Arneth, A.; et al. Greening of the Earth and its drivers. Nat. Clim. Chang. 2016, 6, 791–795. [Google Scholar] [CrossRef]
- Stan, K.; Sanchez-Azofeifa, A. Tropical Dry Forest Diversity, Climatic Response, and Resilience in a Changing Climate. Forests 2019, 10, 443. [Google Scholar] [CrossRef]
- Yue, T.X.; Fan, Z.M. A review of responses of typical terrestrial ecosystems to climate change. Chin. Sci. Bull. 2014, 59, 217–231. (In Chinese) [Google Scholar]
- Box, E.O. Predicting Physiognomic Vegetation Types with Climate Variables. Vegetatio 1981, 45, 127–139. [Google Scholar] [CrossRef]
- Neilson, R.P.; King, G.A.; Koerper, G. Toward a Rule-Based Biome Model. Landsc. Ecol. 1992, 7, 27–43. [Google Scholar] [CrossRef]
- Foley, J.A.; Prentice, I.C.; Ramankutty, N.; Levis, S.; Pollard, D.; Sitch, S.; Haxeltine, A. An integrated biosphere model of land surface processes, terrestrial carbon balance, and vegetation dynamics. Global Biogeochem. Cycles 1996, 10, 603–628. [Google Scholar] [CrossRef]
- Post, W.M.; Emanuel, W.R.; Zinke, P.J.; Stangenberger, A.G. Soil carbon pools and world life zones. Nature 1982, 298, 156–159. [Google Scholar] [CrossRef]
- Lugo, A.E.; Brown, S.L.; Dodson, R.; Smith, T.S.; Shugart, H.H. The Holdridge life zones of the conterminous United States in relation to ecosystem mapping. J. Biogeogr. 1999, 26, 1025–1038. [Google Scholar] [CrossRef]
- Fan, Z.M.; Li, J.; Yue, T.X. Land-cover changes of biome transition zones in Loess Plateau of China. Ecol. Model. 2013, 252, 129–140. [Google Scholar] [CrossRef]
- Fan, Z.M.; Li, J.; Yue, T.X.; Zhou, X.; Lan, A.J. Scenarios of land cover in Karst area of Southwestern China. Environ. Earth Sci. 2015, 74, 6407–6420. [Google Scholar] [CrossRef]
- Szelepcsényi, Z.; Breuer, H.; Kis, A.; Pongrácz, R.; Sümegi, P. Assessment of projected climate change in the Carpathian Region using the Holdridge life zone system. Theor. Appl. Climatol. 2018, 131, 593–610. [Google Scholar] [CrossRef]
- Herrick, J.E.; Bestelmeyer, B.T.; Archer, S.; Tugel, A.J.; Brown, J.R. An integrated framework for science-based arid land management. J. Arid Environ. 2006, 65, 319–335. [Google Scholar] [CrossRef]
- Weismiller, R.A.; Kristof, S.J.; Scholz, D.K.; Anuta, P.E.; Momin, S.A. Change Detection in Coastal Zone Environments. Photogramm. Eng. Remote Sens. 1977, 43, 1533–1539. [Google Scholar]
- Belotelov, N.V.; Bogatyrev, B.G.; Kirilenko, A.P.; Venevsky, S.V. Modelling of time-dependent biome shifts under global climate changes. Ecol. Model. 1996, 87, 29–40. [Google Scholar] [CrossRef]
- Walther, G.R.; Post, E.; Convey, P.; Menzel, A.; Parmesan, C.; Beebee, T.J.C.; Fromentin, J.M.; Hoegh-Guldberg, O.; Bairlein, F. Ecological responses to recent climate change. Nature 2002, 416, 389–395. [Google Scholar] [CrossRef] [PubMed]
- Walther, G.R. Community and ecosystem responses to recent climate change. Philos. Trans. R. Soc. B 2010, 365, 2019–2024. [Google Scholar] [CrossRef] [PubMed]
- Nolan, C.; Overpeck, J.T.; Allen, J.R.M.; Anderson, P.M.; Betancourt, J.L.; Binney, H.A.; Brewer, S.; Bush, M.B.; Chase, B.M.; Cheddadi, R.; et al. Past and future global transformation of terrestrial ecosystems under climate change. Science 2018, 361, 920–923. [Google Scholar] [CrossRef] [Green Version]
- Thomas, C.D.; Cameron, A.; Green, R.E.; Bakkenes, M.; Beaumont, L.J.; Collingham, Y.C.; Erasmus, B.F.N.; de Siqueira, M.F.; Grainger, A.; Hannah, L.; et al. Extinction risk from climate change. Nature 2004, 427, 145–148. [Google Scholar] [CrossRef]
- Dury, M.; Mertens, L.; Fayolle, A.; Verbeeck, H.; Hambuckers, A.; Francois, L. Refining Species Traits in a Dynamic Vegetation Model to Project the Impacts of Climate Change on Tropical Trees in Central Africa. Forests 2018, 9, 722. [Google Scholar] [CrossRef]
- Yu, M.; Wang, G.L.; Parr, D.; Ahmed, K.F. Future changes of the terrestrial ecosystem based on a dynamic vegetation model driven with RCP8.5 climate projections from 19 GCMs. Clim. Chang. 2014, 127, 257–271. [Google Scholar] [CrossRef]
- Han, Q.F.; Luo, G.P.; Li, C.F.; Li, S.B. Response of Carbon Dynamics to Climate Change Varied among Different Vegetation Types in Central Asia. Sustainability 2018, 10, 3288. [Google Scholar] [CrossRef]
- Yue, T.X.; Fan, Z.M.; Liu, J.Y. Changes of major terrestrial ecosystems in China since 1960. Glob. Planet. Chang. 2005, 48, 287–302. [Google Scholar] [CrossRef]
- He, Y.B.; Chen, Y.Q.; Tang, H.J.; Yao, Y.M.; Yang, P.; Chen, Z.X. Exploring spatial change and gravity center movement for ecosystem services value using a spatially explicit ecosystem services value index and gravity model. Environ. Monit. Assess. 2011, 175, 563–571. [Google Scholar] [CrossRef] [PubMed]
- Yue, T.X.; Fan, Z.M.; Liu, J.Y.; Wei, B.X. Scenarios of major terrestrial ecosystems in China. Ecol. Model. 2006, 199, 363–376. [Google Scholar] [CrossRef]
- Zhang, G.G.; Kang, Y.M.; Han, G.D.; Sakurai, K. Effect of climate change over the past half century on the distribution, extent and NPP of ecosystems of Inner Mongolia. Glob. Chang. Biol. 2011, 17, 377–389. [Google Scholar] [CrossRef]
- Van Vuuren, D.P.; Edmonds, J.; Kainuma, M.; Riahi, K.; Thomson, A.; Hibbard, K.; Hurtt, G.C.; Kram, T.; Krey, V.; Lamarque, J.F.; et al. The representative concentration pathways: An overview. Clim. Chang. 2011, 109, 5–31. [Google Scholar] [CrossRef]
- Yue, T.X. Surface Modeling: High Accuracy and High Speed Methods; CRC Press: New York, NY, USA, 2011. [Google Scholar]
- Fan, Z.M.; Yue, T.X.; Chen, C.F. Downscaling of global mean annual temperature under different scenarios. Prog. Geogr. 2012, 31, 267–274. (In Chinese) [Google Scholar]
- Yue, T.X.; Zhao, N.; Fan, Z.M.; Li, J.; Chen, C.F.; Lu, Y.M.; Wang, C.L.; Xu, B.; Wilson, J. CMIP5 downscaling and its uncertainty in China. Glob. Planet. Chang. 2016, 146, 30–37. [Google Scholar] [CrossRef]
- Shaw, G.; Wheeler, D. Statistical Techniques in Geographical Analysis; Wiley: Chichester West Sussex, UK; New York, NY, USA, 1985; p. 364. [Google Scholar]
- Hart, J.F. Central Tendency in Areal Distributions. Econo. Geogr. 1954, 30, 48–59. [Google Scholar] [CrossRef]
- Warntz, W.; Neft, D. Contributions to a statistical methodology for areal distributions. J. Reg. Sci. 1960, 2, 47–66. [Google Scholar] [CrossRef]
- Ebdon, D. Statistics in Geography: A Practical Approach; B. Blackwell: Oxford, UK, 1977; p. 195. [Google Scholar]
- Yue, T.X.; Fan, Z.M.; Liu, J.Y. Scenarios of Land cover in China. Glob. Planet. Chang. 2007, 55, 317–342. [Google Scholar] [CrossRef]
- Solomon, A.M.; Shugart, H. Vegetation Dynamics & Global Change; Springer Science & Business Media: Charlottesville, VA, USA, 1993. [Google Scholar]
- Chen, X.W.; Zhang, X.S.; Li, B.L. The possible response of life zones in China under global climate change. Glob. Planet. Chang. 2003, 38, 327–337. [Google Scholar] [CrossRef]
- Hickler, T.; Vohland, K.; Feehan, J.; Miller, P.A.; Smith, B.; Costa, L.; Giesecke, T.; Fronzek, S.; Carter, T.R.; Cramer, W.; et al. Projecting the future distribution of European potential natural vegetation zones with a generalized, tree species-based dynamic vegetation model. Glob. Ecol. Biogeogr. 2012, 21, 50–63. [Google Scholar] [CrossRef]
- Hui, D.; Deng, Q.; Tian, H.; Luo, Y. Climate Change and Carbon Sequestration in Forest Ecosystems. In Handbook of Climate Change Mitigation and Adaptation; Springer: Cham, Germany, 2017; pp. 555–594. [Google Scholar]
- Mayle, F.E.; Langstroth, R.P.; Fisher, R.A.; Mair, P. Long term savannah dynamics in the Bolivian Amazon: Implications for conservation. Philos. Trans. R. Soc. B 2007, 367, 291–307. [Google Scholar] [CrossRef] [PubMed]
- Xu, H.J.; Wang, X.P.; Yang, T.B. Trend shifts in satellite-derived vegetation growth in Central Eurasia, 1982–2013. Sci. Total Environ. 2017, 579, 1658–1674. [Google Scholar] [CrossRef] [PubMed]
- Feng, S.; Hu, Q.; Huang, W.; Ho, C.H.; Li, R.P.; Tang, Z.H. Projected climate regime shift under future global warming from multi-model, multi-scenario CMIP5 simulations. Glob. Planet. Chang. 2014, 112, 41–52. [Google Scholar] [CrossRef]
- Faour, G.; Mhawej, M.; Nasrallah, A. Global trends analysis of the main vegetation types throughout the past four decades. Appl. Geogr. 2018, 97, 184–195. [Google Scholar] [CrossRef]
- Fan, Z.M.; Fan, B.; Yue, T.X. Terrestrial ecosystem scenarios and their response to climate change in Eurasia. Sci. China Earth Sci. 2019, 62, 1–12. [Google Scholar] [CrossRef]
- Dyderski, M.K.; Paz, S.; Frelich, L.E.; Jagodzinski, A.M. How much does climate change threaten European forest tree species distributions? Glob. Chang. Biol. 2018, 24, 1150–1163. [Google Scholar] [CrossRef]
- Machar, I.; Vlckova, V.; Bucek, A.; Vozenilek, V.; Salek, L.; Jerabkova, L. Modelling of Climate Conditions in Forest Vegetation Zones as a Support Tool for Forest Management Strategy in European Beech Dominated Forests. Forests 2017, 8, 82. [Google Scholar] [CrossRef]
- Miao, L.J.; Liu, Q.; Fraser, R.; He, B.; Cui, X.F. Shifts in vegetation growth in response to multiple factors on the Mongolian Plateau from 1982 to 2011. Phys. Chem. Earth 2015, 87, 50–59. [Google Scholar] [CrossRef]
- Zhou, R.W.; Li, W.J.; Zhang, Y.P.; Peng, M.C.; Wang, C.Y.; Sha, L.Q.; Liu, Y.T.; Song, Q.H.; Fei, X.H.; Jin, Y.Q.; et al. Responses of the Carbon Storage and Sequestration Potential of Forest Vegetation to Temperature Increases in Yunnan Province, SW China. Forests 2018, 9, 227. [Google Scholar] [CrossRef]
- Weng, E.; Zhou, G. Modeling distribution changes of vegetation in China under future climate change. Environ. Model. Assess. 2006, 11, 45–58. [Google Scholar] [CrossRef]
- Yue, T.X.; Zhao, N.; Fan, Z.M.; Li, J.; Chen, C.F.; Lu, Y.M.; Wang, C.L.; Gao, J.; Xu, B.; Jiao, Y.M.; et al. Methods for simulating climate scenarios with improved spatiotemporal specificity and less uncertainty. Glob. Planet. Chang. 2019, 181, 102973. [Google Scholar] [CrossRef]
- Watson, R.T.; Zinyowera, M.C.; Moss, R.H. Climate Change 1995 Impacts, Adaptations and Mitigation of Climate Change: Scientific-Technical Analysis; Cambridge University Press: Cambridge, UK, 1996. [Google Scholar]
- Beck, H.E.; McVicar, T.R.; van Dijk, A.I.J.M.; Schellekens, J.; de Jeu, R.A.M.; Bruijnzeel, L.A. Global evaluation of four AVHRR–NDVI data sets: Intercomparison and assessment against Landsat imagery. Remote Sens. Environ. 2011, 115, 2547–2563. [Google Scholar] [CrossRef]
Figure 1.
Digital Elevation Model (DEM) data and 1360 weather stations in Eurasia.

Figure 2.
Distribution of the mean centers of potential vegetation ecosystems in Eurasia in the T0 period.
Figure 2.
Distribution of the mean centers of potential vegetation ecosystems in Eurasia in the T0 period.

Figure 3.
Shift trends of the mean centers of each potential vegetation type under the RCP2.6 scenario in Eurasia.
Figure 3.
Shift trends of the mean centers of each potential vegetation type under the RCP2.6 scenario in Eurasia.

Figure 4.
Shift trends of the mean centers of each potential vegetation type under the RCP4.5 scenario in Eurasia.
Figure 4.
Shift trends of the mean centers of each potential vegetation type under the RCP4.5 scenario in Eurasia.
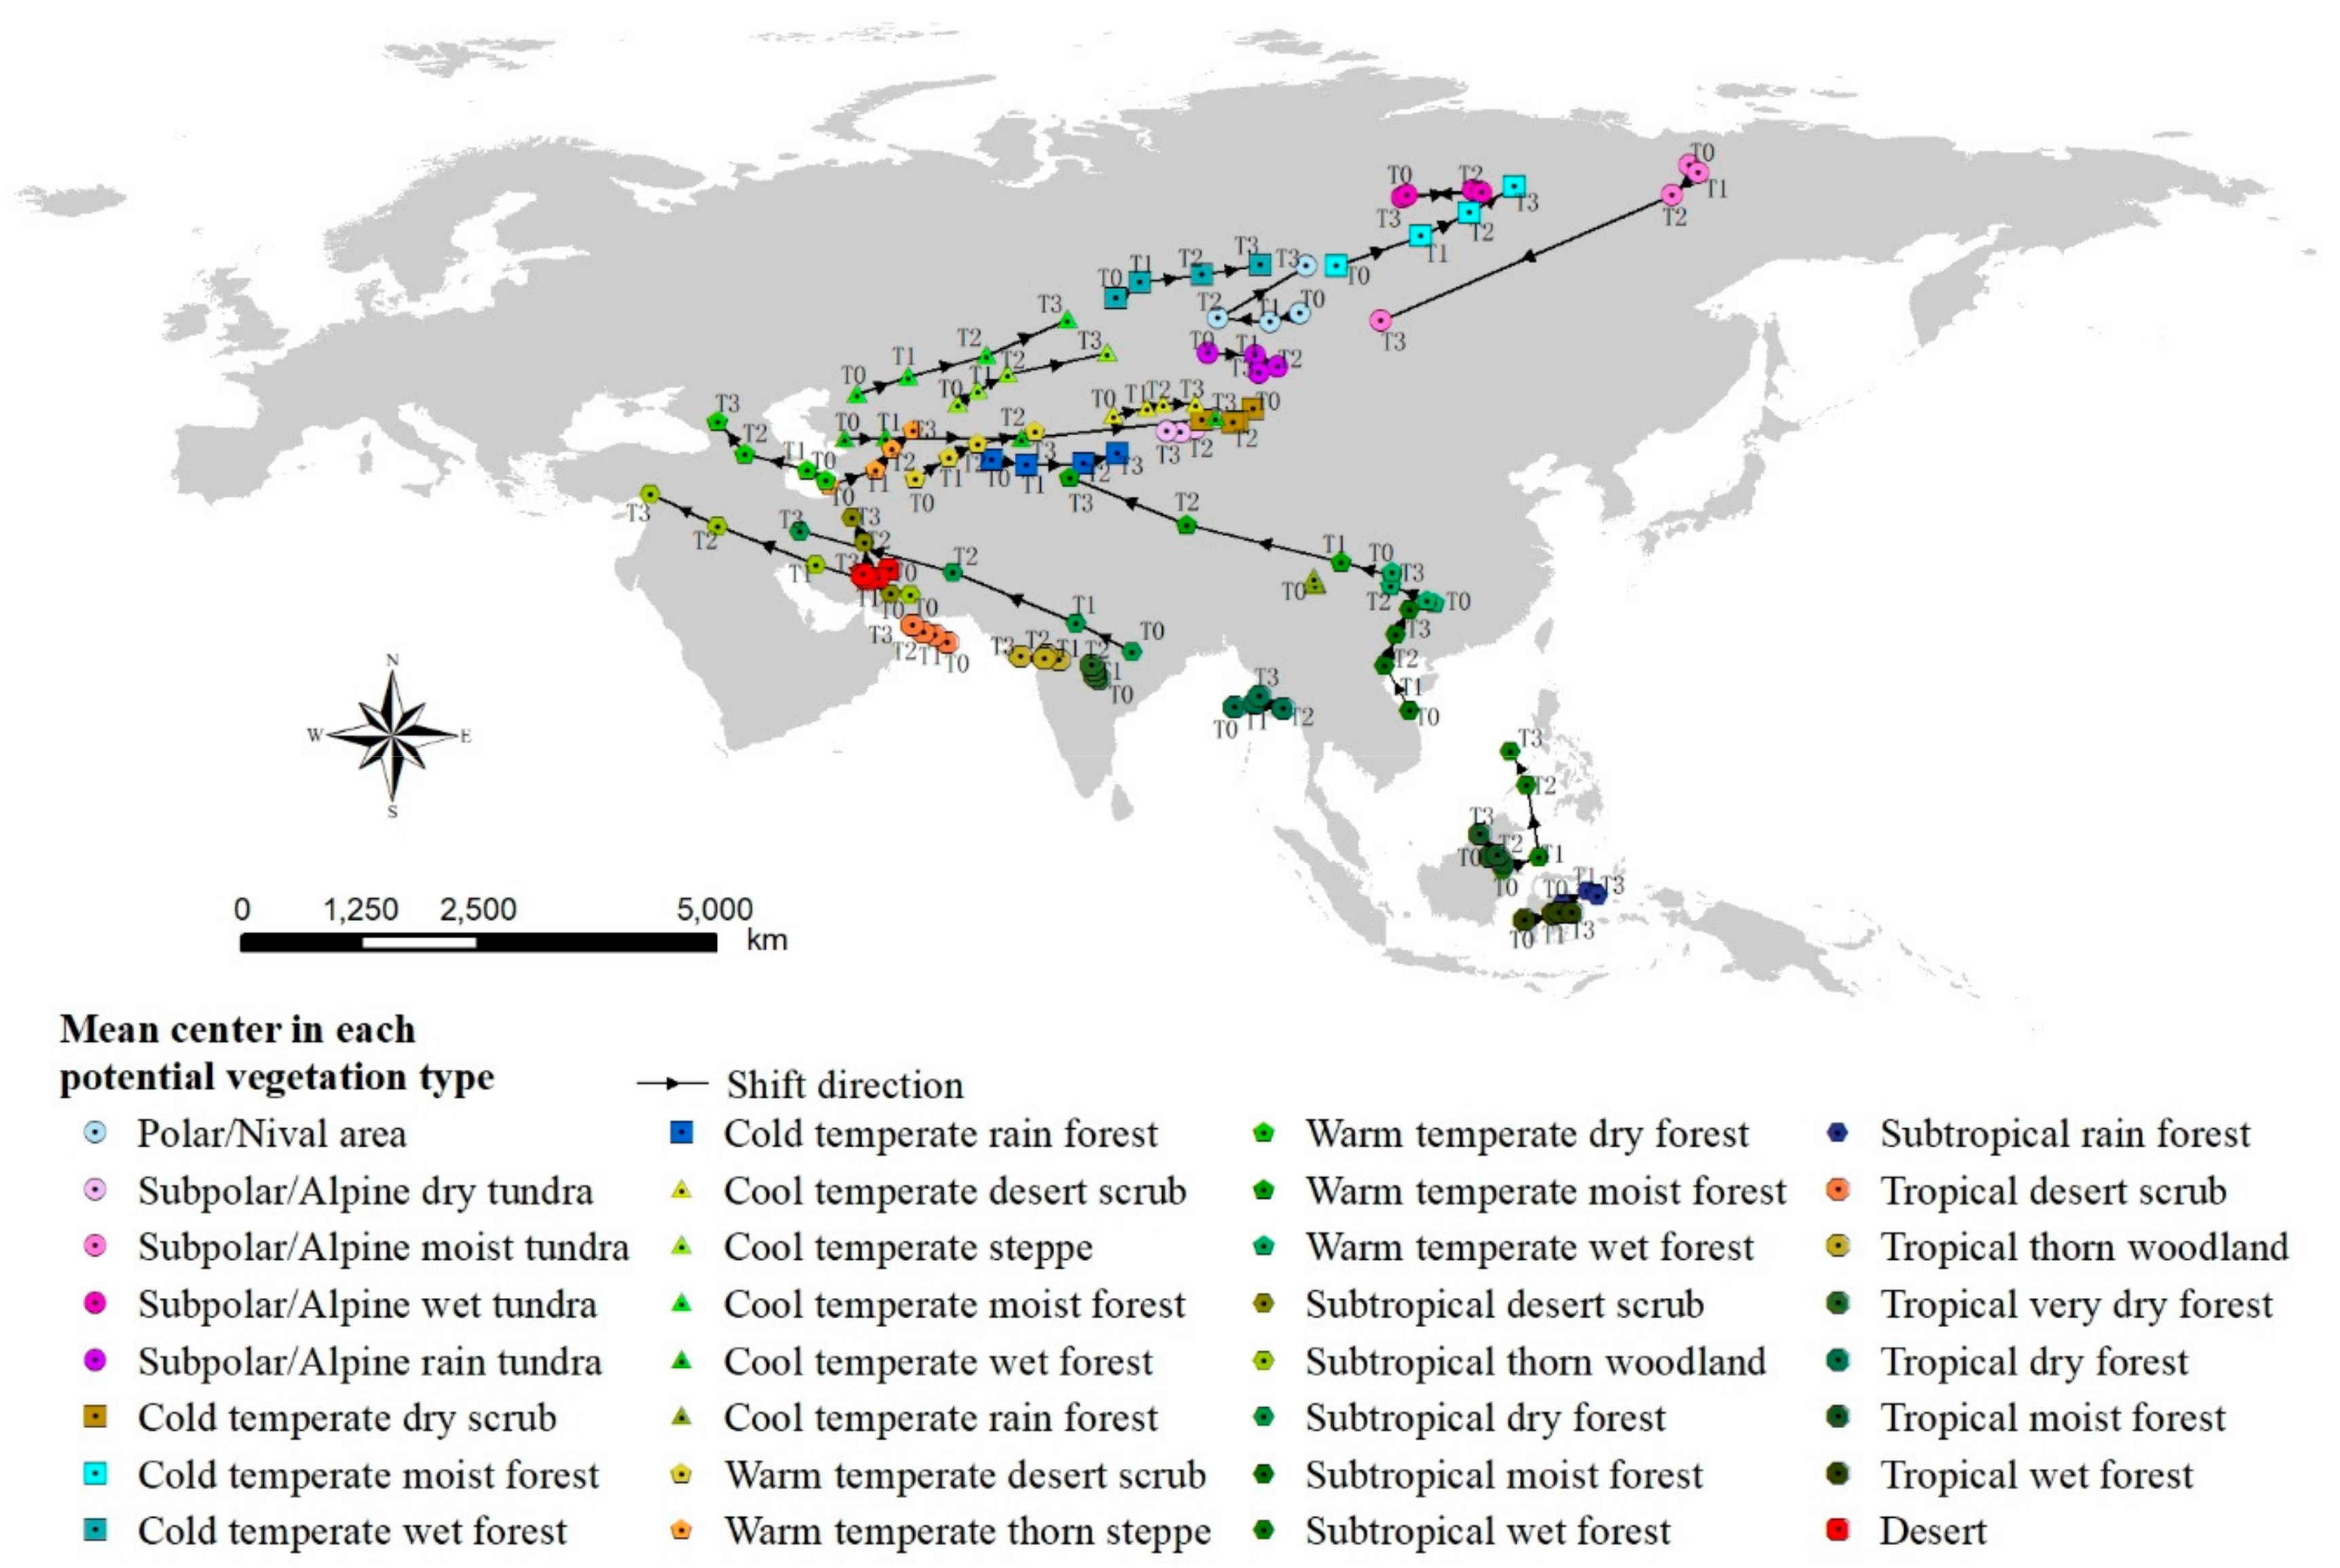
Figure 5.
Shift trends of the mean centers of each potential vegetation type under the RCP8.5 scenario in Eurasia.
Figure 5.
Shift trends of the mean centers of each potential vegetation type under the RCP8.5 scenario in Eurasia.

Table 1.
The definition of the shift direction of the mean center in the potential vegetation ecosystem.
Table 1.
The definition of the shift direction of the mean center in the potential vegetation ecosystem.
| Sketch Map of the Shift Directions | Value | Shift Direction |
|---|---|---|
 | East | |
| Northeast | ||
| North | ||
| Northwest | ||
| West | ||
| Southwest | ||
| South | ||
| Southeast |
Table 2.
Shift distances (km) and directions of the mean center of each potential vegetation type under the RCP2.6 scenario in Eurasia.
Table 2.
Shift distances (km) and directions of the mean center of each potential vegetation type under the RCP2.6 scenario in Eurasia.
| Type | T0–T1 | T1–T2 | T2–T3 | |||
|---|---|---|---|---|---|---|
| Shift Distance | Shift Direction | Shift Distance | Shift Direction | Shift Distance | Shift Direction | |
| Polar/Nival area | 198 | West | 239 | West | 261 | East |
| Subpolar/Alpine dry tundra | 41 | Southwest | 185 | Southwest | 60 | Southwest |
| Subpolar/Alpine moist tundra | 80 | South | 218 | Southwest | 454 | Southwest |
| Subpolar/Alpine wet tundra | 425 | East | 95 | Northwest | 156 | West |
| Subpolar/Alpine rain tundra | 158 | East | 201 | East | 193 | Southwest |
| Cold temperate dry scrub | 115 | Southwest | 27 | Southwest | 100 | Northwest |
| Cold temperate moist forest | 511 | Northeast | 272 | Northeast | 416 | Northeast |
| Cold temperate wet forest | 265 | Northeast | 234 | East | 161 | Northeast |
| Cold temperate rain forest | 212 | East | 204 | East | 99 | Southeast |
| Cool temperate desert scrub | 114 | Northeast | 91 | East | 77 | Northeast |
| Cool temperate steppe | 155 | Northeast | 176 | Northeast | 162 | Northeast |
| Cool temperate moist forest | 515 | East | 298 | Northeast | 292 | Northeast |
| Cool temperate wet forest | 239 | East | 286 | East | 389 | East |
| Cool temperate rain forest | 6 | Southwest | 8 | Northeast | 17 | Northwest |
| Warm temperate desert scrub | 195 | Northeast | 172 | Northeast | 155 | Northeast |
| Warm temperate thorn steppe | 276 | Northeast | 175 | Northeast | 154 | Northeast |
| Warm temperate dry forest | 309 | Northwest | 198 | Northwest | 250 | East |
| Warm temperate moist forest | 451 | Northwest | 647 | West | 934 | West |
| Warm temperate wet forest | 177 | Northwest | 107 | Northwest | 185 | West |
| Subtropical desert scrub | 282 | Northwest | 218 | North | 166 | North |
| Subtropical thorn woodland | 843 | Northwest | 496 | Northwest | 209 | Northwest |
| Subtropical dry forest | 755 | Northwest | 639 | Northwest | 847 | West |
| Subtropical moist forest | 597 | Northwest | 271 | North | 165 | Northeast |
| Subtropical wet forest | 524 | Northeast | 475 | Northwest | 548 | Northwest |
| Subtropical rain forest | 116 | Northeast | 127 | East | 0 | East |
| Tropical desert scrub | 63 | North | 55 | North | 109 | West |
| Tropical thorn woodland | 52 | Northwest | 40 | Southwest | 78 | West |
| Tropical very dry forest | 35 | Northwest | 46 | Northwest | 40 | Northwest |
| Tropical dry forest | 239 | East | 58 | North | 32 | Northwest |
| Tropical moist forest | 62 | East | 25 | Northeast | 130 | Northwest |
| Tropical wet forest | 93 | Northeast | 71 | East | 78 | East |
| Desert | 64 | West | 118 | Southwest | 32 | West |
Table 3.
Shift distances (km) and directions of the mean centers of each potential vegetation type under the RCP4.5 scenario in Eurasia.
Table 3.
Shift distances (km) and directions of the mean centers of each potential vegetation type under the RCP4.5 scenario in Eurasia.
| Type | T0–T1 | T1–T2 | T2–T3 | |||
|---|---|---|---|---|---|---|
| Shift Distance | Shift Direction | Shift Distance | Shift Direction | Shift Distance | Shift Direction | |
| Polar/Nival area | 178 | West | 283 | West | 720 | Northeast |
| Subpolar/Alpine dry tundra | 142 | Southwest | 92 | Southwest | 74 | West |
| Subpolar/Alpine moist tundra | 94 | Southeast | 270 | Southwest | 2031 | Southwest |
| Subpolar/Alpine wet tundra | 388 | East | 53 | Southeast | 394 | West |
| Subpolar/Alpine rain tundra | 255 | East | 166 | Southeast | 119 | Southwest |
| Cold temperate dry scrub | 147 | Southwest | 30 | West | 167 | West |
| Cold temperate moist forest | 549 | Northeast | 358 | Northeast | 370 | Northeast |
| Cold temperate wet forest | 217 | Northeast | 340 | East | 322 | East |
| Cold temperate rain forest | 190 | East | 301 | East | 209 | Northeast |
| Cool temperate desert scrub | 191 | East | 101 | Northeast | 172 | East |
| Cool temperate steppe | 186 | Northeast | 231 | Northeast | 567 | East |
| Cool temperate moist forest | 328 | Northeast | 469 | East | 574 | Northeast |
| Cool temperate wet forest | 215 | East | 717 | East | 1050 | East |
| Cool temperate rain forest | 17 | Southwest | 4 | North | 70 | North |
| Warm temperate desert scrub | 285 | Northeast | 211 | Northeast | 330 | East |
| Warm temperate thorn steppe | 295 | Northeast | 235 | Northeast | 229 | Northeast |
| Warm temperate dry forest | 141 | Northwest | 375 | West | 363 | Northwest |
| Warm temperate moist forest | 307 | Northwest | 912 | West | 789 | Northwest |
| Warm temperate wet forest | 47 | Northwest | 244 | Northwest | 147 | North |
| Subtropical desert scrub | 243 | Northwest | 327 | North | 270 | Northwest |
| Subtropical thorn woodland | 595 | Northwest | 654 | Northwest | 492 | Northwest |
| Subtropical dry forest | 423 | Northwest | 840 | Northwest | 921 | West |
| Subtropical moist forest | 488 | Northwest | 336 | Northeast | 274 | Northeast |
| Subtropical wet forest | 235 | Northeast | 765 | North | 368 | Northwest |
| Subtropical rain forest | 190 | Northeast | 52 | Southeast | 21 | Southeast |
| Tropical desert scrub | 105 | Northwest | 63 | West | 102 | Northwest |
| Tropical thorn woodland | 85 | Northwest | 38 | Southwest | 129 | West |
| Tropical very dry forest | 40 | Northwest | 57 | North | 52 | Northwest |
| Tropical dry forest | 108 | East | 162 | East | 185 | Northwest |
| Tropical moist forest | 95 | Southeast | 83 | Northwest | 238 | Northwest |
| Tropical wet forest | 167 | East | 34 | East | 63 | East |
| Desert | 114 | Southwest | 56 | West | 61 | Northwest |
Table 4.
Shift distances (km) and directions of the mean centers of each potential vegetation type under the RCP8.5 scenario in Eurasia.
Table 4.
Shift distances (km) and directions of the mean centers of each potential vegetation type under the RCP8.5 scenario in Eurasia.
| Type | T0–T1 | T1–T2 | T2–T3 | |||
|---|---|---|---|---|---|---|
| Shift Distance | Shift Direction | Shift Distance | Shift Direction | Shift Distance | Shift Direction | |
| Polar/Nival area | 162 | West | 236 | Northwest | 908 | Northeast |
| Subpolar/Alpine dry tundra | 61 | South | 298 | West | 72 | West |
| Subpolar/Alpine moist tundra | 165 | Southwest | 627 | Southwest | 3072 | Southwest |
| Subpolar/Alpine wet tundra | 339 | East | 59 | East | 140 | West |
| Subpolar/Alpine rain tundra | 285 | East | 195 | Southeast | 343 | West |
| Cold temperate dry scrub | 118 | Southwest | 99 | West | 183 | West |
| Cold temperate moist forest | 509 | Northeast | 668 | Northeast | 329 | Northeast |
| Cold temperate wet forest | 219 | Northeast | 319 | East | 490 | East |
| Cold temperate rain forest | 248 | East | 236 | East | 328 | East |
| Cool temperate desert scrub | 181 | East | 202 | East | 265 | East |
| Cool temperate steppe | 149 | Northeast | 366 | Northeast | 498 | Northeast |
| Cool temperate moist forest | 378 | Northeast | 635 | Northeast | 713 | Northeast |
| Cool temperate wet forest | 404 | East | 879 | East | 905 | East |
| Cool temperate rain forest | 12 | Southwest | 15 | North | 168 | Northwest |
| Warm temperate desert scrub | 284 | Northeast | 286 | East | 508 | East |
| Warm temperate thorn steppe | 310 | Northeast | 274 | Northeast | 419 | Northeast |
| Warm temperate dry forest | 112 | Northwest | 642 | Northwest | 387 | North |
| Warm temperate moist forest | 377 | West | 1263 | West | 648 | Northwest |
| Warm temperate wet forest | 77 | Northwest | 170 | Northwest | 360 | West |
| Subtropical desert scrub | 304 | Northwest | 416 | North | 313 | North |
| Subtropical thorn woodland | 834 | West | 634 | Northwest | 392 | Northwest |
| Subtropical dry forest | 327 | Northwest | 1137 | West | 1250 | Northwest |
| Subtropical moist forest | 446 | Northwest | 468 | North | 305 | Northeast |
| Subtropical wet forest | 473 | Northeast | 940 | North | 593 | Northwest |
| Subtropical rain forest | 274 | Southeast | 242 | East | 198 | East |
| Tropical desert scrub | 33 | Northeast | 275 | West | 137 | Northwest |
| Tropical thorn woodland | 122 | Southeast | 327 | Northwest | 201 | West |
| Tropical very dry forest | 9 | Northwest | 161 | Northwest | 29 | West |
| Tropical dry forest | 242 | East | 195 | Northwest | 95 | Northwest |
| Tropical moist forest | 86 | East | 183 | Northwest | 285 | Northwest |
| Tropical wet forest | 95 | Northeast | 87 | Northeast | 258 | East |
| Desert | 137 | Southwest | 96 | Northwest | 72 | Northwest |
© 2019 by the authors. Licensee MDPI, Basel, Switzerland. This article is an open access article distributed under the terms and conditions of the Creative Commons Attribution (CC BY) license (http://creativecommons.org/licenses/by/4.0/).
Share and Cite
MDPI and ACS Style
Fan, Z.; Fan, B. Shifts of the Mean Centers of Potential Vegetation Ecosystems under Future Climate Change in Eurasia. Forests 2019, 10, 873. https://doi.org/10.3390/f10100873
AMA Style
Fan Z, Fan B. Shifts of the Mean Centers of Potential Vegetation Ecosystems under Future Climate Change in Eurasia. Forests. 2019; 10(10):873. https://doi.org/10.3390/f10100873
Chicago/Turabian StyleFan, Zemeng, and Bin Fan. 2019. "Shifts of the Mean Centers of Potential Vegetation Ecosystems under Future Climate Change in Eurasia" Forests 10, no. 10: 873. https://doi.org/10.3390/f10100873
Note that from the first issue of 2016, this journal uses article numbers instead of page numbers. See further details here.