Article

Ectomycorrhizal Colonisation in Declining Oak Stands on the Krotoszyn Plateau, Poland

by
Roman Mariusz Bzdyk
1,
Jacek Olchowik
2,*,
Marcin Studnicki
3,
Justyna Anna Nowakowska
4,
Tomasz Oszako
5,
Alexander Urban
6 and
Dorota Hilszczańska
1
1
Department of Forest Ecology, Forest Research Institute, Braci Leśnej 3, 05-090 Sękocin Stary, Poland
2
Department of Plant Pathology, Faculty of Horticulture, Biotechnology and Landscape Architecture, Warsaw University of Life Sciences, Nowoursynowska 159, 02-776 Warsaw, Poland
3
Department of Experimental Design and Bioinformatics, Faculty of Agriculture and Biology, Warsaw University of Life Sciences, Nowoursynowska 159, 02-776 Warsaw, Poland
4
Faculty of Biology and Environmental Sciences, Cardinal Stefan Wyszynski University in Warsaw, Wóycickiego 1/3, 01-938 Warsaw, Poland
5
Department of Forest Protection, Forest Research Institute, Braci Leśnej 3, 05-090 Sękocin Stary, Poland
6
Department of Botany and Biodiversity Research, Faculty of Life Sciences, University of Vienna, Rennweg 14, Wien A-1030, Austria
*
Author to whom correspondence should be addressed.
Forests 2019, 10(1), 30; https://doi.org/10.3390/f10010030
Submission received: 5 December 2018 / Revised: 22 December 2018 / Accepted: 31 December 2018 / Published: 4 January 2019
(This article belongs to the Special Issue Forest Biodiversity under the Changing Land Use and Climate)

Abstract

:
We describe the ectomycorrhizal (ECM) root tips and the diversity of mycorrhizal fungal species at three English oak (Quercus robur) sites (two 120 year old sites and one 60 year old site). The three oak stands in decline, located in western Poland, were characterized by a low degree of vital ECM colonization: 30.2%, 29.1% and 25.6% at Krotoszyn (K), Piaski (P) and Karczma Borowa (KB), respectively. DNA (ITS) barcoding revealed a total of 18 ECM fungal species. Based on exploration types, ectomycorrhizae were classified with respect to ecologically relevant features. The contact type was significantly correlated with C:N and Corg, while the short distance type was correlated with Ca, phosphorus (P2O5) and pH. The medium distance exploration type was significantly correlated with fine-grained soil particle size fractions: coarse silt (0.05–0.02 mm) and fine silt (0.02–0.002 mm), and clay (<0.002 mm). The long distance type showed a similar pattern to the medium distance smooth type, but was also correlated with nitrate (N). The values of biometric root parameters of oak trees at the analysed forest sites were arranged as follows: K > P > KB, and were opposite to the condition of the tree crowns. A negative correlation of vital ECM root tip abundance with the crown health status of oaks was observed, whereas higher ECM diversity reflected better crown health in the oak stands studied.

1. Introduction

Pedunculate oak (Quercus robur L.) is a widely distributed tree in Europe, occurring from northern Spain to southern Scandinavia and from Ireland to Eastern Europe, and is among the deciduous tree species with the highest economic importance [1,2]. Oak stands grow particularly frequently on nutrient rich loam or clay soils with temporary waterlogging [3]. With respect to growth and survival, Q. robur is assessed as waterlogging-tolerant, and can grow even in floodplain forests [4]. This species is adapted to an Atlantic, sub-Mediterranean climate with mild winters, and grows well under oceanic and continental climate conditions [5].
Q. robur showing symptoms of decline or similar symptoms were first reported in Germany in 1918 [6]. Crown damage and mortality of oaks are markedly higher in older stands [7]. Field measurements and observations over a four year period in 52 areas representative of Polish oak forests showed that the health of trees in a majority of stands is declining [8]. The wide range of symptoms associated with the decline and dieback of Q. robur include leaf discoloration, followed by wilting and defoliation; cracking of stems and associated bleeding; inner bark necrosis (lesions), often indicating trunk colonization by Agrilus biguttatus Fabricius and callus repair [9]. The oak decline syndrome is deemed to have a complex aetiology, involving dynamic interactions between trees (e.g., strong competition) along with abiotic and biotic factors [10]. Moreover, this phenomenon is believed to be a consequence of predisposing factors, including soil features (such as poor fertility, drainage, moisture holding capacity or compaction) and the role of the rhizosphere microbiota [9].
It has been suggested that differences in above-ground tree health are often reflected below-ground, in particular in the vitality and the mycorrhizal status of the root systems of trees [11,12,13,14]. Ectomycorrhizal (ECM) community structure is influenced by a range of biotic and abiotic factors, including host specificity, tree density, organic matter heterogeneity, soil type, natural nutrient gradients and plant parasite effects on mycorrhizal diversity [15,16,17,18,19,20,21]. The reduction of a tree’s photosynthetic capacity is presumed to subsequently reduce the diversity of ECM species producing sporocarps [22,23]. For example, Corcobado et al. [24] found that root vitality and ECM abundance were higher in non-declining trees than in declining ones.
The numbers and morphotypes of ectomycorrhizae give useful information when related to root biomass, root length and soil volume. However, the health status of tree is also shaped by differentiation of the extrametrical mycelium and exploration type (contact, short-distance, medium-distance smooth, long-distance) of ECM rhizomorphs [25]. These features are relevant to the ecological classification of ectomycorrhizae.
In order to address the current lack of knowledge concerning the functional role of ECM community in declining oak stands, the primary aim of this study was to relate ECM colonization and ecologically relevant features of ECM species (based on exploration types, each of which represent a distinct foraging strategy) [25] to soil chemistry (pH, organic carbon and nitrogen content, etc.) at three declining oak stands. It was hypothesized that stands showing lower degree of foliage damage would be characterized by a greater degree of mycorrhizal colonization, and higher mycorrhizal diversity.

2. Materials and Methods

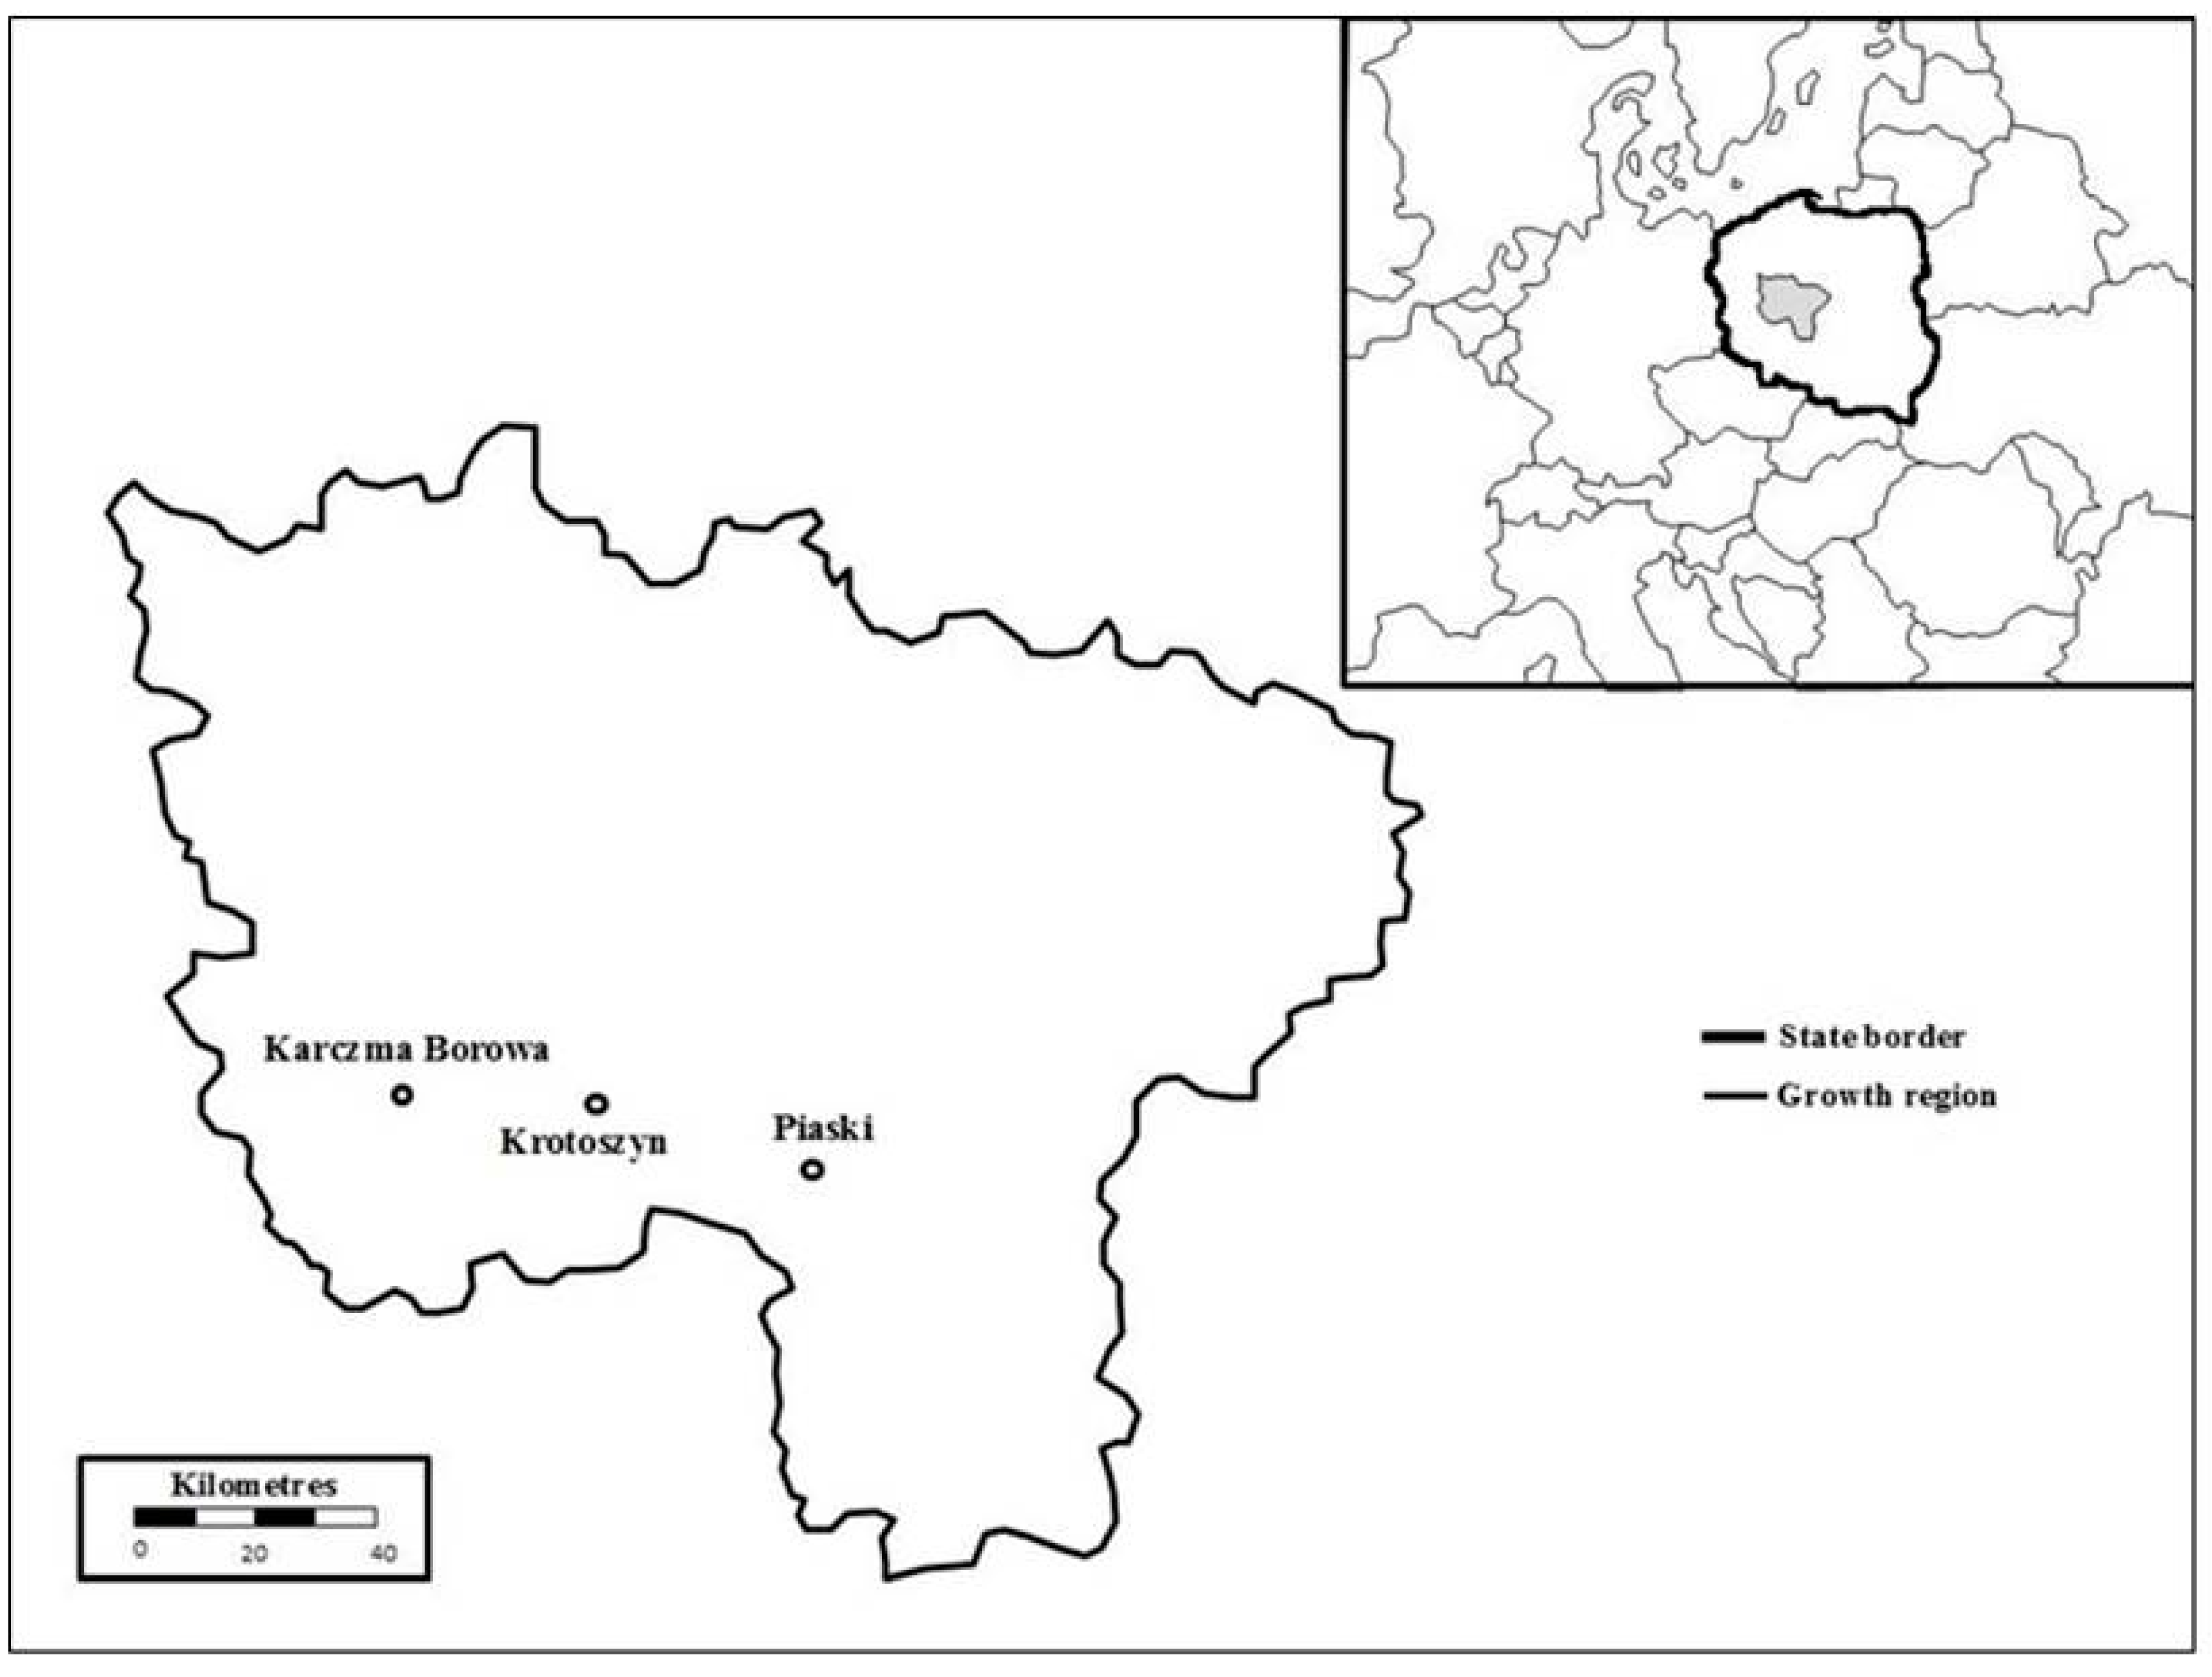
2.1. Site Characteristics

The study was conducted in three oak forest stands on the border of the Krotoszyński and Ostrów counties in the western part of Poland (Krotoszyn Plateau) (51°41′42″ N, 17°27′14″ E, Figure 1)—Karczma Borowa (KB), Krotoszyn (K) and Piaski (P). A large part of the Krotoszyn Plateau is covered by a complex of oak forests. Climate data for each stand were obtained from the nearest meteorological station (Leszno). Annual precipitation, mean annual temperature and additional site characteristics are provided in Table 1.

2.2. Study Design and Sampling Scheme

Two line transects (30 trees per transect) were laid out at each site (2 transects × 3 sites: KB, K and P = 6 line transects). A total of 180 oaks trees were investigated (60 per site). At site KB, the trees growing on each side of the axis of the transect line were selected alternately, in a manner so that the distances between the selected trees were not less than twice the diameter of their crowns. This procedure eliminated trees growing directly adjacent to one another, while providing representative sampling for the entire study area. The length of one line of trees was limited by the need to obtain a representative sample of 30 trees. The transects at site KB were established with an east–west orientation. At site K, the transects were set up using the same method as described above. Due to the much higher density of trees at site P compared with the older stands at sites KB and K, it was sufficient to establish site lines of 50 acres within the plot in an area of ca. 160 × 40 metres, in order to obtain a sample of 60 trees that met the above criteria. The transects at sites K and P were established with a north–south orientation. Most of the trees in the three study areas showed symptoms of decline (leaf discoloration and wilting, defoliation, branch die-back and trunk exudations).
Separate soil samples for soil analyses and mycorrhizal assessment were collected at the three sites (KB, K and P) at the end of September 2013, at distances of 0.5–1 m from selected oak trees. Two soil subsamples were taken from each of 180 trees, one sample from the northern and one from the southern side of the tree bases (each sample consisted of 2 microsite localities: north and south). A total of 360 soil subsamples (120 per site) were collected for soil analysis and mycorrhizal assessment (60 trees × 3 sites × 2 microsite (north and south) = 360 subsamples). These two subsamples for mycorrhizal and soil analysis were combined (pooled) into a single sample for each tree (180 pooled soil samples in total, 60 per site). Samples were taken with a spade in the form of approximate cubic soil-root monoliths of about 25 × 25 × 25 cm, sealed in plastic bags, labelled and transferred to the soil lab of the Forest Research Institute in Warsaw. The soil-root samples were stored at −20 °C for a maximum of four weeks before analysis.

2.3. ECM Assessment

Soil samples were defrosted at room temperature (ca. 23 °C for 30 min), and soil particles were sieved from roots and thereafter washed in tap water. Oak roots were separated from the roots of grasses and herbs. Grass and organic matter were first removed from the soil surface along with characteristic root systems, the separation of roots in the lab was based on morphology (comparing with reference oak roots). The roots were sorted by tree species after the keys by Boratyński et al. [26]. The roots were then transferred into 10 cm petri dishes containing distilled water for analysis. Root fragments were analysed using a stereomicroscope coupled with a camera (Delta IPOS-808, Delta Optical, Warsaw, Poland), at magnification of 10–40×. The initial identification of ECM fungi was based on existing identification keys, and ECM fungi were subjected to morphological classification according to a simplified scheme after Agerer [27] and Agerer and Rambold [28]. Fine roots were counted, and the presence or absence of a hyphal mantle was recorded for non-vital (NV—a scurfy surface and an easily detachable cortex, with or without the remnants of an ECM mantle; vital non-mycorrhizal (NM—a well-developed, turgid and inflated tip, mantle lacking) and vital ECM (VM—as above, but with an ECM mantle) root tips according to Montecchio et al. [10]. In the case of ramified ECM clusters, each mycorrhizal root tip was counted separately. ECM tips were described based on their mantle, colour, ramification type, emanating mycelium and rhizomorphs. The phenotype of the individual morphotypes was identified and classified accordingly as Txy (x—morphotype digit, y—sub-morphotype letter). Representative mycorrhizal root tips of each morphotype were photographed and deposited, together with a fungal description and molecular information, in an internal database. Additionally, the ECM morphotypes were classified into the following exploration types: contact type—represented with a smooth mantle and only a few emanating hyphae; short distance type—characterized by a voluminous envelope of emanating hyphae and lacking rhizomorphs; medium smooth distance type—having few or no emanating hyphae and internally undifferentiated rhizomorphs, and a long distance exploration type—characterized by smooth mantles and highly differentiated rhizomorphs, based on exploration types given by Agerer [25].
To determine the mycorrhizal species/taxa, we collected tip material from three to five mycorrhizal root tips per morphotype, transferred it into Eppendorf tubes filled with 70% EtOH and labelled and stored them at −25 °C for molecular analysis. Based on nuclear ribosomal DNA sequence analysis (ITS region), the fungal species were determined. As a result, all morphotypes were re-grouped according to the molecular species/taxa affiliation. The following characteristics were calculated: the abundance of vital mycorrhizal (VM) root tips calculated as: (mycorrhizal vital root tips)/(mycorrhizal root tips + non-mycorrhizal root tips (NM) and non-vital (NV)) × 100, presented as a percentage of ECM colonization. Percentages of NM and NV were calculated analogously. The relative abundance of individual ECM fungal taxa was calculated as the proportion of the number of ECM root tips of each species averaged over the total number of mycorrhizal root tips. The mycorrhizal fungal species richness [n] (the number of molecularly confirmed ECM species) was calculated separately for each site. The frequency of ECM taxa was expressed as the percentage of colonised oak trees for each ECM fungal taxon.

2.4. Identification of Mycorrhizal Fungi

Samples of each ECM morphotype were sequenced using ECM root tips that had been stored in 70% EtOH at −25 °C. Fragments of ECM mantles and extrametrical mycelium from ECM tips were used as a template, either directly or after suspension in the dilution buffer included in the Phire®Plant Direct PCR Kit (Thermo Scientific®, Finnzymes, Waltham, MA, USA). This method bypasses DNA extraction and purification. We amplified the internal transcribed spacer (ITS) region of the rDNA using the primers ITS1F [29] and ITS4 [30], and sequenced the product of the polymerase chain reaction (PCR). The PCR was performed using the Phire®Plant Direct PCR Kit according to the manufacturer’s protocol [31]. PCR was performed in a 20 μL reaction mixture containing: 1 × PCR Buffer Phire®Plant; 0.4 μL Hot Start II DNA polymerase; 0.5 μM forward primer (ITS 1F); 0.5 μM reverse primer (ITS 4) and 0.5 μL matrix. The amplification reaction was performed in a PTC-200™ Programmable Thermal Controller thermocycler (MJ Research, Inc., Reno, NV, USA) according to the protocol developed at the Laboratory of Molecular Biology. It consisted of: 5 min of initial denaturation of the DNA matrix at 98 °C, followed by 40 cycles of amplification (denaturation for 5 s at 98 °C; primer annealing for 25 s at 60 °C; product elongation for 1 min at 72 °C), ended by elongation of PCR products for 1 min at 72 °C. PCR products were qualitatively assessed by electrophoresis in a 1% agarose gel stained with the dye GelRed® and visualized under a UV light. The resulting PCR products were sequenced in three replicates per sample using a Genetic Analyzer (Life Technologies™, Carlsbad, CA, USA) at the Genome Joint-Stock Company in Warsaw. The resulting sequences of the studied region were inspected and edited using BioEdit 7.1.3 [32] and then compared to the identified sequences deposited in the GenBank database [33]. The reference sequence with the highest sequence similarity percentage (99%–100% in most cases; Table 2) with the query sequence was used for identification.

2.5. Fine root and Tree Health Assessment

Using an Epson 10000-XL high-resolution scanner and a pro-version of the Win-RHIZO Root Imaging Software (Regent Instruments Inc., Quebec City, QC, Canada), the total fine and mother root lengths and the number of root tips were determined. Next, the root samples were dried at 65 °C, and the dry weights of the fine (diameter < 2 mm) and mother (small woody roots with a diameter of 2–5 mm) roots were measured. Each stand was described with respect to its foliage damage. Defoliation was determined along with crown foliage damage (in 5% intervals across the range of 0–100%). The following degrees of damage were adopted, according to a modified ICP Forest classification: 0—healthy (0–10% defoliation), 1—weakened (11%–25% defoliation), 2—moderate damage (26%–60%) and 3—dying (>60% defoliation). The foliage damage assessment of each tree was made according to Roloff classes [34], and arithmetic means were used to determine the average stand vitality. Additionally, the synthetic index of foliage damage proposed by Dmyterko [35] was determined. This index, known as Syn, combines measures of tree defoliation and foliage damage with the degree of damage of individually assessed trees, and the index for the whole stand is described as:
Syn = ½ [(0.03 ∗ Ʃ Def + Ʃ Wit)/N]
where Def—% crown defoliation, Wit—degree of foliage damage of the tree according to Roloff and N—number of sampled trees. The Syn index allows for the assignment of oaks into four categories of damage: 0—healthy, 1—weakened, 2—damaged and 3—dying.

2.6. Physicochemical Analysis of the Soil
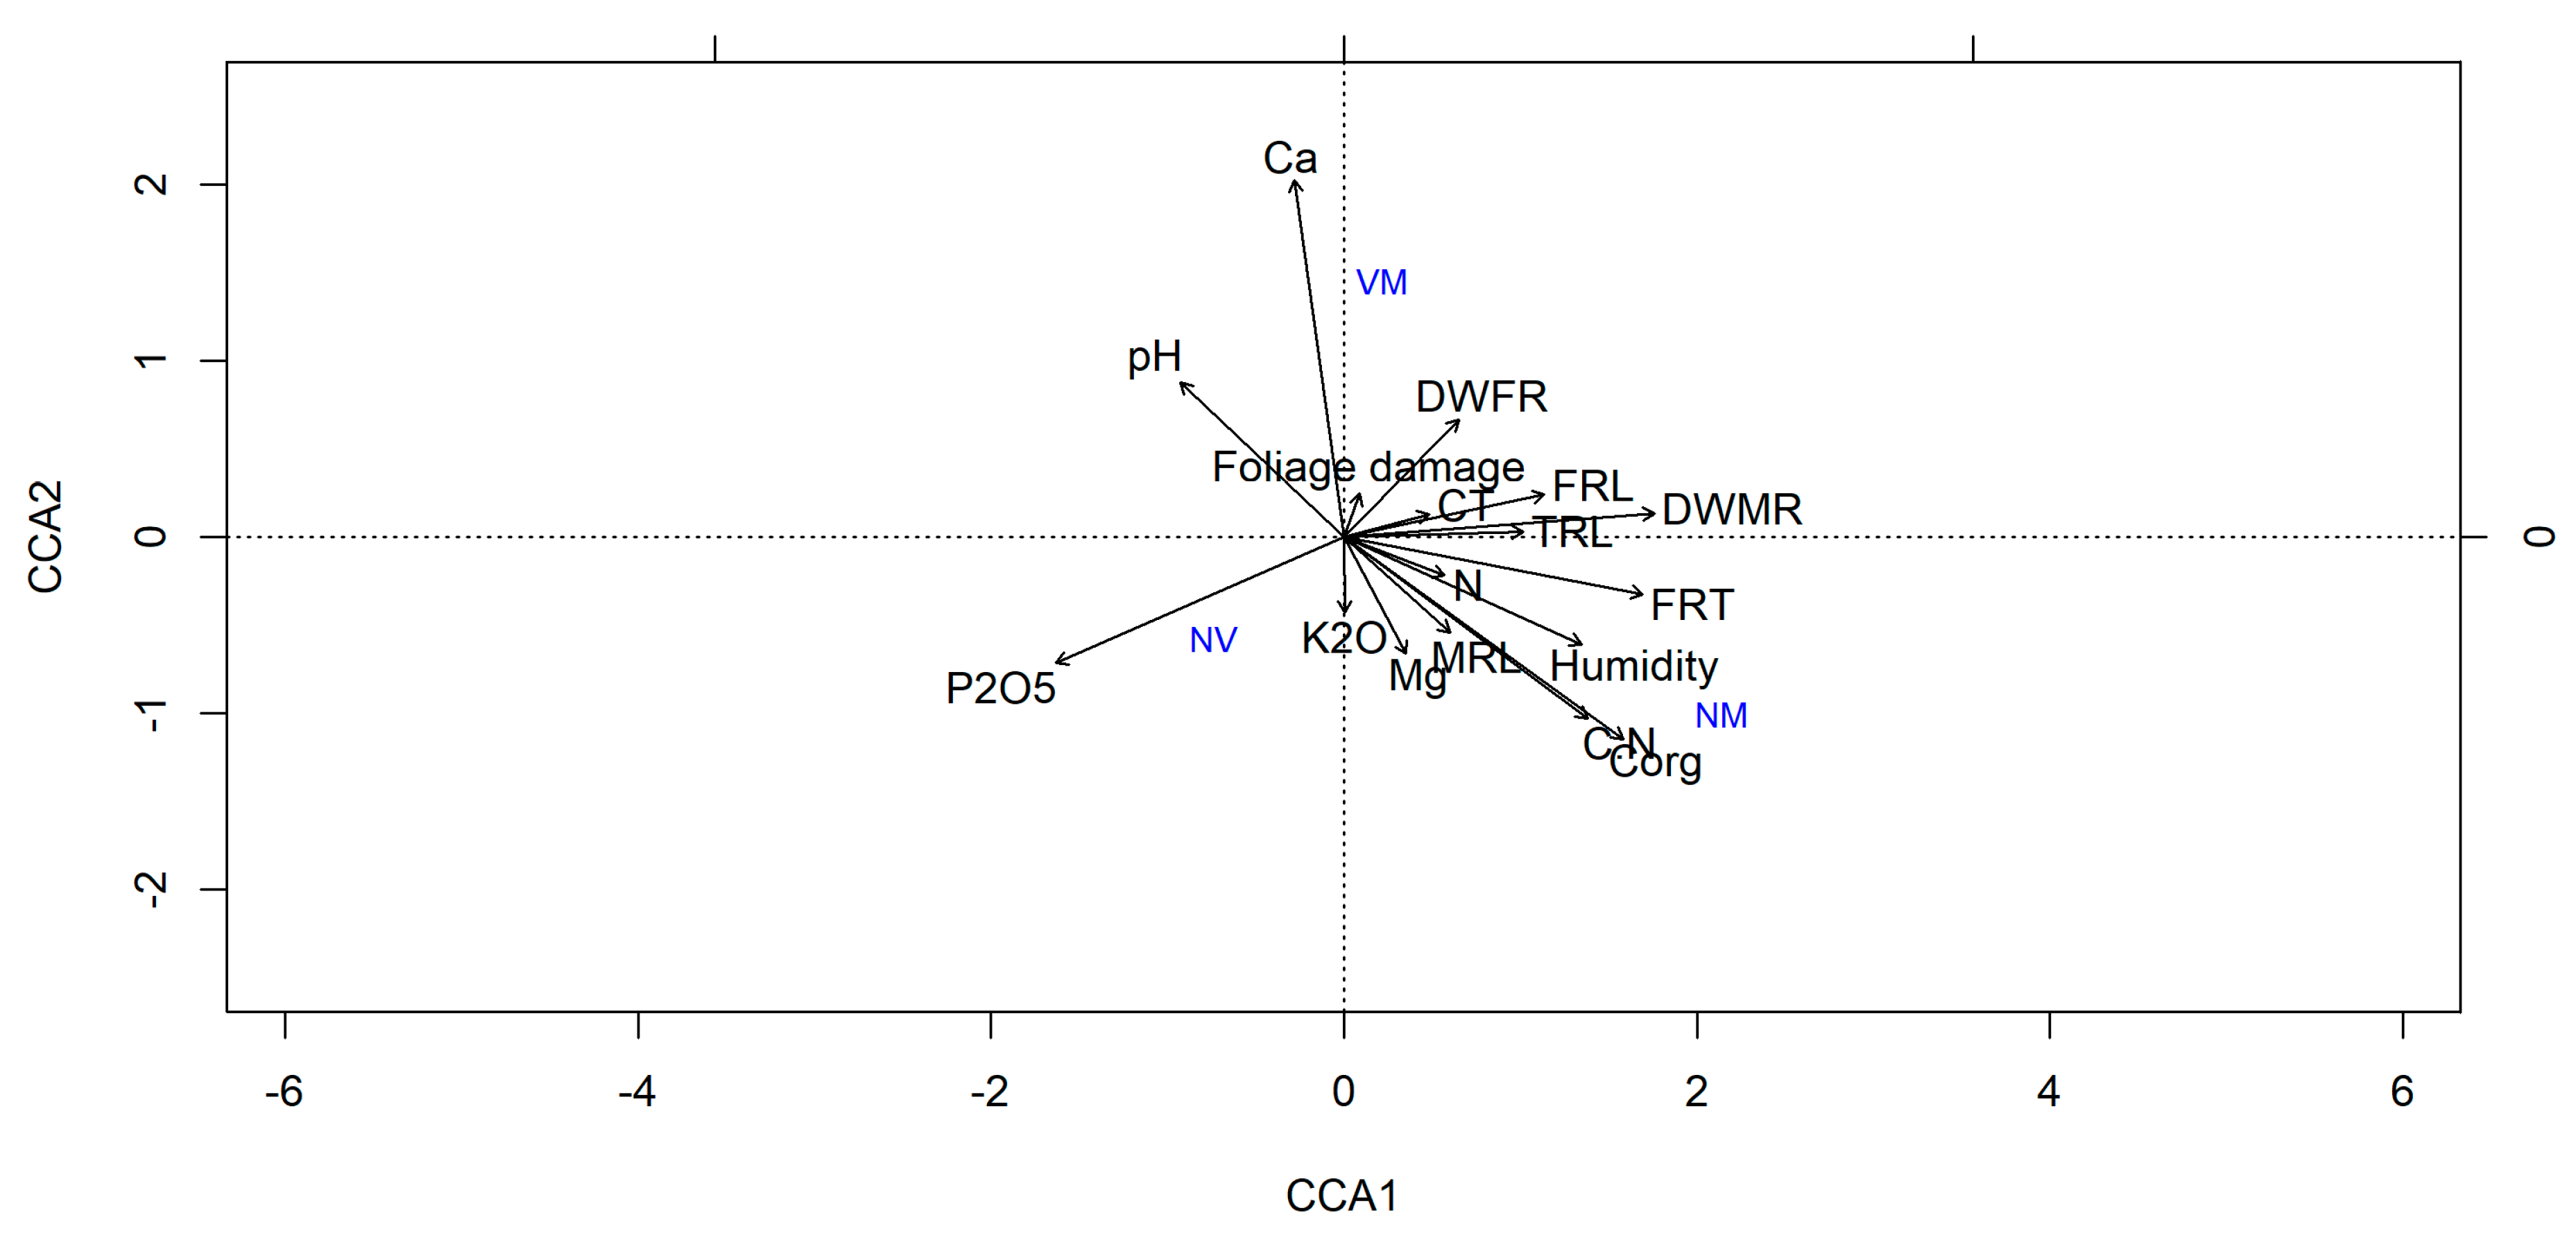
Physicochemical analyses of 180 soil samples (consisting of 360 subsamples) were performed by the National Chemical and Agricultural Station with its registered office in Warsaw, Poland. The samples for chemical analyses were dried at 65 °C for 5 days and sieved through a 2 mm sieve. An aliquot of each mixed sample was ground in a mill. The pH was measured in potassium chloride (1 M KCl) using a Hamilton glass electrode. The determination of total nitrogen was performed in sludge according to the Kjeldahl method by a digestion with sulphuric acid at a temperature under 400 °C. Soil texture was determined in all samples by the feel method [36], and principle soil particle size fractions were analysed according to Anderson et al. [37]. Total organic carbon (Corg) and total nitrogen (N) were analysed according to the Dumas-method after complete oxidative combustion with a CHN-analyser LECO CHN-1000, and the C:N ratio was calculated. Total element concentrations of Ca, Mg and K were measured after digestion of 1 g of soil in concentrated HNO3 by an ICP-IES (Optima 3000, Perkin-Elmer, Waltham, MA, USA). Phosphorus (measured as P2O5) was determined for all samples with 1% citric acid extraction according to Schlichting et al. [38]. The relative soil humidity was measured using a LABEL LB-796 capacitance moisture meter (LAB-EL Laboratory Electronics, Reguły, Poland). Measurements were performed twice in the same way as the soil samples were taken.

2.7. Data Analysis

To explore potential relationships between soil substrate properties (pH, Corg, N, C:N etc.), biometrical parameters and their matrices, the number of VM, NM, NV root tips and their matrices and the number of different root tip exploration types, we used canonical correspondence analysis (CCA). It was carried out for replicates within a site. To present the results of the CCA analysis we used biplot figures. To evaluate significant differences among the examined sites for the abundance of VM, NM, NV root tips and the abundance of different exploration types, we used generalized linear models (GLM) with binomial distributions. Tukey’s linear contrast was used to test a pairwise comparison between the examined sites for the GLM model. A perMANOVA (permutational multivariate analysis of variance) with 9999 permutations was conducted to assess multivariate relationships among soil and biometrical parameters for the examined sites. Statistical analyses were performed using R version 2.15.0 [39] with the vegan package [40] for multivariate analysis. The accepted level of significance was p < 0.05. Two diversity indices, Shannon–Wiener’s and Simpson’s, were calculated based on the abundance and numbers of ECM fungal species.

3. Results

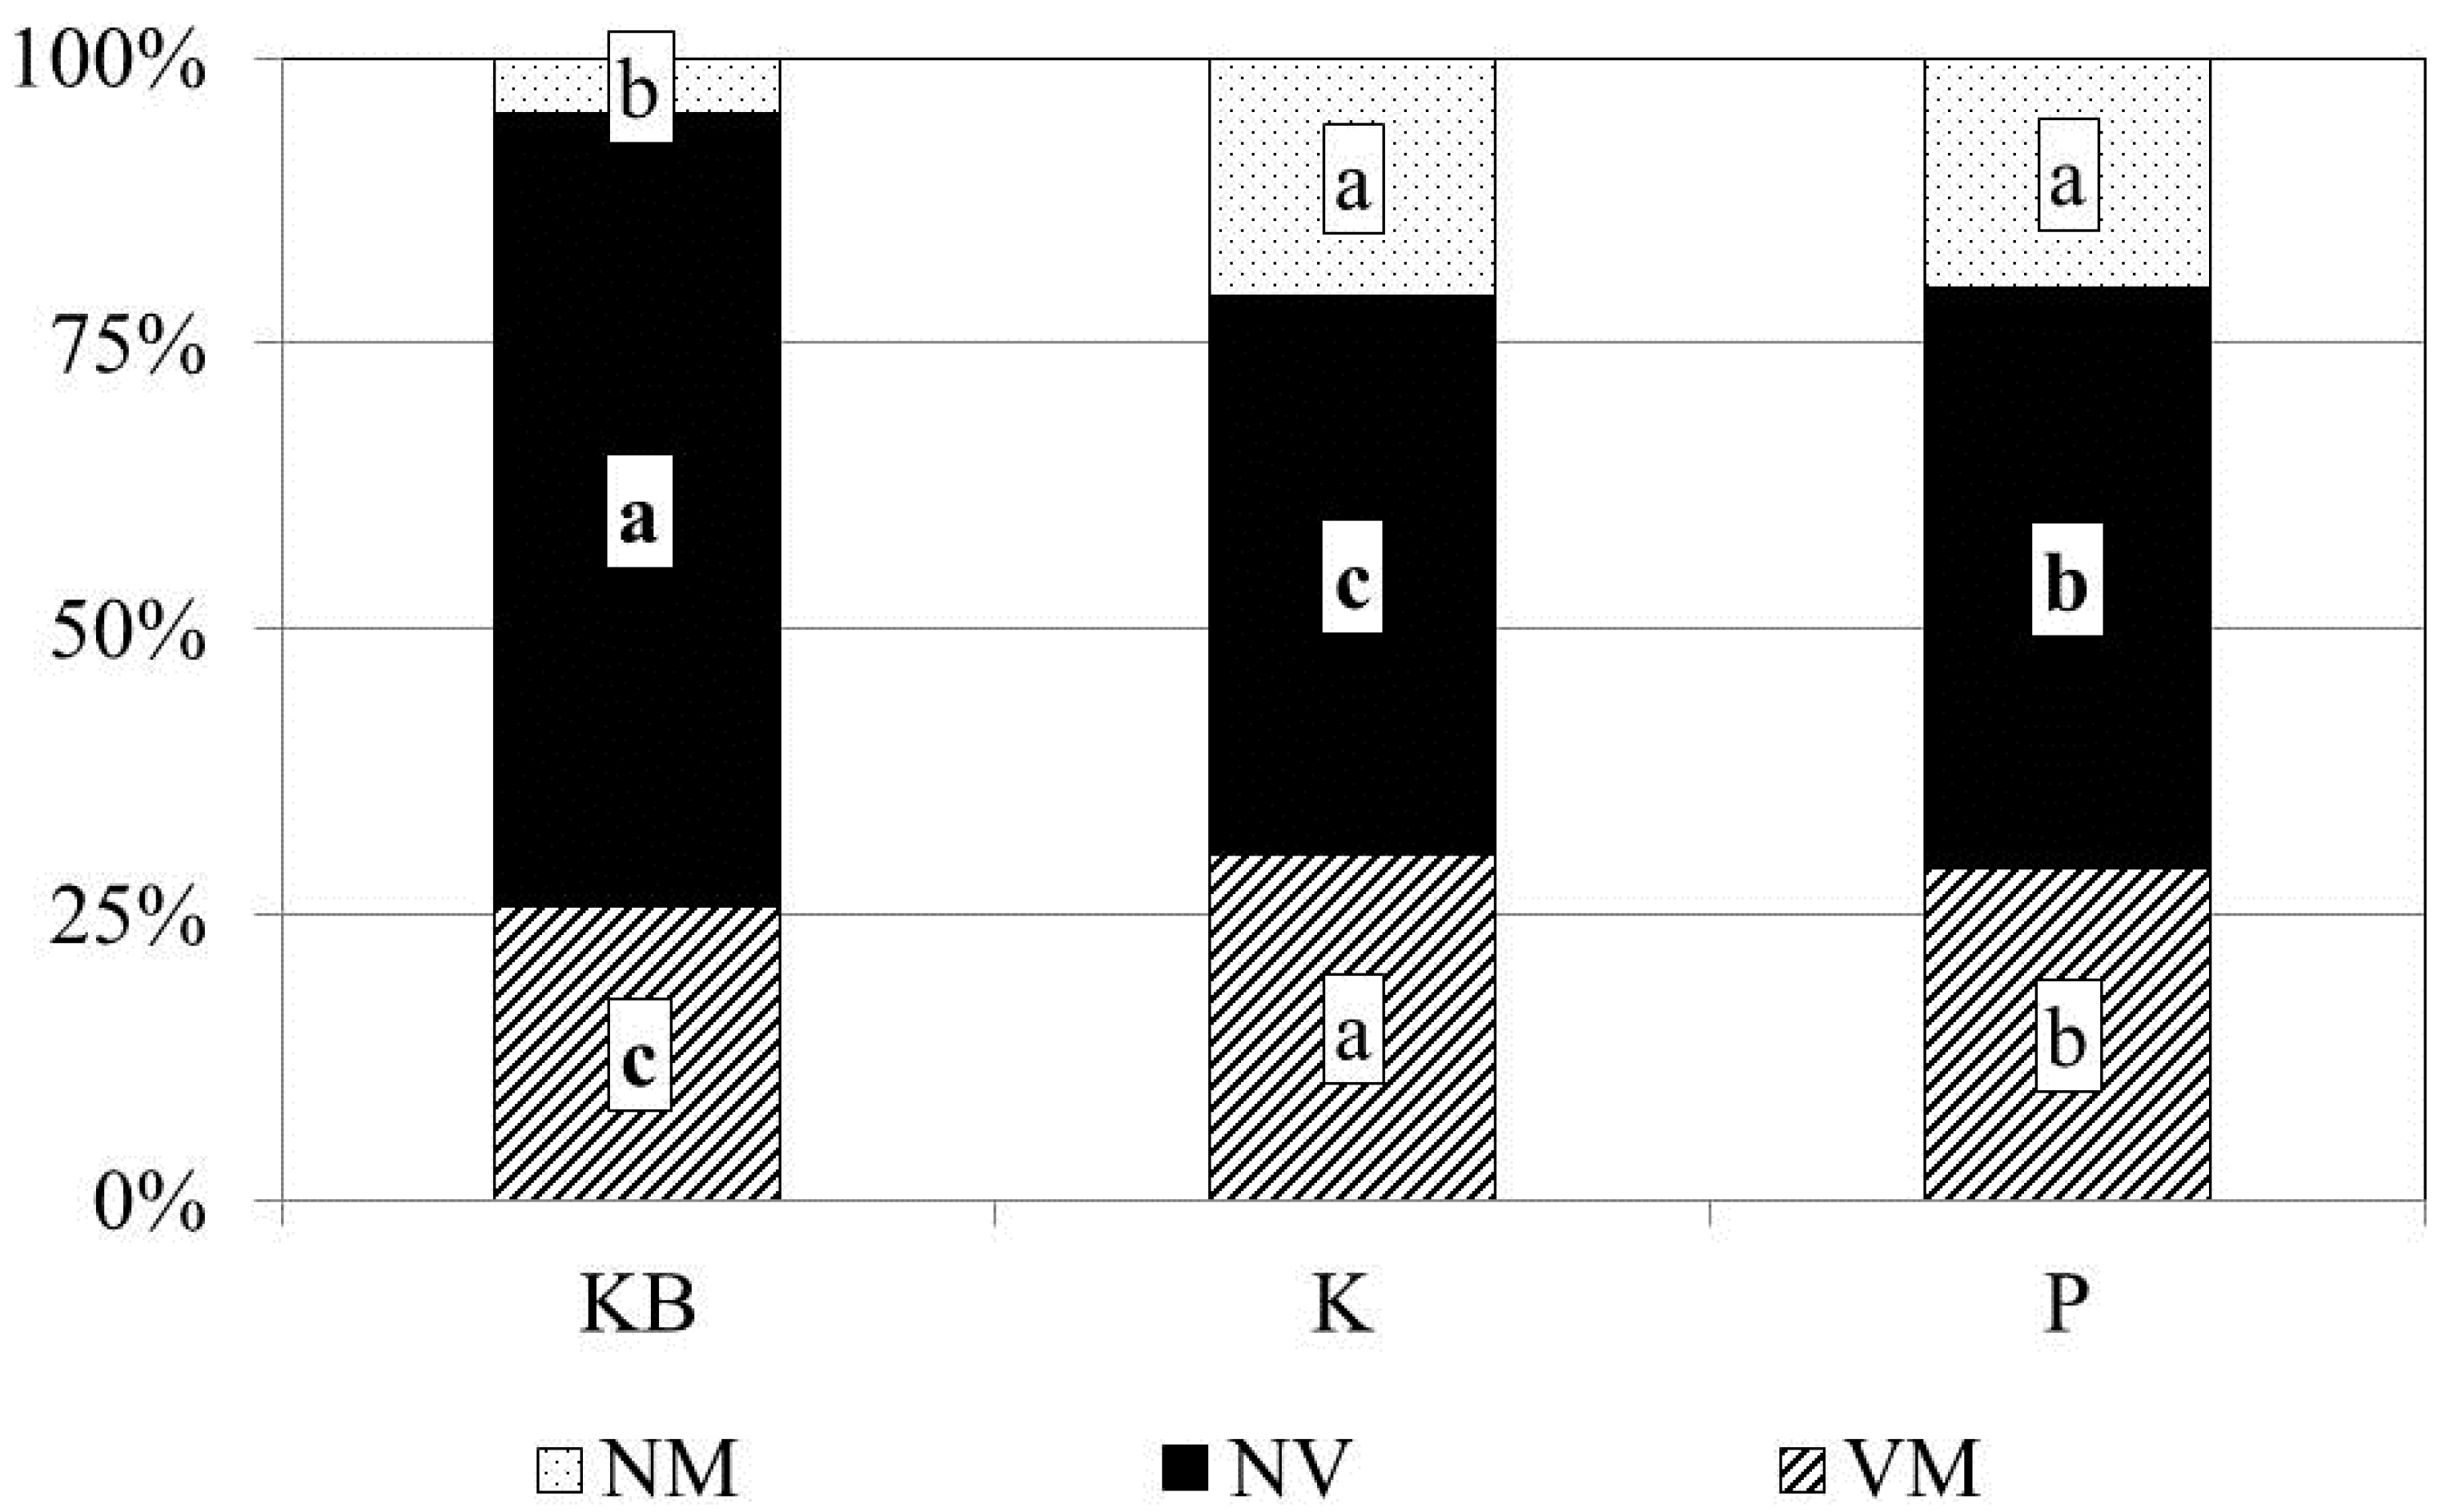
3.1. Mycorrhizal Colonisation

The analysed oak stands in decline were characterized by a low degree of ECM colonisation, with an average of 28.5% of the root tips categorized as vital ECM (VM). In contrast, 55.2% of root-tips were non-vital (NV) and 16.3% were vital non-mycorrhizal (NM). Among the sites, the degree of ECM colonization (abundance of VM) and the proportion of NM root tips were significantly different (Figure 2). The highest degree of mycorrhizal colonization was found in site K (30.2%), followed by site P (29.1%) and site KB (25.6%). The largest proportion of NV root tips was observed at site KB (69.5%, p < 0.0001), while 50.7% and 48.8% were observed in sites P and K, respectively. The lowest abundance of NM root tips was recorded at site KB (4.9%, p < 0.0001), followed by sites K (21%) and P (20.2%) (Figure 2).

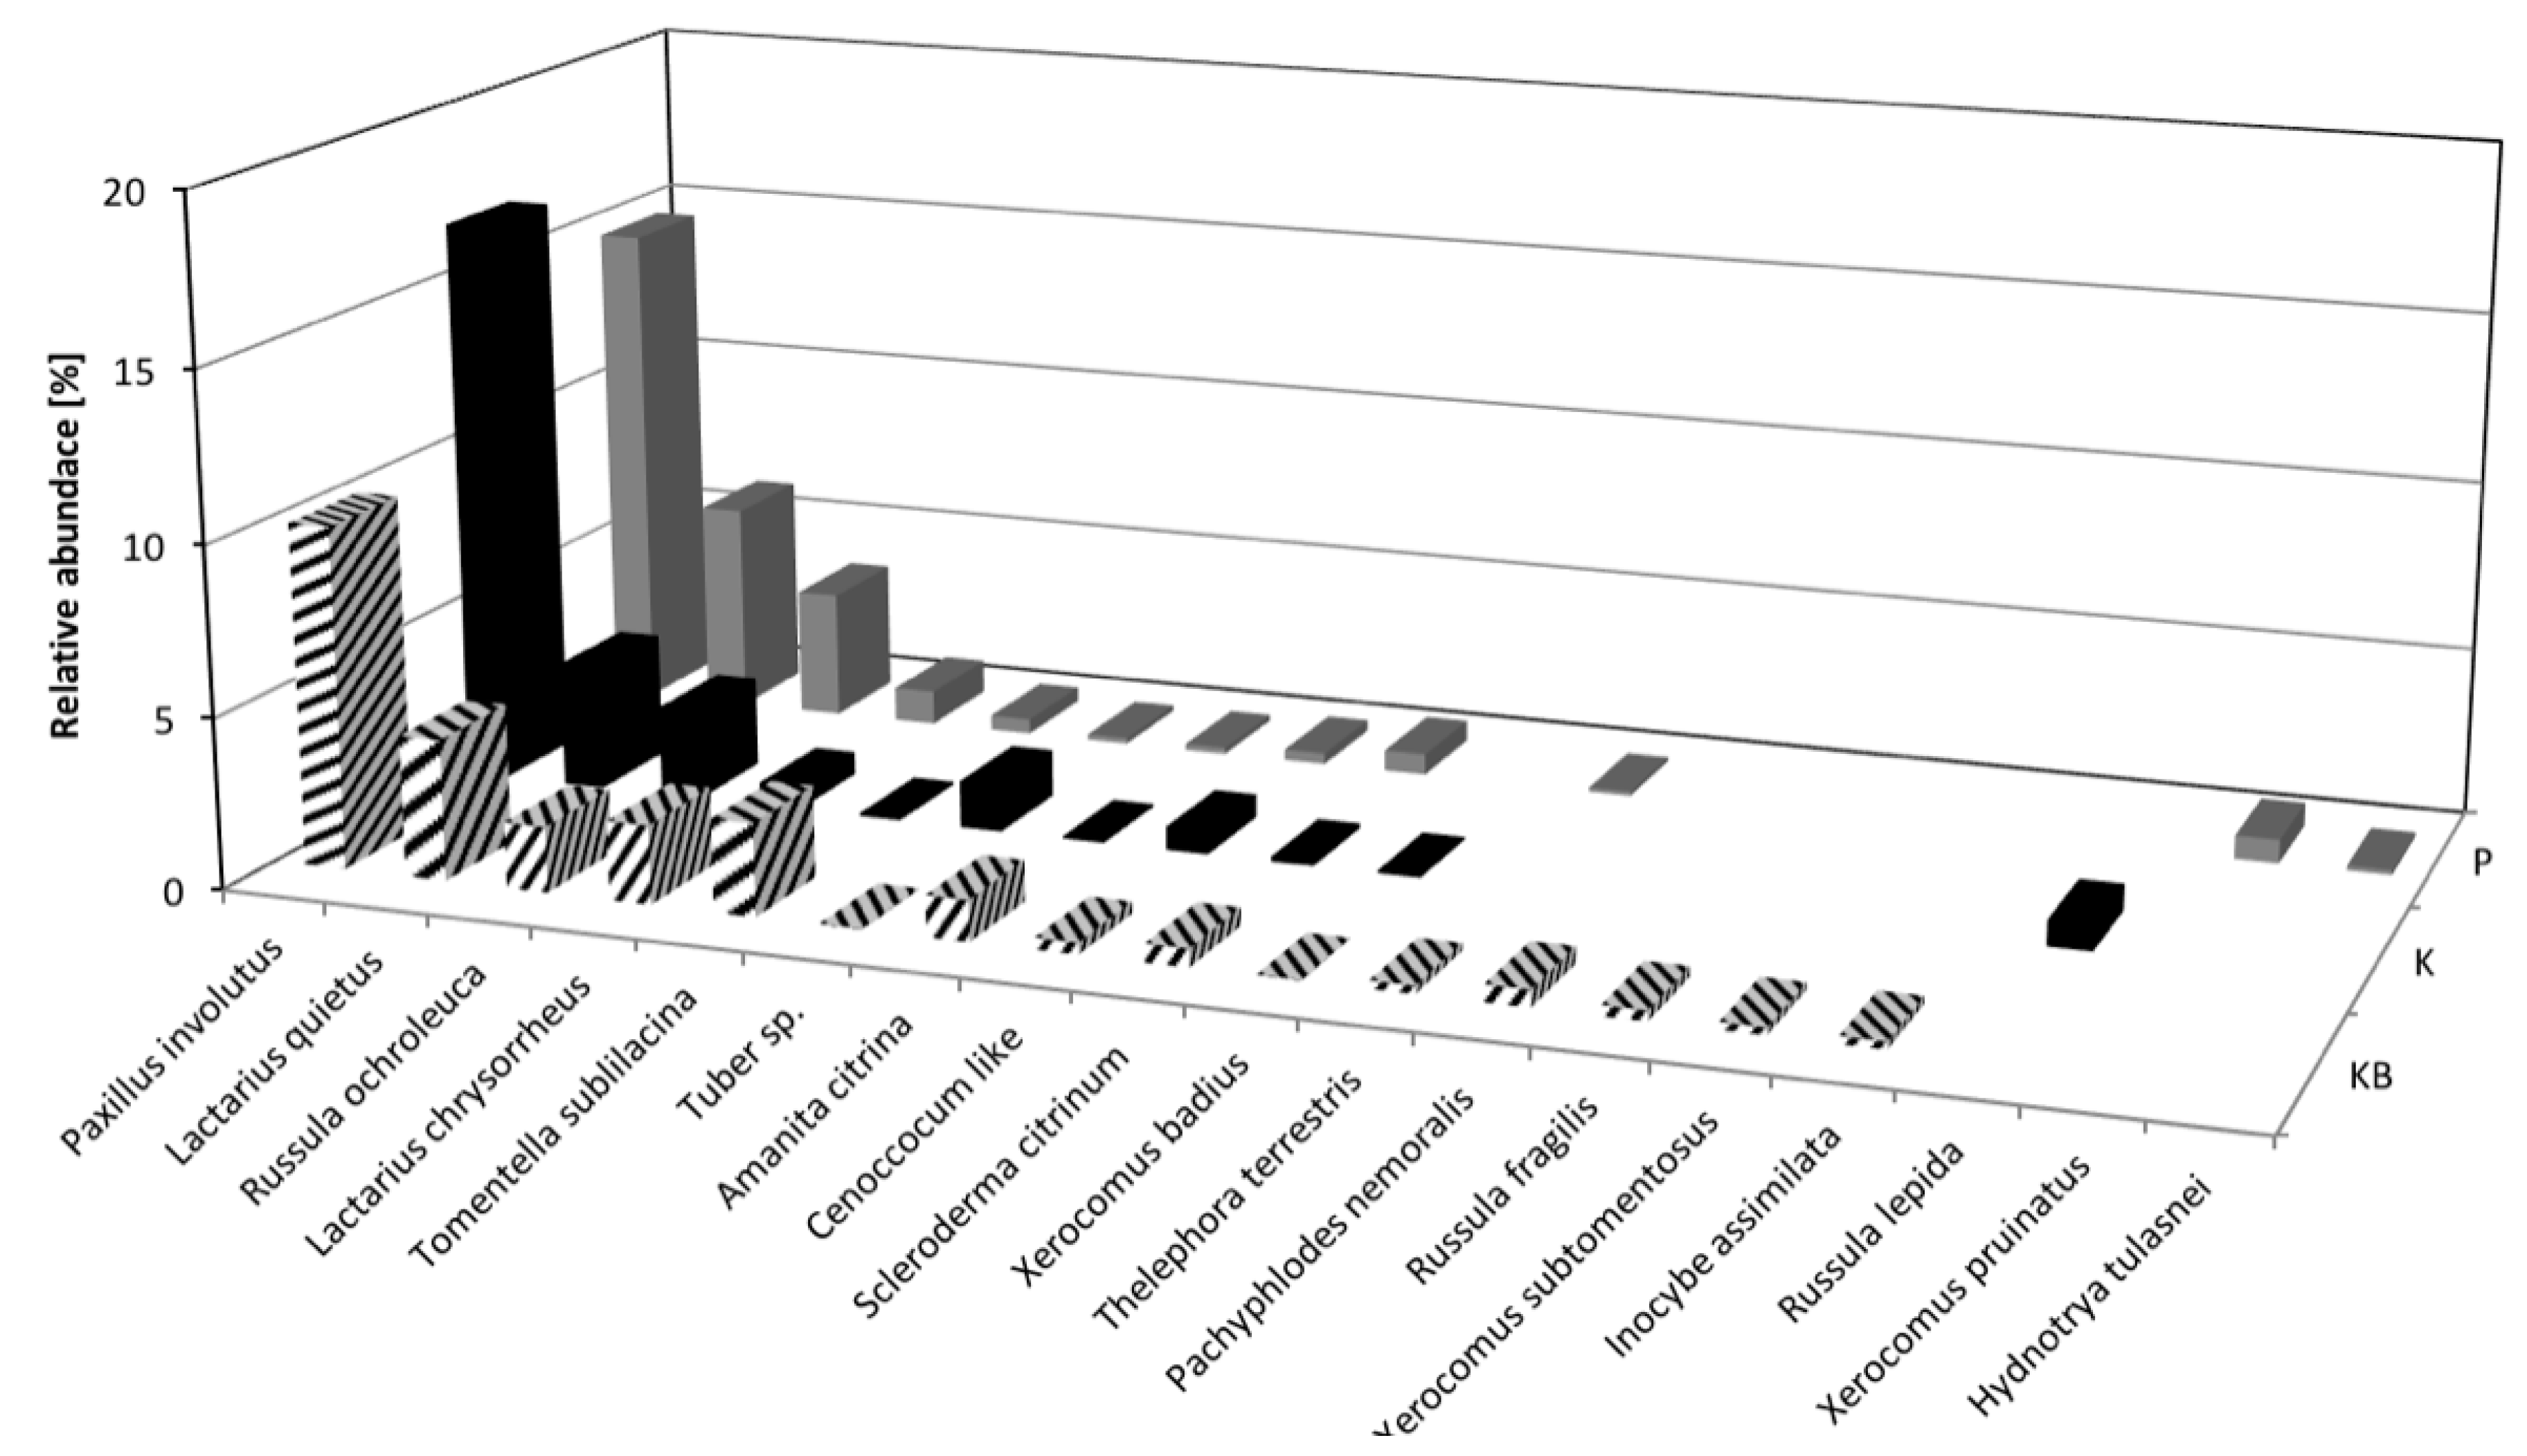
3.2. Ectomycorrhizal Fungal Communities

After a morphological examination of the mycorrhizal root tips collected from 180 trees over the three surveyed areas, 80 morphotypes were recognized. Molecular analyses revealed a total of 30 fungal taxa, including 18 ECM fungal species (14 basidiomycete species and 4 ascomycete species). ECM fungal species richness ranged from 15 taxa for site KB to 12 and 11 taxa for site P and K, respectively (Table 2, Figure 3).
The most abundant and frequently occurring mycorrhizal species included Paxillus involutus, Russula ochroleuca and Lactarius quietus, all of which were recorded across all three sites. In addition to the ECM fungi that were observed, non-ECM fungi were detected in the less vital mycorrhizal root tips, including root pathogenic species such as Ilyonectria radicicola (anamorph: Cylindrocarpon destructans) (0.6%) and wood-decomposing saprotrophic species such as the white-rot fungus Trametes versicolor (0.3%) and the rare brown-rot fungus Antrodia ramentacea. The Shannon–Wiener and Simpson diversity indices of molecularly identified ECM fungi were higher for KB and P than for K (Table 2).
Nine ECM taxa, P. involutus, L. quietus, Tomentella sublilacina, R. ochroleuca, Lactarius chrysorrheus, Amanita citrina, Cenoccocum-like, Scleroderma citrinum and Tuber sp. were present across all three oak stands. Xerocomus subtomentosus, Russula fragilis, Inocybe assimilata and Pachyphlodes nemoralis were detected exclusively at site KB; Xerocomellus pruinatus and Hydnotria tulasnei were found only at site P and only one species—Russula lepida—was associated exclusively with Q. robur at site K (Table 2, Figure 4). None of the species detected at one site only were locally abundant (frequency 5% at most, abundance 0.5% or less).
The ECM community at site K was dominated by the long distance exploration type (54.8%, p < 0.0001), whereas site KB had a significantly lower percentage of this type (36.8%, p < 0.0001) (Figure 5). However, site KB had the highest relative percentage of medium distance smooth exploration type (4.2%, p < 0.0001), whereas sites K and P had only 0.5% and 1.1%, respectively. All sites were characterized by a low abundance of the short distance type, where site P had 6.4%, site K had 8.1% and site KB had 15.7%. The occurrence of the contact exploration type was relatively equal across the localities: site KB had 43.2%, site P had 41.1%, whereas site K had the smallest share of this type by a significant margin (36.7%, p < 0.0001).
The first two axes of the CCA comparing different ECM exploration types and soil properties, with eigenvalues of 0.1039 and 0.0619, explained 73% of these relationships (Figure 6). The contact type was significantly correlated with C:N and Corg, while the short distance type was correlated with Ca, phosphorus (P2O5) and pH. The medium distance exploration type was significantly correlated with fine-grained soil particle size fractions: coarse silt (0.05–0.02 mm), fine silt (0.02–0.002 mm) and clay (<0.002 mm). The long distance type showed a similar pattern as the medium distance smooth type, but it was also correlated with nitrate (N) (Figure 6).
The first two axes of the CCA, comparing soil data and ECM status (vital mycorrhizal—VM, non–vital—NV and vital non-mycorrhizal—NM), with eigenvalues of 0.384 and 0.265, explained 66% of the relationship (Figure 7). The abundance of the NM root tips was significantly correlated with Corg, total Kjeldahl nitrogen (N), C:N ratio and relative soil humidity, whereas pH was negatively correlated. NV root tips were correlated with P2O5. The abundance of VM root tips was significantly correlated with Ca and pH.

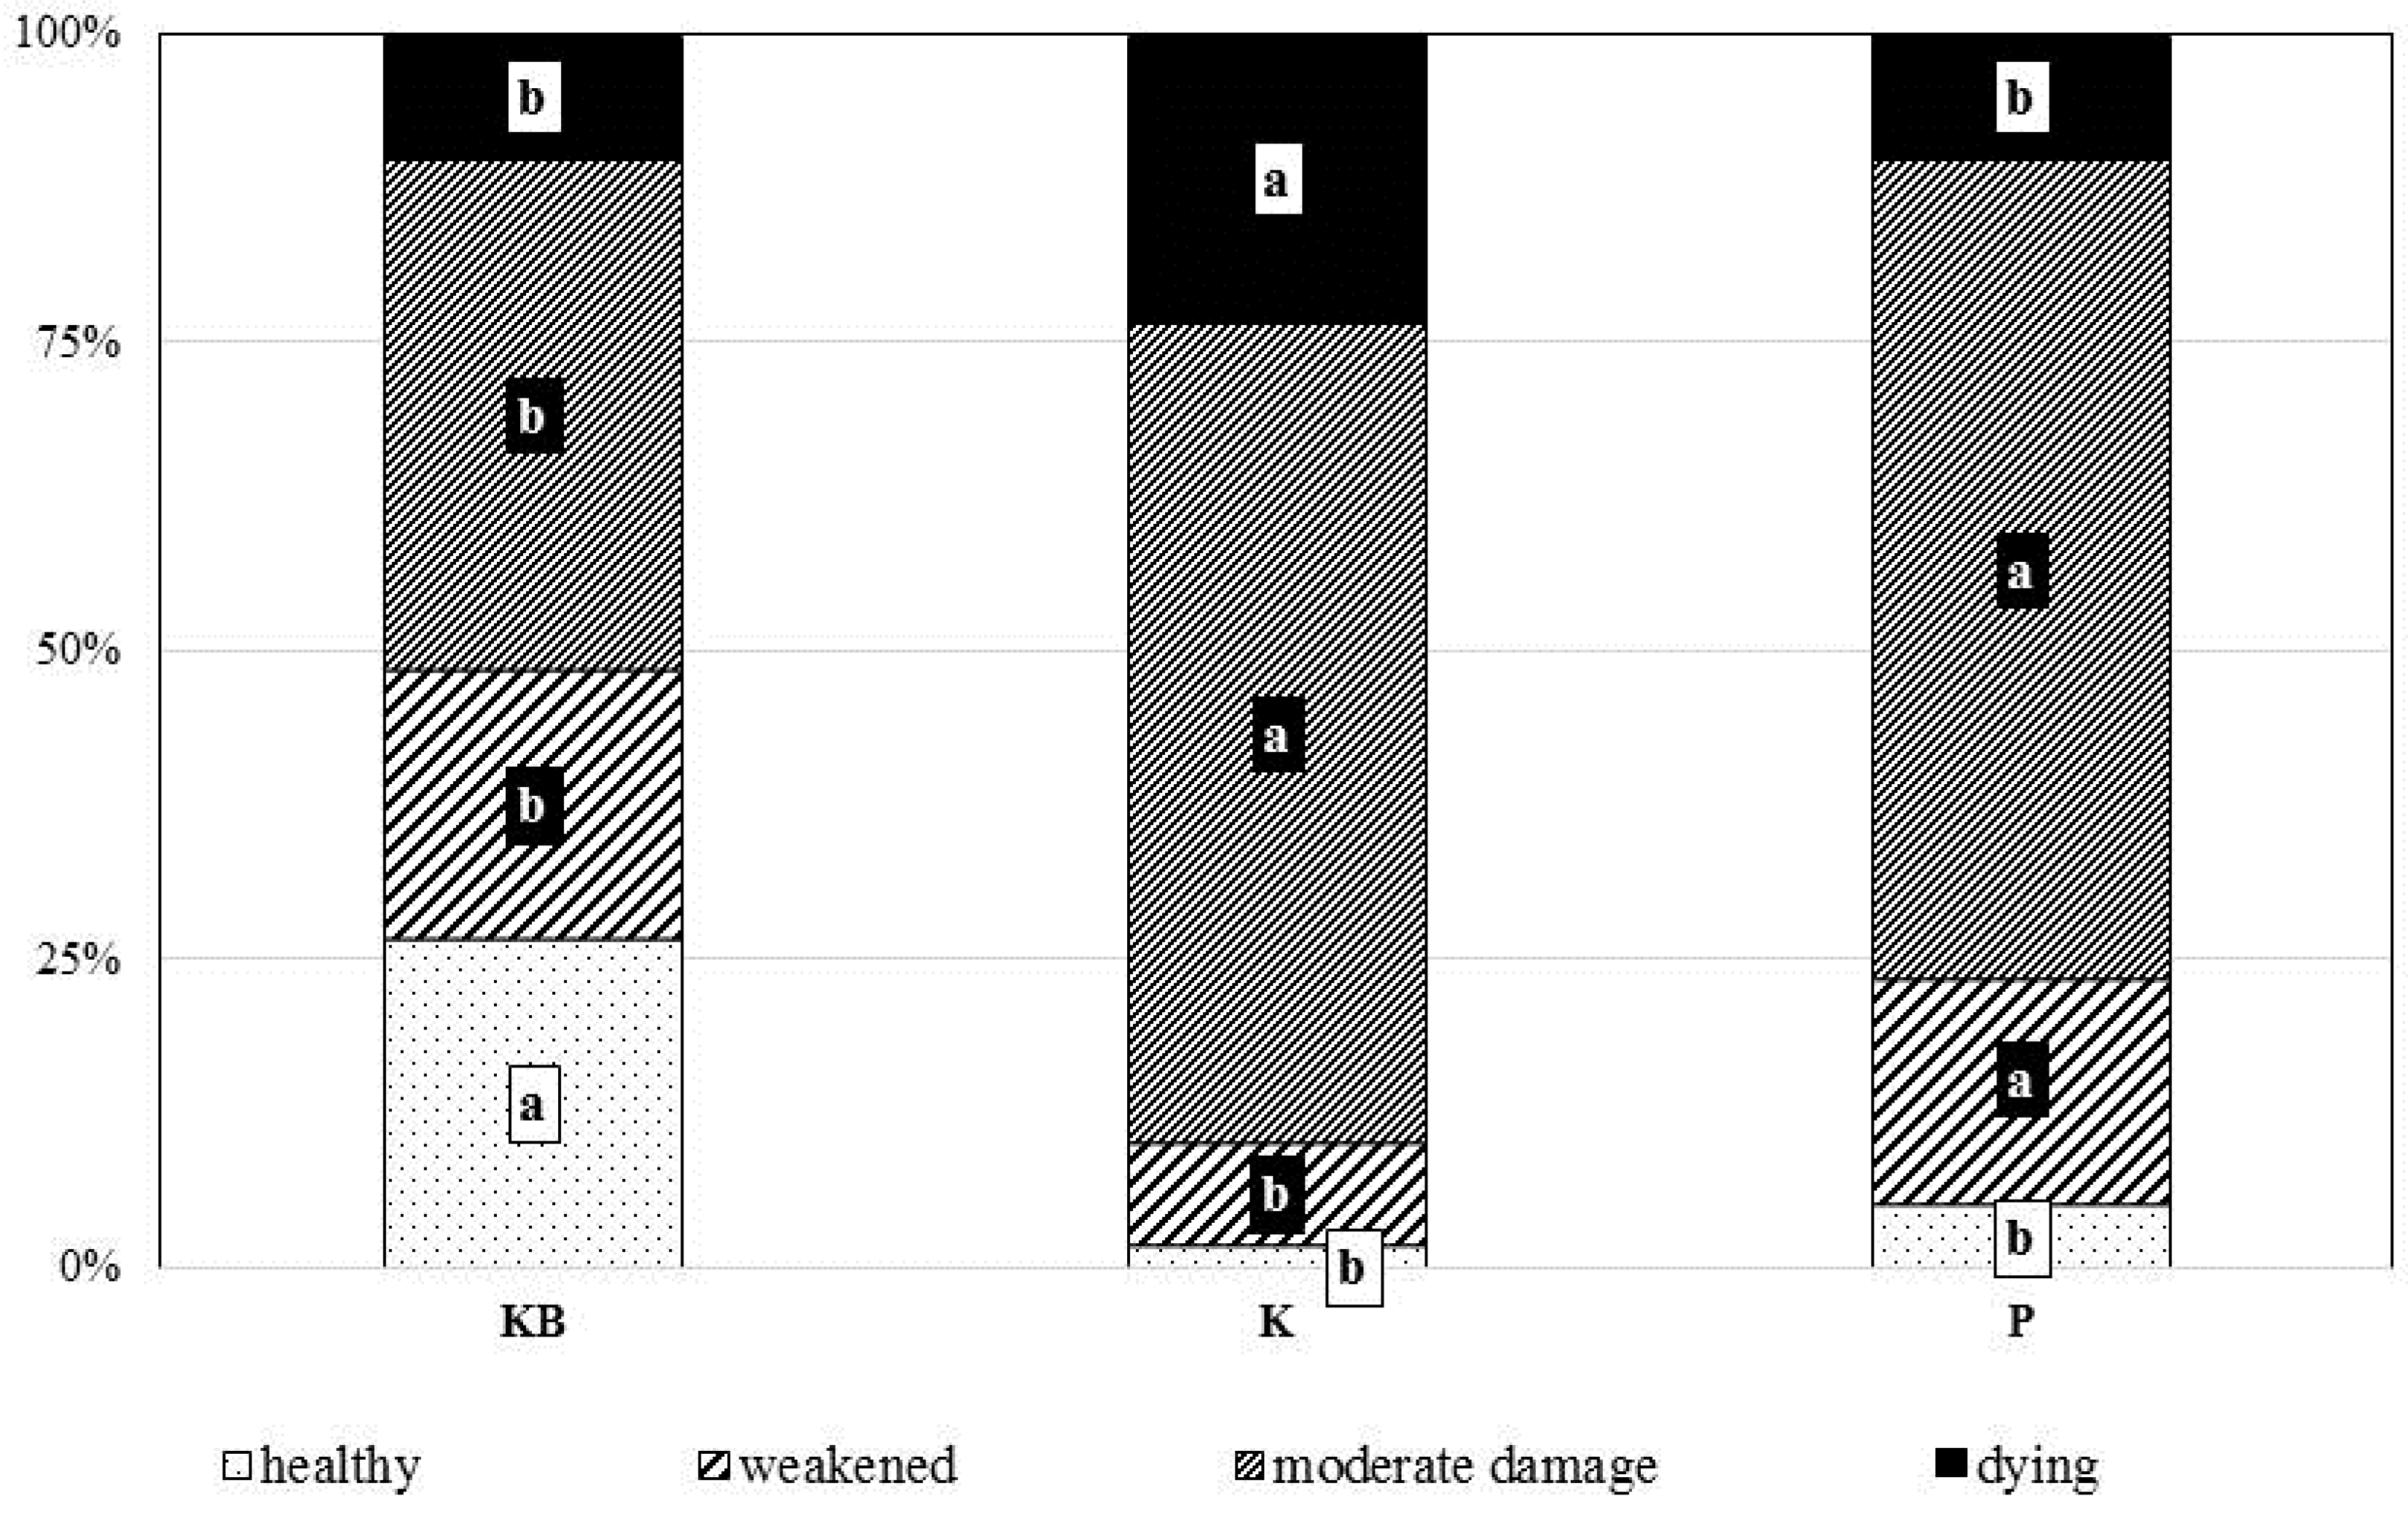
3.3. Crown Health Status and Biometrical Parameters of Root Systems

The health condition of Q. robur stands, as assessed by crown transparency classification, was different among the three examined sites (perMANOVA: df = 2; p < 0.0001). Oak trees at site KB were characterized by the best crown health status, whereas site K was dominated by dying trees (23%) in comparison to sites KB and P (10% dying trees) (Figure 8).
The values of biometric root parameters of oak trees in the analysed forest sites arranged as follows: K > P > KB (Table 3). Although oak trees at site KB were characterized by the smallest root parameters, the lowest degree of foliage damage was also observed at site KB (1.3; 11%–25% of defoliation) compared to the other sites (K—1.8; >25% and P—1.6; >25%). The synthetic index (Syn) of damage also revealed that all stands were weakened, but that the trees at site K were in the worst condition in comparison to the trees at the other sites, especially when compared with site KB (Table 3). A multivariate analysis of biometrical root parameters and crown health status demonstrated significant differences between sites K and KB (perMANOVA; df = 2; pbiometrical = 0.019; phealth = 0.001) and between sites K and P (perMANOVA; df = 2; pbiometrical = 0.037; phealth = 0.003).

3.4. Soil Substrate Properties

The physical and chemical properties of the soils and the mineral soil particle size distribution of the three plots varied among sites (Table 4). The multivariate analysis for soil data revealed significant differences between sites K and P (perMANOVA; df = 2; p = 0.008). The soil in all stands was acidic and varied across sites (pHKCl = 3.6 and 3.4 for KB and K, respectively), with site P being the most acidic (pHKCl = 3.2). Organic carbon (Corg) and total Kjeldahl nitrogen contents were different across sites. The highest mean content of Corg was found in site P (Corg = 65.4 mg/g), while a lower content was found in sites K and KB (Corg = 34.0 mg/g and 16.9 mg/g, respectively). The lowest total nitrogen value was recorded at site KB (0.7 mg/g), followed by sites K and P, with 1.4 mg/g and 2.3 mg/g respectively. The C:N ratios in sites P and KB and K were as follows: 33, 30 and 27, respectively. Furthermore, K2O and Mg concentrations were lower at site KB, whereas site P was characterized by a lower P2O5 content and a higher Ca content. Site KB was characterized by more coarse-textured soil than the other sites (K, P), which had slightly more fine-textured soil. The percentage of coarse silt was different among the three sites. Site P had a higher coarse silt component (14.4%) than the other sites, K (13.3%) and KB (11.6%). Clay content was generally low, but highest at site K (1%) compared to sites P and KB (0.6% and 0.5%, respectively). Relative soil humidities significantly differed between sites and were arranged as follows: P > K > KB (Table 4).

4. Discussion

4.1. Degree of Mycorrhizal Colonisation

The analysed oak stands in decline were characterized by a low percentage of vital ECM, which ranged from 25.6% at site KB to 30.2% at site K. A similar degree of root ECM colonization has been reported in other oak forests (Q. ilex) [24]. Fodor et al. [59] found a high variability in the proportion of ECM tips in declining Q. robur, ranging from 33% to 78%. Differences in the degree of mycorrhizal colonization could also be expected in Q. robur stands in relation to disturbances caused by abiotic and biotic factors (health status), as well as the age of the stands. We found a positive correlation of vital mycorrhizal root tips to soil calcium (Ca) and pH (Figure 7). This result is in line with previous reports [60,61]. Moderate doses of liming have been observed to increase the mycorrhizal status of oak (Quercus petraea and Q. robur) roots in ten in situ trials [60]. ECM colonization was observed to increase in a dose-dependent manner with the increasing pH in the humus layer due to liming [61,62]. On the other hand, many ECM fungal species are considered to be acidophilic [63], and higher concentrations of calcium could result in shifts in the ECM community composition [60,64]. Soil Ca content was found to be a strong predictor of soil fungal richness and community composition [65].
In the current study, the proportion of vital fine roots correlated negatively with the soil phosphorus content (Figure 7: increase of non-vital (NV) root tips with increasing phosphorus in humus layer). Moreover, the highest abundance of NV root tips was observed at site KB, which was characterized by high levels of phosphorus. These results are consistent with Iwański et al. [66], where the analysis of mycorrhizal associations of nursery grown Scots pine seedlings demonstrated a positive correlation of dead mycorrhizas to P2O5 content. Negative effects of phosphate on mycorrhizal colonization have been detected in previous studies [67,68]. Børja and Nilsen [61] observed that ECM colonization decreased with an increasing amount of extractable phosphorus in the humus. The inhibition of growth of some ECM fungi by elevated levels of phosphate has also been confirmed in pure culture [63,69]. Some authors have hypothesized that non-mycorrhizal root tips might be vulnerable entry points for pathogens into the tree [24], as ECM root tips covered with a fungal mantle are thought to be more resistant to root pathogens [70]. Thereby, elevated soil P content might result in increased exposure to root pathogenic fungi, due to a decrease of ECM colonization. To a certain extent, this could explain the positive correlation between the phosphorus amount and number of non-vital root tips observed in our study. Alternatively, reduced sink-strength due to the loss of vitality of ECM host trees and their fungal associates may be the reason for elevated soil P levels. To understand the underlying causalities, further investigations into soil P budgets are necessary.
We found a higher abundance of non-mycorrhizal root tips (NM) at sites (K and P) rich in humus and nitrogen (Table 4, Figure 2). These results are consistent with previous study. As Baier et al. [71] suggested, the role of humus in the nutrition of plants influences the spatial spread of fine roots in the soil. They detected a greater share of fine roots in humus-rich microsites. Moreover, it was experimentally confirmed that the addition of an aqueous solution of nitrogen increased the formation of new NM hair roots and at the same time reduced their mortality [72]. Conversely, a high N deposition can reduce the formation of ECM root tips [73]. The negative influence of N on the growth of external ECM mycelium has been observed both in the laboratory and in field studies [74,75]. In our study the abundance of NM root tips increased with increasing organic carbon, C:N ratio, relative soil humidity, and, less strongly, with total N content. Additionally, Thomas and Blank [76] suggested that an excess of nitrogen increases oak damage from winter frosts. This fact might indirectly explain the health state of the oaks at sites K and P, which was much worse than the health of the KB stand, as the first sites had higher nitrogen contents. The negative relationship of pH and NM suggests that highly acidic conditions reduce the vigour of ECM fungi.

4.2. ECM Symbiosis and Fungal Community Composition

In the present study, the distributions of ECM fungi in three declining oak sites differing in ecological condition represented by soil properties (pH, C, N, etc.), stand age and tree health status was determined. The ECM fungal community consisted of 78% Basidiomycota and 22% Ascomycota across all analysed stands, with the proportions in agreement with previous studies [77]. The recorded species are characteristic and widespread ECM oak associates [41,78,79]. However, the observed species richness was low compared to other reports from oak forests [79,80]. Crown defoliation may result in the reduction of photosynthetic activity, which negatively affects the below-ground carbon allocation on which ECM symbionts are dependent [22,81]. This fact may indirectly explain the lower diversity of ECM fungi at the more damaged stand at site K. This finding is in accordance with previous studies by Kovacs et al. [12] and Mosca et al. [82], where the Shannon index of diversity of ECM morphotypes was found to be higher in the root systems of vital trees.
Despite the similarity of the ECM fungal communities in the three sites, we observed differences in the abundance and frequency of ECM taxa. It should be noted that we only analysed oak roots, discounting those of C. betulus, C. avellana, P. abies and other plants in the understory and shrub layer of this oak forests. It must be kept in mind that the richness and structure of ECM communities may also be influenced by the presence of other mycorrhizal host species, which might play the role of refuge plants and could support or suppress ECM fungal inoculum for oak trees [68,83].

4.3. Ecological Importance of Exploration Types of Ectomycorrhizae

Previously observed relationships between ECM exploration types and physical and chemical soil properties were confirmed in our study [25,84,85]. The short distance exploration type was represented mainly by the genera Tomentella, Inocybe and Cenoccocum-like, and was most abundant at site KB, which was characterized by higher soil pH and phosphorus content. The correlation of the short exploration type to soil pH and P2O5 may be explained by differences in phosphorus uptake due to differences in the total mycelial surface area and mycelial length. Pine seedlings experimentally inoculated with Pisolithus tinctorius, which has been shown to produce a 1.5 times higher potential absorbing surface area, absorbed almost twice as much phosphorus as those inoculated with Cenococcum geophilum [86]. The contact type represented mainly by the genera Lactarius and Russula is considered well adapted to soil layers rich in organic matter and to relatively nutrient rich conditions [85,87,88]. In our study, this contact type was most strongly correlated to soil organic matter (C:N ratio and Corg), while correlations to soil nutrients were negative (N, K) or inevident (Ca, Mg, P2O5) (Figure 6). In contrast, exploration types with abundant mycelial biomass, such as the long distance exploration type, were found to be well adapted to nutrient-poor conditions [87,89]. In our study, the long distance type and the medium distance smooth type were positively correlated to silt and clay content (rather low in all sites), and negatively correlated to Ca, Mg, P2O5 and pH. Silt and clay contents are determinants of soil pore size distribution and field capacity. ECM fungi are essential for base cation mobilization from soil minerals in highly acidic, base limiting conditions [90]. Our results suggest that different exploration types have different roles in base cation homoeostasis. Bakker et al. [60] reported that liming of acidic oak forest soils with low base saturation was shown to stimulate fine root development and ECM formation, and to result in shifts of ECM community composition, particularly an increase of ‘hairy’ types of ECM at the expense of the relative proportion of smooth ECM. The long distance exploration type was most abundant at sites K and P, and correlated moderately with the total N amount. It is well known that there is a variability between different ECM species, and even between strains of the same species, in use of organic N sources [70]. Laiho [91] examined the N-source preferences of a number of strains of Paxillus involutus, and concluded that the failure of P. involutus to grow in raw humus was primarily due to a lack of available N.

4.4. Tree Health Status and Ectomycorrhizal Colonization

Among-site comparison suggested a surprising negative relationship between tree health and ECM status, with the highest proportion of non-vital root tips recorded in the least damaged stand (Figure 2). However, canonical correspondence analysis (CCA) of the biometrical parameters of roots, crown transparency and vitality index and analysed root fine types (VM, NV, NM) from all sites combined did not reveal a strong correlation of tree foliage damage with any of the parameters investigated in the first two dimensions of the parameter space, but did show a weak positive correlation of tree foliage damage and VM (Figure 7). Stand-wise, ECM diversity was highest at KB, the stand with the best tree health status, and lowest at K, the most severely declining stand (Table 3). Interestingly, the diversity of functional groups of ECM (exploration types) was highest at KB as well, indicating a potential positive role of ECM functional diversity.
Conjeaud et al. [92] observed 30% growth depression in Hebeloma-colonised pine seedlings compared to non-mycorrhizal controls at 6 months, independently from different nutrient regimes (with and without phosphorus fertilization). Mycorrhizal plants were characterized by increased net photosynthesis and root respiration rates, compared with non-mycorrhizal ones. The growth depression was observed in all parts of the plants; however, the shoot/root ratio showed that the shoots were more affected by ECM colonization than the other plant organs. Ibáñez et al. [50] found that the impact of both AM (arbuscular mycorrhiza) and ECM colonization on seedling survival and growth of Quercus suber and Q. canariensis, characterized by dual mycorrhizal colonization, was negative or neutral but never positive. We cannot exclude adverse effects of interactions between ECMs on oak roots and AM of other plants in the understory. In our study, the positive effect of calcium and a higher pH on mycorrhizal colonization was confirmed (Figure 7), and this relationship was particularly evident at site K, which was characterized by the highest soil Ca content and the highest abundance of vital mycorrhizas. Moderate doses of calcareous amendments to acidic soils have been shown to increase fine root length and biomass, tree growth and improve the mineral levels in the foliage [60,93]. The ECM species richness, which was found to be the lowest at site K, might also play an important role in the balance of cause–effect of all these observations. Some authors emphasized that a much better understanding of mycorrhizal associations should result from comprehending the conditions in which they appear to be neutral or even parasitic [94]. It is believed that the oak decline phenomenon is a complex disease, caused by several biotic and abiotic factors, often acting synergistically [10,95]. Jung et al. [95] suggested that Phytophthora soil-borne pathogens, and also droughts and crown defoliation, are factors involved in driving the oak decline in Central Europe. Thus, further investigations should be conducted to answer the question: is the decline of ECM status causal to oak decline, or not?

5. Conclusions

Overall, the degree of mycorrhizal colonization was very poor in the declining Q. robur stands, confirming the below-ground perspective of oak decline [12,14]. To our surprise, we found a negative correlation of vital ECM root tip abundance with the crown health status of oaks, whereas higher ECM diversity reflected better crown health in the oak stands studied. Fine root and ECM turnover is known to be a dynamic process. The ratio of vital and non-vital ECM is possibly influenced by short-term factors such as local droughts, while ECM diversity may be more susceptible to long-term trends such as stand decline.

Author Contributions

R.M.B., J.O., J.A.N. and D.H. generated the data. All authors analysed and discussed the data. Statistical analysis using R version 2.15.0 (R Core Team 2012) with vegan package for multivariate analysis: M.S. The general conception: T.O. The manuscript was written by R.M.B. and A.U.

Funding

The research was performed within the frame of LIFE+ ENV/PL/000459 HESOFF European project ‘Evaluation of the health state of forests and an effect of phosphate treatments with the use of photovoltaic unmanned aerial vehicle (UVA).

Acknowledgments

We thank Miłosz Tkaczyk and Katarzyna Kubiak for providing the plant material and soil used in this work.

Conflicts of Interest

The authors declare no conflict of interest.

References

  1. Zanetto, A.; Roussel, G.; Kremer, A. Geographic variation of inter-specific differentiation between Quercus robur L. and Quercus petrea (Matt) Liebl. For. Genet. 1994, 2, 111–123. [Google Scholar]
  2. Ducousso, A.; Bordacs, S. Pedunculate and sessile oaks (Quercus robur and Quercus petraea). In Technical Guidelines for Genetic Conservation and Use; EUFORGEN: Bonn, Germany, 2003; pp. 1–6. [Google Scholar]
  3. Bréda, N.; Cochard, H.; Dreyer, E.; Granier, A. Field comparison of transpiration, stomatal conductance and vulnerability to cavitation of Quercus petraea and Quercus robur under water stress. Ann. Sci. For. 1993, 50, 571–582. [Google Scholar] [CrossRef]
  4. Bourtsoukidis, E.; Kawaletz, H.; Radacki, D.; Schütz, S.; Hakola, H.; Hellén, H. Impact of flooding and drought conditions on the emission of volatile organic compounds of Quercus robur and Prunus serotina. Trees 2014, 28, 193–204. [Google Scholar] [CrossRef]
  5. Annighöfer, P.; Beckschäfer, P.; Vor, T.; Ammer, C. Regeneration patterns of European oak species (Quercus petraea (Matt.) Liebl., Quercus robur L.) in dependence of environment and neighborhood. PLoS ONE 2015, 12, e10. [Google Scholar] [CrossRef] [PubMed]
  6. Falck, R. Oak decline in Lödderitz forest district and in Westphalia. Z. Forst. Jagdwes. 1918, 50, 123–132. [Google Scholar]
  7. Hansen, E.; Delatour, C. Phytophthora species in oak forests of north-east France. Ann. For. Sci. 1999, 56, 539–547. [Google Scholar] [CrossRef] [Green Version]
  8. Tarasiuk, S.; Szczepkowski, A. The health status of endangered oak stands in Poland. Acta Sci. Pol. Silv. Colendar. Ratio Ind. Lignar. 2006, 5, 91–106. [Google Scholar]
  9. Denman, S.; Brown, N.; Kirk, S.; Jeger, M.; Webber, J. A description of the symptoms of Acute Oak Decline in Britain and a comparative review on causes of similar disorders on oak in Europe. Forestry 2014, 87, 535–551. [Google Scholar] [CrossRef] [Green Version]
  10. Montecchio, L.; Causin, R.; Rossi, S.; Mutto Accordi, S. Changes in ectomycorrhizal diversity in a declining Quercus ilex coastal forest. Phytopathol. Mediterr. 2004, 43, 26–34. [Google Scholar]
  11. Power, S.A.; Ashmore, M.R. Nutrient relations and root mycorrhizal status of healthy and declining beech (Fagus sylvatica L) in southern Britain. Water Air Soil Pollut. 1996, 86, 317–333. [Google Scholar] [CrossRef]
  12. Kovacs, G.; Pausch, M.; Urban, A. Diversity of ectomycorrhizal morphotypes and oak decline. Phyton-Ann. Rei. Bot. A 2000, 40, 109–116. [Google Scholar]
  13. Pestana, M.; Santolamazza, S. Defoliation negatively affects plant growth and the ectomycorrhizal community of Pinus pinaster in Spain. Oecology 2011, 165, 723–733. [Google Scholar] [CrossRef] [PubMed]
  14. Scattolin, L.; Dal Maso, E.; Mutto Accordi, S.; Sella, L.; Montecchio, L. Detecting asymptomatic ink-diseased chestnut trees by the composition of the ectomycorrhizal community. For. Pathol. 2012, 42, 501–509. [Google Scholar] [CrossRef]
  15. Kernaghan, G.; Harper, K.A. Community structure of ectomycorrhizal fungi across an alpine/subalpine ecotone. Ecography 2001, 24, 181–188. [Google Scholar] [CrossRef]
  16. Erland, S.; Taylor, A.F.S. Diversity of ectomycorrhizal fungal communities in relation to the abiotic environment. In Mycorrhizal Ecology; Van der Heijden, M.G.A., Sanders, I., Eds.; Springer: Berlin, Germany, 2002; pp. 163–200. [Google Scholar]
  17. Jones, M.D.; Durall, D.M.; Cairney, J.W.G. Ectomycorrhizal fungal communities in young forest stands regenerating after clearcut logging. New Phytol. 2003, 157, 399–422. [Google Scholar] [CrossRef] [Green Version]
  18. Richard, F.; Moreau, P.; Selosse, M.; Gardes, M. Diversity and fruiting patterns of ectomycorrhizal and saprobic fungi in an old-growth Mediterranean forest dominated by Quercus ilex L. Can. J. Bot. 2004, 82, 1711–1729. [Google Scholar] [CrossRef]
  19. Kernaghan, G. Mycorrhizal diversity: Cause and effect. Pedobiologia 2005, 49, 511–520. [Google Scholar] [CrossRef]
  20. Tedersoo, L.; Bahram, M.; Dickie, I. Does host plant richness explain diversity of ectomycorrhizal fungi? Re-evaluation of Gao et al. (2013) data sets reveals sampling effects. Mol. Ecol. 2014, 23, 992–995. [Google Scholar] [CrossRef]
  21. Soudzilovskaia, N.; Douma, J.; Akhmetzhanova, A.; van Bodegom, P.; Cornwell, W.; Moens, E.; Treseder, K.; Tibbett, M.; Wang, Y.; Cornelissen, J. Global patterns of plant root colonization intensity by mycorrhizal fungi explained by climate and soil chemistry. Glob. Ecol. Biogeogr. 2015, 24, 371–382. [Google Scholar] [CrossRef]
  22. Kuikka, K.; Härmä, E.; Markkola, A.; Rautio, P.; Roitto, M.; Saikkonen, K.; Ahonen-Jonnarth, U.; Finlay, R.; Tuomi, J. Severe defoliation of Scots pine reduces reproductive investment by ectomycorrhizal symbionts. Ecology 2003, 84, 2051–2061. [Google Scholar] [CrossRef]
  23. Saravesi, K.; Markkola, A.M.; Rautio, P.; Roitto, M.; Tuomi, J. Defoliation causes parallel temporal responses in a host tree and its fungal symbionts. Oecology 2008, 156, 117–123. [Google Scholar] [CrossRef] [PubMed]
  24. Corcobado, T.; Vivas, M.; Moreno, G.; Solla, A. Ectomycorrhizal symbiosis in declining and non-declining Quercus ilex trees infected with or free of Phytophthora cinnamomi. For. Ecol. Manag. 2014, 324, 72–80. [Google Scholar] [CrossRef]
  25. Agerer, R. Exploration types of ectomycorrhizae. A proposal to classify ectomycorrhizal mycelial systems according to their patterns of differentiation and putative ecological importance. Mycorrhiza 2001, 11, 107–114. [Google Scholar] [CrossRef]
  26. Boratyński, A.; Boratyńska, K.; Filipiak, M. Morfologia, systematyka i geograficzne rozmieszczenie. Systematyka i rozmieszczenie [Morphology, systematics and geographical distribution. Systematics and distribution]. In Nasze Drzewa Leśne. Monografie Popularnonaukowe [Our Forest Trees. Popular Science Monographs]; Polska Akademia Nauk, Instytut Dendrologii, Poznań: Kórnik, Poland, 2006; Volume 11. [Google Scholar]
  27. Agerer, R. Colour Atlas of Ectomycorrhizae, 1st ed.; Einhorn-Verlag: Munich, Germany, 1987–2008. [Google Scholar]
  28. Agerer, R.; Rambold, G. DEEMY-an Information System for Characterization and Determination of Ectomycorrhizae. 2004–2015. Available online: http://www.deemy.de (accessed on 12 November 2018).
  29. Gardes, M.; Bruns, T.D. ITS primers with enhanced specificity for basidiomycetes–Application to the identification of mycorrhizae and rusts. Mol. Ecol. 1993, 2, 113–118. [Google Scholar] [CrossRef] [PubMed]
  30. White, T.J.; Bruns, T.; Lee, S.; Taylor, J. Amplification and direct sequencing of fungal ribosomal RNA genes for phylogenetics. In PCR Protocols: A Guide to Methods and Applications; Innis, M.A., Gelfand, D.H., Sninsky, J.J., White, T.J., Eds.; Academic Press: New York, NY, USA, 1990; pp. 315–322. [Google Scholar]
  31. Thermofisher.com. Available online: https://www.thermofisher.com (accessed on 15 November 2018).
  32. Hall, T.A. BioEdit: A user-friendly biological sequence alignment editor and analysis program for Windows 95/98/NT. Nucleic Acids Symp. 1999, 41, 95–98. [Google Scholar]
  33. Ncbi.nlm.nih.gov. Available online: http://www.ncbi.nlm.nih.gov (accessed on 15 November 2018).
  34. Roloff, A. Kronenentwicklung und Vitalitätsbeurteilung Ausgewählter Baumarten der Gemäßigten Breiten; Schriften aus der Forstlichen Fakultät der Universität Göttingen und der Niedersächsischen Forstlichen Versuchsanstalt: Frankfurt am Main, Germany, 1989. [Google Scholar]
  35. Dmyterko, E. Methods of assessing damage in oak stands. Sylwan 1998, 10, 29–38. [Google Scholar]
  36. Thien, S.J. A flow diagram for teaching texture by feel analysis. J. Agron. Educ. 1979, 8, 54–55. [Google Scholar]
  37. Anderson, D.W.; Saggar, S.; Bettany, J.R.; Stewart, J.W.B. Particle size fractionation and their use in studies of Soil Organic Matter: I. The Nature and Distribution of Forms of Carbon, Nitrogen, and Sulfur. Soil Sci. Soc. Am. J. 1981, 48, 298–301. [Google Scholar] [CrossRef]
  38. Schlichting, E.; Blume, H.P.; Stahr, K. Bodenkundliches Praktikum; Blackwell Wissenschafts-Verlag: Berlin, Germany, 1995. [Google Scholar]
  39. R Core Team. R A Language and Environment for Statistical Computing; R Foundation for Statistical Computing: Vienna, Austria, 2012; Available online: http://www.R-project.org/ (accessed on 15 November 2018).
  40. Oksanen, J.; Blanche, F.G.; Kindt, R.; Legendre, P.; Minchin, P.R.; O’hara, R.B. Vegan: Community Ecology Package. R Package Version 2.4-2. Available online: https://cran.r-project.org/web/packages/vegan/index.html (accessed on 15 November 2018).
  41. Courty, P.E.; Breda, N.; Garbaye, J. Relation between oak tree phenology and the secretion of organic matter degrading enzymes by Lactarius quietus ectomycorrhizas before and during bud break. Soil Biol. Biochem. 2007, 39, 1655–1663. [Google Scholar] [CrossRef]
  42. Jakucs, E.; Eros-Honti, Z. Morphological-anatomical characterization and identification of Tomentella ectomycorrhizas. Mycorrhiza 2008, 18, 277–278. [Google Scholar] [CrossRef]
  43. Eyre, C.; Muftah, W.; Hiscox, J.; Hunt, J.; Kille, P.; Boddy, L.; Rogers, H.J. Microarray analysis of differential gene expression elicited in Trametes versicolor during interspecific mycelial interactions. Fungal Biol. 2010, 114, 646–660. [Google Scholar] [CrossRef]
  44. Mac Nally, R.C. Ecological Versatility and Community Ecology; Cambridge University Press: Cambridge, UK, 1995. [Google Scholar]
  45. Pena, R.; Lang, C.; Naumann, A.; Polle, A. Ectomycorrhizal identification in environmental samples of tree roots by Fourier-transform infrared (FTIR) spectroscopy. Front. Plant Sci. 2014, 5, 229. [Google Scholar] [CrossRef] [PubMed]
  46. Kurtzman, C.; Fell, J.W.; Boekhout, T. The Yeasts: A Taxonomic Study; Elsevier: Amsterdam, The Netherlands, 2011. [Google Scholar]
  47. Ainsworth, M. Antrodia ramentacea on Salix in s.e. England. Field Mycol. 2001, 2, 46–49. [Google Scholar] [CrossRef]
  48. Yurkov, A.; Wehde, T.; Kahl, T.; Begerow, D. Aboveground Deadwood Deposition Supports Development of Soil Yeasts. Diversity 2012, 4, 453–474. [Google Scholar] [CrossRef] [Green Version]
  49. Chlebicki, A. Fungi on higher plants of the upper limit of alpine zone in Tian Shan. Mycotaxon 2010, 110, 451–454. [Google Scholar] [CrossRef]
  50. Itoo, Z.A.; Reshi, Z.A.; Andrabi, K.I. Characterization and identification of Russula firmula and Russula postiana from Himalayan moist temperate forests of Kashmir. Afr. J. Biotechnol. 2013, 12, 3643–3647. [Google Scholar]
  51. Folman, L.B.; Klein Gunnewiek, P.J.A.; Boddy, L.; de Boer, W. Impact of white-rot fungi on numbers and community composition of bacteria colonizing beech wood from forest soil. FEMS Microbiol. Ecol. 2008, 63, 181–191. [Google Scholar] [CrossRef] [Green Version]
  52. McLaughlin, D.J.; Spatafora, J.W. Systematics and Evolution; Springer Science and Business Media: Berlin, Germany, 2013. [Google Scholar]
  53. Murat, C.; Vizzini, A.; Bonfante, P.; Mello, A. Morphological and molecular typing of the below-ground fungal community in a natural Tuber magnatum truffle-ground. FEMS Microbiol. Lett. 2005, 245, 307–313. [Google Scholar] [CrossRef] [PubMed]
  54. Cabral, A.; Groenewald, J.Z.; Cecília, R.; Oliveira, H.; Crous, P.W. Cite as Cylindrocarpon root rot: Multi-gene analysis reveals novel species within the Ilyonectria radicicola species complex. Mycol. Prog. 2012, 11, 655–688. [Google Scholar] [CrossRef]
  55. Bushley, KE.; Raja, R.; Jaiswal, P.; Cumbie, J.S.; Nonogaki, M.; Boyd, A.E.; Owensby, C.A.; Knaus, B.J.; Elser, J.; Miller, D.; et al. The Genome of Tolypocladium inflatum: Evolution, Organization, and Expression of the Cyclosporin Biosynthetic Gene Cluster. PLoS Genet. 2013, 9, e1003496. [Google Scholar] [CrossRef]
  56. Ellis, M.B.; Ellis, J.P. Microfungi on Land Plants an Identification Handbook; Richmond Publishing: Puebla, Mexico, 1997. [Google Scholar]
  57. Healy, R.; Hobart, C.; Tocci, G.E.; Bóna, L.; Merényi, Z.; Paz Conde, A.; Smith, M.E. Fun with the discomycetes: Revisiting collections of Korf’s anamorphic Pezizales and Thaxter’s New England truffles leads to a connection between forms and the description of two new truffle species: Pachyphlodes pfisteri and P. nemoralis. Ascomycete 2015, 7, 357–366. [Google Scholar]
  58. Suz, L.M.; Barsoum, N.; Benham, S.; Dietrich, H.P.; Fetzer, K.D.; Fischer, R.; García, P.; Gehrman, J.; Kristöfel, F.; Manninger, M.; et al. Environmental drivers of ectomycorrhizal communities in Europe’s temperate oak forests. Mol. Ecol. 2014, 23, 5628–5644. [Google Scholar] [CrossRef]
  59. Fodor, E.; Timofte, A.; Geambau, T. Mycorrhizal status of several Quercus species in Romania (Quercus cerris, Q. frainetto, Q. robur) and the optimization perspective of growth conditions for in vitro propagated plants transplanted in the field. Ann. For. Res. 2011, 54, 57–71. [Google Scholar]
  60. Bakker, M.R.; Garbaye, J.; Nys, C. Effect of liming on the ectomycorrhizal status of oak. For. Ecol. Manag. 2000, 126, 121–131. [Google Scholar] [CrossRef]
  61. Børja, I.; Nilsen, P. Long term effect of liming and fertilization on ectomicorrhizal colonization and tree growth in old scots pine (Pinus sylvestris L.) stand. Plant Soil 2009, 314, 109–119. [Google Scholar] [CrossRef]
  62. Nowotny, I.; Dähne, J.; Klingelhöfer, D.; Rothe, G.M. Effect of artificial soil acidification and liming on growth and nutrient status of mycorrhizal roots of Norway spruce (Picea abies [L.] Karst.). Plant Soil 1998, 199, 29–40. [Google Scholar] [CrossRef]
  63. Marx, D.H.; Zak, B. Effect of pH on mycorrhizal formation of slash pine in aseptic culture. For. Sci. 1965, 11, 66–75. [Google Scholar]
  64. Erland, S.; Söderström, B. Effect of liming on ectomycorrhizal fungi infecting Pinus sylvestris L. 1. Mycorrhizal infection in limed humus in the laboratory and isolation of fungi from mycorrhizal roots. New Phytol. 1991, 115, 675–682. [Google Scholar] [CrossRef]
  65. Tedersoo, L.; Bahram, M.; Polme, S.; Koljalg, U.; Yorou, N.S.; Wijesundera, R. Global diversity and geography of soil fungi. Science 2014, 346, 1078. [Google Scholar] [CrossRef]
  66. Iwanski, M.; Rudawska, M.; Leski, T. Mycorrhizal associationns of nursery grown Scots pine (Pinus sylvestris L.) seedlings in Poland. Ann. For. Sci. 2006, 639, 715–724. [Google Scholar] [CrossRef]
  67. Bougher, N.L.; Grove, T.S.; Malajczuk, N. Growth and phosphorus acquisition of karri (Eucalyptus diversicolor F. Muell.) seedlings inoculated with ectomycorrhizal fungi in relation to phosphorus supply. New Phytol. 1990, 114, 77–85. [Google Scholar] [CrossRef]
  68. Ibáñez, B.; Gómez-Aparicio, L.; Ávila, J.M.; Pérez-Ramos, I.M.; García, L.V.; Marañón, T. Impact of tree decline on spatial patterns of seedling-mycorrhiza interactions: Implications for regeneration dynamics in Mediterranean forests. For. Ecol. Manag. 2015, 353, 1–9. [Google Scholar] [CrossRef] [Green Version]
  69. Giltrap, N.J.; Lewis, D.H. Inhibition of growth of Ectomycorrhizal Fungi in culture by phosphate. New Phytol. 1981, 87, 669–675. [Google Scholar] [CrossRef]
  70. Smith, S.E.; Read, D.J. Mycorrhizal Symbiosis; Academic Press: Amsterdam, The Netherlands, 2008. [Google Scholar]
  71. Baier, R.; Ettl, R.; Hahn, C.; Göttlein, A. Early development and nutrition of Norway spruce (Picea abies (L.) Karst.) seedlings on different seedbeds in the Bavarian limestone Alps—A bioassay. Ann. For. Sci. 2006, 63, 339–348. [Google Scholar] [CrossRef]
  72. Pregitzer, K.S.; Hendrick, R.L.; Fogel, R. The demography of fine roots in response to patches of water and nitrogen. New Phytol. 1993, 125, 575–580. [Google Scholar] [CrossRef] [Green Version]
  73. Kjøller, R.; Nilsson, L.-O.; Hansen, K.; Schmidt, I.K.; Vesterdal, L.; Gundersen, P. Dramatic changes in ectomycorrhizal community composition, root tip abundance and mycelial production along a stand-scale nitrogen deposition gradient. New Phytol. 2012, 194, 278–286. [Google Scholar] [CrossRef] [Green Version]
  74. Arnebrant, K. Nitrogen amendments reduce the growth of extramatrical ectomycorrhizal mycelium. Mycorrhiza 1994, 5, 7–15. [Google Scholar] [CrossRef]
  75. Nilsson, L.O.; Wallander, H. Production of external mycelium by ectomycorrhizal fungi in a Norway spruce forest was reduced in response to nitrogen fertilization. New Phytol. 2003, 158, 409–416. [Google Scholar] [CrossRef]
  76. Thomas, F.M.; Blank, R. The effect of excess nitrogen and of insect defoliation on the frost hardiness of bark tissue of adult oaks. Ann. For. Sci. 1996, 53, 395–406. [Google Scholar] [CrossRef] [Green Version]
  77. Richard, F.; Roy, M.; Shahin, O.; Sthultz, C.; Duchemin, M.; Joffre, R.; Selosse, M. Ectomycorrhizal communities in a Mediterranean forest ecosystem dominated by Quercus ilex: Seasonal dynamics and response to drought in the surface organic horizon. Ann. For. Sci. 2011, 68, 57–68. [Google Scholar] [CrossRef]
  78. O’Hanlon, R.; Harrington, T.J. The macrofungal diversity and community of Atlantic oak (Quercus petraea and Q. robur) forests in Ireland. Anales del Jardín Botánico de Madrid 2012, 69, 107–117. [Google Scholar] [CrossRef]
  79. Trocha, L.K.; Kałucka, I.; Stasińska, M.; Nowak, W.; Dabert, M.; Leski, T.; Rudawska, M.; Oleksyn, J. Ectomycorrhizal fungal communities of native and non-native Pinus and Quercus species in a common garden of 35-year-old trees. Mycorrhiza 2012, 22, 121–134. [Google Scholar] [CrossRef]
  80. Keizer, P.J.; Arnolds, E. Succession of ectomycorrhizal fungi in roadside verges planted with common oak (Quercus robur L.) in Drenthe, The Netherlands. Mycorrhiza 1994, 4, 147–159. [Google Scholar] [CrossRef]
  81. Finlay, R.D.; Söderström, B. Mycorrhiza and carbon flow to the soil. In Mycorrhizal Functioning an Integrative Plant-Fungal Process; Allen, M.J., Ed.; Chapman and Hall: New York, NY, USA, 1992; pp. 134–160. [Google Scholar]
  82. Mosca, E.; Montecchio, L.; Sella, L.; Garbaye, J. Short-term effect of removing tree competition on the ectomycorrhizal status of a declining pedunculate oak forest (Quercus robur L.). For. Ecol. Manag. 2007, 244, 129–140. [Google Scholar] [CrossRef]
  83. Hagerman, S.H.; Sakakibara, S.M.; Durall, D.M. The potential for woody understory plants to provide refuge for ectomycorrhizal inoculum at an interior Douglas-fir forest after clear-cut logging. Can. J. For. Res. 2001, 31, 711–721. [Google Scholar] [CrossRef]
  84. Leski, T.; Rudawska, M.; Aučina, A. The ectomycorrhizal status of European larch (Larix decidua Mill.) seedlings from bareroot forest nurseries. For. Ecol. Manag. 2008, 256, 2136–2144. [Google Scholar] [CrossRef]
  85. Rudawska, M.; Leski, T.; Stasinska, M. Species and functional diversity of ectomycorrhizal fungal communities on Scots pine (Pinus sylvestris L.) trees on three different sites. Ann. For. Sci. 2011, 68, 5–15. [Google Scholar] [CrossRef]
  86. Rousseau, J.V.D.; Sylvia, D.M.; Fox, A.J. Contribution of ectomycorrhizal to the potential nutrient-absorbing surface of pine. New Phytol. 1994, 128, 639–644. [Google Scholar] [CrossRef]
  87. Hobbie, E.A.; Agerer, R. Nitrogen isotopes in ectomycorrhizal sporocarps correspond to belowground exploration types. Plant Soil 2010, 327, 71–83. [Google Scholar] [CrossRef]
  88. Shahin, O.; Martin-St, P.N.; Rambal, S.; Joffre, R.; Richard, F. Ectomycorrhizal fungal diversity in Quercus ilex Mediterranean woodlands: Variation among sites and over soil depth profiles in hyphal exploration types, species richness and community composition. Symbiosis 2013, 61, 1–12. [Google Scholar] [CrossRef]
  89. Moeller, H.V.; Peay, K.G.; Fukami, T. Ectomycorrhizal fungal traits reflect environmental conditions along a coastal California edaphic gradient. FEMS Microbiol. Ecol. 2013, 87, 797–806. [Google Scholar] [CrossRef] [Green Version]
  90. Van Schöll, L.; Kuyper, T.W.; Smits, M.M.; Landeweert, R.; Hoffland, E.; Van Breemen, N. Rock-eating mycorrhizas: Their role in plant nutrition and biogeochemical cycles. Plant Soil 2008, 303, 35–47. [Google Scholar] [CrossRef]
  91. Laiho, O. Paxillus involutus as a mycorrhizal symbiont of forest trees. Acta For. Fenn. 1970, 106, 1–65. [Google Scholar] [CrossRef]
  92. Conjeaud, C.; Scheromm, P.; Mousain, D. Effects of phosphorus and ectomycorrhiza on maritime pine seedlings (Pinus pinaster). New Phytol. 1996, 133, 345–351. [Google Scholar] [CrossRef] [PubMed]
  93. Bakker, M.R. Fine-root parameters as indicators of sustainability of forest ecosystems. For. Ecol. Manag. 1999, 122, 7–16. [Google Scholar] [CrossRef]
  94. Johnson, N.C.; Graham, J.H.; Smith, F.A. Functioning of mycorrhizal associations along the mutualism-parasitism continuum. New Phytol. 1997, 135, 575–585. [Google Scholar] [CrossRef] [Green Version]
  95. Jung, T.; Blaschke, H.; Osswald, W. Involvement of soilborne Phytophthora species in Central European oak decline and the effect of site factors on the disease. Plant Pathol. 2000, 49, 706–718. [Google Scholar] [CrossRef] [Green Version]
Figure 1. Localities of the forest districts. The three study sites, Karczma Borowa (KB), Krotoszyn (K) and Piaski (P), are shown on the map of the Krotoszyn Plateau, where the oak stands were analysed. The inset map shows the location of the Krotoszyn Plateau in Poland.
Forests 10 00030 g001
Figure 2. Abundance of vital mycorrhizal (VM), non-vital (NV) and vital non-mycorrhizal (NM) root tips [%] in declining oak stands in the forest districts Karczma Borowa (KB), Krotoszyn (K), and Piaski (P) (n = 60 trees per site). Within each tip classification the different letters indicate significant differences among sites (Tukey´s contrast, p = 0.05).
Forests 10 00030 g002
Figure 3. Ectomycorrhiza observed on Q. robur trees from three stands: Karczma Borowa (KB), Krotoszyn (K) and Piaski (P). (a) Paxillus involutus, (b) Lactarius quietus, (c) Russula ochroleuca, (d) Lactarius chrysorrheus, (e) Tomentella sublilacina, (f) Tuber sp., (g) Amanita citrina, (h) Cenoccocum-like, (i) Scleroderma citrinum, (j) Boletus badius, (k) Thelephora terrestris, (l) Pachyphlodes nemoralis, (m) Russula fragilis, (n) Xerocomus subtomentosus, (o) Inocybe assimilate, (p) Russula lepida, (q) Xerocomus pruinatus, (r) Hydnotrya tulasnei. Bars 1 mm.
Forests 10 00030 g003
Figure 4. Relative abundances [%] of each mycorrhizal fungal taxa associated with Q. robur stands at three study sites: Karczma Borowa (KB), Krotoszyn (K) and Piaski (P).
Forests 10 00030 g004
Figure 5. Mean relative abundance of taxa with different exploration types associated with Q. robur at three study sites: Karczma Borowa (KB), Krotoszyn (K) and Piaski (P). Within each tip classification the different letters indicate significant differences among sites (Tukey´s contrast, p = 0.05).
Forests 10 00030 g005
Figure 6. Canonical correspondence analysis (CCA) of the different exploration types and soil properties. Sand (2–0.05 mm), coarse silt (0.05–0.02 mm), fine silt (0.02–0.002 mm), clay (<0.002 mm), fraction contained (%) <0.02 mm.
Forests 10 00030 g006
Figure 7. Canonical correspondence analysis (CCA) of the abundance of different root tip types (vital mycorrhizal (VM), non-vital (NV) and vital non-mycorrhizal (NM)) and soil properties and biometrical data relationship. FRT—fine root tips, MRL—mother root length, TRL—total root length, FRL—fine root length, DWFR—dry weight of fine roots, DWMR—dry weight of mother roots, CT—crown transparency index, Humidity—relative soil humidity.
Forests 10 00030 g007
Figure 8. Health condition of Q. robur stands at 3 sites: KB—Karczma Borowa, K—Krotoszyn and P—Piaski. Health condition was determined based on crown transparency along with crown vitality (in 5% intervals across the range of 0–100%). The following degrees of foliage damage were adopted according to a modified ICP forest classification: 0—healthy (0–10% defoliation), 1—weakened (11%–25% defoliation), 2—moderate damage (26%–60%) and 3—dying (>60% defoliation). Within each tip classification the different letters indicate significant differences among sites (Tukey´s contrast, p = 0.05).
Forests 10 00030 g008
Table 1. Characteristics of the oak forests at the three sites studied in the western part of Poland (Krotoszyn Plateau).
Forest InspectorateKarczma BorowaKrotoszynPiaski
Geographic coordinates51°50′51″ N, 16°37′34″ E51°42′11″ N, 17°33′52″ E51°49′36.4″ N 17°06′46.6″ E
Elevation (m)77 m.a.s.l127 m.a.s.l58 m.a.s.l
Area size (ha)550.05
Average annual temperature (°C)8.38.08.5
Average annual precipitation (mm)550450550
Length of the growing season (days)226210220
Bedrockglacial clayglacial tillsmoraine clay
Soil typeluvisolsbrown soilbrown rendzinas
Age of stands (years)12012060
Forest standQuercus robur (60%), Corylus avellana (10%), Carpinus betulus (30%), sparse natural regenerationQuercus robur (70%), Corylus avellana (10%), Carpinus betulus (20%)Quercus robur (70%), Picea abies (30%)
Plant communityGalio silvatici-CarpinetumPotentillo albae-Quercetum LibbTilio Carpinetum
Past history and status of standstimber forests
planted in previously oak stands
Ground water statusdepended on precipitation
Table 2. Estimated species richness, diversity and occurrence of fungal taxa associated with the roots of oak stands in the Krotoszyn Plateau, Poland. Data indicate the frequency (Freq.; percent of colonised plants) and abundance (Abun.; percent of mycorrhizal roots colonised) of fungal taxa on the root tips of declining oak trees in three forest stands: Karczma Borowa (KB), Krotoszyn (K) and Piaski (P). Abbreviations: ECM—ectomycorrhizal fungus, Pl path—plant pathogen, Sapr—saprotroph, An par—animal parasite, So fung—soil fungus, Endoph—endophyte.
IdentificationBLAST Top-Hit Site
Closest MatchNCBIIdentity [%]Putative EcologyReferences *KB [n = 60]K [n = 60]P [n = 60]
Freq.Abun.Freq.Abun.Freq.Abun.
Basidiomycota
Paxillus involutusPaxillus involutusKT33465599ECM[28]60.08.773.316.380.012.8
Russula ochroleucaRussula ochroleucaKT334671100ECM[28]15.02.935.04.625.05.1
Lactarius quietusLactarius quietusKT33468499ECM[41]16.75.116.74.926.75.7
Tomentella sublilacinaTomentella sublilacinaKT334657100ECM[42]11.73.05.00.15.01.4
Lactarius chrysorrheusLactarius chrysorrheusKT334686100ECM[28]8.32.55.01.25.01.1
Scleroderma citrinumScleroderma citrinumKT33475799ECM[28]5.00.43.30.26.71.6
Amanita citrinaAmanita citrinaKT33469299ECM[28]3.30.81.70.11.70.2
Thelephora terrestrisThelephora terrestrisKT33474399ECM[28]1.70.2--5.00.1
Trametes versicolorTrametes versicolorKT33466099Sapr[43]--3.30.61.70.1
Russula lepidaRussula lepidaKT33467299ECM[44]--3.30.3--
Xerocomus pruinatusXerocomus pruinatusKT334702100ECM[45]----5.00.5
Xerocomus subtomentosusXerocomus subtomentosusKT334687100ECM[28]3.30.4----
Xerocomus badiusXerocomus badiusKT334738100ECM[28]1.70.021.70.1--
Sporidiobolus metaroseusSporidiobolus metaroseusKT334689100Endoph[46]--1.70.5--
Antrodia ramentaceaAntrodia ramentaceaKT334658100Sapr[47]----1.70.6
Cryptococcus terricolaCryptococcus terricolaHE86371499Sapr[48]--1.70.3--
Lagarobasidium detriticumLagarobasidium detriticumKT33469199Sapr[49]----1.70.5
Russula fragilisRussula fragilisKT334670 99ECM[50]1.70.3----
Inocybe assimilataInocybe assimilataFN39314799ECM[28]1.70.2----
Hypholoma fasciculareHypholoma fasciculareKT33467699Sapr[51]--1.70.1--
Ascomycota
Unidentified ascomyceteUncultured ascomycete (Chaetothyriales. cf. Capronia)KT334693 98Endoph[52]3.30.13.30.13.30.1
Tuber sp.Tuber sp.KT334690 99ECM[53]1.70.045.01.41.70.2
Cenoccocum-like ECM[28]3.30.83.30.91.70.1
Ilyonectria radicicolaIlyonectria radicicolaKT33465499Pl path [54]3.31.31.70.7--
Elaphocordyceps subsessilis/Tolypocladium inflatumElaphocordyceps subsessilis/Tolypocladium inflatumJX488469/AB25560699So fung/An par[55]--3.30.4--
Cephalotheca sp.Cephalotheca sulfureaEU68926082Sapr [56]1.70.6----
Pachyphlodes nemoralisPachyphlodes nemoralisFJ013079100ECM[57]1.70.2----
Hydnotrya tulasneiHydnotrya tulasneiKT33473599ECM[58]----1.70.2
Mycorrhizal fungal species richness [n] 151112
Degree of mycorrhization [%] 25.630.229.1
Estimated species richness
Chao1 2.502.362.45
Diversity
Shannon–Wiener (H’) 0.69 a0.57 c0.65 b
Simpson 1/D 0.43 a0.35 b0.41 a
* putative ecology based on references; a, b, c letters indicate significant differences between sites at p < 0.02 (GLM test).
Table 3. Root parameters and the crown health status (±standard errors) of examined oak stands at Karczma Borowa (KB), Krotoszyn (K) and Piaski (P).
ParametersSite
KBKP
MeanSEMeanSEMeanSE
FRT = fine root tips (n)1635.7±871.254291.5±2531.703164.8±1874.07
MRL = mother root length (cm)140.0±68.49244.3±103.50188.7±140.76
Total root length (cm)1048.7±526.712036.0±899.401432.7±772.52
FRL = fine root length (cm)888.1±464.341785.3±806.921238.5±648.51
Dry weight of fine roots 2.7±1.716.3±3.073.5±1.67
Dry weight of mother roots3.8±1.317.0±3.096.3±2.22
Crown transparency (%)32.3±20.5241.1±14.0938.8±16.51
Foliage damage1.3±0.991.8±0.6481.6±0.69
Syn.1.1±0.781.5±0.511.4±0.57
Table 4. Mean values (±standard error) of selected physical and chemical properties of soil taken from oak stands in Karczma Borowa (KB), Krotoszyn (K) and Piaski (P).
Study Site
KB K P
Physical and chemical characteristicsMeanSEMeanSEMeanSE
mean pH KCl3.64±0.253.40±0.183.17±0.16
C-org. (mg/g)16.94±6.534.02±12.7465.39±32.41
Total Kjeldahl Nitrogen = N-org. + NH4-N (mg/g)0.65±0.261.44±0.622.25±1.11
C:N ratio29.7±17.226.9±13.332.8±17.1
Ca (mg/L)106.92±19.98128.62±35.8199.90±21.31
P2O5 (mg/100g)4.06±2.742.07±0.854.09±3.35
K2O (mg/100g)2.77±1.065.23±2.487.14±5.58
Mg (mg/100g)1.79±0.653.25±1.233.85±1.71
Relative soil humidity (%)16.88±4.4023.28±6.8525.79±8.51
Mineral soil particle size (fraction in %)
sand (2–0.05 mm) 83.16±8.9979.02±3.8979.09±3.85
coarse silt (0.05–0.02 mm)11.60±5.2013.27±1.9914.39±2.40
fine silt (0.02–0.002 mm)4.72±3.316.74±2.105.89±1.74
clay (<0.002 mm)0.54±0.681.00±0.470.61±0.38
fraction contained in % <0.02 mm5.27±3.977.74±2.506.34±2.16

