Management Implications of Using Brush Mats for Soil Protection on Machine Operating Trails during Mechanized Cut-to-Length Forest Operations


1
Forest Operations, Department of Ecology and Ecosystem Management, Technical University of Munich, Hans-Carl-von-Carlowitz-Platz 2, 85354 Freising, Germany
2
Faculty of Forestry and Environmental Management, University of New Brunswick, P.O. Box 4400 Fredericton, NB E3B 6C2, Canada
3
Department of Forest Work Science and Engineering, Georg-August-Universität Göttingen, Büsgenweg 4, 37077 Göttingen, Germany
*
Author to whom correspondence should be addressed.
Forests 2019, 10(1), 19; https://doi.org/10.3390/f10010019
Submission received: 20 November 2018
/
Revised: 18 December 2018
/
Accepted: 25 December 2018
/
Published: 29 December 2018
(This article belongs to the Special Issue Forest Biomass Production and Transport Planning)
Abstract
:Mechanized cut-to-length forest operations often rely on the use of brush mats created from harvesting debris (tree limbs, tops, and foliage) to reduce soil disturbances as a result of in-stand machine traffic. These brush mats, placed directly on the forest floor within machine operating trails, distribute loads of timber harvesting and extraction machinery to a greater area, thereby reducing peak pressures exerted to the ground and rutting for maintaining technical trafficability of operating trails. Forest biomass has also been promoted as a source of green and renewable energy, to reduce carbon emissions from energy production. However, to maintain sufficient quality of biomass for bioenergy operations (high heating value and low ash content), brush needs to be free of contaminants such as mineral soil. This constraint eliminates the possibility of the dual use of brush, first as a soil protective layer on machine operating trails and afterwards for bioenergy generation. Leaving machine operating trails uncovered will cause machine loads to be fully and directly applied to the soil, thus increasing the likelihood of severe soil disturbance, tree growth impediment and reducing trail trafficability. The main objective of this study was to quantify the effect of varying machine operating trail spacing and width on the amount of brush required for soil protection. This was achieved by creating five model forest stands (four mature and one immature), commonly found in New Brunswick, Canada, and using their characteristics as input in the Biomass Opportunity and Supply Model (BiOS) from FPInnovations. BiOS provided several key biomass related outputs allowing the determination of the amount of biomass available for soil protection, which was the main focus of this research. The simulation results showed that regardless of trail area tested, all four mature forest stands were able to support uniform distribution of 20 kg m−2 brush mats (green mass) throughout their entire trail network during clear-cut operations but not during partial harvests. From the three factors assessed (brush amount, trail width, and trail spacing), trail width had the highest effect on the required brush amount for trail protection, which in turn has a direct impact on the amount of brush that could be used for bioenergy generation.
1. Introduction
Traditional use of forest management and operation planning has mostly concentrated on the production of saw logs and pulpwood as raw material for the forest products industry [1]. More recently, forest biomass collected during forest operations has been promoted as a source of bioenergy to partially offset carbon dioxide (CO2) emissions from fossil fuels. This new source of potential income has drawn significant interest in establishing combined heat and power plants at existing and proposed large-scale industrial projects and for decentralized energy supply in rural settings. Due to its renewability and the closed loop carbon cycle, bioenergy created from burning forest biomass is generally considered as a CO2 neutral source of energy or as a low carbon fuel [2]. The possibility of a new source of income using forest biomass while reducing greenhouse gas (GHG) emissions for climate change mitigation is a promising avenue for lowering electricity consumption from conventional sources, especially considering electricity is the principal expense of all wood processing facilities and dwellings [3].
Thus far, the main concern reported with using forest biomass as a source of bioenergy has been the nutrient depletion of the forest stand [4]. Even though little is known about the effects of long-term nutrient removal on soil fertility and nutrient pools, there is a consensus that for intensive biomass removal, some type of negative impact is to be expected, especially on poor sites with respect to naturally available nutrients [5]. Aside from nutrient exportation away from the forest site and effects of its removal on water and microorganisms, extracting forest biomass can also influence the severity of soil disturbances caused during ground-based mechanized forest operations, in particular with the cut-to-length (CTL) method. In CTL mechanized operations, a single-grip harvester clear-cuts corridors (machine operating trails) within the stand to permit harvesting of the wood and allow the subsequent travel of forest machines, most often forwarders, for wood extraction. In addition to removing all trees within the machine operating trails, further tree removal between trails is usually required depending on the type of harvest (clear-cut, commercial thinning, shelterwood, single-tree selection, etc.) and degree of tree removal.
In the CTL method, tree processing (delimbing, bucking, and topping) by the harvester commonly occurs directly at the machine operating trail. By doing so, brush (tree limbs, tops, and foliage) resulting from processed trees is placed in front of the machine on top of the operating trail and acts as a protective layer, while wood products (saw logs, pulpwood, veneer) are placed on the side of the operating trail so as not to interfere with machine movement. The harvester is then driven over this so-called brush mat, which has the potential to significantly reduce peak pressures exerted by machines by distributing applied loads to a greater area [6,7]. Using the same machine operating trails, a forwarder is then used to extract wood products to a roadside landing. The presence of brush mats is particularly important to lower the effect of forwarder traffic on soil physical properties, since their masses amount to 15 to 50 metric tons loaded.
The use of brush as a soil protective layer during mechanized forest operations has been proven to lower average dynamic peak ground pressures [6,8], minimize soil compaction [9,10,11,12,13], reduce soil resistance to penetration [14,15], and lower rut depth [7,10,12]. Using brush mats on machine operating trails is therefore a key method of minimizing the negative effects of heavy machine traffic on forest soils.
With rising interest in utilizing forest biomass as a source of bioenergy, a new concern arises. To maintain its full calorific value at low ash content, brush used during bioenergy operations must not be contaminated by mineral soil, which would be unavoidable when using it for brush mats in direct contact with the soil. Therefore, during bioenergy operations, brush obtained from the processing phase cannot be used for both purposes, as a soil protective layer and afterwards as a source of bioenergy, but must rather be treated the same like other wood products and placed on the side of the machine operating trails, thus avoiding contact with the machine and soil. This specific requirement renders the two uses of brush mutually exclusive and leaves machine operating trails exposed to direct and maximum dynamic peak loadings of forest machinery during bioenergy operations. The competitive use of brush for soil protection and bioenergy will most likely become more important as markets for bioenergy are further developed and methods of transporting and converting brush to biofuel become more efficient.
The uncertainty associated with using brush as a soil protective layer is that the quantity and quality of brush available for soil protection is directly related to site quality, stand characteristics (species, age, diameter at breast height (dbh), and height), silvicultural treatment, and degree of tree removal. In addition, the spatial distribution and continuity of brush mats placed on machine operating trails will not only vary on the location, number, and characteristics of harvested and processed trees, but also on machine characteristics and the susceptibility of the soil to disturbance. On soils with high bearing capacity (coarse textured soil at low moisture contents), the application of a brush mat might have a negligible effect whereas thick brush mats will likely be essential on highly trafficked areas with low bearing capacity (soils with degree of fines, high soil moisture content, organic soils, etc.).
Computer software such as the Biomass Opportunity and Supply Model (BiOS) [16] and EnerTree [17] have been developed to estimate available forest biomass, usually expressed in oven dry tons per hectare (ODT ha−1), obtained from mechanized forest operations [18]. Once brush required for efficient soil protection is determined and reserved for use on machine operating trails, the remaining amount of biomass available for bioenergy can be calculated. This research estimated total available biomass (brush) mass under varying stand conditions to give insight into brush amounts useable for brush mats and/or bioenergy generation. The following study objectives were addressed:
- Determine total biomass and on-the-ground biomass availability based on different stand types commonly found in eastern Canada and the percent of tree removal (level of harvesting).
- From available on-the-ground biomass, determine maximum applicable brush mat amount (kg m−2) for varying trail spacing, trail width, and degree of trail coverage.
- Determine the amount of biomass remaining for other uses, such as bioenergy, once different amounts of biomass have been reserved for soil protection.
In this article, we refer to trail spacing as the mean horizontal distance between two adjacent machine operating trail centrelines. Trail width, measured perpendicular to the direction of machine travel, is defined as the horizontal distance separating the outside boundaries of a machine operating trail. Since most published material expresses brush mat amounts in green mass, outputs obtained from BiOS and presented in this article (ODT ha−1) were all converted to green mass (green ton per hectare; GT ha−1 or kg m−2) using a 50% water content (in relation to green mass).
2. Materials and Methods
2.1. Biomass Opportunity and Supply Model (BiOS)
BiOS was developed by FPInnovations to estimate the cost of biomass delivered to a conversion plant from various biomass harvesting operations [16]. The model is divided into the following modules: stand type, supply flow, harvesting, cutover handling, roadside and satellite yard handling, and transport. Once stand information is entered (age, stocking, average tree dbh and height per species, and species composition), BiOS uses species-specific single-tree equations for biomass and merchantable timber volume estimates, with a 10-cm diameter threshold between commercially usable timber and brush [16,18]. Users can then select operational parameters of the treatment (site conditions and history) and the biomass harvesting system, thus ultimately allowing the determination of the cost of biomass supply. During our simulations, every stand was assigned the same site conditions; ground strength class 3 (moderate: fresh drainage; fine sands, sandy silt, or clay loams; fluvial or lacustrine surface deposits) on a scale of 1 to 5 (5 being poor condition) and ground roughness as class 1 (very even: obstacle height of 10 to 30 cm, and fewer than 4 such obstacles per 100 m2) on a scale of 1 to 5 (5 being very rough). A level 1 terrain slope (0–9%) was also chosen for all stands.
Afterwards, the model uses decision parameters to divide the total biomass available into useable biomass to be harvested. From the total biomass, conventional merchantable timber volume is removed leaving the potentially available biomass, which is further separated by location (cutover biomass or roadside biomass). In CTL mechanized operations, the entire potentially available biomass found is identified as cutover biomass since tree processing occurs at the felling site (in-stand). The cutover biomass is also separated as “standing” or “on-the-ground” biomass depending on the degree of tree removal. During a clear-cut operation (100% of merchantable trees removed), potentially available biomass equals cutover biomass, which in turn is identical to the on-the-ground biomass; the latter is the focal point of this article. BiOS was used to estimate the amount of biomass available in five hypothetical forest stands commonly found in the province of New Brunswick (NB), Canada. From the total biomass, applicable biomass (on-the-ground biomass) for soil protection was obtained and the effect of varying machine operating trail density on required brush mat amount for trail protection was analyzed.
2.2. Stand Description
Based on normal yield tables [19], 2 artificially and 3 naturally regenerated stands were simulated (Table 1). These simulations assume normal tree distribution within the stand and include the stand attributes: species, composition, age, height, dbh, stocking, and area to be harvested. Species chosen were black spruce Picea mariana (Mill.) B.S.P., white spruce Picea glauca (Moench) Voss, balsam fir Abies balsamea (L.) Mill., Eastern white-cedar Thuja occidentalis L., Larch Larix laricina (Du Roi) K. Koch, sugar maple Acer saccharum Marsh., red maple Acer rubrum L., yellow birch Betula alleghaniensis Britton, white birch Betula papyrifera Marsh., beech Fagus grandifolia Ehrh., and poplar Populus tremuloides Michx. We attempted to create stand types commonly linked to different soil conditions and requirements. For example, black spruce stands are frequently found in low-lying areas with relatively high soil moisture and organic content and reduced soil bearing capacity, whereas the deciduous stand requiring rich and deep soils would most likely be on higher, more stable ground. With an increasing level of commercial thinning operations in NB, we also assessed biomass availability of a 35-year-old white spruce plantation.
2.3. Management and Operational Considerations
For efficient soil protection during mechanized forest operations, the allocation of brush should consider management and operational criteria. Since over 75% of wood harvested in Atlantic Canada utilizes the CTL method and the creation of brush mats is common due to the location of tree processing (in-stand), focus will be directed to this harvesting method. Machine operating trail width and spacing depend on machine-related variables, in particular, the width of the widest machine using the trail system (usually the forwarder) and harvester boom length in the case where fully mechanized operations are targeted (no motor-manual operation within the leave strip). For this reason, trail spacings of 16, 18, 20, and 22 m (distances from mid-trail to mid-trail) and trail widths of 3.0, 3.5, 4.0, and 4.5 m will be assessed to provide information applicable to different machine sizes (Table 2). Variation of trail spacing and width directly influence the area of a harvesting block covered by trails and the corresponding amount of brush required for protecting that respective trail network.
Brush mat requirements for a particular operation depend on soil bearing capacity, mostly determined by soil texture, organic matter content and soil moisture content at time of operation, machine surface contact pressure, traffic frequency, and expected spatial distribution of machine traffic over the entire trail network. Understanding the interaction between these parameters in addition to operator experience is important in determining the appropriate amount of brush to be placed on the trail as a covering layer. As a result, efficient spatial distribution of brush over a trail network is mostly addressed on a stand-by-stand approach. The 6 brush mat amounts used for calculations (5, 10, 15, 20, 25, and 30 kg m−2) were selected based on previous studies where identical brush amounts were subjected to forwarder traffic while load distribution was recorded below the mats [6,7,8,15].
The amount of brush applicable on machine operating trails was evaluated based on the percentage (100, 75, 50, and 25%) of trail area covered in brush. If the number of trees to be harvested within the reach of the harvester’s boom is not sufficient to attain the required brush mat amount for soil protection, relocation of brush within a harvesting block may be considered if it is operationally and economically feasible. In this instance, different degrees of trail coverage by brush (i.e., 25 to 75% trail coverage) could be applied focussing, for example, on depressed trail segments with naturally accumulating soil moisture prone to rutting. Allowing brush relocation does require the use of a forwarder or harvester to transport brush to trail segments requiring additional support. If such relocation is not permissible, trail coverage of 100% (based on average distribution of harvested trees) will be the option applied by default.
The amount of on-the-ground biomass available to be used as soil protection will be presented using two approaches. First, the 5 forest stands modelled in BiOS will be used to provide brush availability on a kilogram per square meter (green mass) of trail area basis. Second, as a more operator-friendly method, brush availability will be converted to the number of trees requiring on-trail delimbing in order to reach different target brush amounts. This latter approach is based on average biomass (limbs, tops, and foliage) available on an individual tree basis that can be reached at boom’s length. Brush mat thickness could also be used as a general criterion to assess brush mat amount. However, the thickness of a brush mat highly depends on the species composition, the size of branches, and the proportion of treetops [8].
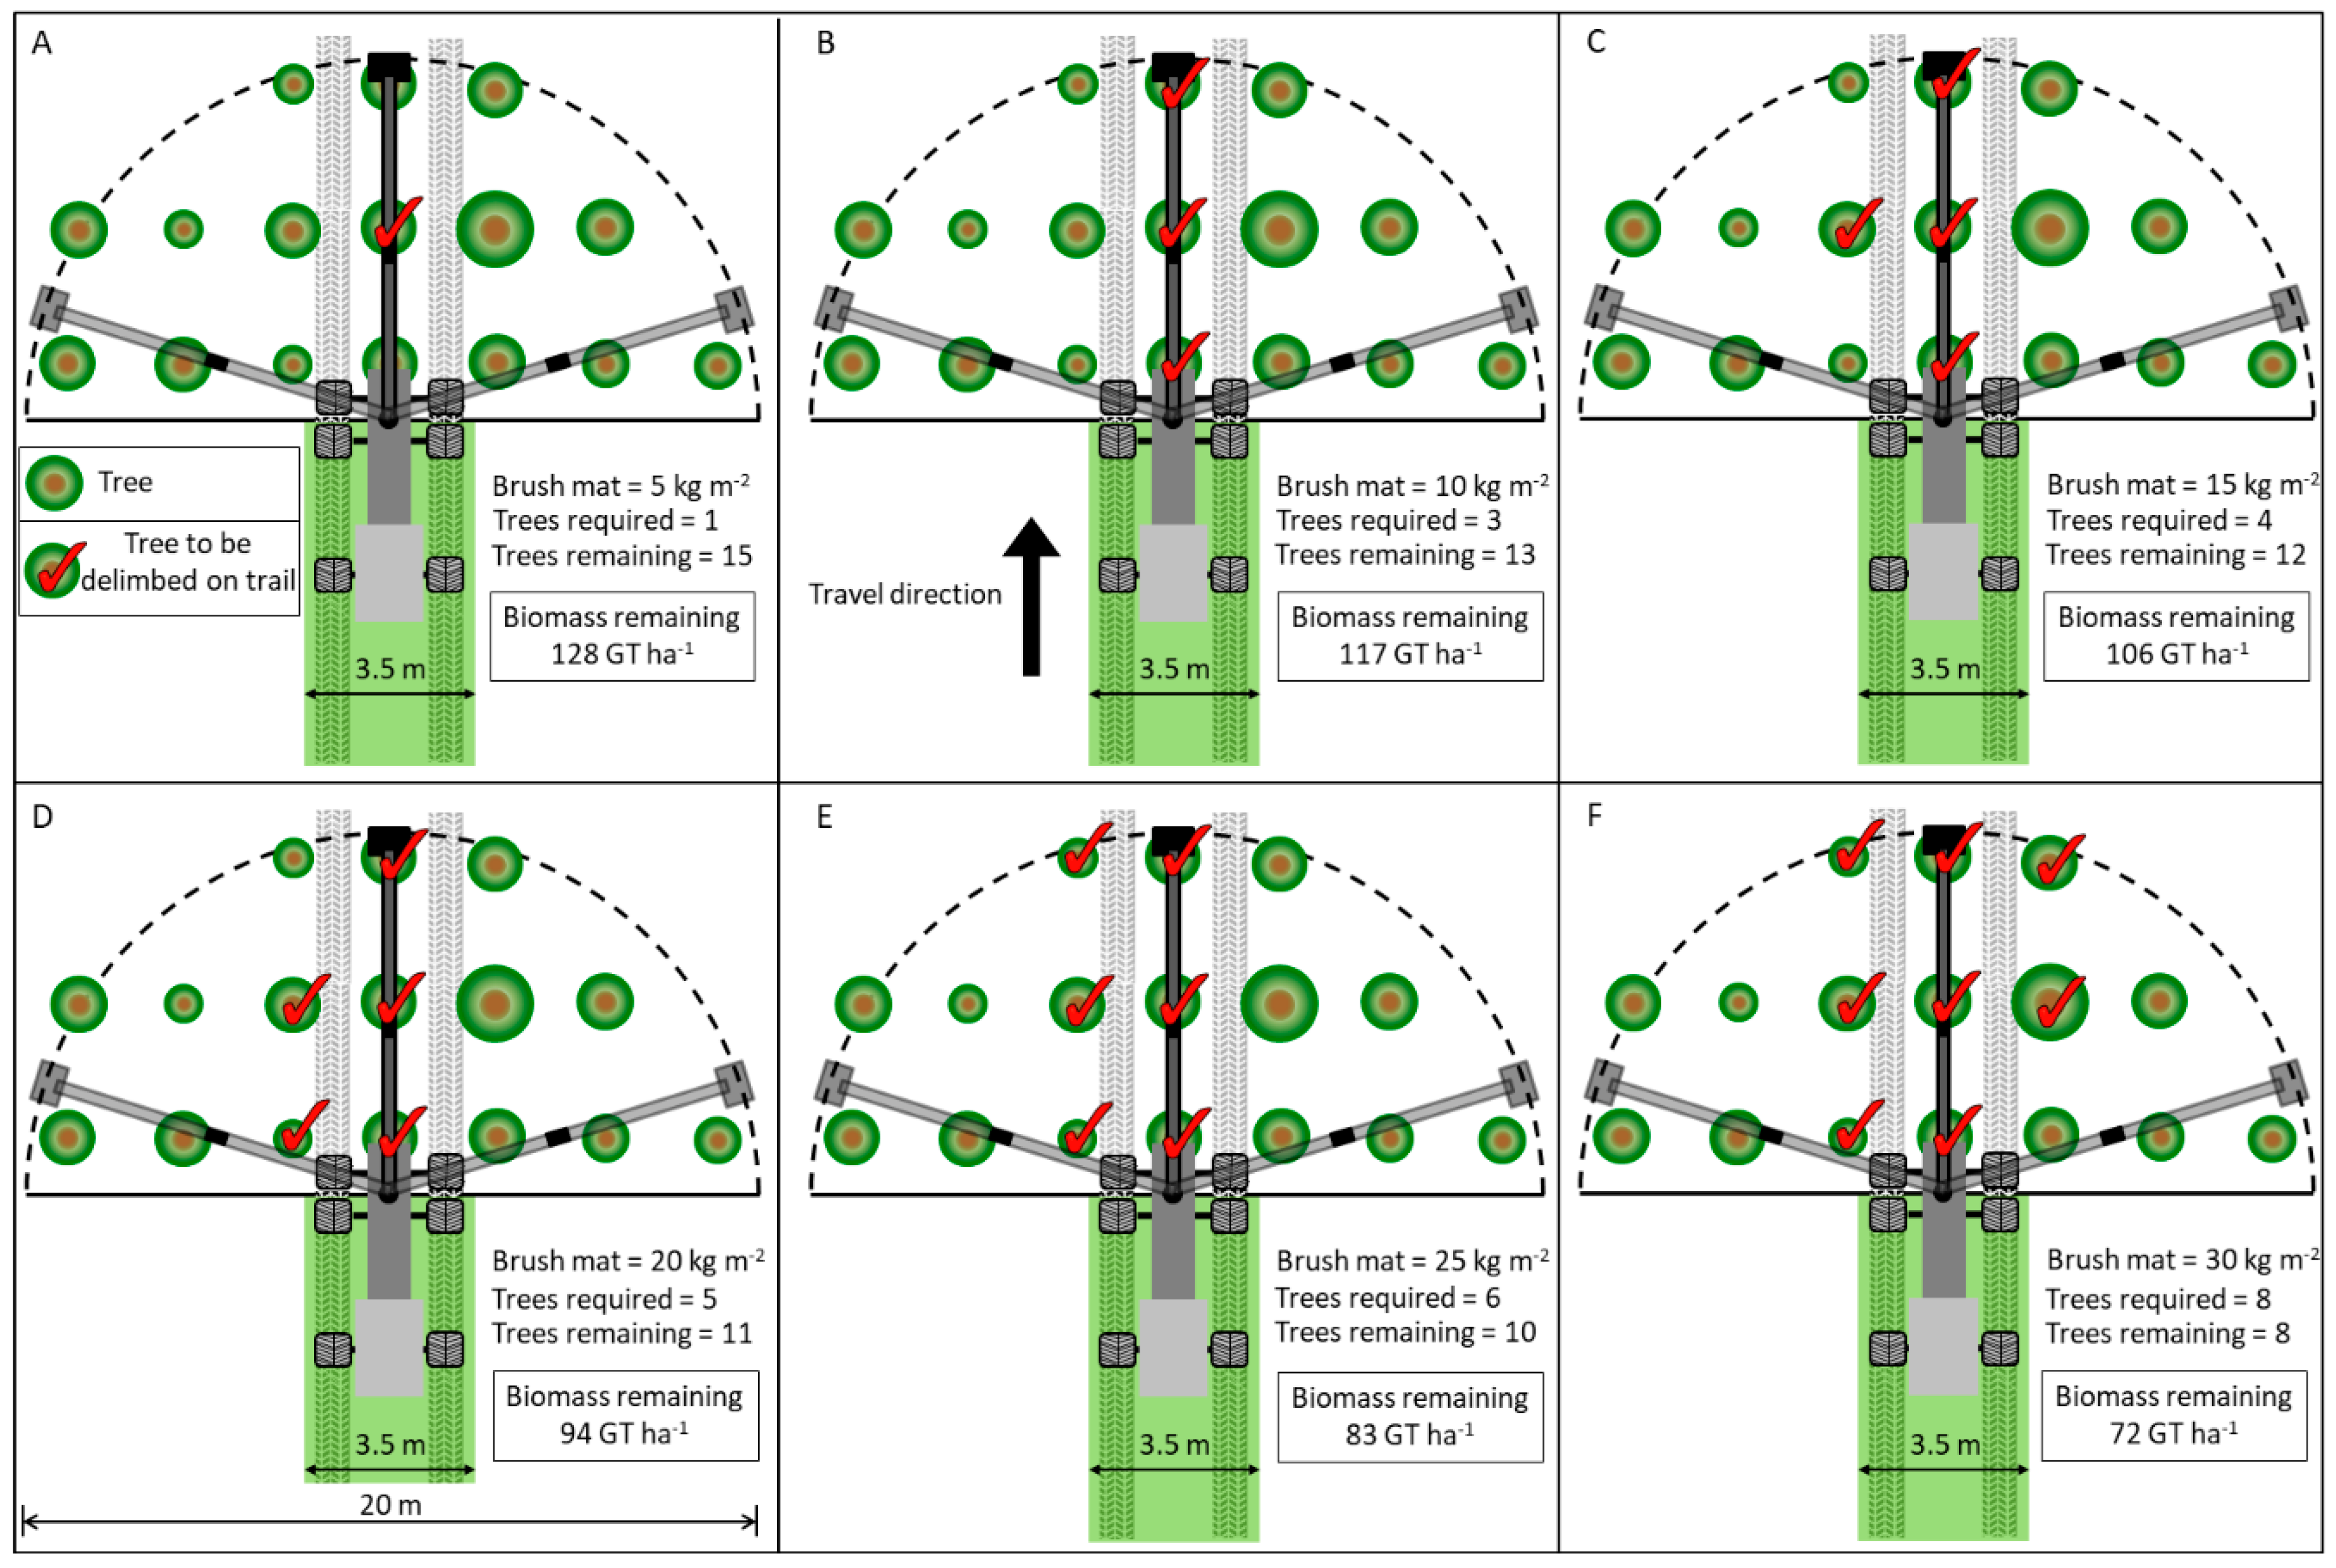
Full coverage of brush mats on machine operating trails is not always practical nor is it required. However, in instances where a soil of low bearing capacity is encountered or areas where high traffic frequencies are expected, additional brush might be needed. To quantify the maximum amount of brush applicable on a restricted trail segment, we considered maximum reach of the boom as half the distance of the trail spacing (Table 2) and determined the area covered by a half circle “sweep” of the boom at full boom extension on brush availability to be placed on a 5-m-long trail segment (concept displayed in Figure 1). For example, a 10-m boom (20-m trail spacing) capable of harvesting trees within half of a 10-m radius circle would equal an area of 157.1 m2. We limited the area to a half circle since not all harvesters allow full 360° boom rotation from the central pivot point and extending the area beyond a half circle would significantly increase boom movement between the location of harvested trees and the delimbing area in front of the harvester, thus reducing machine productivity. From this area accessible by the boom without any harvester travel, all biomass harvested except the merchantable timber volume was assumed to be concentrated in front of the harvester on a 5-m-long trail segment and throughout the entire width (Table A1). This segment length was chosen as shortest usable brush mat segment to allow passage of the longest bogie axle used on forest machines (~4.2 m long rear bogie axle on Ponsse 10-wheel forwarder) in extreme ground conditions with low soil bearing capacity. Without brush relocation, this approach provided an estimate of the maximum amount of brush applicable to create a mat on such a short trail segment.
3. Results
3.1. Forest Stand Description
Five forest stands, representing a wide range of stand types commonly found in NB, Canada, were created and used to determine the amount of forest biomass available. These forest stands were either naturally regenerated (stands 1, 4, and 5) or artificially regenerated (stands 2 and 3) and ranged from 35 to 115 years old for stands 3 and 1, respectively. More details concerning species composition, dbh, height, and density are presented in Table 1.
3.2. Available Biomass for Soil Protection
With the use of BiOS, on-the-ground biomass obtained from stand 1 (115 year old softwood, naturally regenerated) was determined to range from 16 to 54 GT ha−1 for 30 and 100% tree removals, respectively (Table A1). Increasing total trail area, through a reduction of trail spacing and increasing width, lowered the average amount of brush applicable for soil protection on machine operating trails. The lowest applicable amount of brush was associated with the full (100%) trail coverage and increased as overall trail coverage was reduced.
In a clear-cut operation, the amount of brush applicable on the 5-m trail segment varied from 24 kg m−2 (16 m spacing, 4.5 m width) to 68 kg m−2 (22 m spacing, 3.0 m width). When considering partial harvests where only 30% of the merchantable volume was harvested, brush amounts applicable to protect a 5-m long trail segment were significantly reduced and varied from 7 kg m−2 (16 m spacing, 4.5 m width) to 21 kg m−2 (22 m spacing, 3.0 m width). In the event where harvesting was restricted to the area covered by machine operating trails, a brush mat of 5 kg m−2 would be produced over the entire trail network, regardless of tested widths and spacings. Although rarely applied, this technique was considered in a situation where a harvester entered a harvesting block only to harvest material from the machine operating trails, while subsequent tree removal located in between trails would be performed at a later entry. For clarity and to fit within the scope of this article, Table A1, Table A2, Table A3, Table A4 and Table A5 focus on biomass and brush related results. However, all removal rates presented can also be calculated on an m3 ha−1 basis when referring to the merchantable volume to obtain an operational context.
On-the-ground biomass availability, presented in Table A1, Table A2, Table A3, Table A4 and Table A5, was highest for stand 2 (139.0 GT ha−1; black spruce plantation) and lowest for stand 3 (17 GT ha−1; immature white spruce plantation). Due to its young age and relatively low merchantable volume, the effect of a clear-cut operation was not studied in stand 3 whereas partial harvests (50 and 30% tree removals) were considered. During a commercial thinning operation with a 30% removal, stand 3 only produced between 4 and 8 kg m−2 of brush when considering full trail coverage for the 4.5-m-wide trail spaced at 16 m and the 3.0-m-wide trail spaced at 22 m, respectively (Table A3). In the case where soil bearing capacity was very low, maximum brush that could be placed on a 5 m segment of machine operating trail was 13 kg m−2 and corresponded once more to the 3.0-m-wide trail spaced by 22 m.
The amount of on-the-ground biomass varied considerably with stand properties, in particular species composition. Despite having similar merchantable volumes (95 and 100 m3 ha−1), stands 1 and 5 yielded very different brush amounts for trail protection (Table A1 and Table A5). At 100% removal, stand 1 provided, at varying trail widths and spacings, between 19 and 40 kg m−2 of brush for use over the entire trail network whereas stand 5 (deciduous) produced 34 to 71 kg m−2 of brush, corresponding to a 79% increase in brush availability for the deciduous stand in comparison to its softwood counterpart. However, Labelle and Jaeger [6] showed that softwood brush mats had slightly better load distributing capacities than hardwood brush mats when compared at same mass per square meter.
3.3. Available Biomass on a Per Tree Basis
Using the properties from stand 2 (black spruce plantation), we determined the number of trees required for on-trail delimbing for providing the needed brush amounts and the number of trees whose brush is remaining for alternative use. Knowing the width of a machine operating trail and assuming equal tree spacing and tree size, the number of trees to be delimbed over a fixed segment of trail is easily calculable. This approach would likely provide numbers more applicable for machine operators considering the ease at which the trail segment length can be estimated using the reach of the boom as reference.
The effect of varying brush mat requirements for trail protection on the number of trees to be delimbed over the machine operating trail can be explained using Figure 1. Based on a 10-m-long boom, and limiting its movement to 90 degrees on each side of the harvester, the area covered equaled 157.1 m2. Using the properties from stand 2 (dbh = 23 cm, height = 20 m, on-the-ground biomass = 139 GT ha−1, and 1003 stems ha−1) and applying a clear-cut CTL operation with 3.5-m-wide trails spaced by 20 m (twice the length of the 10 m boom), the effect of increasing brush mat requirements for trail protection on the use of tree biomass can be observed. According to the area covered by the harvester boom, the number of stems per ha, and assuming equal distribution of trees within the stand, a total of 16 trees would be located within the path of the boom. As the amount of brush required for soil protection increased from 5 to 30 kg m−2, more trees needed to be delimbed on the trail, and biomass available for alternative use decreased from 128 to 72 GT ha−1, respectively (Figure 1). In Figure 1F, limbs and tree tops of 8 out of the 16 total trees were required to reach the 30 kg m−2 target brush mat on the 10-m-long machine operating trail segment.
The complete dataset for stand 2 presented on a per tree basis is available in Table A6. Brush mat amounts requiring more biomass than what was available within boom reach are identified with a negative value in the corresponding “A” (additionally available) column. A positive number in this column indicates that the target brush amount can be achieved. The number of trees required to build a respective brush mat is in relation to a trail length of equal distance to the reach of the boom. For specific trail width, increasing trail spacing through use of a longer machine boom provided access to a larger area and the corresponding number of accessible trees increased (Table A6). Conversely, for a specific trail spacing, an increase in trail width required more brush for trail protection compared to a narrower trail. As trail brush mat requirements increased from 5 to 30 kg m−2, the number of trail spacing and width options available was reduced as indicated by the frequency of shaded cells. Focusing on clear-cut operations, brush mats from 5 to 30 kg m−2 could be maintained over the entire machine operating trail network, regardless of the tested trail widths and spacings. When the target brush amount was set to the maximum tested (30 kg m−2), the number of trees with brush remaining for other uses varied from 2.3 to 11.9 for the 4.5-m-wide trail spaced at 16 m and the 3.0-m-wide trail spaced at 22 m, respectively. During partial harvests, the frequency of shaded cells increased significantly compared to clear-cut harvesting. When applying the lowest degree of tree removal tested (30%), a brush mat beyond 15 kg m−2 could only be sustained on certain trail dimensions whereas brush mats of 25 and 30 kg m−2 were not possible, regardless of trail dimensions, during a 30% partial cut of the merchantable volume.
From Table A6, the effect of varying brush mat requirements can also be observed on the number of trees that could potentially be delimbed on the side of the machine operating trail, thus enabling a bioenergy operation. The highest number of remaining trees (18) available within boom reach was associated with a clear-cut operation performed over a 3.0-m-wide trail spaced by 22 m, whereas the fewest number of trees (9) available was associated with the 4.5-m-wide trail spaced at 16 m.
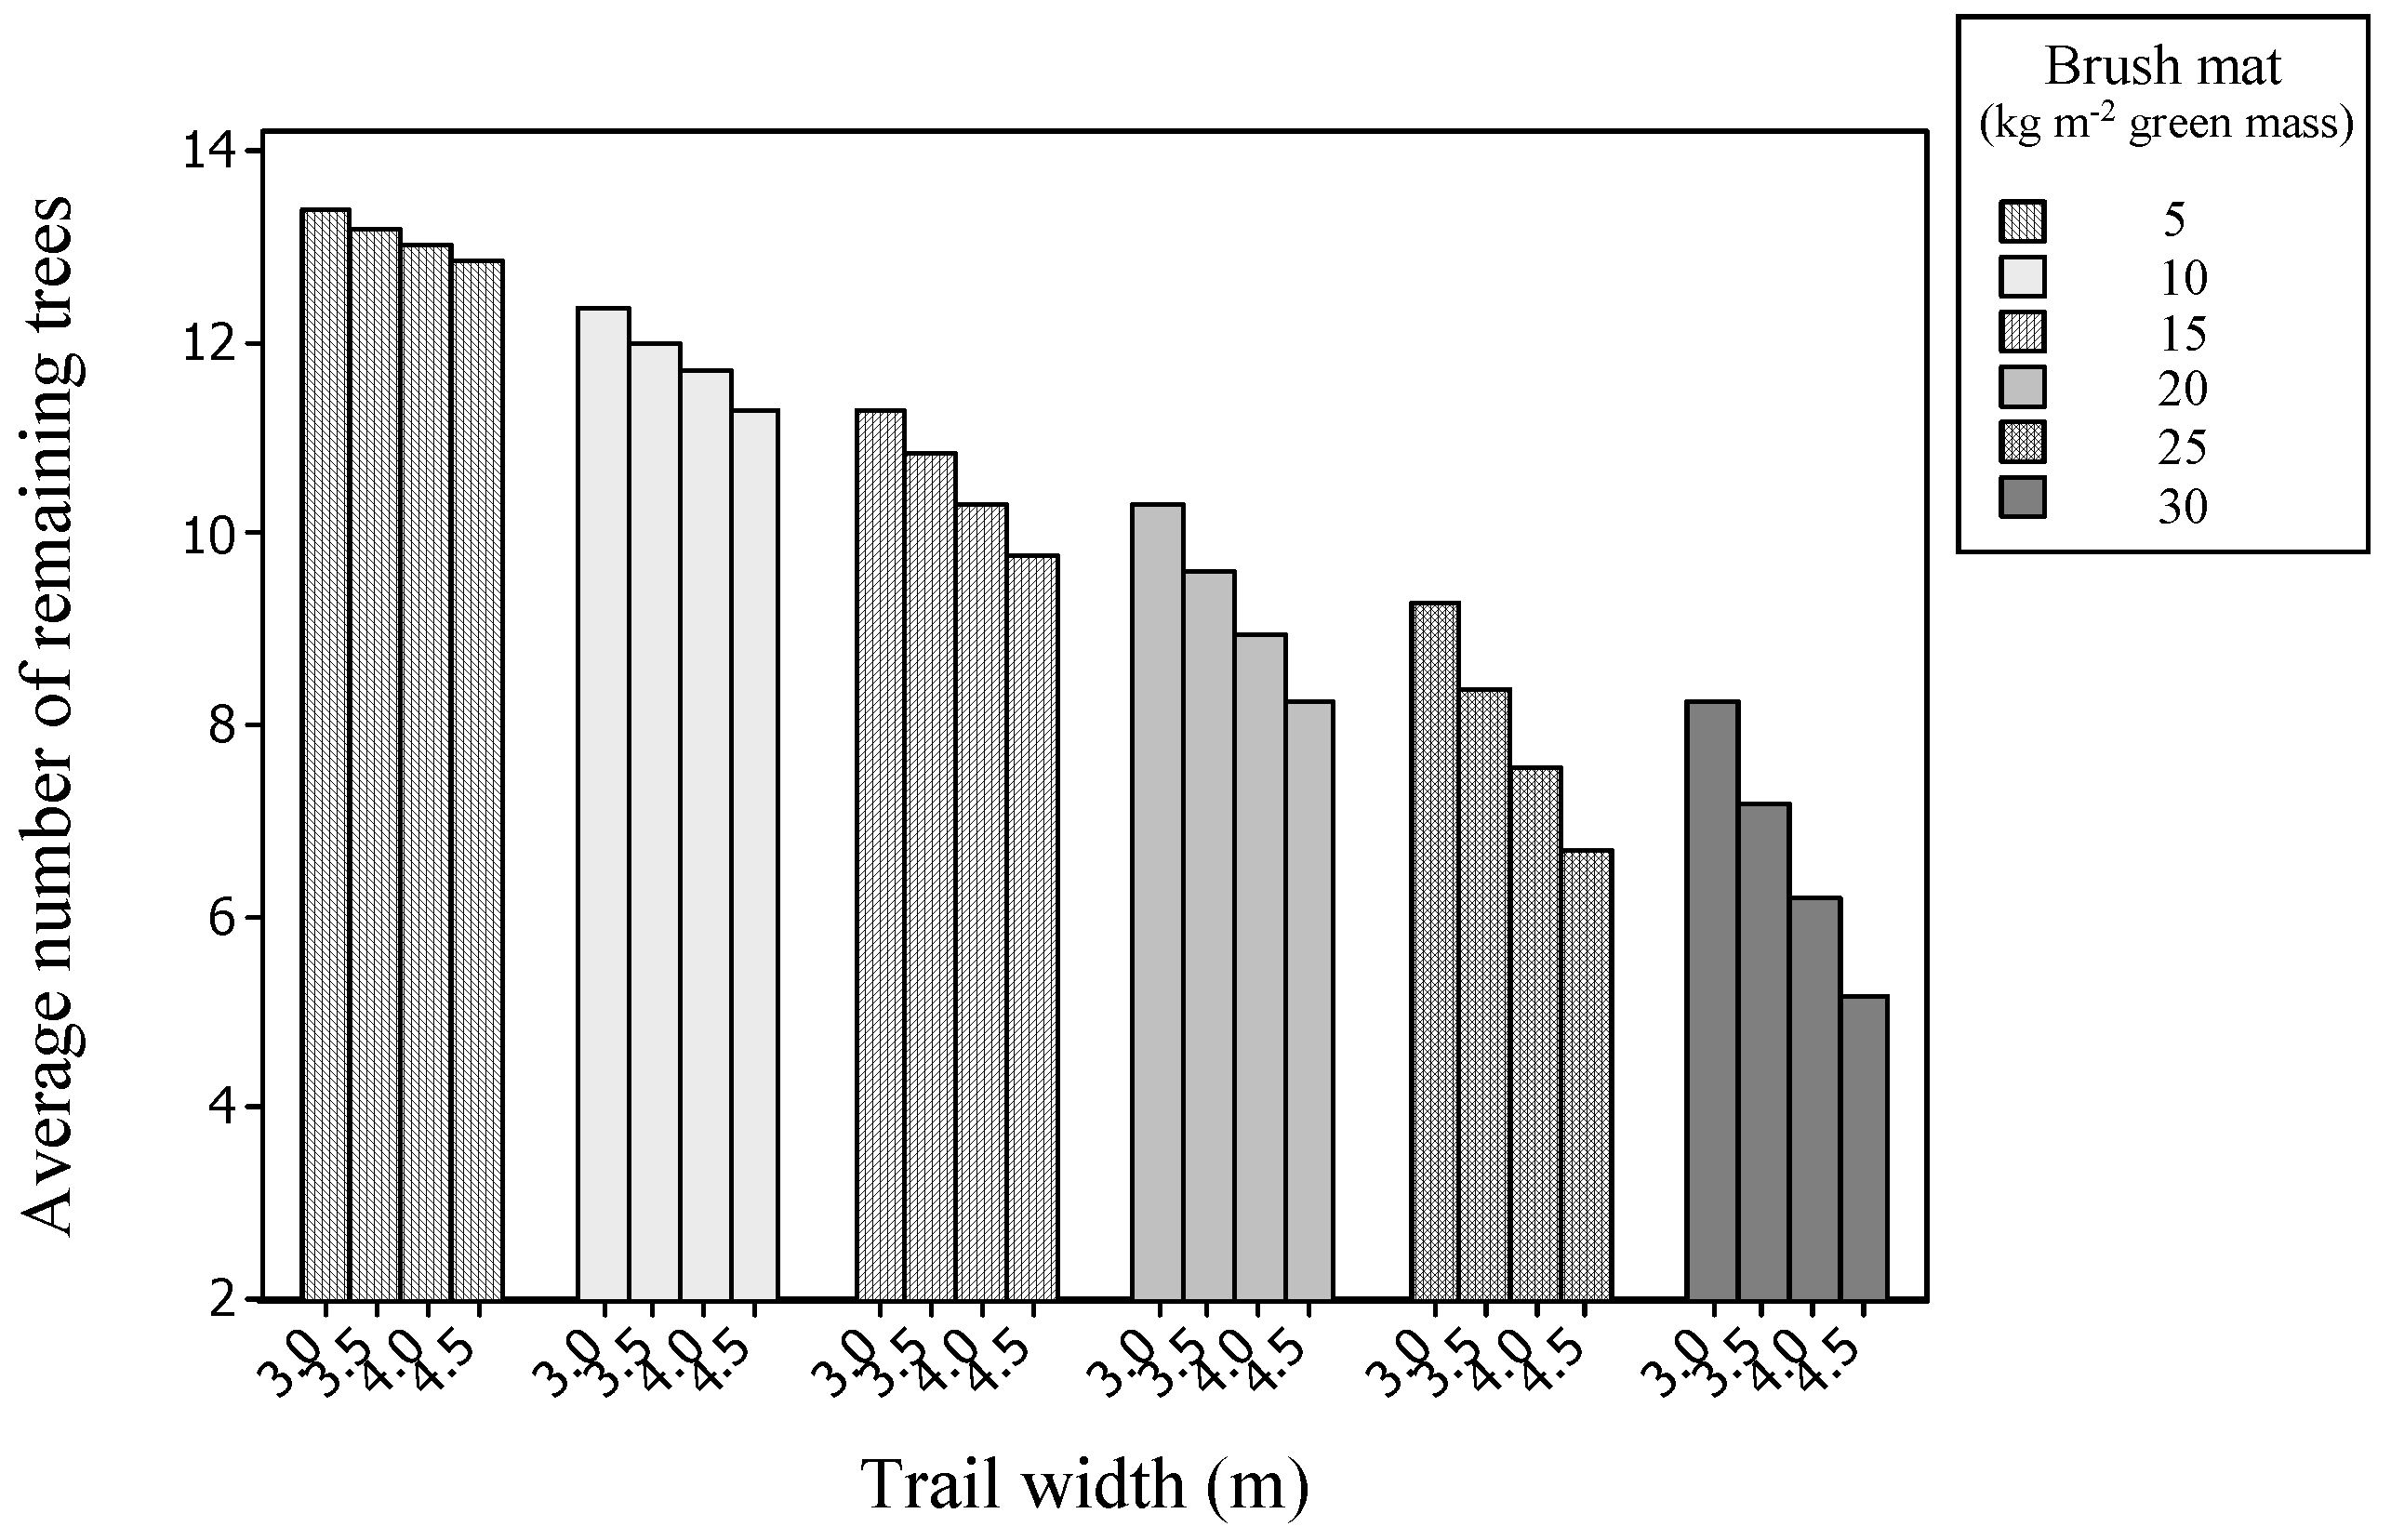
Focusing on clear-cut operations, these trends can be easily observed in Figure 2. When combining all trail spacings, an increase in trail width leads to a reduction in the average number of available trees, whose residues could be used for a biomass operation. This trend, apparent for all brush amounts tested, was more pronounced as brush amounts increased. If a 5 kg m−2 brush mat was allocated for protecting the entire trail network, increasing trail width from 3.0 to 4.5 m reduced the number of trees with brush available for bioenergy use by 3.7%. For the 30 kg m−2 brush amount, the number of trees with available brush was reduced by 38% when increasing trail width from 3.0 to 4.5 m.
Knowing the area covered by the sweep of a boom and the average biomass per tree, the number of trees with brush available for bioenergy use can easily be used to estimate the available brush amount in GT ha−1 to assess the feasibility of a bioenergy operation (Table A7). Similar to Table A6, negative values indicate the scenarios where brush mat requirements exceeded available biomass, thus resulting in a deficit. In these instances, no biomass remained for other use aside soil protection. The amount of biomass available for other use, aside from trail protection, increased considerably when brush required for soil protection decreased from 30 to 5 kg m−2 (Table A7). When achieving a 5 kg m−2 brush mat during a clear-cut operation, the biomass remaining on site varied between 121 and 130 GT ha−1, for the 4.5-m-wide trail spaced at 16 m and the 3.0-m-wide trail spaced at 22 m, respectively. In comparison, only a maximum surplus of 104 GT ha−1 was possible when applying a 20 kg m−2 brush mat, indicating a 20% reduction compared to the same trail dimensions as used in the 5 kg m−2 analysis. When targeting the heaviest brush mat of 30 kg m−2, biomass remaining varied between 32 and 87 GT ha−1 for the 4.5-m-wide trail spaced at 16 m and the 3.0-m-wide trail spaced at 22 m, respectively. At this brush mat amount, most 16-m and 18-m trail spacing options produce a biomass deficit when applying partial harvests. In fact, during a 30% removal, only 3.0-m-wide trails spaced by 18, 20, and 22 m were viable options.
3.4. Relationship Between Trail Area and Brush Mat Amounts
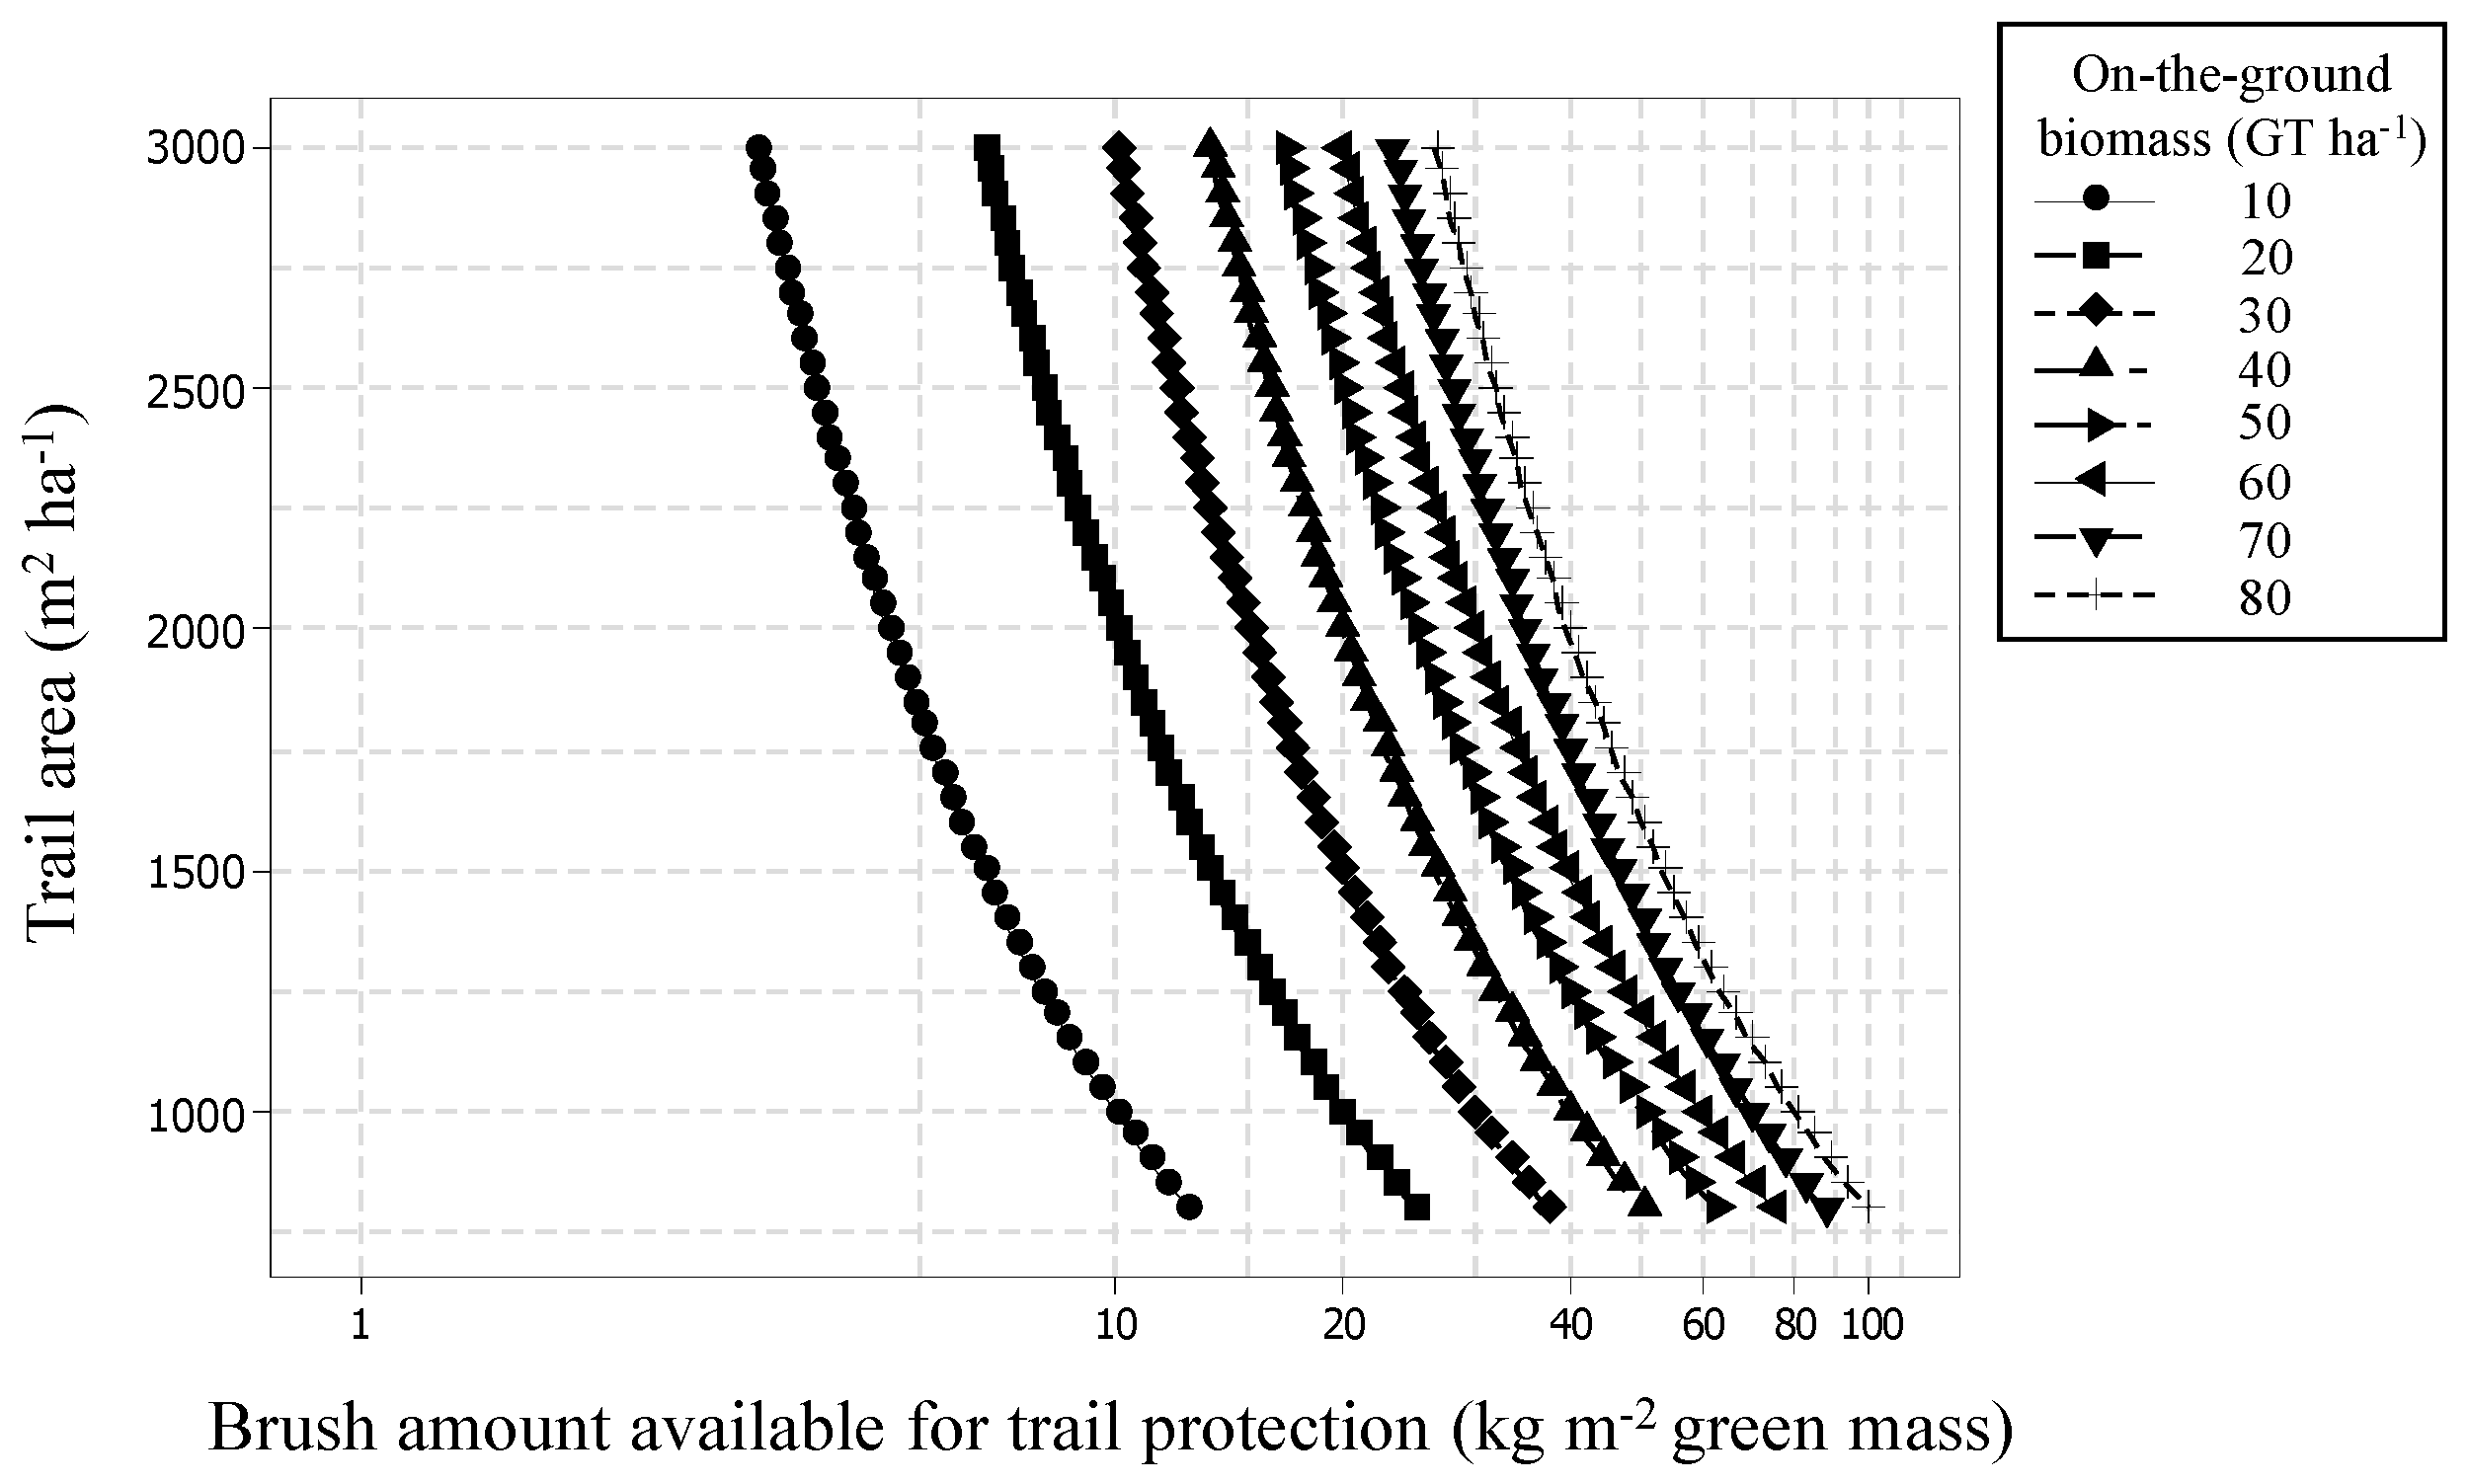
Based on different on-the-ground biomass availability, we also determined the relationship between the area covered by machine operating trails (m2 ha−1) and the amount of brush (kg m−2) applicable for trail protection. The semi-log graph (abscissa) indicates reverse exponential functions whereas for a respective on-the-ground biomass availability, decreasing trail area increases the amount of brush available for trail protection (Figure 3). Once on-the-ground biomass in GT ha−1 is determined through BiOS or another biomass supply model, an appropriate trail area or brush amount for soil protection can be established. For a respective trail area, brush for soil protection increased with higher on-the-ground biomass availability. For example, the maximum amount of brush that could be placed uniformly over the entire trail network is 50 kg m−2 for a stand with 40 GT ha−1 of on-the-ground biomass. Relating the trail area throughout the harvest block on a per hectare basis, and assuming equal coverage over the entire trail network, it is possible to determine the maximum amount of brush available for soil protection.
To determine which of the three factors (brush amount, trail width, and trail spacing) has the most significant impact on the amount of brush required for trail protection, we used standard trail dimensions of 20 m spacing and 3.5 m width covered with a 10 kg m−2 brush mat. The intentions were to: (1) assess the effect of reducing trail spacing from 20 m to 19 m, (2) determine the impact of increasing trail width from 3.5 m to 4.0 m, and (3) evaluate the amount of brush required for trail protection when increasing brush mat amount from 10 to 11 kg m−2 on the overall brush requirements on a per hectare basis.
First, increasing brush amount required for trail protection from 10 to 11 kg m−2 required an additional 1750 kg ha−1. Second, an increase in machine operating trail width from 3.5 m to 4.0 m required an additional 2500 kg ha−1 of brush. Third, reducing trail spacing from 20 m to 19 m required an extra 1940 kg ha−1 of brush. This basic analysis demonstrates that in order of importance, factors affecting needed brush for trail protection would be trail width, trail spacing, and brush amount (kg per m2). This would mean that in thinning operations or harvest blocks in proximity to where bioenergy demand is high (prime locations for thinner brush mats), a reduction of trail width would be the most cost-effective factor to increase the amount of brush available for bioenergy use.
3.5. Economic Impact of Leaving Brush Mats for Trail Protection
As explained earlier, spatial distribution and magnitude of brush mats in mechanized forest operations depend on soil conditions, machine configurations, degree of tree removal, and type of silvicultural treatment. Labelle and Jaeger [6] suggested brush mats of 20 kg m−2 (green mass) for trail protection to minimize machine peak surface contact pressures on sensitive sites and for trail segments with highly susceptible soils brush mats of up to maximum available brush amounts. During a clear-cut operation of stand 2 (Figure 1D), allocating a 20 kg m−2 brush mat for soil protection over an entire trail network of 1750 m2 ha−1 (3.5-m-wide trail spaced by 20 m) would leave 94 GT ha−1 of biomass for other use such as bioenergy supply (Table A7). Leaning on the side of caution, only 70% of the remaining biomass, corresponding to 66 GT ha−1, will be used for the biomass calculation, thereby leaving 52.5% of the total on-the-ground biomass on site.
Several key parameters of biomass harvesting must first be addressed before we can evaluate the financial impact of harvesting the surplus biomass. This example will again focus on stand 2 (high-yield black spruce plantation), where a clear-cut CTL operation is performed on the entire 20 ha harvest block. The origin of the biomass, harvesting residues (limbs, tree tops, and foliage) pre-piled on the side of machine operating trails, will be transported with a forwarder to a roadside landing where a horizontal grinder will be utilized for comminution.
In BiOS, site conditions were classified as defined in Section 2.1 and transport distances equal to 75 km from the roadside yard to the mill were programmed per road class (5 km road class 3–4; 20 km road class 1–2; and 50 km on paved roads).
In terms of operating costs, harvesting costs were non-existent since these were allocated in relation to the processed industrial round wood. All costs presented are based on Canadian dollars. Costs associated with cutover handling (use of forwarder to transport harvesting residue from the trail to a roadside yard) were estimated at $11.32 per GT, while roadside and landing costs associated with the horizontal grinder were $6.86 per GT. Transport costs for the distances mentioned above were calculated at $10.05 per GT. Total operating costs of removing the biomass from stand 2, comminuting this biomass at roadside and transporting it to a mill located 75 kilometres away were calculated at $28.23 per GT.
Comminuted biomass delivered at the mill generally sells at between $25 and $35 per green ton. Considering the operation costs of $28.23 per GT and an average selling price of $30 per GT, the biomass operation of the 20-hectare stand described above (1320 GT of biomass) would produce a revenue of $2336 (66 GT ha−1 × 20 ha × $1.77 of profit per GT). The revenue for an operation can fluctuate based on site conditions and machinery used. According to BiOS, using a roadside chipper (600 kW engine) instead of the horizontal grinder would increase the profit for the total operation to $5400.
To quantify the effect of leaving a 20 kg m−2 brush mat on site for machine operating trail protection, we subtracted the amount of brush remaining from the total on-the-ground biomass available to obtain the amount of brush required for soil protection (45 GT ha−1; Table A7). This amount of brush was required to cover the entire trail network uniformly. Assuming the same conditions as explained in the scenario described above, using this extra 45 GT ha−1 (892 GT for the entire 20 ha harvest block) of brush for bioenergy operation would yield an additional $1579 of revenue.
Knowing the loss of revenue associated with allocating a 20 kg m−2 brush mat, we estimated the financial impact of leaving machine operating trails uncovered by brush on the potential loss of forest productivity over the next rotation. Leaving machine operating trails uncovered would result in machine loads being fully and directly exerted to the soil. Consequently, machine traffic would cause a higher increase in soil density and soil displacement, which can significantly reduce plant growth as it limits root growth, particularly in the case when long-term machine operating trails (use of same trail system over multi-stand entries) are not common [20]. In a review of 142 studies where soil compaction had been reported, Greacen and Sands [21] found that 82% of the cases reported reduced tree growth. Following subsoil compaction below a depth of 10 cm, Murphy et al. [22] determined that reduced growth in a radiata pine (Pinus radiata D. Don) plantation resulted in a decrease of stand volume up to 42% over a 28-year projection period. Froehlich and McNabb [23] estimated that tree growth would decrease by 6% for every 10% increase in soil density, while Helms et al. [24] showed that ponderosa pines growing on compacted machine operating trails had 13–50% height growth reductions compared to trees growing on non-compacted soil. The studies that assessed the effect of machine-induced soil compaction on tree growth are all site, machine, and species dependant, which make their application to generalized scenarios difficult. However, to present a balanced and somewhat conservative example, a 30% tree growth reduction will be hypothesized on the area directly affected by machine traffic and will correspond to two 70-cm-wide tracks per machine operating trail. Using the same trail dimensions as the previous example (3.5 m wide and 20 m spacing; 1750 m2 ha−1), the two 70-cm-wide machine tracks would translate to an area of 700 m2 ha−1. Some area of the stand might not require high traffic frequency or may be located on soil with higher bearing capacity where machine traffic occurring directly on the forest soil would not cause a significant soil density increase, thus not affecting stand productivity. For this reason, this scenario will only consider 75% of the area directly impacted by forest machine tires (525 m2 ha−1) to be severely compacted and thus causing a 30% tree growth reduction over the next rotation.
Based on the current merchantable volume of stand 2 (329 m3 ha−1, 75 years old), and assuming that machine operating trails are not re-used for multiple entries (often the case in eastern Canada) and for the affected area of 525 m2 ha−1 (5.25% of entire stand surface area), a 30% reduction in tree growth projected over the next rotation of 75 years would correspond to a loss of 5.2 m3 ha−1 in merchantable volume. This reduction in volume would translate to 104 m3 for the 20 ha stand. Taking into account the time value of money and assuming a very modest rate of $25 per m3 (average estimated price for stud wood, pulpwood, and biomass of harvested wood), this would represent a $49,258 loss in revenue (2600 × (1 + 0.040)75) at the end of the projection period of 75 years. To obtain an offset, the revenue associated with extracting the 20 kg m−2 brush amount for bioenergy over the entire stand of 20 ha ($2336) was projected over the same 75-year time horizon equalling a revenue of $44,256 (2336 × (1 + 0.040)75). Subtracting the cost associated with a 30% growth reduction ($49,258 for the loss of 104 m3) from the revenue of using the 20 kg m−2 brush amount for bioenergy operations ($44,256), yields a deficit of $5000, corresponding to an 11% difference. In fact, a reduction in tree growth of approximately 27.5% would be required to offset the costs associated with protecting the entire trail network with a 20 kg m−2 brush mat. However, if biomass prices were to significantly increase, which is quite conceivable due to expanded markets and carbon credits, the cost associated with protecting forest soils against machine traffic with the use of brush mats would increase accordingly. It is important to note that this hypothesized scenario only considered reduced growth in 75% of the area directly impacted by the machine running gear. This area is where most severe soil property alterations would occur, however, tree growth could also be affected beyond the area directly impacted by the machine running gear, which would increase the loss of revenue [25].
4. Discussion
4.1. Management Implications of Using Brush As a Soil Protective Layer
Aside from utilizing material that is readily available directly from the forest stand, brush mats as a mean of protecting forest soils against heavy machine loadings have the advantage of not impeding machine productivity. Monitoring the movement and operation of the harvesting head during the delimbing process is usually more convenient for the operator when performed over the machine operating trail. In partial harvest operations, delimbing trees on the machine operating trail is also more suitable for the operator due to the nuisance created by the remaining standing trees between adjacent trails, which may hamper boom manoeuvrability.
The convenience of creating brush mats during mechanized CTL operations has greatly increased its applicability, particularly for prolonging technical trafficability of operating trails in areas of higher soil moisture content, often associated with soils of low bearing capacity. Unless severe soil conditions are encountered, moving brush within and from adjacent trails to reinforce specific trail segments is not a pragmatic approach. For this reason, the completeness of brush mat cover will depend on machine operating trail area as well as the frequency and location of harvested trees.
Previous studies have shown the benefit of using brush as a soil protective layer. In particular, Han et al. [14] and Poltorak et al. [7] reported a significant reduction in rut depth when operating a forwarder over a 20 kg m−2 brush mat. On average, published data suggests leaving a brush mat of 20 kg m−2 for efficient soil protection during mechanized forest harvesting [6,7,14,26]. In a study performed by Wronski et al. [27], it was determined that for every increase of 10 kg m−2 beyond an initial 10 kg m−2 brush density, effective bearing capacity (soil and brush mat) was augmented by 25%. All these studies also presented brush mat amounts in green mass.
For sites where biomass exportation would not cause a deficit in nutrients, the absence of a brush mat on operating trails could perhaps be compensated by allowing forest operations to be conducted only in frozen ground conditions and/or altering machine characteristics. Once in deep frozen conditions, forest soils can sustain much higher loadings, through increased soil strength, without causing negative disturbance to physical properties [28]. Depth of frost penetration depends on soil type, soil moisture content, vegetation type, snow depth, and climatic conditions and should therefore be examined on a per harvest block basis prior to commencement of forest operations [28].
Aside from frozen ground conditions, the use of steel flexible tracks (SFT) has been proven to reduce dynamic peak surface contact pressures by up to 30% compared to tires [29]. This surface contact pressure reduction reflects the current configuration of SFT forming an oval geometry without support rollers. Modifying the bogie track with the addition of support rollers, located in between existing tires of the bogie axle, could further reduce ground pressures by allowing a more uniform load distribution below the centre of the SFT.
For maximum brush availability, machine operating trails should be spaced at the maximum distance allowed by machine boom length and limited to the narrowest width as possible. The smaller average diameter and corresponding mass per tree of harvested trees during a partial harvest operation could potentially allow harvesters with a longer boom reach to be used, therefore increasing brush availability for trail protection.
Brush amounts reported in this study, as derived from the BiOS simulations, are in line with findings from Poltorak et al. [7] and Labelle et al. [15] who reported a natural range of brush mat amounts from 3.9 and 50.2 kg m−2 with a mean of 27.8 kg m−2 during clear cut operations in softwood stands located in New Brunswick (NB), Canada. Similarly, Borchert et al. [30] reported a range of brush amount between 14 and 48 kg m−2 with an average of 27 kg m−2 during a thinning operation performed in Germany (average volume removal of 132 m3 ha−1).
4.2. Biomass for Bioenergy
The interest in using forest biomass as a source of CO2 neutral energy is increasing rapidly and based on the rising price of fossil fuels; this upward trend should continue. The proposed co-generation infrastructures and those currently operating in NB will require an estimated 3,000,000 GT of forest biomass yearly to produce green energy [31]. Approximately 60% of this biomass will be obtained from mill residues and the remaining 1,200,000 GT will be provided directly from forest operations. Estimates for the NB biomass policy [32] are that about one million cubic meters of biomass may be available per year from sustainable harvests on the 3.3 million hectares of Crown lands in the province. Considering an average biomass density of 0.9 GT m−3, this volume of biomass translates to 900,000 GT year−1. This estimate is based on selected sites with sufficient soil nutrients where biomass utilization and related nutrient export is not anticipated to compromise future tree growth. However, biomass necessary for soil protection along machine operating trails was not considered in these calculations and will significantly reduce the amount of biomass available from NB Crown lands to supply the current and proposed co-generation facilities.
If we consider an average on-the-ground biomass availability of 50 GT ha−1 for a typical stand in NB, this would translate to a total harvested area of 18,000 ha per year to provide the needed 900,000 GT year−1. Using an average spacing of 20 m between trail centerlines and trail width of 3.5 m (1750 m2 ha−1), the area covered by machine operating trails would equal 31,500,000 m2 or 31.5 km2. Allocating a 20 kg m−2 brush mat for trail protection over the entire network of harvest blocks where biomass is expected to be exported for bioenergy would require 630,000 GT for the total 18,000 ha, leaving 270,000 GT per year for bioenergy. Further research considering individual stand properties would be required to accurately determine the effect protecting forest soils against machine loadings would have on biomass availability. An example of such a variable would be stand composition.
During the modelling phase, brush species composition had a considerable effect on the amount of biomass available. For similar merchantable volumes, deciduous stands provided significantly more brush than softwood stands. According to Labelle et al. [8], small-scale (1/7 of a square meter) softwood brush mats showed a slightly better capacity at distributing applied loads laterally compared to deciduous brush mats. This would imply that deciduous brush mats would require marginally more material to offer the same amount of protection as softwood brush mats. Deciduous stands are usually located on rich, deep, and productive soils. These sites would be key candidates for bioenergy operations since they are very productive, usually on higher ground elevations, have sufficient nutrients, and produce a high level of biomass. With the high amount of on-the-ground biomass available from deciduous trees, the feasibility of biomass operations following the allocation of brush as a soil protective layer on machine operating trails would likely increase for deciduous stands compared to softwood stands.
Economic Considerations
Depending on operation costs and biomass selling price, it may be possible to obtain an economic benefit of utilizing biomass for bioenergy production. With financial uncertainty surrounding the forest sector, any additional source of income is usually accepted without much opposition. However, as described in this study, the long-term costs of not protecting machine operating trails with brush mats can easily out-weigh the short-term revenue generated by the exportation of biomass away from a forest stand.
Using the scenario mentioned above for NB Crown lands, leaving a 20 kg m−2 brush mat on all machine operating trails would require 630,000 GT of biomass. At a potential selling profit of $1.77 per GT, not allowing this brush to be used for bioenergy operations would equal a $1,115,100 loss of revenue per year. A number of these rich sites, initially chosen for bioenergy operations, might not require the equivalent of a 20 kg m−2 brush mat uniformly distributed over the entire machine operating trails, therefore potentially allowing most biomass to be exported. Sustainably managing the competing uses of brush for soil protection and bioenergy operations will demand a comprehensive approach on an individual stand basis. Due to the severe repercussions of leaving trails exposed to heavy machine loadings, priority should be given to assuring adequate protection of such trails.
4.3. Study Limitations
The concepts explained in this article, including the location of biomass within a harvest site, are based on an equal distribution of brush within the entire trail network. Operationally, this will seldom be required or achievable since soil conditions (soil bearing capacity, soil moisture, soil density, organic content, coarse fragments, etc.) and tree distribution can vary significantly on a small spatial scale. Despite our best attempts to re-create stand types that would reflect a wide range of conditions in eastern Canada, additional stand types could be considered in future studies and then compared to actual stands. However, the results illustrate the general effect on-the-ground biomass availability has on the amount of brush applicable for soil protection through the use of brush mats and can be used as an indicator of management implications of using brush mats.
5. Conclusions
The analysis of on-the-ground biomass of the four mature stand types commonly found in eastern Canada revealed a wide range from 16 GT ha−1 during commercial thinning with harvest of 30% of merchantable volume in stand 1 (naturally regenerated softwood stand at the age of 115 years) to 139 GT ha−1 during clear-cut operation in stand 2 (artificially regenerated high-yield black spruce stand at the age of 75 years). Further analysis of the four stands showed average available brush amounts for complete trail coverage, irrespective of trail spacing and trail width, of 18.5 kg m−2 for commercial thinning operations and 46.3 kg m−2 for clear-cut operations in the assessed mature stands. Within the analyzed prescriptions, on-the-ground biomass varied by trail width and spacing. However, assuming total coverage of trail surface (100%) within the analyzed four mature stands (considering all three harvesting intensities), 56% of the tested scenarios including trail spacings from 16 m to 22 m, trail widths of 3.0 m to 4.5 m, and removal rates of merchantable timber of 30% to 100% allowed for brush mats of at least 20 kg m−2. Considering only trail widths of up to 3.5 m showed that even 64% of all tested scenarios of the four mature stands offered available brush for trail protection of at least 20 kg m−2.
Nevertheless, trail coverage by brush mats of sufficient thickness for reducing soil disturbance by ground-based timber harvesting and extraction operations limits available brush amounts for other uses such as bioenergy. Surprisingly, scenario analysis for stand 2 revealed, despite complete brush coverage of 20 kg m−2 of trails spaced at 20 m or 22 m, significant additional brush amounts available for other uses. These amounts ranged from 12 to 101 GT ha−1 if 50% or 100% of merchantable timber was harvested.
Due to the degree of tree removal, clear-cut operations offer the possibility of creating thicker brush mats compared to partial harvests of the same spatial extent. During heavy removal harvests, the high volume of wood to be transported to roadside landings also increases the traffic required by the forwarder. In addition to the more theoretical method of expressing required brush amounts in kg m−2, the number of trees to be delimbed over a fixed segment length of machine operating trail allows for translating research findings to actual in-field forest operations. The feasibility of a biomass operation remains dependent on individual stand, machine, and soil characteristics. Maintaining sufficient biomass on machine operating trails in the form of brush mats to protect them against heavy machine loadings is an integral part of assuring long-term productivity of forest stands. Future research combining the effect of nutrient exportation associated with biomass removal from a forest stand with the effect different brush amounts have on maintaining soil physical properties would likely provide a comprehensive understanding of the overall effect of brush removal on future stand and soil productivity.
Author Contributions
Conceptualization, E.R.L., D.J.; methodology, E.R.L., D.J.; formal analysis, E.R.L.; writing—original draft preparation, E.R.L., D.J.; writing—review and editing, E.R.L., D.J.; supervision, D.J.; funding acquisition, E.R.L.
Funding
This research was funded by Natural Sciences and Engineering Research Council of Canada, FPInnovations, and the University of New Brunswick. This publication was supported by the German Research Foundation (DFG) and the Technical University of Munich (TUM) in the framework of the Open Access Publishing Program.
Acknowledgments
The authors are grateful for manuscript revisions provided by Robert J. Rogers from the Mechanical Engineering Department at the University of New Brunswick and Mark Partington from FPInnovations. Technical assistance obtained from Sylvain Volpé and Denis Cormier at FPInnovations was appreciated.
Conflicts of Interest
The authors declare no conflict of interest.
Appendix A

Table A1.
Amount of brush available for soil protection as brush mats depending on silvicultural treatment, trail spacing, trail width and varying trail coverage obtained from a naturally regenerated softwood stand (1).
Table A1.
Amount of brush available for soil protection as brush mats depending on silvicultural treatment, trail spacing, trail width and varying trail coverage obtained from a naturally regenerated softwood stand (1).
| Trail Dimensions (m) | Treatment | Removal a (%) | Total Bio b GT ha−1 (ODT ha−1) | Merch. Vol. c (m3 ha−1) | On-the-Ground Bio GT ha−1 (ODT ha−1) | Trail Area (m2 ha−1) | Amount of Brush (kg m−2, Green Mass) Available Depending on the Percentage of Trail Area Covered in Brush | ||||||
|---|---|---|---|---|---|---|---|---|---|---|---|---|---|
| Spacing | Width | 100% | 75% | 50% | 25% | 5 m Segment d | Trail Clearing Only | ||||||
| 16 | 3 | CC e | 100 | 131 (65) | 95 | 54 (27) | 1875 | 29 | 38 | 58 | 115 | 36 | 5 |
| PC f | 50 | 131 (65) | 47 | 27 (14) | 1875 | 14 | 19 | 29 | 58 | 18 | 5 | ||
| PC | 30 | 131 (65) | 28 | 16 (8) | 1875 | 9 | 12 | 17 | 35 | 11 | 5 | ||
| 3.5 | CC | 100 | 131 (65) | 95 | 54 (27) | 2188 | 25 | 33 | 49 | 99 | 31 | 5 | |
| PC | 50 | 131 (65) | 47 | 27 (14) | 2188 | 12 | 17 | 25 | 49 | 16 | 5 | ||
| PC | 30 | 131 (65) | 28 | 16 (8) | 2188 | 7 | 10 | 15 | 30 | 9 | 5 | ||
| 4 | CC | 100 | 131 (65) | 95 | 54 (27) | 2500 | 22 | 29 | 43 | 86 | 27 | 5 | |
| PC | 50 | 131 (65) | 47 | 27 (14) | 2500 | 11 | 14 | 22 | 43 | 14 | 5 | ||
| PC | 30 | 131 (65) | 28 | 16 (8) | 2500 | 7 | 9 | 13 | 26 | 8 | 5 | ||
| 4.5 | CC | 100 | 131 (65) | 95 | 54 (27) | 2813 | 19 | 26 | 38 | 77 | 24 | 5 | |
| PC | 50 | 131 (65) | 47 | 27 (14) | 2813 | 10 | 13 | 19 | 38 | 12 | 5 | ||
| PC | 30 | 131 (65) | 28 | 16 (8) | 2813 | 6 | 8 | 12 | 23 | 7 | 5 | ||
| 18 | 3 | CC | 100 | 131 (65) | 95 | 54 (27) | 1667 | 32 | 43 | 65 | 130 | 46 | 5 |
| PC | 50 | 131 (65) | 47 | 27 (14) | 1667 | 16 | 22 | 32 | 65 | 23 | 5 | ||
| PC | 30 | 131 (65) | 28 | 16 (8) | 1667 | 10 | 13 | 19 | 39 | 14 | 5 | ||
| 3.5 | CC | 100 | 131 (65) | 95 | 54 (27) | 1944 | 28 | 37 | 56 | 111 | 40 | 5 | |
| PC | 50 | 131 (65) | 47 | 27 (14) | 1944 | 14 | 19 | 28 | 56 | 20 | 5 | ||
| PC | 30 | 131 (65) | 28 | 16 (8) | 1944 | 8 | 11 | 17 | 33 | 12 | 5 | ||
| 4 | CC | 100 | 131 (65) | 95 | 54 (27) | 2222 | 24 | 32 | 47 | 97 | 34 | 5 | |
| PC | 50 | 131 (65) | 47 | 27 (14) | 2222 | 12 | 16 | 24 | 49 | 17 | 5 | ||
| PC | 30 | 131 (65) | 28 | 16 (8) | 2222 | 7 | 10 | 15 | 29 | 10 | 5 | ||
| 4.5 | CC | 100 | 131 (65) | 95 | 54 (27) | 2500 | 22 | 29 | 43 | 86 | 31 | 5 | |
| PC | 50 | 131 (65) | 47 | 27 (14) | 2500 | 11 | 14 | 22 | 43 | 15 | 5 | ||
| PC | 30 | 131 (65) | 28 | 16 (8) | 2500 | 7 | 9 | 13 | 26 | 9 | 5 | ||
| 20 | 3 | CC | 100 | 131 (65) | 95 | 54 (27) | 1500 | 36 | 48 | 72 | 144 | 57 | 5 |
| PC | 50 | 131 (65) | 47 | 27 (14) | 1500 | 18 | 24 | 36 | 72 | 28 | 5 | ||
| PC | 30 | 131 (65) | 28 | 16 (8) | 1500 | 11 | 14 | 22 | 43 | 17 | 5 | ||
| 3.5 | CC | 100 | 131 (65) | 95 | 54 (27) | 1750 | 31 | 41 | 62 | 123 | 49 | 5 | |
| PC | 50 | 131 (65) | 47 | 27 (14) | 1750 | 15 | 21 | 31 | 62 | 24 | 5 | ||
| PC | 30 | 131 (65) | 28 | 16 (8) | 1750 | 9 | 12 | 19 | 37 | 15 | 5 | ||
| 4 | CC | 100 | 131 (65) | 95 | 54 (27) | 2000 | 27 | 36 | 54 | 108 | 42 | 5 | |
| PC | 50 | 131 (65) | 47 | 27 (14) | 2000 | 14 | 18 | 27 | 54 | 21 | 5 | ||
| PC | 30 | 131 (65) | 28 | 16 (8) | 2000 | 8 | 11 | 16 | 32 | 13 | 5 | ||
| 4.5 | CC | 100 | 131 (65) | 95 | 54 (27) | 2250 | 24 | 32 | 48 | 96 | 38 | 5 | |
| PC | 50 | 131 (65) | 47 | 27 (14) | 2250 | 12 | 16 | 24 | 48 | 19 | 5 | ||
| PC | 30 | 131 (65) | 28 | 16 (8) | 2250 | 7 | 10 | 14 | 29 | 11 | 5 | ||
| 22 | 3 | CC | 100 | 131 (65) | 95 | 54 (27) | 1364 | 40 | 53 | 79 | 158 | 68 | 5 |
| PC | 50 | 131 (65) | 47 | 27 (14) | 1364 | 20 | 26 | 40 | 79 | 34 | 5 | ||
| PC | 30 | 131 (65) | 28 | 16 (8) | 1364 | 12 | 16 | 24 | 48 | 21 | 5 | ||
| 3.5 | CC | 100 | 131 (65) | 95 | 54 (27) | 1591 | 34 | 45 | 68 | 136 | 59 | 5 | |
| PC | 50 | 131 (65) | 47 | 27 (14) | 1591 | 17 | 23 | 34 | 68 | 29 | 5 | ||
| PC | 30 | 131 (65) | 28 | 16 (8) | 1591 | 10 | 14 | 20 | 41 | 18 | 5 | ||
| 4 | CC | 100 | 131 (65) | 95 | 54 (27) | 1818 | 30 | 40 | 59 | 119 | 51 | 5 | |
| PC | 50 | 131 (65) | 47 | 27 (14) | 1818 | 15 | 20 | 30 | 59 | 26 | 5 | ||
| PC | 30 | 131 (65) | 28 | 16 (8) | 1818 | 9 | 12 | 18 | 36 | 15 | 5 | ||
| 4.5 | CC | 100 | 131 (65) | 95 | 54 (27) | 2045 | 26 | 35 | 53 | 106 | 46 | 5 | |
| PC | 50 | 131 (65) | 47 | 27 (14) | 2045 | 13 | 18 | 26 | 53 | 23 | 5 | ||
| PC | 30 | 131 (65) | 28 | 16 (8) | 2045 | 8 | 11 | 16 | 32 | 14 | 5 | ||
a Percent of merchantable volume b Total biomass c Merchantable volume d Brush available to be placed on a 5-m-long segment of trail based on trail width and amount of brush available at boom reach e clear cut f partial cut. ODT: oven dry tons.
Table A2.
Amount of brush available for soil protection as brush mats depending on trail spacing, trail width and varying trail coverage obtained from an artificially regenerated high-yield black spruce stand (2).
Table A2.
Amount of brush available for soil protection as brush mats depending on trail spacing, trail width and varying trail coverage obtained from an artificially regenerated high-yield black spruce stand (2).
| Trail Dimensions (m) | Treatment | Removal a (%) | Total Bio b GT ha−1 (ODT ha-1) | Merch. vol. c (m3 ha−1) | On-The-Ground Biomass GT ha−1 (ODT ha−1) | Trail Area (m2 ha−1) | Amount of Brush (kg m−2, Green Mass) Available Depending on the Percentage of Trail Area Covered in Brush | ||||||
|---|---|---|---|---|---|---|---|---|---|---|---|---|---|
| Spacing | Width | 100% | 75% | 50% | 25% | 5 m Segment d | Trail Clearing Only | ||||||
| 16 | 3 | CC e | 100 | 495 (248) | 329 | 139 (70) | 1875 | 74 | 99 | 148 | 297 | 93 | 14 |
| PC f | 50 | 495 (248) | 164 | 69 (35) | 1875 | 37 | 49 | 74 | 148 | 47 | 14 | ||
| PC | 30 | 495 (248) | 99 | 42 (21) | 1875 | 22 | 30 | 44 | 89 | 28 | 14 | ||
| 3.5 | CC | 100 | 495 (248) | 329 | 139 (70) | 2188 | 64 | 85 | 127 | 254 | 80 | 14 | |
| PC | 50 | 495 (248) | 164 | 69 (35) | 2188 | 32 | 42 | 64 | 127 | 40 | 14 | ||
| PC | 30 | 495 (248) | 99 | 42 (21) | 2188 | 19 | 25 | 38 | 76 | 24 | 14 | ||
| 4 | CC | 100 | 495 (248) | 329 | 139 (70) | 2500 | 56 | 74 | 111 | 222 | 70 | 14 | |
| PC | 50 | 495 (248) | 164 | 69 (35) | 2500 | 28 | 37 | 56 | 111 | 35 | 14 | ||
| PC | 30 | 495 (248) | 99 | 42 (21) | 2500 | 17 | 22 | 33 | 67 | 21 | 14 | ||
| 4.5 | CC | 100 | 495 (248) | 329 | 139 (70) | 2813 | 49 | 66 | 99 | 198 | 62 | 14 | |
| PC | 50 | 495 (248) | 164 | 69 (35) | 2813 | 25 | 33 | 49 | 99 | 31 | 14 | ||
| PC | 30 | 495 (248) | 99 | 42 (21) | 2813 | 15 | 20 | 30 | 59 | 19 | 14 | ||
| 18 | 3 | CC | 100 | 495 (248) | 329 | 139 (70) | 1667 | 83 | 111 | 167 | 334 | 118 | 14 |
| PC | 50 | 495 (248) | 164 | 69 (35) | 1667 | 42 | 56 | 83 | 167 | 59 | 14 | ||
| PC | 30 | 495 (248) | 99 | 42 (21) | 1667 | 25 | 33 | 50 | 100 | 35 | 14 | ||
| 3.5 | CC | 100 | 495 (248) | 329 | 139 (70) | 1944 | 72 | 95 | 143 | 286 | 101 | 14 | |
| PC | 50 | 495 (248) | 164 | 69 (35) | 1944 | 36 | 48 | 71 | 143 | 51 | 14 | ||
| PC | 30 | 495 (248) | 99 | 42 (21) | 1944 | 21 | 29 | 43 | 86 | 30 | 14 | ||
| 4 | CC | 100 | 495 (248) | 329 | 139 (70) | 2222 | 63 | 83 | 125 | 250 | 88 | 14 | |
| PC | 50 | 495 (248) | 164 | 69 (35) | 2222 | 31 | 42 | 63 | 125 | 44 | 14 | ||
| PC | 30 | 495 (248) | 99 | 42 (21) | 2222 | 19 | 25 | 37 | 75 | 27 | 14 | ||
| 4.5 | CC | 100 | 495 (248) | 329 | 139 (70) | 2500 | 56 | 74 | 111 | 222 | 79 | 14 | |
| PC | 50 | 495 (248) | 164 | 69 (35) | 2500 | 28 | 37 | 56 | 111 | 39 | 14 | ||
| PC | 30 | 495 (248) | 99 | 42 (21) | 2500 | 17 | 22 | 33 | 67 | 24 | 14 | ||
| 20 | 3 | CC | 100 | 495 (248) | 329 | 139 (70) | 1500 | 93 | 124 | 185 | 371 | 146 | 14 |
| PC | 50 | 495 (248) | 164 | 69 (35) | 1500 | 46 | 62 | 93 | 185 | 73 | 14 | ||
| PC | 30 | 495 (248) | 99 | 42 (21) | 1500 | 28 | 37 | 56 | 111 | 44 | 14 | ||
| 3.5 | CC | 100 | 495 (248) | 329 | 139.0 (69.5) | 1750 | 79 | 106 | 159 | 318 | 125 | 14 | |
| PC | 50 | 495 (248) | 164 | 69.4 (34.7) | 1750 | 40 | 53 | 79 | 159 | 62 | 14 | ||
| PC | 30 | 495 (248) | 99 | 41.6 (20.8) | 1750 | 24 | 32 | 48 | 95 | 37 | 14 | ||
| 4 | CC | 100 | 495 (248) | 329 | 139 (70) | 2000 | 70 | 93 | 139 | 278 | 109 | 14 | |
| PC | 50 | 495 (248) | 164 | 69 (35) | 2000 | 35 | 46 | 69 | 139 | 55 | 14 | ||
| PC | 30 | 495 (248) | 99 | 42 (21) | 2000 | 21 | 28 | 42 | 83 | 33 | 14 | ||
| 4.5 | CC | 100 | 495 (248) | 329 | 139 (70) | 2250 | 62 | 82 | 124 | 247 | 97 | 14 | |
| PC | 50 | 495 (248) | 164 | 69 (35) | 2250 | 31 | 41 | 62 | 123 | 49 | 14 | ||
| PC | 30 | 495 (248) | 99 | 42 (21) | 2250 | 19 | 25 | 37 | 74 | 29 | 14 | ||
| 22 | 3 | CC | 100 | 495 (248) | 329 | 139 (70) | 1364 | 102 | 136 | 204 | 408 | 176 | 14 |
| PC | 50 | 495 (248) | 164 | 69 (35) | 1364 | 51 | 68 | 102 | 204 | 88 | 14 | ||
| PC | 30 | 495 (248) | 99 | 42 (21) | 1364 | 31 | 41 | 61 | 122 | 53 | 14 | ||
| 3.5 | CC | 100 | 495 (248) | 329 | 139 (70) | 1591 | 87 | 117 | 175 | 350 | 151 | 14 | |
| PC | 50 | 495 (248) | 164 | 69 (35) | 1591 | 44 | 58 | 87 | 175 | 75 | 14 | ||
| PC | 30 | 495 (248) | 99 | 42 (21) | 1591 | 26 | 35 | 52 | 105 | 45 | 14 | ||
| 4 | CC | 100 | 495 (248) | 329 | 139 (70) | 1818 | 77 | 102 | 153 | 306 | 132 | 14 | |
| PC | 50 | 495 (248) | 164 | 69 (35) | 1818 | 38 | 51 | 76 | 153 | 66 | 14 | ||
| PC | 30 | 495 (248) | 99 | 42 (21) | 1818 | 23 | 31 | 46 | 92 | 40 | 14 | ||
| 4.5 | CC | 100 | 495 (248) | 329 | 139 (70) | 2045 | 68 | 91 | 136 | 272 | 117 | 14 | |
| PC | 50 | 495 (248) | 164 | 69 (35) | 2045 | 34 | 45 | 68 | 136 | 59 | 14 | ||
| PC | 30 | 495 (248) | 99 | 42 (21) | 2045 | 20 | 27 | 41 | 81 | 35 | 14 | ||
a Percent of merchantable volume b Total biomass c Merchantable volume d Brush available to be placed on a 5-m-long segment of trail based on trail width and amount of brush available at boom reach e clear cut f partial cut. ODT: oven dry tons.
Table A3.
Amount of brush available for soil protection as brush mats depending on trail spacing, trail width and varying trail coverage obtained from a an artificially regenerated high-yield white spruce stand (3).
Table A3.
Amount of brush available for soil protection as brush mats depending on trail spacing, trail width and varying trail coverage obtained from a an artificially regenerated high-yield white spruce stand (3).
| Trail Dimensions (m) | Treatment | Removal a (%) | Total Bio b GT ha−1 (ODT ha−1) | Merch. vol. c (m3 ha−1) | On-The-Ground Biomass GT ha−1 (ODT ha−1) | Trail Area (m2 ha−1) | Amount of Brush (kg m−2, Green Mass) Available Depending on the Percentage of Trail Area Covered in Brush | ||||||
|---|---|---|---|---|---|---|---|---|---|---|---|---|---|
| Spacing | Width | 100% | 75% | 50% | 25% | 5 m Segment d | Trail Clearing Only | ||||||
| 16 | 3 | PC e | 50 | 109 (55) | 47 | 17 (9) | 1875 | 9 | 12 | 18 | 37 | 12 | 2 |
| PC | 30 | 109 (55) | 28 | 10 (5) | 1875 | 6 | 7 | 11 | 22 | 7 | 2 | ||
| 3.5 | PC | 50 | 109 (55) | 47 | 17 (9) | 2188 | 8 | 11 | 16 | 32 | 10 | 2 | |
| PC | 30 | 109 (55) | 28 | 10 (5) | 2188 | 5 | 6 | 10 | 19 | 6 | 2 | ||
| 4 | PC | 50 | 109 (55) | 47 | 17 (9) | 2500 | 7 | 9 | 14 | 28 | 9 | 2 | |
| PC | 30 | 109 (55) | 28 | 10 (5) | 2500 | 4 | 6 | 8 | 17 | 5 | 2 | ||
| 4.5 | PC | 50 | 109 (55) | 47 | 17 (9) | 2813 | 6 | 8 | 12 | 25 | 8 | 2 | |
| PC | 30 | 109 (55) | 28 | 10 (5) | 2813 | 4 | 5 | 7 | 15 | 5 | 2 | ||
| 18 | 3 | PC | 50 | 109 (55) | 47 | 17 (9) | 1667 | 10 | 14 | 21 | 41 | 15 | 2 |
| PC | 30 | 109 (55) | 28 | 10 (5) | 1667 | 6 | 8 | 13 | 25 | 9 | 2 | ||
| 3.5 | PC | 50 | 109 (55) | 47 | 17 (9) | 1944 | 9 | 12 | 18 | 35 | 13 | 2 | |
| PC | 30 | 109 (55) | 28 | 10 (5) | 1944 | 5 | 7 | 11 | 21 | 8 | 2 | ||
| 4 | PC | 50 | 109 (55) | 47 | 17 (9) | 2222 | 8 | 10 | 16 | 31 | 11 | 2 | |
| PC | 30 | 109 (55) | 28 | 10 (5) | 2222 | 5 | 6 | 9 | 19 | 7 | 2 | ||
| 4.5 | PC | 50 | 109 (55) | 47 | 17 (9) | 2500 | 7 | 9 | 14 | 28 | 10 | 2 | |
| PC | 30 | 109 (55) | 28 | 10 (5) | 2500 | 4 | 6 | 8 | 17 | 6 | 2 | ||
| 20 | 3 | PC | 50 | 109 (55) | 47 | 17 (9) | 1500 | 12 | 15 | 23 | 46 | 18 | 2 |
| PC | 30 | 109 (55) | 28 | 10 (5) | 1500 | 7 | 9 | 14 | 28 | 11 | 2 | ||
| 3.5 | PC | 50 | 109 (55) | 47 | 17 (9) | 1750 | 10 | 13 | 20 | 39 | 15 | 2 | |
| PC | 30 | 109 (55) | 28 | 10 (5) | 1750 | 6 | 8 | 12 | 24 | 9 | 2 | ||
| 4 | PC | 50 | 109 (55) | 47 | 17 (9) | 2000 | 9 | 12 | 17 | 34 | 14 | 2 | |
| PC | 30 | 109 (55) | 28 | 10 (5) | 2000 | 5 | 7 | 10 | 21 | 8 | 2 | ||
| 4.5 | PC | 50 | 109 (55) | 47 | 17 (9) | 2250 | 8 | 10 | 15 | 31 | 12 | 2 | |
| PC | 30 | 109 (55) | 28 | 10 (5) | 2250 | 5 | 6 | 9 | 19 | 7 | 2 | ||
| 22 | 3 | PC | 50 | 109 (55) | 47 | 17 (9) | 1364 | 13 | 17 | 25 | 51 | 22 | 2 |
| PC | 30 | 109 (55) | 28 | 10 (5) | 1364 | 8 | 10 | 15 | 31 | 13 | 2 | ||
| 3.5 | PC | 50 | 109 (55) | 47 | 17 (9) | 1591 | 11 | 14 | 22 | 43 | 19 | 2 | |
| PC | 30 | 109 (55) | 28 | 10 (5) | 1591 | 7 | 9 | 13 | 26 | 11 | 2 | ||
| 4 | PC | 50 | 109 (55) | 47 | 17 (9) | 1818 | 10 | 13 | 19 | 38 | 16 | 2 | |
| PC | 30 | 109 (55) | 28 | 10 (5) | 1818 | 6 | 8 | 11 | 23 | 10 | 2 | ||
| 4.5 | PC | 50 | 109 (55) | 47 | 17 (9) | 2045 | 8 | 11 | 17 | 34 | 15 | 2 | |
| PC | 30 | 109 (55) | 28 | 10 (5) | 2045 | 5 | 7 | 10 | 20 | 9 | 2 | ||
a Percent of merchantable volume b Total biomass c Merchantable volume d Brush available to be placed on a 5-m-long segment of trail based on trail width and amount of brush available at boom reach e partial cut. ODT: oven dry tons.
Table A4.
Amount of brush available for soil protection as brush mats depending on trail spacing, trail width and varying trail coverage obtained from a naturally regenerated mixed-wood stand (4).
Table A4.
Amount of brush available for soil protection as brush mats depending on trail spacing, trail width and varying trail coverage obtained from a naturally regenerated mixed-wood stand (4).
| Trail Dimensions (m) | Treatment | Removal a (%) | Total Bio b GT ha−1 (ODT ha−1) | Merch. vol. c (m3 ha−1) | On-the-Ground Biomass GT ha−1 (ODT ha-1) | Trail Area (m2 ha−1) | Amount of Brush (kg m-2, Green Mass) Available Depending on the Percentage of Trail Area Covered in Brush | ||||||
|---|---|---|---|---|---|---|---|---|---|---|---|---|---|
| Spacing | Width | 100% | 75% | 50% | 25% | 5 m Segment d | Trail Clearing Only | ||||||
| 16 | 3 | CC e | 100 | 172 (86) | 112 | 67 (34) | 1875 | 36 | 48 | 72 | 144 | 45 | 7 |
| PC f | 50 | 172 (86) | 56 | 34 (17) | 1875 | 18 | 24 | 36 | 72 | 23 | 7 | ||
| PC | 30 | 172 (86) | 34 | 20 (10) | 1875 | 11 | 14 | 22 | 43 | 14 | 7 | ||
| 3.5 | CC | 100 | 172 (86) | 112 | 67 (34) | 2188 | 31 | 41 | 62 | 123 | 39 | 7 | |
| PC | 50 | 172 (86) | 56 | 34 (17) | 2188 | 15 | 21 | 31 | 61 | 19 | 7 | ||
| PC | 30 | 172 (86) | 34 | 20 (10) | 2188 | 9 | 12 | 19 | 37 | 12 | 7 | ||
| 4 | CC | 100 | 172 (86) | 112 | 67 (34) | 2500 | 27 | 36 | 54 | 108 | 34 | 7 | |
| PC | 50 | 172 (86) | 56 | 34 (17) | 2500 | 13 | 18 | 27 | 54 | 17 | 7 | ||
| PC | 30 | 172 (86) | 34 | 20 (10) | 2500 | 8 | 11 | 16 | 32 | 10 | 7 | ||
| 4.5 | CC | 100 | 172 (86) | 112 | 67 (34) | 2813 | 24 | 32 | 48 | 96 | 30 | 7 | |
| PC | 50 | 172 (86) | 56 | 34 (17) | 2813 | 12 | 16 | 24 | 48 | 15 | 7 | ||
| PC | 30 | 172 (86) | 34 | 20 (10) | 2813 | 7 | 10 | 14 | 29 | 9 | 7 | ||
| 18 | 3 | CC | 100 | 172 (86) | 112 | 67 (34) | 1667 | 40 | 54 | 81 | 162 | 57 | 7 |
| PC | 50 | 172 (86) | 56 | 34 (17) | 1667 | 20 | 27 | 40 | 81 | 29 | 7 | ||
| PC | 30 | 172 (86) | 34 | 20 (10) | 1667 | 12 | 16 | 24 | 49 | 17 | 7 | ||
| 3.5 | CC | 100 | 172 (86) | 112 | 67 (34) | 1944 | 35 | 46 | 69 | 139 | 49 | 7 | |
| PC | 50 | 172 (86) | 56 | 34 (17) | 1944 | 17 | 23 | 35 | 69 | 24 | 7 | ||
| PC | 30 | 172 (86) | 34 | 20 (10) | 1944 | 10 | 14 | 21 | 42 | 15 | 7 | ||
| 4 | CC | 100 | 172 (86) | 112 | 67 (34) | 2222 | 30 | 40 | 61 | 121 | 43 | 7 | |
| PC | 50 | 172 (86) | 56 | 34 (17) | 2222 | 15 | 20 | 30 | 61 | 21 | 7 | ||
| PC | 30 | 172 (86) | 34 | 20 (10) | 2222 | 9 | 12 | 18 | 36 | 13 | 7 | ||
| 4.5 | CC | 100 | 172 (86) | 112 | 67 (34) | 2500 | 27 | 36 | 54 | 108 | 38 | 7 | |
| PC | 50 | 172 (86) | 56 | 34 (17) | 2500 | 13 | 18 | 27 | 54 | 19 | 7 | ||
| PC | 30 | 172 (86) | 34 | 20 (10) | 2500 | 8 | 11 | 16 | 32 | 11 | 7 | ||
| 20 | 3 | CC | 100 | 172 (86) | 112 | 67 (34) | 1500 | 45 | 60 | 90 | 180 | 71 | 7 |
| PC | 50 | 172 (86) | 56 | 34 (17) | 1500 | 22 | 30 | 45 | 90 | 35 | 7 | ||
| PC | 30 | 172 (86) | 34 | 20 (10) | 1500 | 14 | 18 | 27 | 54 | 21 | 7 | ||
| 3.5 | CC | 100 | 172 (86) | 112 | 67 (34) | 1750 | 39 | 51 | 77 | 154 | 61 | 7 | |
| PC | 50 | 172 (86) | 56 | 34 (17) | 1750 | 19 | 26 | 38 | 77 | 30 | 7 | ||
| PC | 30 | 172 (86) | 34 | 20 (10) | 1750 | 12 | 15 | 23 | 46 | 18 | 7 | ||
| 4 | CC | 100 | 172 (86) | 112 | 67 (34) | 2000 | 34 | 45 | 67 | 135 | 53 | 7 | |
| PC | 50 | 172 (86) | 56 | 34 (17) | 2000 | 17 | 22 | 34 | 67 | 26 | 7 | ||
| PC | 30 | 172 (86) | 34 | 20 (10) | 2000 | 10 | 14 | 20 | 40 | 16 | 7 | ||
| 4.5 | CC | 100 | 172 (86) | 112 | 67 (34) | 2250 | 30 | 40 | 60 | 120 | 47 | 7 | |
| PC | 50 | 172 (86) | 56 | 34 (17) | 2250 | 15 | 20 | 30 | 60 | 24 | 7 | ||
| PC | 30 | 172 (86) | 34 | 20 (10) | 2250 | 9 | 12 | 18 | 36 | 14 | 7 | ||
| 22 | 3 | CC | 100 | 172 (86) | 112 | 67 (34) | 1364 | 49 | 66 | 99 | 198 | 85 | 7 |
| PC | 50 | 172 (86) | 56 | 34 (17) | 1364 | 25 | 33 | 49 | 99 | 43 | 7 | ||
| PC | 30 | 172 (86) | 34 | 20 (10) | 1364 | 15 | 20 | 30 | 59 | 26 | 7 | ||
| 3.5 | CC | 100 | 172 (86) | 112 | 67 (34) | 1591 | 42 | 57 | 85 | 170 | 73 | 7 | |
| PC | 50 | 172 (86) | 56 | 34 (17) | 1591 | 21 | 28 | 42 | 85 | 37 | 7 | ||
| PC | 30 | 172 (86) | 34 | 20 (10) | 1591 | 13 | 17 | 25 | 51 | 22 | 7 | ||
| 4 | CC | 100 | 172 (86) | 112 | 67 (34) | 1818 | 37 | 49 | 74 | 148 | 64 | 7 | |
| PC | 50 | 172 (86) | 56 | 34 (17) | 1818 | 19 | 25 | 37 | 74 | 32 | 7 | ||
| PC | 30 | 172 (86) | 34 | 20 (10) | 1818 | 11 | 15 | 22 | 44 | 19 | 7 | ||
| 4.5 | CC | 100 | 172 (86) | 112 | 67 (34) | 2045 | 33 | 44 | 66 | 132 | 57 | 7 | |
| PC | 50 | 172 (86) | 56 | 34 (17) | 2045 | 16 | 22 | 33 | 66 | 28 | 7 | ||
| PC | 30 | 172 (86) | 34 | 20 (10) | 2045 | 10 | 13 | 20 | 40 | 17 | 7 | ||
a Percent of merchantable volume b Total biomass c Merchantable volume d Brush available to be placed on a 5-m-long segment of trail based on trail width and amount of brush available at boom reach e clear cut f partial cut. ODT: oven dry tons.
Table A5.
Amount of brush available for soil protection as brush mats depending on trail spacing, trail width and varying trail coverage obtained from a naturally regenerated deciduous stand (5).
Table A5.
Amount of brush available for soil protection as brush mats depending on trail spacing, trail width and varying trail coverage obtained from a naturally regenerated deciduous stand (5).
| Trail Dimensions (m) | Treatment | Removal a (%) | Total Bio b GT ha−1 (ODT ha−1) | Merch. vol. c (m3 ha−1) | On-the-Ground Biomass GT ha−1 (ODT ha−1) | Trail Area (m2 ha−1) | Amount of Brush (kg m−2, Green Mass) Available Depending on the Percentage of Trail Area Covered in Brush | ||||||
|---|---|---|---|---|---|---|---|---|---|---|---|---|---|
| Spacing | Width | 100% | 75% | 50% | 25% | 5 m Segment d | Trail Clearing Only | ||||||
| 16 | 3 | CC e | 100 | 199 (100) | 100 | 97 (48) | 1875 | 52 | 69 | 103 | 207 | 65 | 10 |
| PC f | 50 | 199 (100) | 50 | 48 (24) | 1875 | 26 | 34 | 52 | 103 | 32 | 10 | ||
| PC | 30 | 199 (100) | 30 | 29 (15) | 1875 | 16 | 21 | 31 | 62 | 19 | 10 | ||
| 3.5 | CC | 100 | 199 (100) | 100 | 97 (48) | 2188 | 44 | 59 | 89 | 177 | 56 | 10 | |
| PC | 50 | 199 (100) | 50 | 48 (24) | 2188 | 22 | 30 | 44 | 89 | 28 | 10 | ||
| PC | 30 | 199 (100) | 30 | 29 (15) | 2188 | 13 | 18 | 27 | 53 | 17 | 10 | ||
| 4 | CC | 100 | 199 (100) | 100 | 97 (48) | 2500 | 39 | 52 | 77 | 155 | 49 | 10 | |
| PC | 50 | 199 (100) | 50 | 48 (24) | 2500 | 19 | 26 | 39 | 77 | 24 | 10 | ||
| PC | 30 | 199 (100) | 30 | 29 (15) | 2500 | 12 | 16 | 23 | 46 | 15 | 10 | ||
| 4.5 | CC | 100 | 199 (100) | 100 | 97 (48) | 2813 | 34 | 46 | 69 | 138 | 43 | 10 | |
| PC | 50 | 199 (100) | 50 | 48 (24) | 2813 | 17 | 23 | 34 | 69 | 22 | 10 | ||
| PC | 30 | 199 (100) | 30 | 29 (15) | 2813 | 10 | 14 | 21 | 41 | 13 | 10 | ||
| 18 | 3 | CC | 100 | 199 (100) | 100 | 97 (48) | 1667 | 58 | 77 | 116 | 232 | 82 | 10 |
| PC | 50 | 199 (100) | 50 | 48 (24) | 1667 | 29 | 39 | 58 | 116 | 41 | 10 | ||
| PC | 30 | 199 (100) | 30 | 29 (15) | 1667 | 17 | 23 | 35 | 70 | 25 | 10 | ||
| 3.5 | CC | 100 | 199 (100) | 100 | 97 (48) | 1944 | 50 | 66 | 100 | 199 | 70 | 10 | |
| PC | 50 | 199 (100) | 50 | 48 (24) | 1944 | 25 | 33 | 50 | 100 | 35 | 10 | ||
| PC | 30 | 199 (100) | 30 | 29 (15) | 1944 | 15 | 20 | 30 | 60 | 21 | 10 | ||
| 4 | CC | 100 | 199 (100) | 100 | 97 (48) | 2222 | 44 | 58 | 87 | 174 | 62 | 10 | |
| PC | 50 | 199 (100) | 50 | 48 (24) | 2222 | 22 | 29 | 44 | 87 | 31 | 10 | ||
| PC | 30 | 199 (100) | 30 | 29 (15) | 2222 | 13 | 17 | 26 | 52 | 18 | 10 | ||
| 4.5 | CC | 100 | 199 (100) | 100 | 97 (48) | 2500 | 39 | 52 | 77 | 155 | 55 | 10 | |
| PC | 50 | 199 (100) | 50 | 48 (24) | 2500 | 19 | 26 | 39 | 77 | 27 | 10 | ||
| PC | 30 | 199 (100) | 30 | 29 (15) | 2500 | 12 | 16 | 23 | 46 | 16 | 10 | ||
| 20 | 3 | CC | 100 | 199 (100) | 100 | 97 (48) | 1500 | 65 | 86 | 129 | 258 | 101 | 10 |
| PC | 50 | 199 (100) | 50 | 48 (24) | 1500 | 32 | 43 | 65 | 129 | 51 | 10 | ||
| PC | 30 | 199 (100) | 30 | 29 (15) | 1500 | 19 | 26 | 39 | 77 | 30 | 10 | ||
| 3.5 | CC | 100 | 199 (100) | 100 | 97 (48) | 1750 | 55 | 74 | 111 | 221 | 87 | 10 | |
| PC | 50 | 199 (100) | 50 | 48 (24) | 1750 | 28 | 37 | 55 | 111 | 43 | 10 | ||
| PC | 30 | 199 (100) | 30 | 29 (15) | 1750 | 17 | 22 | 33 | 66 | 26 | 10 | ||
| 4 | CC | 100 | 199 (100) | 100 | 97 (48) | 2000 | 48 | 65 | 97 | 194 | 76 | 10 | |
| PC | 50 | 199 (100) | 50 | 48 (24) | 2000 | 24 | 32 | 48 | 97 | 38 | 10 | ||
| PC | 30 | 199 (100) | 30 | 29 (15) | 2000 | 15 | 19 | 29 | 58 | 23 | 10 | ||
| 4.5 | CC | 100 | 199 (100) | 100 | 97 (48) | 2250 | 43 | 57 | 86 | 172 | 68 | 10 | |
| PC | 50 | 199 (100) | 50 | 48 (24) | 2250 | 22 | 29 | 43 | 86 | 34 | 10 | ||
| PC | 30 | 199 (100) | 30 | 29 (15) | 2250 | 13 | 17 | 26 | 52 | 20 | 10 | ||
| 22 | 3 | CC | 100 | 199 (100) | 100 | 97 (48) | 1364 | 71 | 95 | 142 | 284 | 123 | 10 |
| PC | 50 | 199 (100) | 50 | 48 (24) | 1364 | 36 | 47 | 71 | 142 | 61 | 10 | ||
| PC | 30 | 199 (100) | 30 | 29 (15) | 1364 | 21 | 28 | 43 | 85 | 37 | 10 | ||
| 3.5 | CC | 100 | 199 (100) | 100 | 97 (48) | 1591 | 61 | 81 | 122 | 243 | 105 | 10 | |
| PC | 50 | 199 (100) | 50 | 48 (24) | 1591 | 30 | 41 | 61 | 122 | 53 | 10 | ||
| PC | 30 | 199 (100) | 30 | 29 (15) | 1591 | 18 | 24 | 37 | 73 | 32 | 10 | ||
| 4 | CC | 100 | 199 (100) | 100 | 97 (48) | 1818 | 53 | 71 | 107 | 213 | 92 | 10 | |
| PC | 50 | 199 (100) | 50 | 48 (24) | 1818 | 27 | 36 | 53 | 107 | 46 | 10 | ||
| PC | 30 | 199 (100) | 30 | 29 (15) | 1818 | 16 | 21 | 32 | 64 | 28 | 10 | ||
| 4.5 | CC | 100 | 199 (100) | 100 | 97 (48) | 2045 | 47 | 63 | 95 | 189 | 82 | 10 | |
| PC | 50 | 199 (100) | 50 | 48 (24) | 2045 | 24 | 32 | 47 | 95 | 41 | 10 | ||
| PC | 30 | 199 (100) | 30 | 29 (15) | 2045 | 14 | 19 | 28 | 57 | 25 | 10 | ||
a Percent of merchantable volume b Total biomass c Merchantable volume d Brush available to be placed on a 5-m-long segment of trail based on trail width and amount of brush available at boom reach e clear cut f partial cut. ODT: oven dry tons.
Table A6.
Effect of varying brush mat requirements on the number of trees required to be delimbed on the machine operating trail and the number of trees additionally available for other uses (stand 2).
Table A6.
Effect of varying brush mat requirements on the number of trees required to be delimbed on the machine operating trail and the number of trees additionally available for other uses (stand 2).
| Trail Dimensions (m) | Removal a (%) | On-The-Ground Biomass b GT ha−1 (ODT ha−1) | Trees Harvested ha−1 | Available Brush (kg Green Mass) and Corresponding Number of Trees c () | Number of Trees Required and Additionally Available per Brush Mat Amount (kg m−2, Green Mass) | ||||||||||||
|---|---|---|---|---|---|---|---|---|---|---|---|---|---|---|---|---|---|
| Spacing | Width | 5 | 10 | 15 | 20 | 25 | 30 | ||||||||||
| R d | A e | R | A | R | A | R | A | R | A | R | A | ||||||
| 16 | 3 | 100 | 139 (70) | 1003 | 1397 (10) | 1 | 9 | 2 | 8 | 3 | 8 | 4 | 7 | 4 | 6 | 5 | 5 |
| 50 | 69 (35) | 501 | 698 (5) | 1 | 4 | 2 | 3 | 3 | 2 | 4 | 2 | 4 | 1 | 5 | 0 | ||
| 30 | 42 (21) | 300 | 418 (3) | 1 | 2 | 2 | 1 | 3 | 0 | 4 | 0 | 4 | −1 | 5 | −2 | ||
| 3.5 | 100 | 139 (70) | 1003 | 1397 (10) | 1 | 9 | 2 | 8 | 3 | 7 | 4 | 6 | 5 | 5 | 6 | 4 | |
| 50 | 69 (35) | 501 | 698 (5) | 1 | 4 | 2 | 3 | 3 | 2 | 4 | 1 | 5 | 0 | 6 | −1 | ||
| 30 | 42 (21) | 300 | 418 (3) | 1 | 2 | 2 | 1 | 3 | 0 | 4 | −1 | 5 | −2 | 6 | −3 | ||
| 4 | 100 | 139 (70) | 1003 | 1397 (10) | 1 | 9 | 2 | 8 | 4 | 7 | 5 | 6 | 6 | 4 | 7 | 3 | |
| 50 | 69 (35) | 501 | 698 (5) | 1 | 4 | 2 | 3 | 4 | 2 | 5 | 0 | 6 | −1 | 7 | −2 | ||
| 30 | 42 (21) | 300 | 418 (3) | 1 | 2 | 2 | 1 | 4 | 0 | 5 | −2 | 6 | −3 | 7 | −4 | ||
| 4.5 | 100 | 139 (70) | 1003 | 1397 (10) | 1 | 9 | 3 | 8 | 4 | 6 | 5 | 5 | 7 | 4 | 8 | 2 | |
| 50 | 69 (35) | 501 | 698 (5) | 1 | 4 | 3 | 2 | 4 | 1 | 5 | 0 | 7 | −2 | 8 | −3 | ||
| 30 | 42 (21) | 300 | 418 (3) | 1 | 2 | 3 | 0 | 4 | −1 | 5 | −2 | 7 | −4 | 8 | −5 | ||
| 18 | 3 | 100 | 139 (70) | 1003 | 1769 (13) | 1 | 12 | 2 | 11 | 3 | 10 | 4 | 9 | 5 | 8 | 6 | 7 |
| 50 | 69 (35) | 501 | 883 (6) | 1 | 5 | 2 | 4 | 3 | 4 | 4 | 3 | 5 | 2 | 6 | 1 | ||
| 30 | 42 (21) | 300 | 529 (4) | 1 | 3 | 2 | 2 | 3 | 1 | 4 | 0 | 5 | −1 | 6 | −2 | ||
| 3.5 | 100 | 139 (70) | 1003 | 1769 (13) | 1 | 12 | 2 | 11 | 3 | 9 | 5 | 8 | 6 | 7 | 7 | 6 | |
| 50 | 69 (35) | 501 | 883 (6) | 1 | 5 | 2 | 4 | 3 | 3 | 5 | 2 | 6 | 1 | 7 | 0 | ||
| 30 | 42 (21) | 300 | 529 (4) | 1 | 3 | 2 | 2 | 3 | 0 | 5 | −1 | 6 | −2 | 7 | −3 | ||
| 4 | 100 | 139 (70) | 1003 | 1769 (13) | 1 | 12 | 3 | 10 | 4 | 9 | 5 | 8 | 7 | 6 | 8 | 5 | |
| 50 | 69 (35) | 501 | 883 (6) | 1 | 5 | 3 | 4 | 4 | 3 | 5 | 1 | 7 | 0 | 8 | −1 | ||
| 30 | 42 (21) | 300 | 529 (4) | 1 | 3 | 3 | 1 | 4 | 0 | 5 | −1 | 7 | −3 | 8 | −4 | ||
| 4.5 | 100 | 139 (70) | 1003 | 1769 (13) | 2 | 11 | 3 | 10 | 4 | 8 | 6 | 7 | 7 | 6 | 9 | 4 | |
| 50 | 69 (35) | 501 | 883 (6) | 2 | 5 | 3 | 4 | 4 | 2 | 6 | 1 | 7 | −1 | 9 | −2 | ||
| 30 | 42 (21) | 300 | 529 (4) | 2 | 2 | 3 | 1 | 4 | −1 | 6 | −2 | 7 | −4 | 9 | −5 | ||
| 20 | 3 | 100 | 139 (70) | 1003 | 2183 (16) | 1 | 15 | 2 | 14 | 3 | 13 | 4 | 11 | 5 | 10 | 7 | 9 |
| 50 | 69 (35) | 501 | 1090 (8) | 1 | 7 | 2 | 6 | 3 | 5 | 4 | 4 | 5 | 3 | 7 | 1 | ||
| 30 | 42 (21) | 300 | 653 (5) | 1 | 4 | 2 | 3 | 3 | 2 | 4 | 0 | 5 | −1 | 7 | −2 | ||
| 3.5 | 100 | 139 (70) | 1003 | 2183 (16) | 1 | 15 | 3 | 13 | 4 | 12 | 5 | 11 | 6 | 9 | 8 | 8 | |
| 50 | 69 (35) | 501 | 1090 (8) | 1 | 7 | 3 | 5 | 4 | 4 | 5 | 3 | 6 | 2 | 8 | 0 | ||
| 30 | 42 (21) | 300 | 653 (5) | 1 | 4 | 3 | 2 | 4 | 1 | 5 | 0 | 6 | −2 | 8 | −3 | ||
| 4 | 100 | 139 (70) | 1003 | 2183 (16) | 1 | 14 | 3 | 13 | 4 | 11 | 6 | 10 | 7 | 9 | 9 | 7 | |
| 50 | 69 (35) | 501 | 1090 (8) | 1 | 6 | 3 | 5 | 4 | 4 | 6 | 2 | 7 | 1 | 9 | −1 | ||
| 30 | 42 (21) | 300 | 653 (5) | 1 | 3 | 3 | 2 | 4 | 0 | 6 | −1 | 7 | −3 | 9 | −4 | ||
| 4.5 | 100 | 139 (70) | 1003 | 2183 (16) | 2 | 14 | 3 | 13 | 5 | 11 | 7 | 9 | 8 | 8 | 10 | 6 | |
| 50 | 69 (35) | 501 | 1090 (8) | 2 | 6 | 3 | 5 | 5 | 3 | 7 | 1 | 8 | 0 | 10 | −2 | ||
| 30 | 42 (21) | 300 | 653 (5) | 2 | 3 | 3 | 2 | 5 | 0 | 7 | −2 | 8 | −3 | 10 | −5 | ||
| 22 | 3 | 100 | 139 (70) | 1003 | 2642 (19) | 1 | 18 | 2 | 17 | 4 | 16 | 5 | 14 | 6 | 13 | 7 | 12 |
| 50 | 69 (35) | 501 | 1319 (10) | 1 | 8 | 2 | 7 | 4 | 6 | 5 | 5 | 6 | 4 | 7 | 2 | ||
| 30 | 42 (21) | 300 | 791 (6) | 1 | 5 | 2 | 3 | 4 | 2 | 5 | 1 | 6 | 0 | 7 | −1 | ||
| 3.5 | 100 | 139 (70) | 1003 | 2642 (19) | 1 | 18 | 3 | 16 | 4 | 15 | 6 | 14 | 7 | 12 | 8 | 11 | |
| 50 | 69 (35) | 501 | 1319 (10) | 1 | 8 | 3 | 7 | 4 | 5 | 6 | 4 | 7 | 3 | 8 | 1 | ||
| 30 | 42 (21) | 300 | 791 (6) | 1 | 4 | 3 | 3 | 4 | 2 | 6 | 0 | 7 | −1 | 8 | −3 | ||
| 4 | 100 | 139 (70) | 1003 | 2642 (19) | 2 | 18 | 3 | 16 | 5 | 14 | 6 | 13 | 8 | 11 | 10 | 10 | |
| 50 | 69 (35) | 501 | 1319 (10) | 2 | 8 | 3 | 6 | 5 | 5 | 6 | 3 | 8 | 2 | 10 | 0 | ||
| 30 | 42 (21) | 300 | 791 (6) | 2 | 4 | 3 | 3 | 5 | 1 | 6 | −1 | 8 | −2 | 10 | −4 | ||
| 4.5 | 100 | 139 (70) | 1003 | 2642 (19) | 2 | 17 | 4 | 16 | 5 | 14 | 7 | 12 | 9 | 10 | 11 | 8 | |
| 50 | 69 (35) | 501 | 1319 (10) | 2 | 8 | 4 | 6 | 5 | 4 | 7 | 2 | 9 | 1 | 11 | −1 | ||
| 30 | 42 (21) | 300 | 791 (6) | 2 | 4 | 4 | 2 | 5 | 0 | 7 | −1 | 9 | −3 | 11 | −5 | ||
a Percent of merchantable volume b Based on 69.3 kg of biomass per tree c Amount of brush available in one-half of a 10-m-radius circle d Number of trees required for trail protection e Number of trees additionally available. ODT: oven dry tons.
Table A7.
Effect of varying brush mat requirements on remaining biomass (stand 2).
| Trail Dimensions (m) | Removal a (%) | On-the-Ground Biomass b GT ha−1 (ODT ha−1) | Trees Harvested ha−1 | Average Biomass Per Tree (kg Green Mass) | Biomass Remaining (GT ha−1 and % of Total on-the-Ground) Depending on Brush Mat Amount (kg m−2 Green Mass) | ||||||||||||
|---|---|---|---|---|---|---|---|---|---|---|---|---|---|---|---|---|---|
| Spacing | Width | 5 | 10 | 15 | 20 | 25 | 30 | ||||||||||
| GT ha−1 | % c | GT ha−1 | % | GT ha−1 | % | GT ha−1 | % | GT ha−1 | % | GT ha−1 | % | ||||||
| 16 | 3 | 100 | 139 (70) | 1003 | 139 | 127 | 91 | 115 | 83 | 103 | 74 | 91 | 66 | 79 | 57 | 67 | 48 |
| 50 | 69 (35) | 501 | 139 | 58 | 83 | 46 | 66 | 34 | 48 | 22 | 31 | 10 | 14 | −2 | −3 | ||
| 30 | 42 (21) | 300 | 139 | 30 | 71 | 18 | 43 | 6 | 14 | −6 | −15 | −18 | −43 | −30 | −72 | ||
| 3.5 | 100 | 139 (70) | 1003 | 139 | 125 | 90 | 111 | 80 | 97 | 70 | 83 | 60 | 69 | 50 | 55 | 40 | |
| 50 | 69 (35) | 501 | 139 | 56 | 80 | 42 | 60 | 28 | 40 | 14 | 20 | 0 | 0 | −14 | −20 | ||
| 30 | 42 (21) | 300 | 139 | 28 | 67 | 14 | 33 | 0 | 0 | −14 | −34 | −28 | −67 | −42 | −101 | ||
| 4 | 100 | 139 (70) | 1003 | 139 | 123 | 89 | 107 | 77 | 91 | 66 | 75 | 54 | 59 | 43 | 44 | 31 | |
| 50 | 69 (35) | 501 | 139 | 54 | 77 | 38 | 54 | 22 | 31 | 6 | 8 | −10 | −15 | −26 | −38 | ||
| 30 | 42 (21) | 300 | 139 | 26 | 62 | 10 | 23 | −6 | −15 | −22 | −53 | −38 | −91 | −54 | −130 | ||
| 4.5 | 100 | 139 (70) | 1003 | 139 | 121 | 87 | 103 | 74 | 85 | 61 | 67 | 48 | 50 | 36 | 32 | 23 | |
| 50 | 69 (35) | 501 | 139 | 52 | 74 | 34 | 48 | 16 | 23 | −2 | −3 | −20 | −29 | −38 | −55 | ||
| 30 | 42 (21) | 300 | 139 | 24 | 57 | 6 | 14 | −12 | −29 | −30 | −72 | -48 | −115 | −66 | −158 | ||
| 18 | 3 | 100 | 139 (70) | 1003 | 139 | 128 | 92 | 118 | 85 | 107 | 77 | 97 | 69 | 86 | 62 | 75 | 54 |
| 50 | 69 (35) | 501 | 139 | 59 | 85 | 48 | 69 | 38 | 54 | 27 | 39 | 16 | 24 | 6 | 8 | ||
| 30 | 42 (21) | 300 | 139 | 31 | 74 | 20 | 49 | 10 | 23 | −1 | −2 | −12 | −28 | −22 | −53 | ||
| 3.5 | 100 | 139 (70) | 1003 | 139 | 127 | 91 | 114 | 82 | 102 | 73 | 90 | 64 | 77 | 55 | 65 | 47 | |
| 50 | 69 (35) | 501 | 139 | 57 | 82 | 45 | 64 | 32 | 46 | 20 | 29 | 8 | 11 | −5 | −7 | ||
| 30 | 42 (21) | 300 | 139 | 29 | 70 | 17 | 40 | 5 | 11 | −8 | −19 | −20 | −49 | −33 | −79 | ||
| 4 | 100 | 139 (70) | 1003 | 139 | 125 | 90 | 111 | 80 | 97 | 69 | 82 | 59 | 68 | 49 | 54 | 39 | |
| 50 | 69 (35) | 501 | 139 | 55 | 80 | 41 | 59 | 27 | 39 | 13 | 18 | −1 | −2 | −16 | −22 | ||
| 30 | 42 (21) | 300 | 139 | 28 | 66 | 13 | 32 | −1 | −2 | −15 | −36 | −29 | −70 | −43 | −104 | ||
| 4.5 | 100 | 139 (70) | 1003 | 139 | 123 | 89 | 107 | 77 | 91 | 66 | 75 | 54 | 59 | 43 | 44 | 31 | |
| 50 | 69 (35) | 501 | 139 | 54 | 77 | 38 | 54 | 22 | 31 | 6 | 8 | −10 | −15 | −26 | −38 | ||
| 30 | 42 (21) | 300 | 139 | 26 | 62 | 10 | 23 | −6 | −15 | −22 | −53 | −38 | −91 | −54 | −130 | ||
| 20 | 3 | 100 | 139 (70) | 1003 | 139 | 130 | 93 | 120 | 86 | 110 | 79 | 101 | 73 | 91 | 66 | 82 | 59 |
| 50 | 69 (35) | 501 | 139 | 60 | 86 | 50 | 72 | 41 | 59 | 31 | 45 | 22 | 31 | 12 | 17 | ||
| 30 | 42 (21) | 300 | 139 | 32 | 77 | 23 | 54 | 13 | 31 | 3 | 8 | −6 | −15 | −16 | −38 | ||
| 3.5 | 100 | 139 (70) | 1003 | 139 | 128 | 92 | 117 | 84 | 106 | 76 | 94 | 68 | 83 | 60 | 72 | 52 | |
| 50 | 69 (35) | 501 | 139 | 58 | 84 | 47 | 68 | 36 | 52 | 25 | 36 | 14 | 20 | 3 | 4 | ||
| 30 | 42 (21) | 300 | 139 | 31 | 73 | 19 | 46 | 8 | 20 | −3 | −7 | −14 | −34 | −25 | −61 | ||
| 4 | 100 | 139 (70) | 1003 | 139 | 126 | 91 | 114 | 82 | 101 | 73 | 88 | 63 | 75 | 54 | 63 | 45 | |
| 50 | 69 (35) | 501 | 139 | 57 | 82 | 44 | 63 | 31 | 45 | 19 | 27 | 6 | 8 | −7 | −10 | ||
| 30 | 42 (21) | 300 | 139 | 29 | 69 | 16 | 39 | 3 | 8 | −9 | −22 | −22 | −53 | −35 | −84 | ||
| 4.5 | 100 | 139 (70) | 1003 | 139 | 125 | 90 | 110 | 79 | 96 | 69 | 82 | 59 | 67 | 48 | 53 | 38 | |
| 50 | 69 (35) | 501 | 139 | 55 | 79 | 41 | 59 | 26 | 38 | 12 | 17 | −2 | −3 | −17 | −24 | ||
| 30 | 42 (21) | 300 | 139 | 27 | 66 | 13 | 31 | −1 | −3 | −16 | −38 | −30 | −72 | −44 | −107 | ||
| 22 | 3 | 100 | 139 (70) | 1003 | 139 | 130 | 94 | 122 | 88 | 113 | 81 | 104 | 75 | 96 | 69 | 87 | 63 |
| 50 | 69 (35) | 501 | 139 | 61 | 87 | 52 | 75 | 43 | 62 | 35 | 50 | 26 | 37 | 17 | 25 | ||
| 30 | 42 (21) | 300 | 139 | 33 | 79 | 24 | 58 | 16 | 37 | 7 | 17 | −2 | −4 | −11 | −25 | ||
| 3.5 | 100 | 139 (70) | 1003 | 139 | 129 | 93 | 119 | 85 | 109 | 78 | 99 | 71 | 88 | 64 | 78 | 56 | |
| 50 | 69 (35) | 501 | 139 | 59 | 85 | 49 | 71 | 39 | 56 | 29 | 42 | 19 | 27 | 9 | 12 | ||
| 30 | 42 (21) | 300 | 139 | 32 | 76 | 21 | 51 | 11 | 27 | 1 | 3 | −9 | −22 | −19 | −46 | ||
| 4 | 100 | 139 (70) | 1003 | 139 | 127 | 92 | 116 | 83 | 104 | 75 | 93 | 67 | 81 | 58 | 70 | 50 | |
| 50 | 69 (35) | 501 | 139 | 58 | 83 | 46 | 67 | 35 | 50 | 23 | 33 | 12 | 17 | 0 | 0 | ||
| 30 | 42 (21) | 300 | 139 | 30 | 72 | 19 | 44 | 7 | 17 | −5 | −11 | −16 | −39 | −28 | −67 | ||
| 4.5 | 100 | 139 (70) | 1003 | 139 | 126 | 91 | 113 | 81 | 100 | 72 | 87 | 63 | 74 | 53 | 61 | 44 | |
| 50 | 69 (35) | 501 | 139 | 56 | 81 | 43 | 62 | 30 | 44 | 17 | 25 | 4 | 6 | −9 | −13 | ||
| 30 | 42 (21) | 300 | 139 | 29 | 69 | 16 | 37 | 3 | 6 | −11 | −25 | −24 | −57 | −37 | −88 | ||
a Percent of merchantable volume b Green tons per hectare c Percent of biomass remaining in relation to total on-the-ground biomass available. ODT: oven dry tons.
References
- Stupak, I.; Asikainen, A.; Jonsell, M.; Karltun, E.; Lunnan, A.; Mizaraitė, D.; Pasanen, K.; Pärn, H.; Raulund-Rasmussen, K.; Röser, D.; et al. Sustainable utilisation of forest biomass for energy—Possibilities and problems: Policy, legislation, certification, and recommendations and guidelines in the Nordic, Baltic, and other European countries. Biomass Bioenergy 2007, 31, 666–684. [Google Scholar] [CrossRef]
- Clark, D. What Color is Your Building? Measuring and Reducing the Energy and Carbon Footprint of Buildings, 1st ed.; RIBA Publishing: London, UK, 2013; p. 320. ISBN 978-1859464472. [Google Scholar]
- Mani, S.; Sokhansanj, S.; Bi, X.; Turhollow, A. Economics of producing fuel pellets from biomass. Appl. Eng. Agric. 2006, 22, 421–426. [Google Scholar] [CrossRef]
- Mladenoff, D.J.; Forrester, J.A.; Schatz, J. Impacts of Biomass Removal on Carbon and Nutrient Pools in Wisconsin Northern Hardwood Forests: Establishment of a Long-Term Study; Environment and Economic Research and Development Program; Public Service Commission of Wisconsin: Madison, WI, USA, 2010; 38p.
- Stupak, I.; Asikainen, A.; Rӧser, D.; Pasanen, K. Sustainable Use of Forest Biomass for Energy: A Synthesis with Focus on the Baltic and Nordic Region; Rӧser, D., Asikainen, A., Raulund-Rasmussen, K., Stupak, I., Eds.; Springer: Dodrecht, The Netherlands, 2008; pp. 155–196. [Google Scholar]
- Labelle, E.R.; Jaeger, D. Quantifying the use of brush mats in reducing forwarder peak loads and surface contact pressures. Croat. J. For. Eng. 2012, 33, 249–274. [Google Scholar]
- Poltorak, B.J.; Labelle, E.R.; Jaeger, D. Soil displacement during ground-based mechanized forest operations using mixed-wood brush mats. Soil Tillage Res. 2018, 170, 96–104. [Google Scholar] [CrossRef]
- Labelle, E.R.; Jaeger, D.; Poltorak, B.J. Assessing the ability of hardwood and softwood brush mats to distribute applied loads. Croat. J. For. Eng. 2015, 36, 227–242. [Google Scholar]
- King, T.; Haines, S. Soil Compaction Absent in Plantation Thinning; Southern Forest Experiment Station Research Note; US Department of Agriculture, Forest Service, Southern Forest Experiment Station: New Orleans, LA, USA, 1979; 4p.
- McMahon, S.; Evanson, T. The Effect of Slash Cover in Reducing Soil Compaction Resulting from Vehicle Passage; Report No. 19(1); LIRO: Rotorua, New Zealand, 1994; 4p. [Google Scholar]
- Eliasson, L.; Wästerlund, I. Effects of slash reinforcement of strip roads on rutting and soil compaction on a moist fine-grained soil. For. Ecol. Manag. 2007, 252, 118–123. [Google Scholar] [CrossRef]
- Matangaran, J.R. Soil compaction by Valmet forwarder operation at soil surface with and without slash. J. Trop. For. Manag. 2012, 18, 52–59. [Google Scholar] [CrossRef]
- Solgi, A.; Naghdi, R.; Labelle, E.R.; Zenner, E.K. The effects of using soil protective mats of varying compositions and amounts on the intensity of soil disturbances caused by ground-based skidding operations. Int. J. For. Eng. 2018, 29, 199–207. [Google Scholar]
- Han, H.-S.; Dumroese, D.; Han, S.-K.; Tirocke, J. Effect of slash, machine passes, and moisture content on soil strength in a cut-to-length harvesting. Int. J. For. Eng. 2006, 17, 11–24. [Google Scholar]
- Labelle, E.R.; Poltorak, B.J.; Jaeger, D. The role of brush mats in mitigating machine induced soil disturbances: An assessment using absolute and relative soil bulk density and penetration resistance. Can. J. For. Res. 2018, 16, in press. [Google Scholar]
- Cormier, D.; Ryans, M. Estimating Forest Biomass Supply and Costs with the BiOS Model: User Guide; IR-2006-05-24; FP Innovations: Vancouver, BC, Canada, 2006; 23p. [Google Scholar]
- Rӧser, D.; Pasanen, K.; Asikainen, A. Decision-support program “EnerTree” for analyzing forest residue recovery options. Biomass Bioenergy 2006, 30, 326–333. [Google Scholar] [CrossRef]
- Ralevic, P.; Ryans, M.; Cormier, D. Assessing forest biomass for bioenergy: Operational challenges and cost considerations. For. Chron. 2010, 86, 43–50. [Google Scholar] [CrossRef] [Green Version]
- Plonski, W.L. Normal Yield Tables (Metric) for Major Forest Species in Ontario; Ontario Ministry of Natural Resources: Toronto, ON, Canada, 1981; 40p. [Google Scholar]
- Rosolem, C.A.; Foloni, J.S.S.; Tiritan, C.S. Root growth and nutrient accumulation in cover crops as affected by soil compaction. Soil Tillage Res. 2002, 65, 109–115. [Google Scholar] [CrossRef]
- Greacen, E.L.; Sands, R. Compaction of forest soils: A review. Aust. J. Soil Res. 1980, 18, 169–189. [Google Scholar] [CrossRef]
- Murphy, G.; Firth, J.G.; Skinner, M.F. Long-term impacts of forest harvesting related soil disturbance on log product yield and economic potential in a New Zealand forest. Silva Fenn. 2004, 38, 279–289. [Google Scholar] [CrossRef]
- Froehlich, H.A.; McNabb, D.S. Minimizing soil compaction in Pacific Northwest forest. In Forest Soils and Treatment Impacts, Proceedings of the 6th North American Forest Soils Conference, Knoxville, TN, USA, 19–23 June 1983; Stone, E.L., Ed.; Department of Forestry, Wildlife and Fisheries, University of Tennessee: Knoxville, TN, USA, 1984; pp. 159–192. [Google Scholar]
- Helms, J.A.; Hipkin, C.; Alexander, E.B. Effects of soil compaction on height growth of a California ponderosa pine plantation. West J. Appl. For. 1986, 1, 104–108. [Google Scholar]
- Labelle, E.R.; Jaeger, D. Soil compaction caused by cut-to-length forest operations and possible short-term natural rehabilitation of soil density. Soil Sci. Soc. Am. J. 2011, 75, 2314–2329. [Google Scholar] [CrossRef]
- McDonald, T.P.; Seixas, F. Effect of slash on forwarder soil compaction. Int. J. For. Eng. 1997, 8, 15–26. [Google Scholar]
- Wronski, E.B.; Stodart, D.M.; Humphreys, N. Trafficability assessment as an aid to planning logging operations. Appita 1990, 43, 18–22. [Google Scholar]
- Sutherland, B.J. Preventing Soil Compaction and Rutting in the Boreal Forest of Western Canada: A Practical Guide to Operating Timber-Harvesting Equipment; Forest Engineering Research Institute of Canada (FERIC): Vancouver, BC, Canada, 2003; 52p. [Google Scholar]
- Labelle, E.R.; Jaeger, D. Effects of steel flexible tracks on forwarder peak load distribution: Results from a prototype load test platform. Croat. J. For. Eng. 2019, 40, 16. [Google Scholar]
- Borchert, H.; Huber, C.; Göttlein, A.; Kremer, J. Nutrient concentration on skid trails under brush-mats—Is a redistribution of nutrients possible? Croat. J. For. Eng. 2015, 36, 243–252. [Google Scholar]
- Atlantic Forestry Review. Is There Sufficient Biomass Available in New Brunswick to Support Green Energy Production? DvL Publishing: Moncton, NB, Canada, 2009. [Google Scholar]
- New Brunswick Department of Natural Resources. Forest Biomass Harvesting; Policy Number FMB 019 2008; New Brunswick Department of Natural Resources: Fredericton, NB, Canada, 2008; 9p.
Figure 1.
Visual representation of the effect of different brush mat requirements on the number of trees to be delimbed on the machine operating trail and corresponding number of trees remaining for other uses based on the area covered by the sweep of a 10-m-long harvester boom. Scenarios presented are for stand 2 (black spruce plantation) and relate to a trail width of 3.5 m and spacing of 20 m between trail centerlines.

Figure 2.
Average number of trees (located within the area covered by a one-half 10-m radius sweep of a 10-m-long machine boom) with brush available for bioenergy use for varying trail widths after allocating required brush mat amounts for trail protection. All trail spacings combined.
Figure 2.
Average number of trees (located within the area covered by a one-half 10-m radius sweep of a 10-m-long machine boom) with brush available for bioenergy use for varying trail widths after allocating required brush mat amounts for trail protection. All trail spacings combined.

Figure 3.
Relationship between machine operating trail area and brush amount available for soil protection on the trail based on varying on-the-ground biomass.
Figure 3.
Relationship between machine operating trail area and brush amount available for soil protection on the trail based on varying on-the-ground biomass.

Table 1.
Stand descriptions.
| Stand Number and Description | Properties | Species | ||||
|---|---|---|---|---|---|---|
| 1 (Softwood naturally regenerated) 115 years old | Black spruce | Balsam fir | Eastern white Cedar | |||
| Composition (%) | 30 | 35 | 35 | |||
| Dbh (cm) | 14.0 | 16.0 | 23.0 | |||
| Height (m) | 15.0 | 16.0 | 22.0 | |||
| Density (stems ha−1) | 198 | 159 | 232 | |||
| 2 (Softwood artificially regenerated; black spruce plantation) 75 years old | Black spruce | |||||
| Composition (%) | 100 | |||||
| Dbh (cm) | 23.0 | |||||
| Height (m) | 20.0 | |||||
| Density (stems ha−1) | 1003 | |||||
| 3 (Softwood artificially regenerated; white spruce plantation) 35 years old | White spruce | |||||
| Composition (%) | 100 | |||||
| Dbh (cm) | 11.0 | |||||
| Height (m) | 9.0 | |||||
| Density (stems ha−1) | 2666 | |||||
| 4 (Mixed wood naturally regenerated) 95 years old | Balsam fir | Larch | Sugar maple | Red Maple | Yellow birch | |
| Composition (%) | 30 | 21 | 7 | 31 | 11 | |
| Dbh (cm) | 16.0 | 22.0 | 19.0 | 21.0 | 18.0 | |
| Height (m) | 14.0 | 18.0 | 19.0 | 18.0 | 19.0 | |
| Density (stems ha−1) | 214 | 203 | 29 | 130 | 46 | |
| 5 (Hardwood naturally regenerated) 100 years old | Red maple | White birch | Beech | Poplar | ||
| Composition (%) | 35 | 35 | 10 | 20 | ||
| Dbh (cm) | 22.0 | 21.0 | 22.5 | 26.0 | ||
| Height (m) | 20.5 | 19.5 | 21.0 | 25.0 | ||
| Density (stems ha−1) | 100 | 153 | 29 | 102 | ||
Table 2.
Relation between harvester boom length, trail spacing, trail width, and trail area in a fully mechanized cut-to-length operation.
Table 2.
Relation between harvester boom length, trail spacing, trail width, and trail area in a fully mechanized cut-to-length operation.
| Harvester Boom Length (m) | Trail Dimensions (m) | Trail Area (m2 ha−1) | Area of Harvest Block Covered by Trail (%) | Width of Forested Block Between Trails (m) | |
|---|---|---|---|---|---|
| Spacing | Width | ||||
| 8 | 16 | 3.0 | 1875 | 18.8 | 13.0 |
| 3.5 | 2188 | 21.9 | 12.5 | ||
| 4.0 | 2500 | 25.0 | 12.0 | ||
| 4.5 | 2813 | 28.1 | 11.5 | ||
| 9 | 18 | 3.0 | 1667 | 16.7 | 15.0 |
| 3.5 | 1944 | 19.4 | 14.5 | ||
| 4.0 | 2222 | 22.2 | 14.0 | ||
| 4.5 | 2500 | 25.0 | 13.5 | ||
| 10 | 20 | 3.0 | 1500 | 15.0 | 17.0 |
| 3.5 | 1750 | 17.5 | 16.5 | ||
| 4.0 | 2000 | 20.0 | 16.0 | ||
| 4.5 | 2250 | 22.5 | 15.5 | ||
| 11 | 22 | 3.0 | 1364 | 13.6 | 19.0 |
| 3.5 | 1591 | 15.9 | 18.5 | ||
| 4.0 | 1818 | 18.2 | 18.0 | ||
| 4.5 | 2045 | 20.5 | 17.5 | ||
© 2018 by the authors. Licensee MDPI, Basel, Switzerland. This article is an open access article distributed under the terms and conditions of the Creative Commons Attribution (CC BY) license (http://creativecommons.org/licenses/by/4.0/).
Share and Cite
MDPI and ACS Style
Labelle, E.R.; Jaeger, D. Management Implications of Using Brush Mats for Soil Protection on Machine Operating Trails during Mechanized Cut-to-Length Forest Operations. Forests 2019, 10, 19. https://doi.org/10.3390/f10010019
AMA Style
Labelle ER, Jaeger D. Management Implications of Using Brush Mats for Soil Protection on Machine Operating Trails during Mechanized Cut-to-Length Forest Operations. Forests. 2019; 10(1):19. https://doi.org/10.3390/f10010019
Chicago/Turabian StyleLabelle, Eric R., and Dirk Jaeger. 2019. "Management Implications of Using Brush Mats for Soil Protection on Machine Operating Trails during Mechanized Cut-to-Length Forest Operations" Forests 10, no. 1: 19. https://doi.org/10.3390/f10010019
Note that from the first issue of 2016, this journal uses article numbers instead of page numbers. See further details here.