
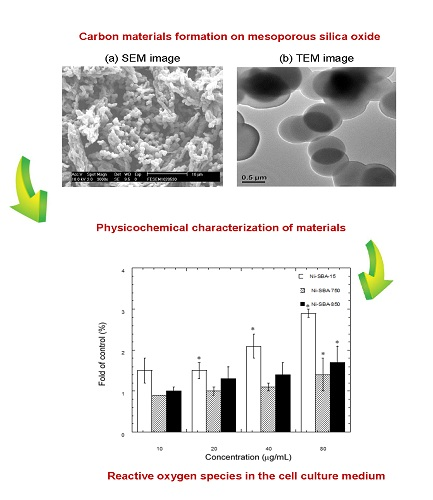
Characteristics of Carbon Material Formation on SBA-15 and Ni-SBA-15 Templates by Acetylene Decomposition and Their Bioactivity Effects


Abstract
:
1. Introduction
2. Experimental
2.1. Material Preparation
2.1.1. Santa Barbara Amorphous (SBA-15) Preparation
2.1.2. Nickel (Ni)-SBA-15
2.1.3. Carbon Material Preparation
2.2. Characterization of Materials
2.2.1. Scanning Electron Microscopy (SEM)
2.2.2. Transmission Electron Microscope (TEM)
2.2.3. Pore Size Distribution
2.2.4. Dynamic Light Scattering (DLS) and Zeta Potential
2.3. Chemical Compositions
2.3.1. Energy Dispersive Spectroscopy (EDS)
2.3.2. Elemental Constituent
2.3.3. Raman Scattering Spectrometer
2.3.4. Polycyclic Aromatic Hydrocarbon (PAH) Analysis
2.4. Bioactivity
2.4.1. Cell Viability Assay
2.4.2. Fluorescence Assay of Intracellular Reactive Oxidative Species (ROS)
2.5. Statistical Analysis
3. Results and Discussion
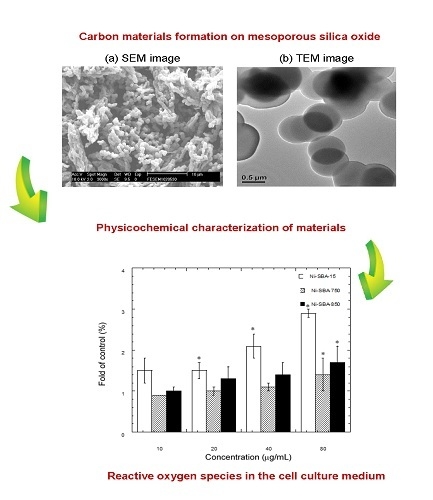
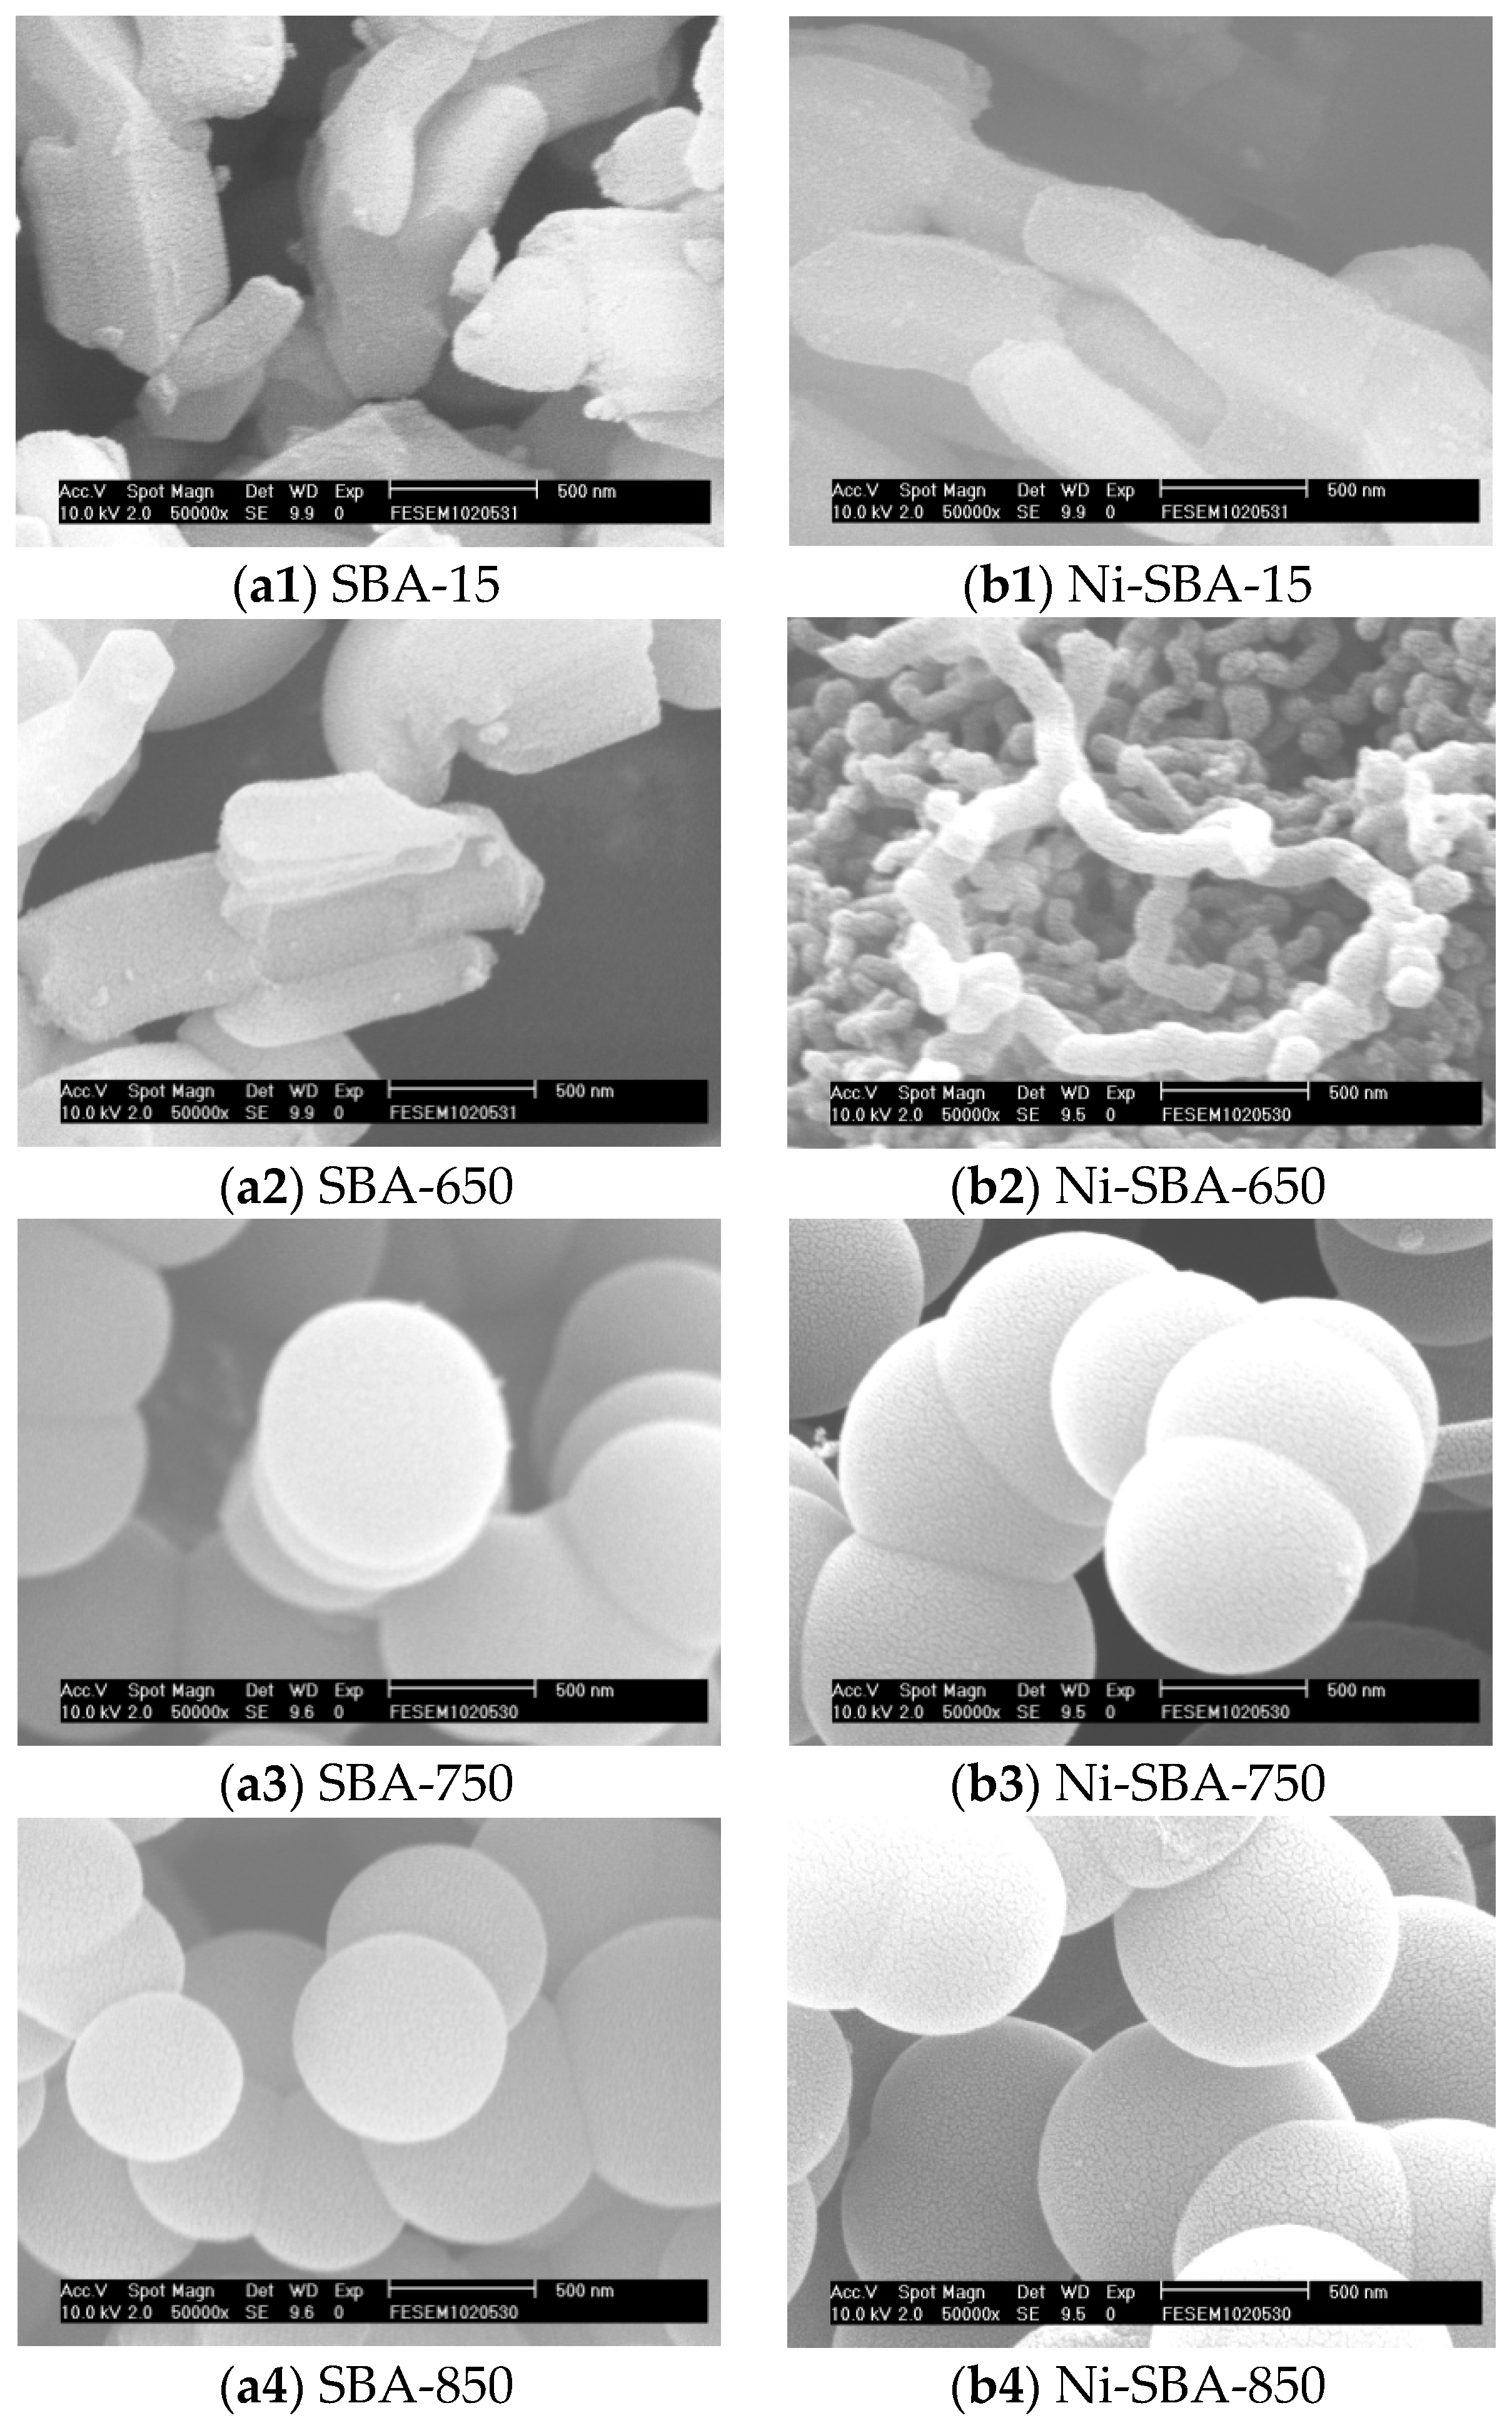
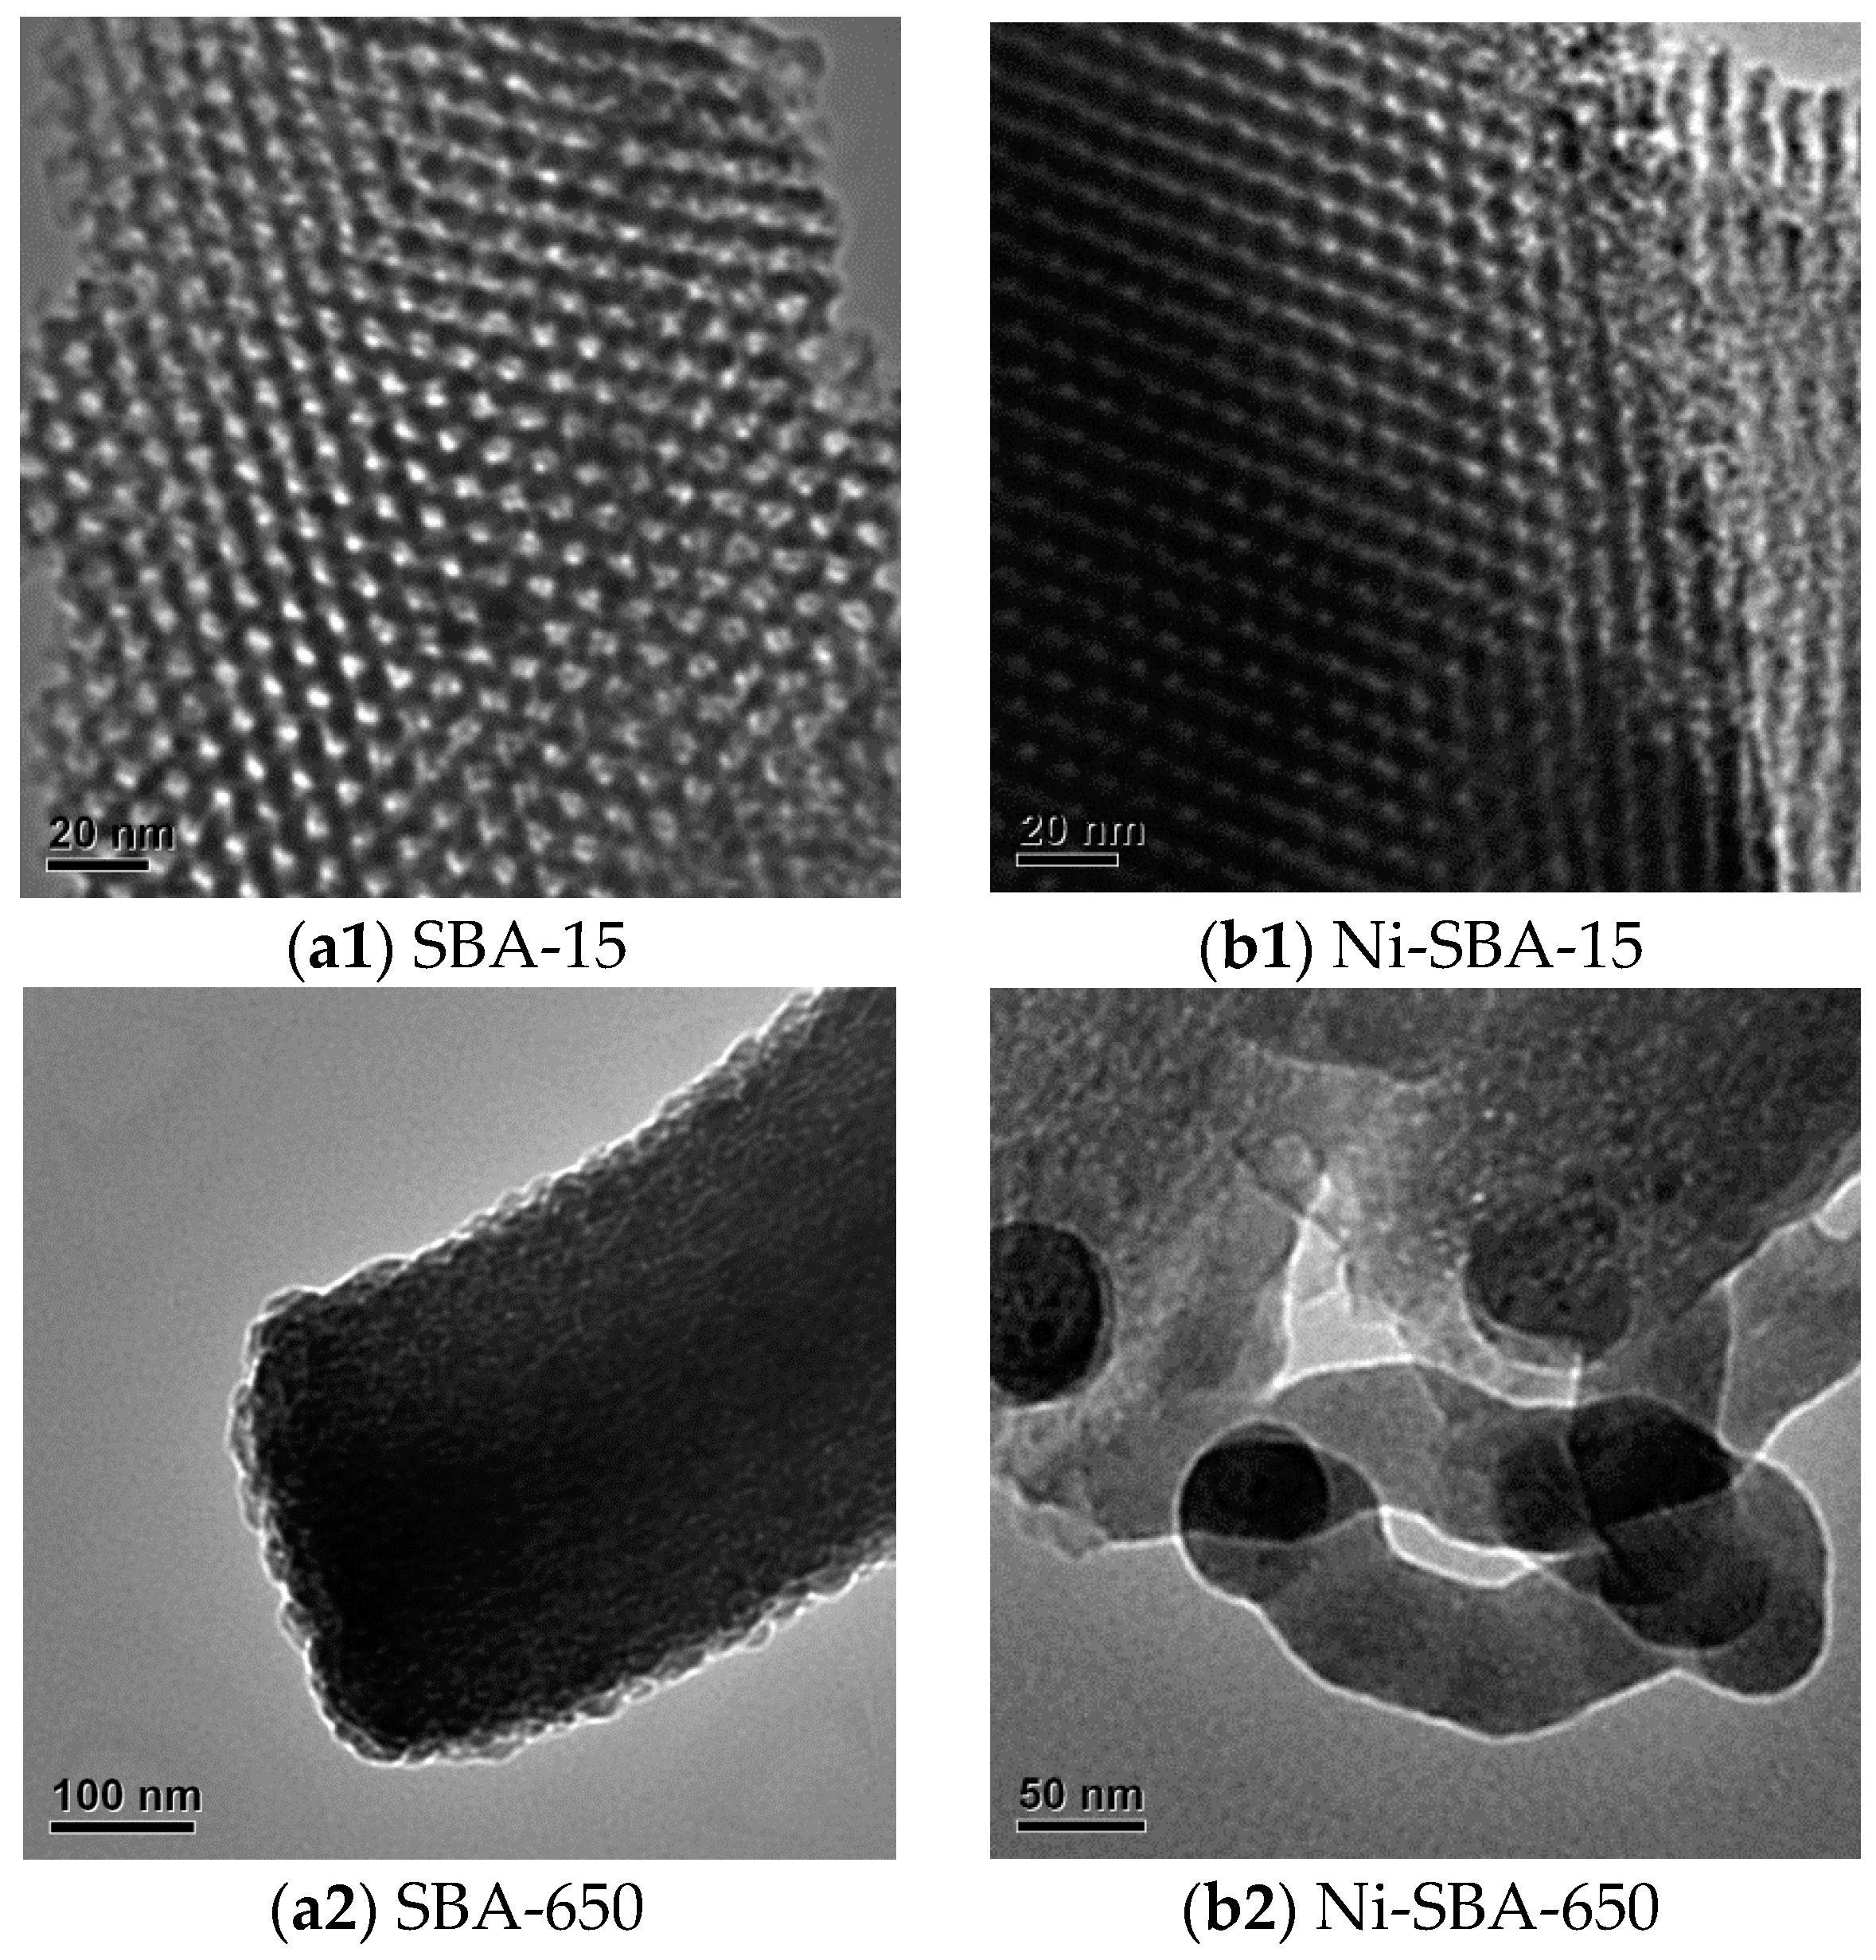
3.1. Microscopic Photograph
3.1.1. SEM Analysis
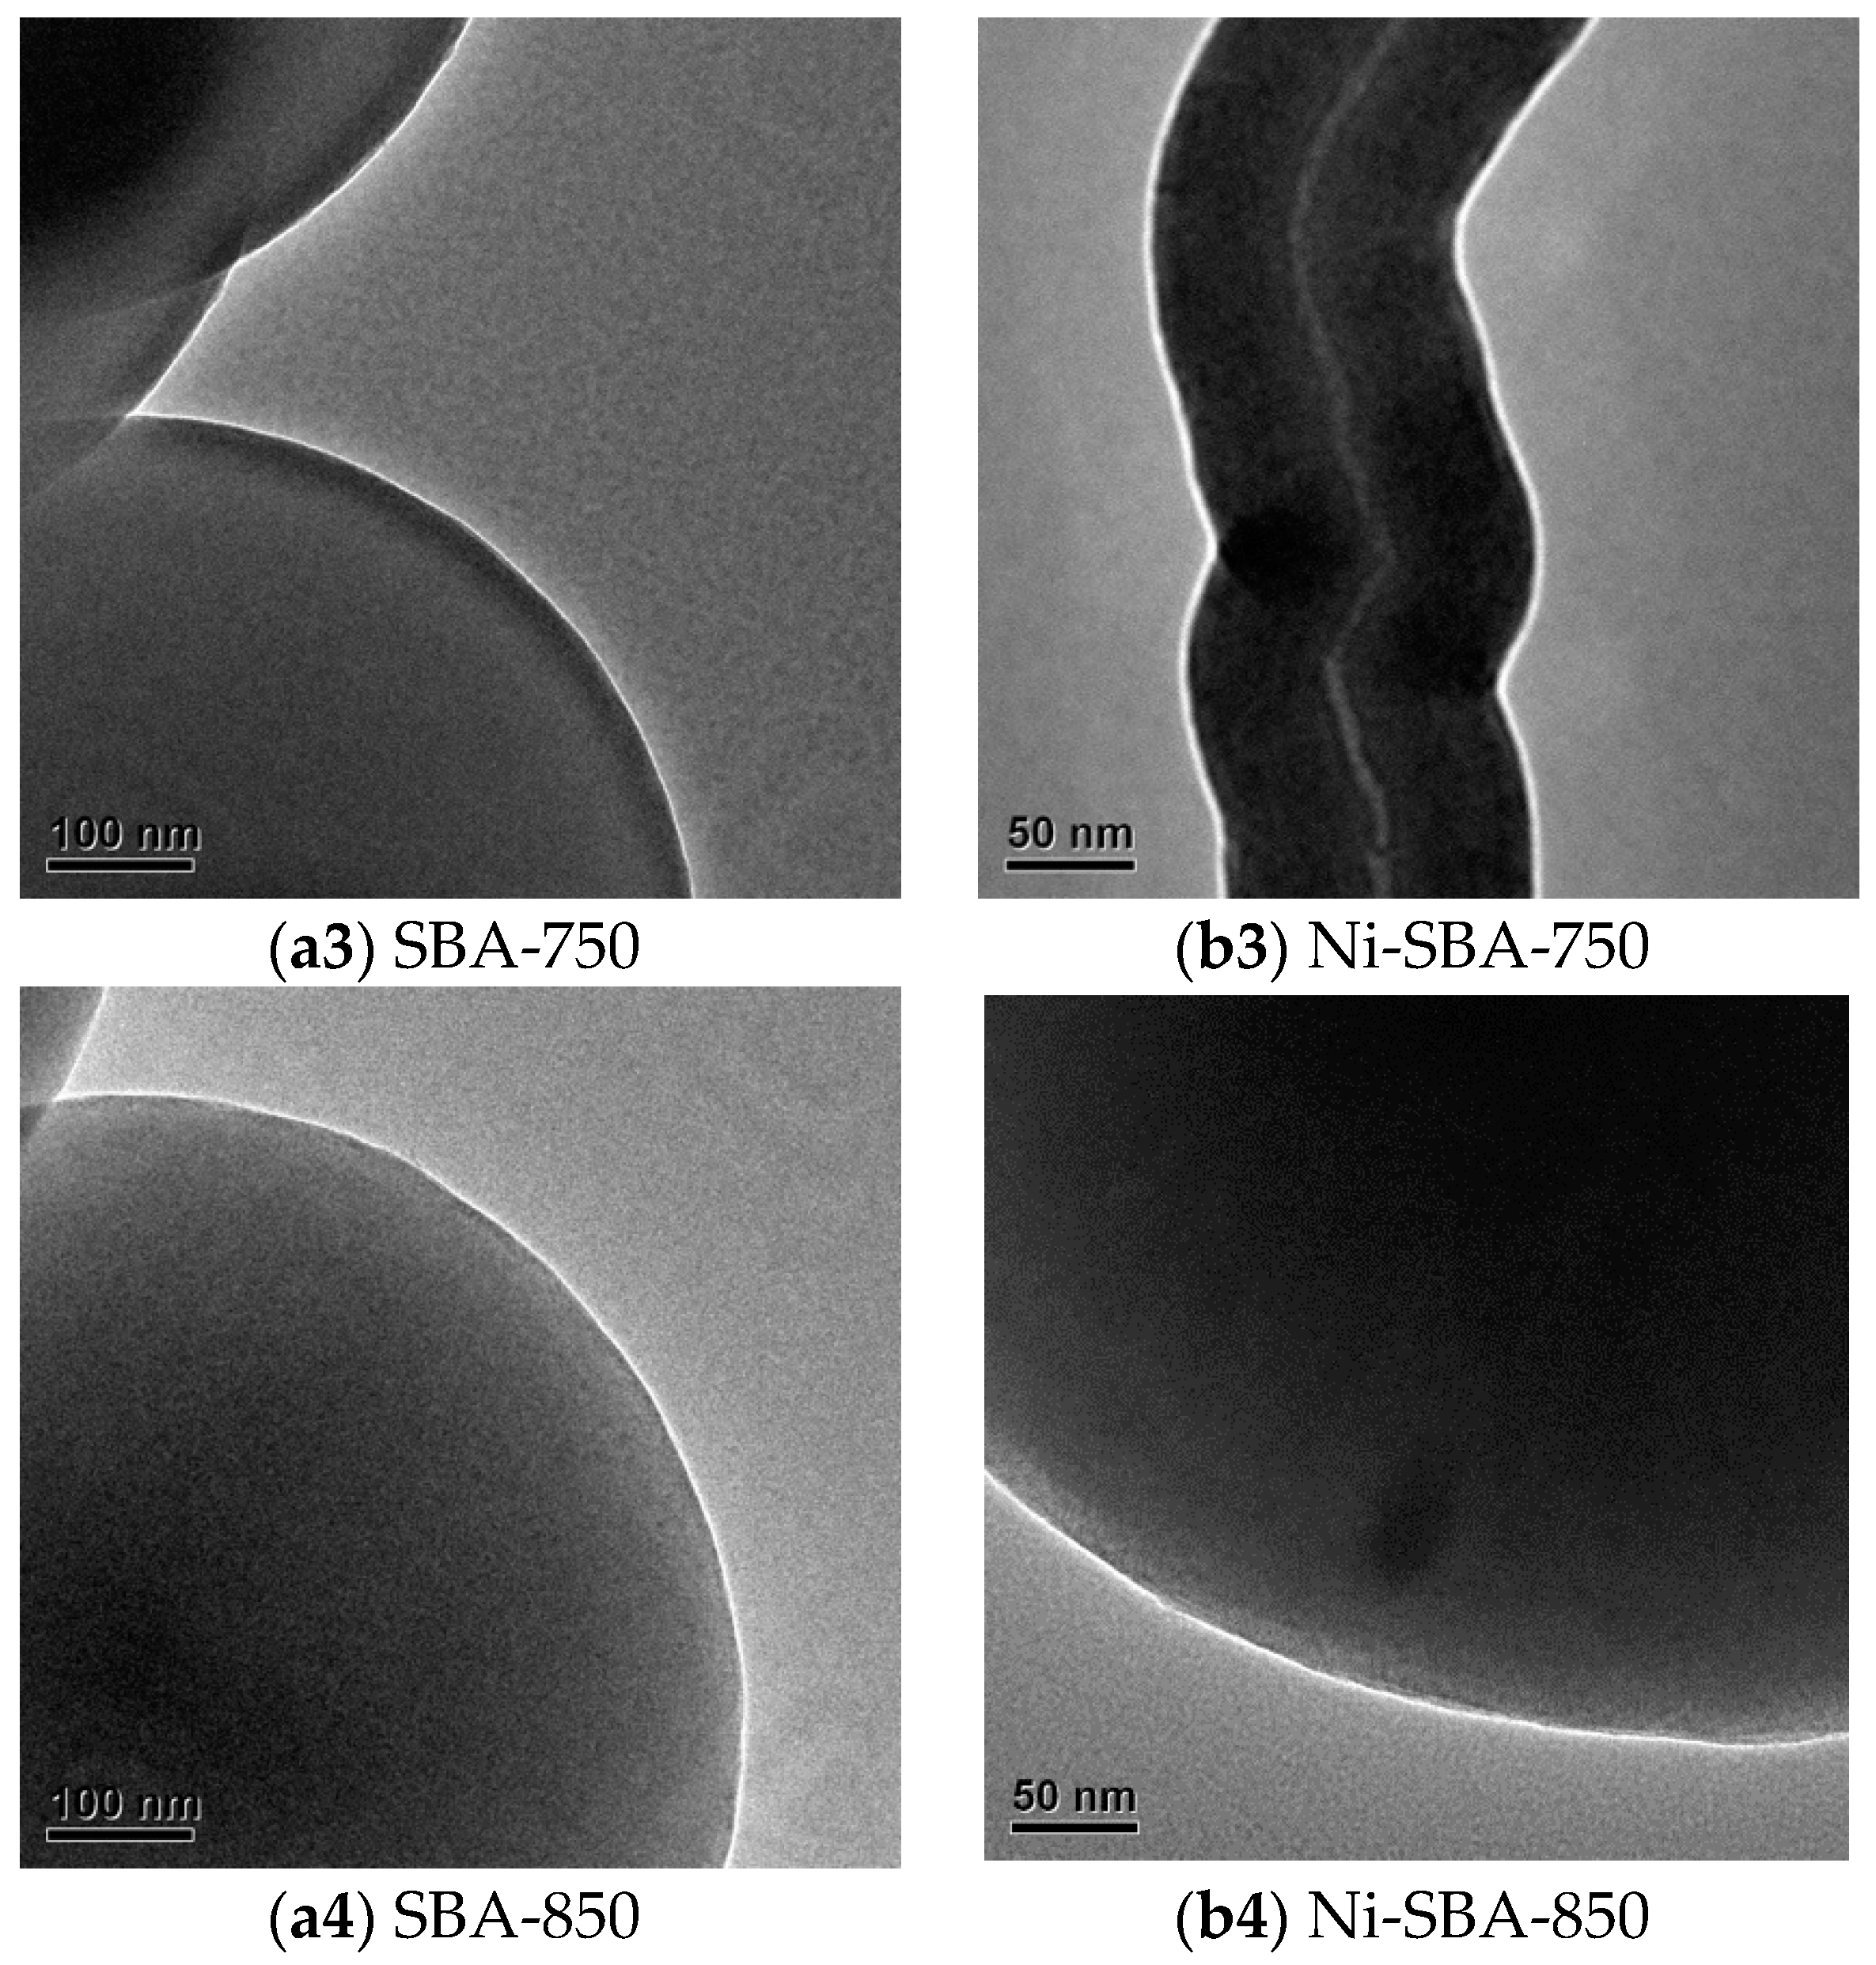
3.1.2. TEM Analysis
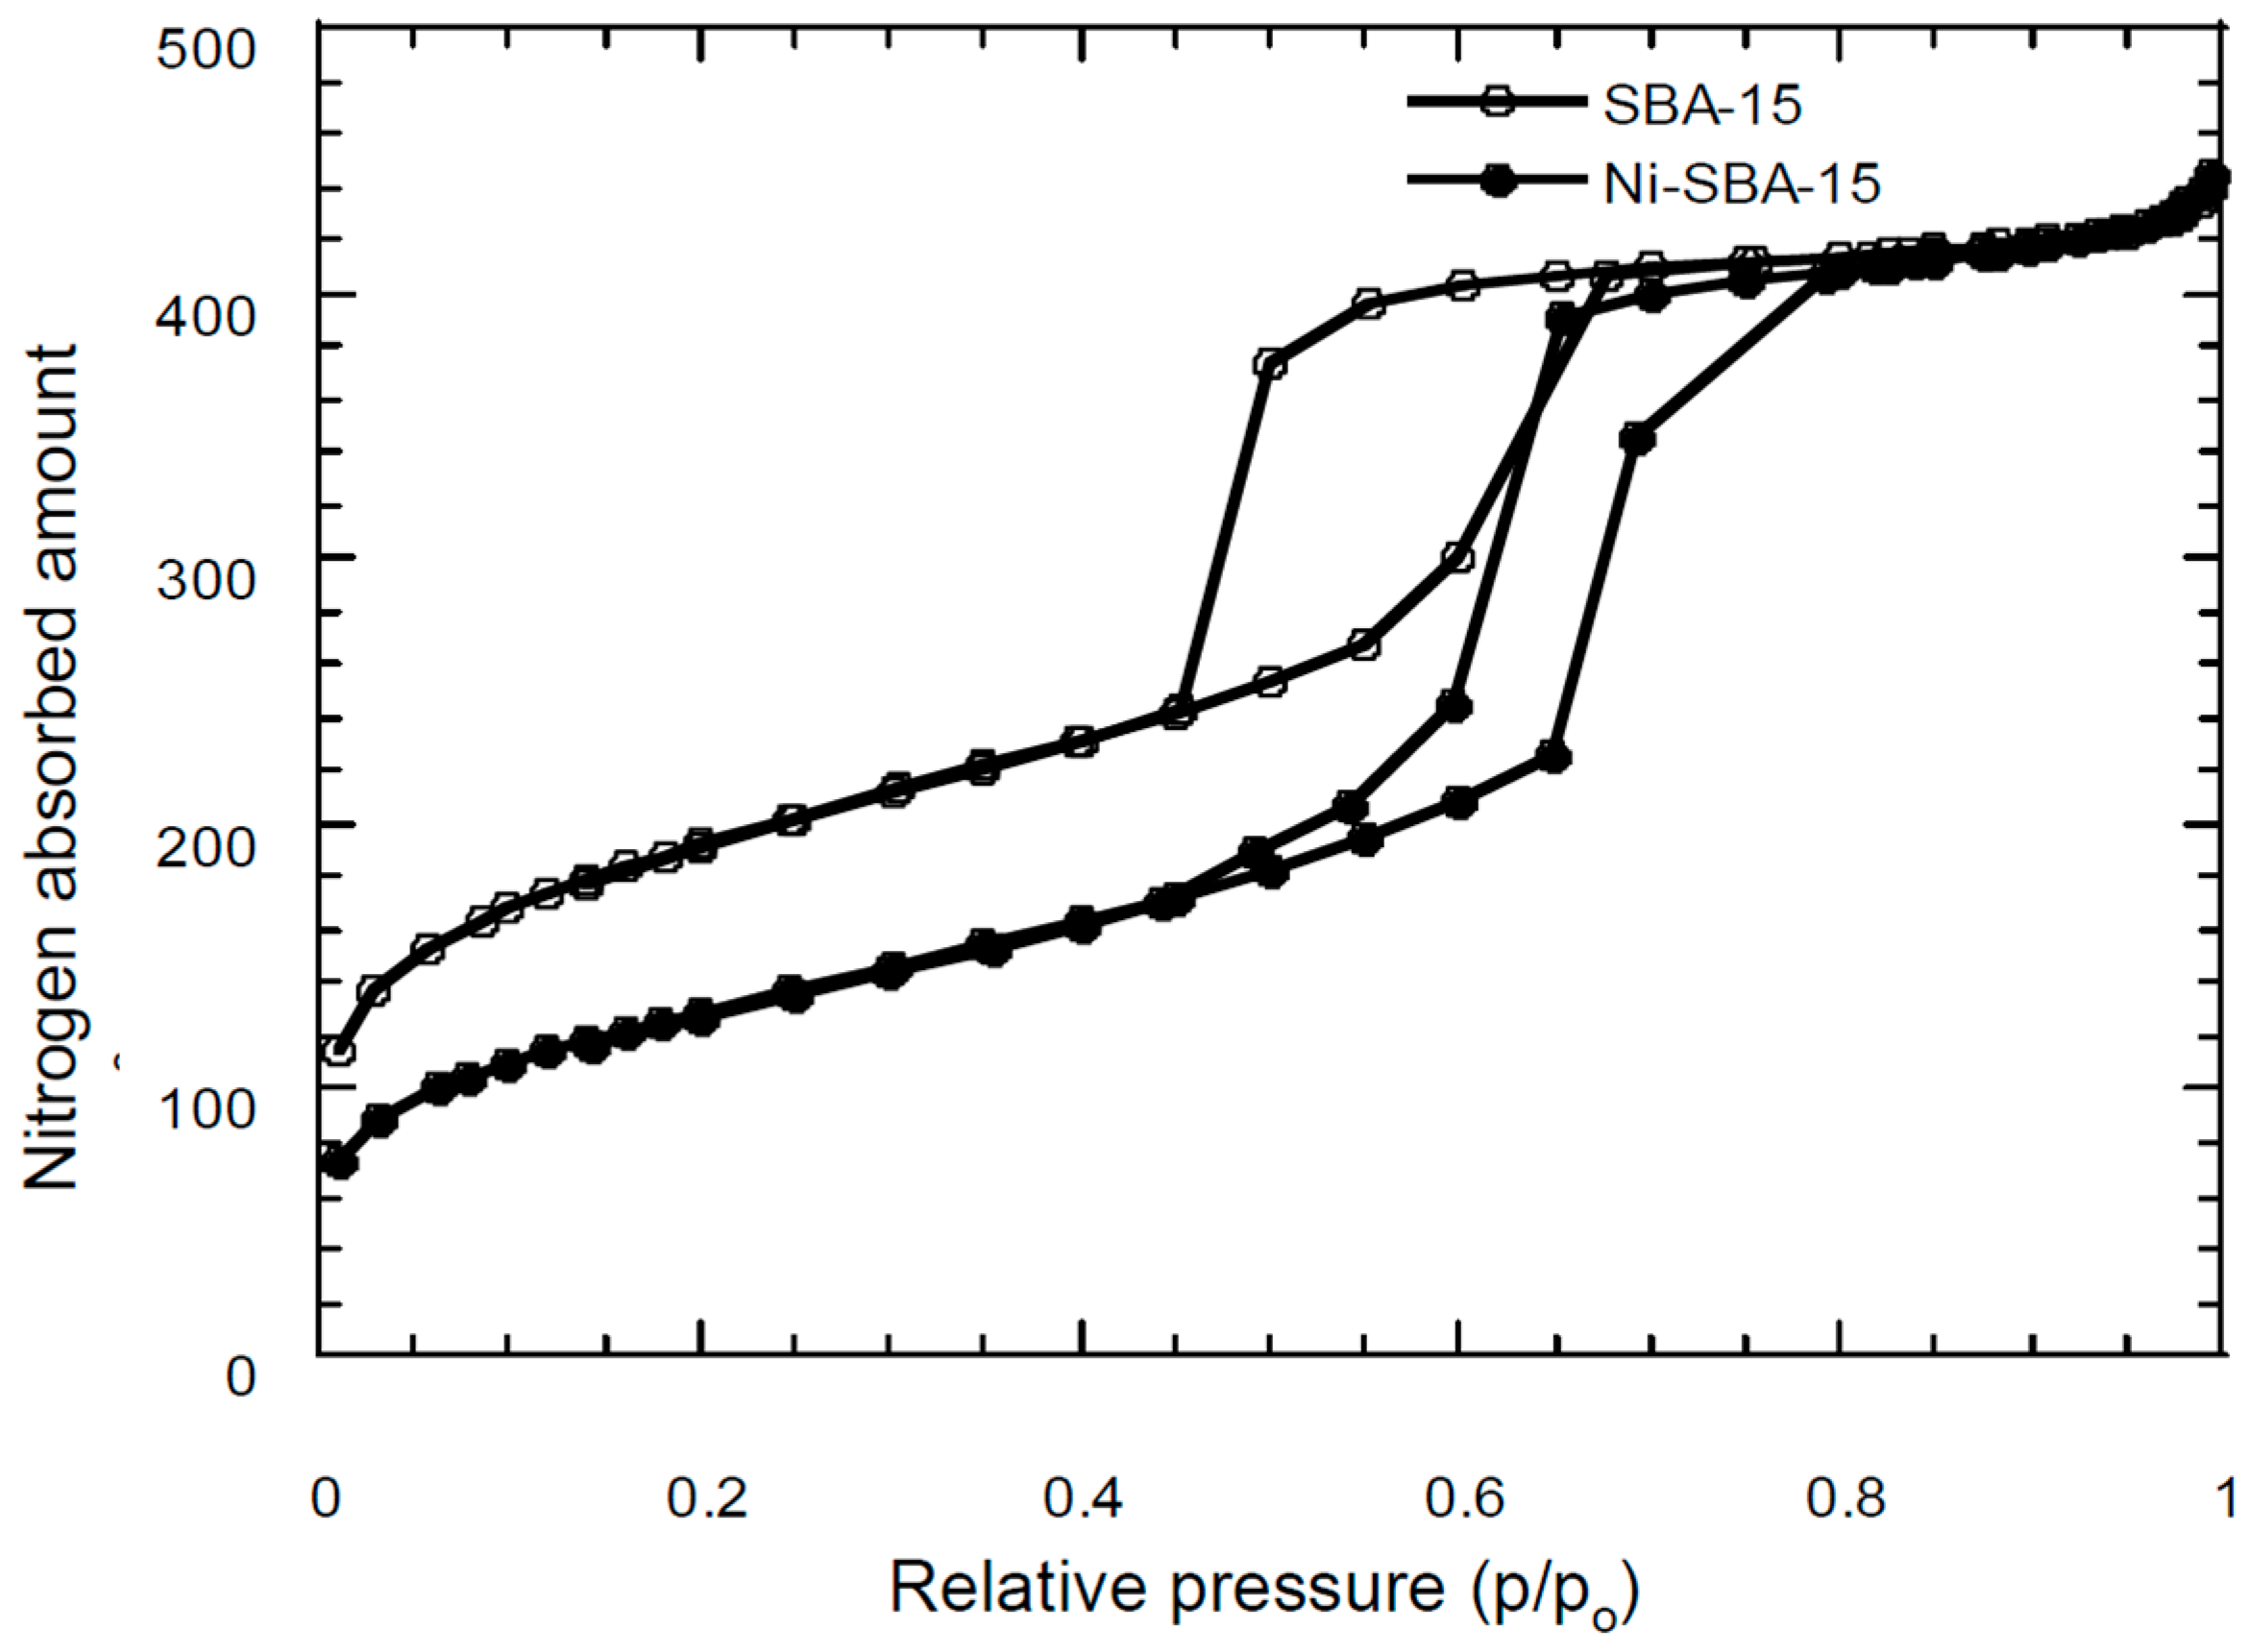
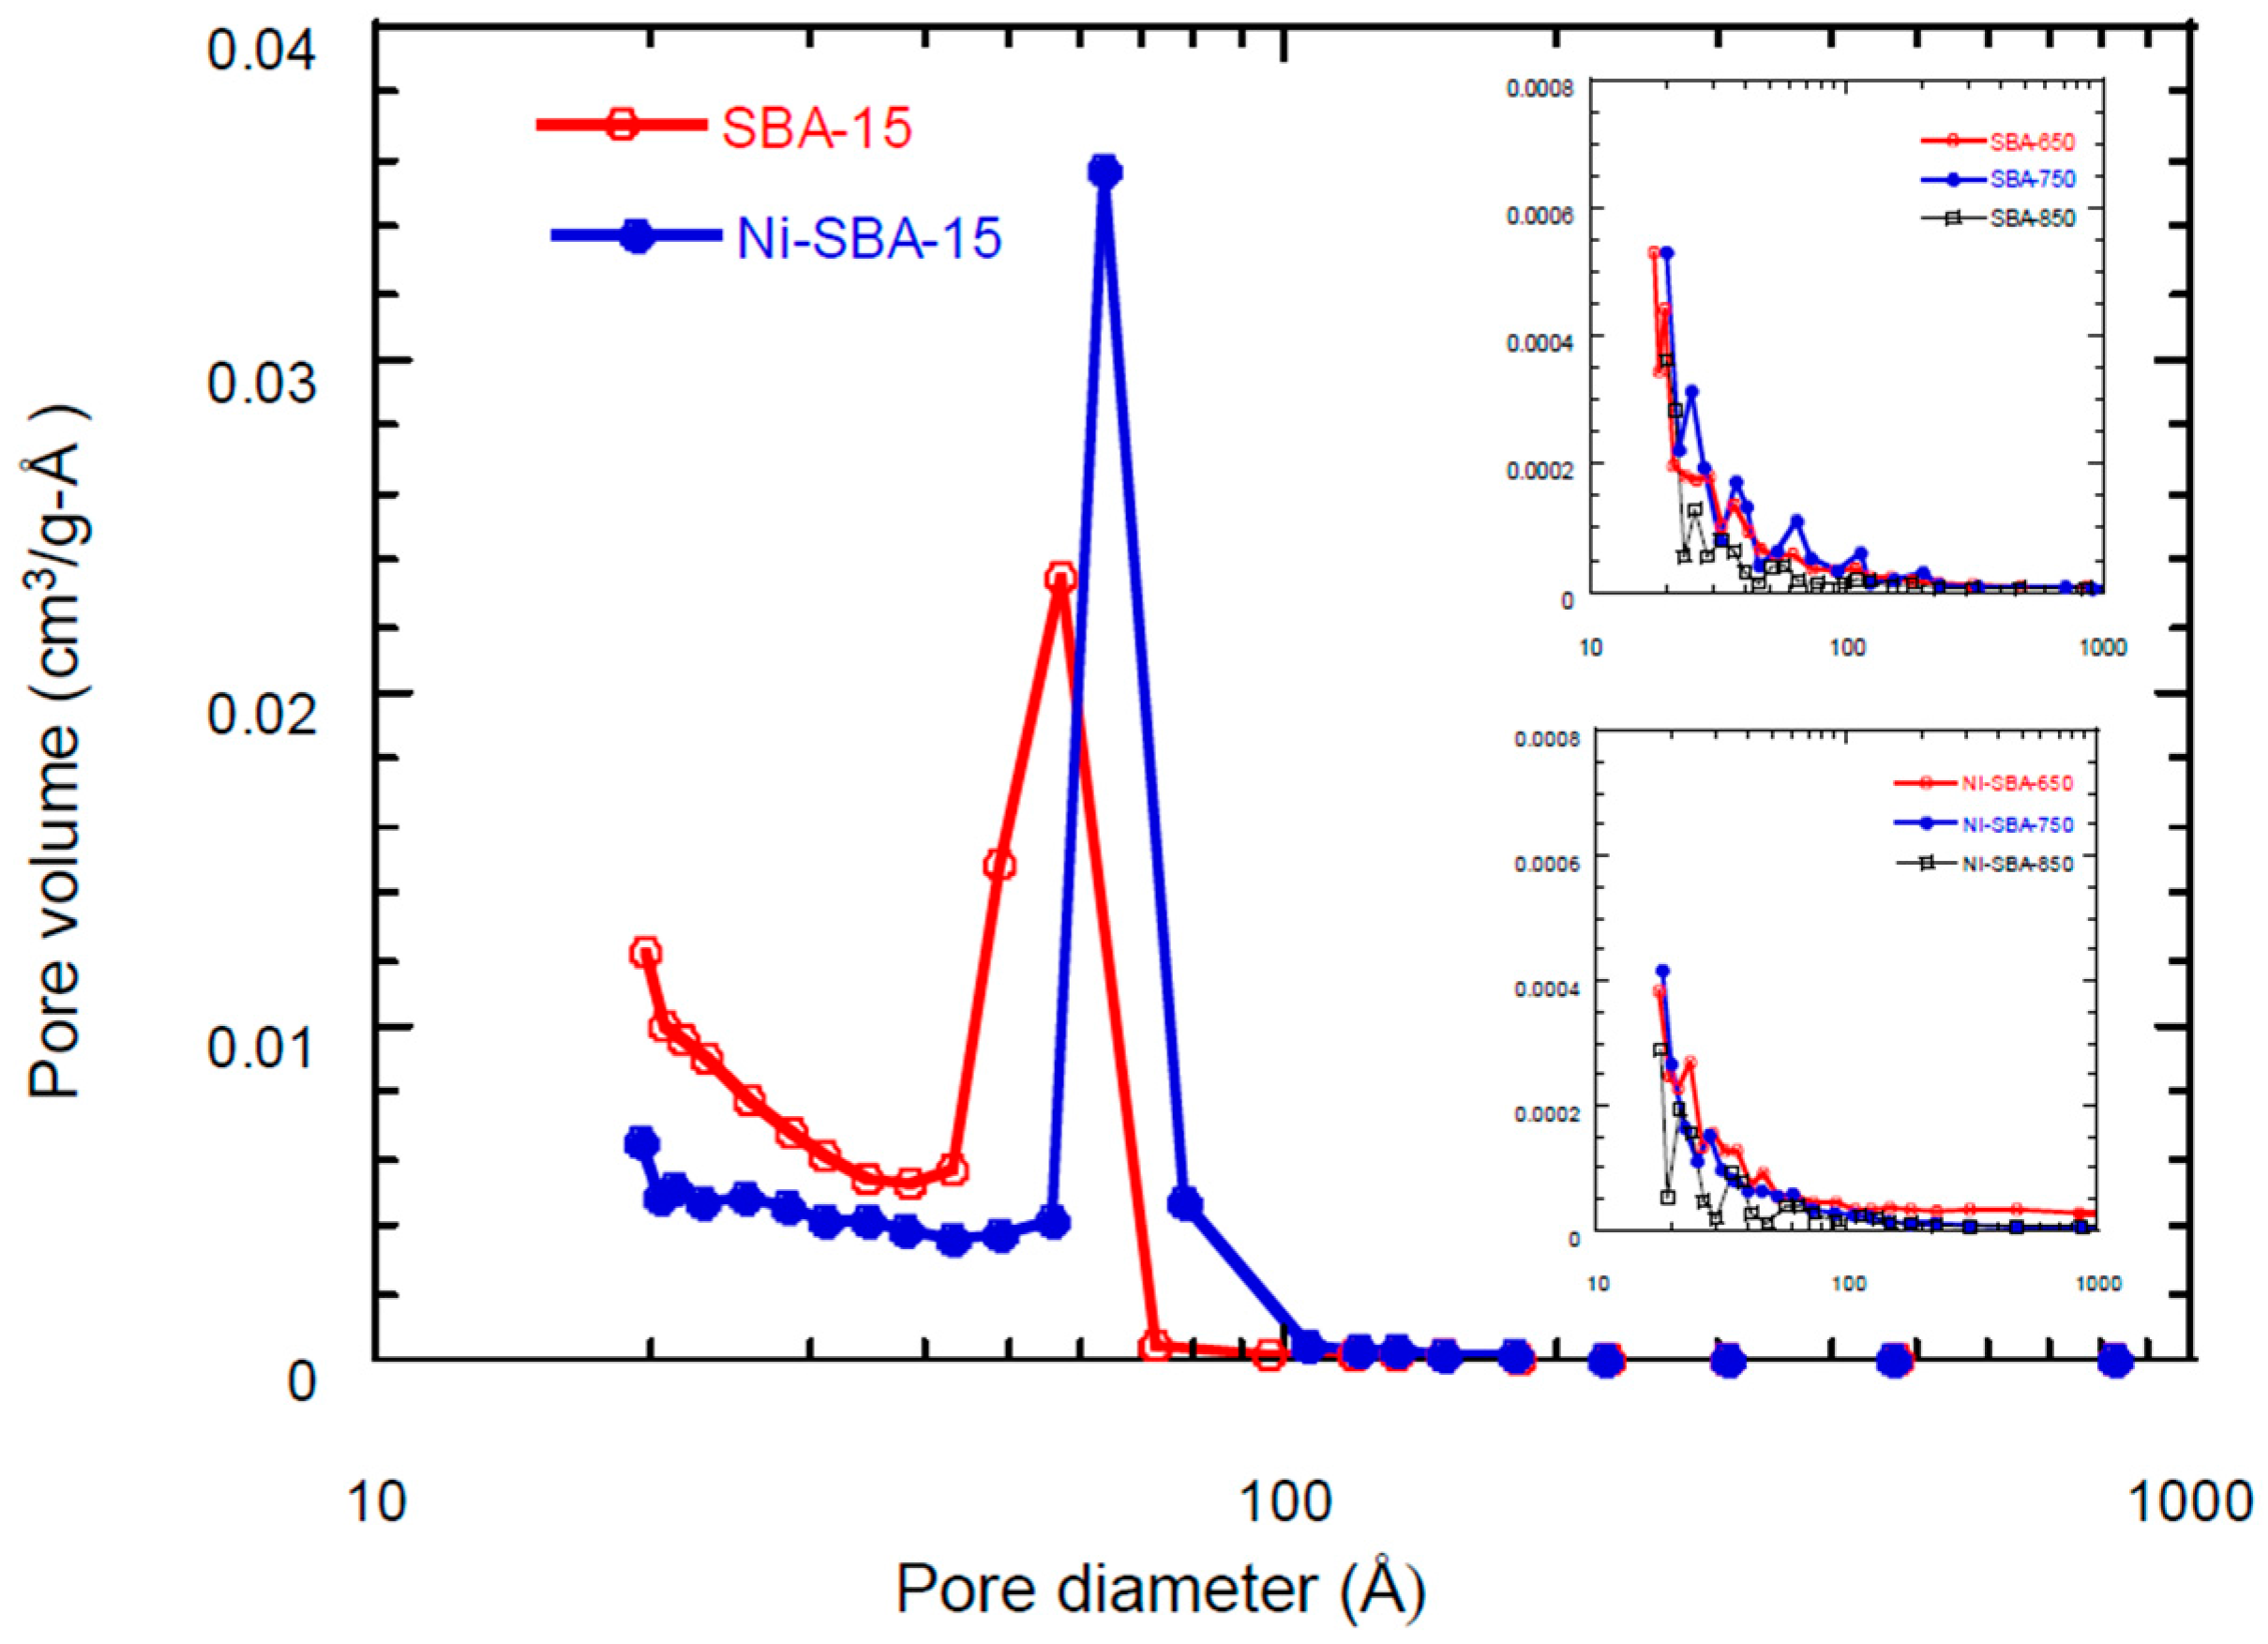
3.2. Surface Area/Pore Size Distribution
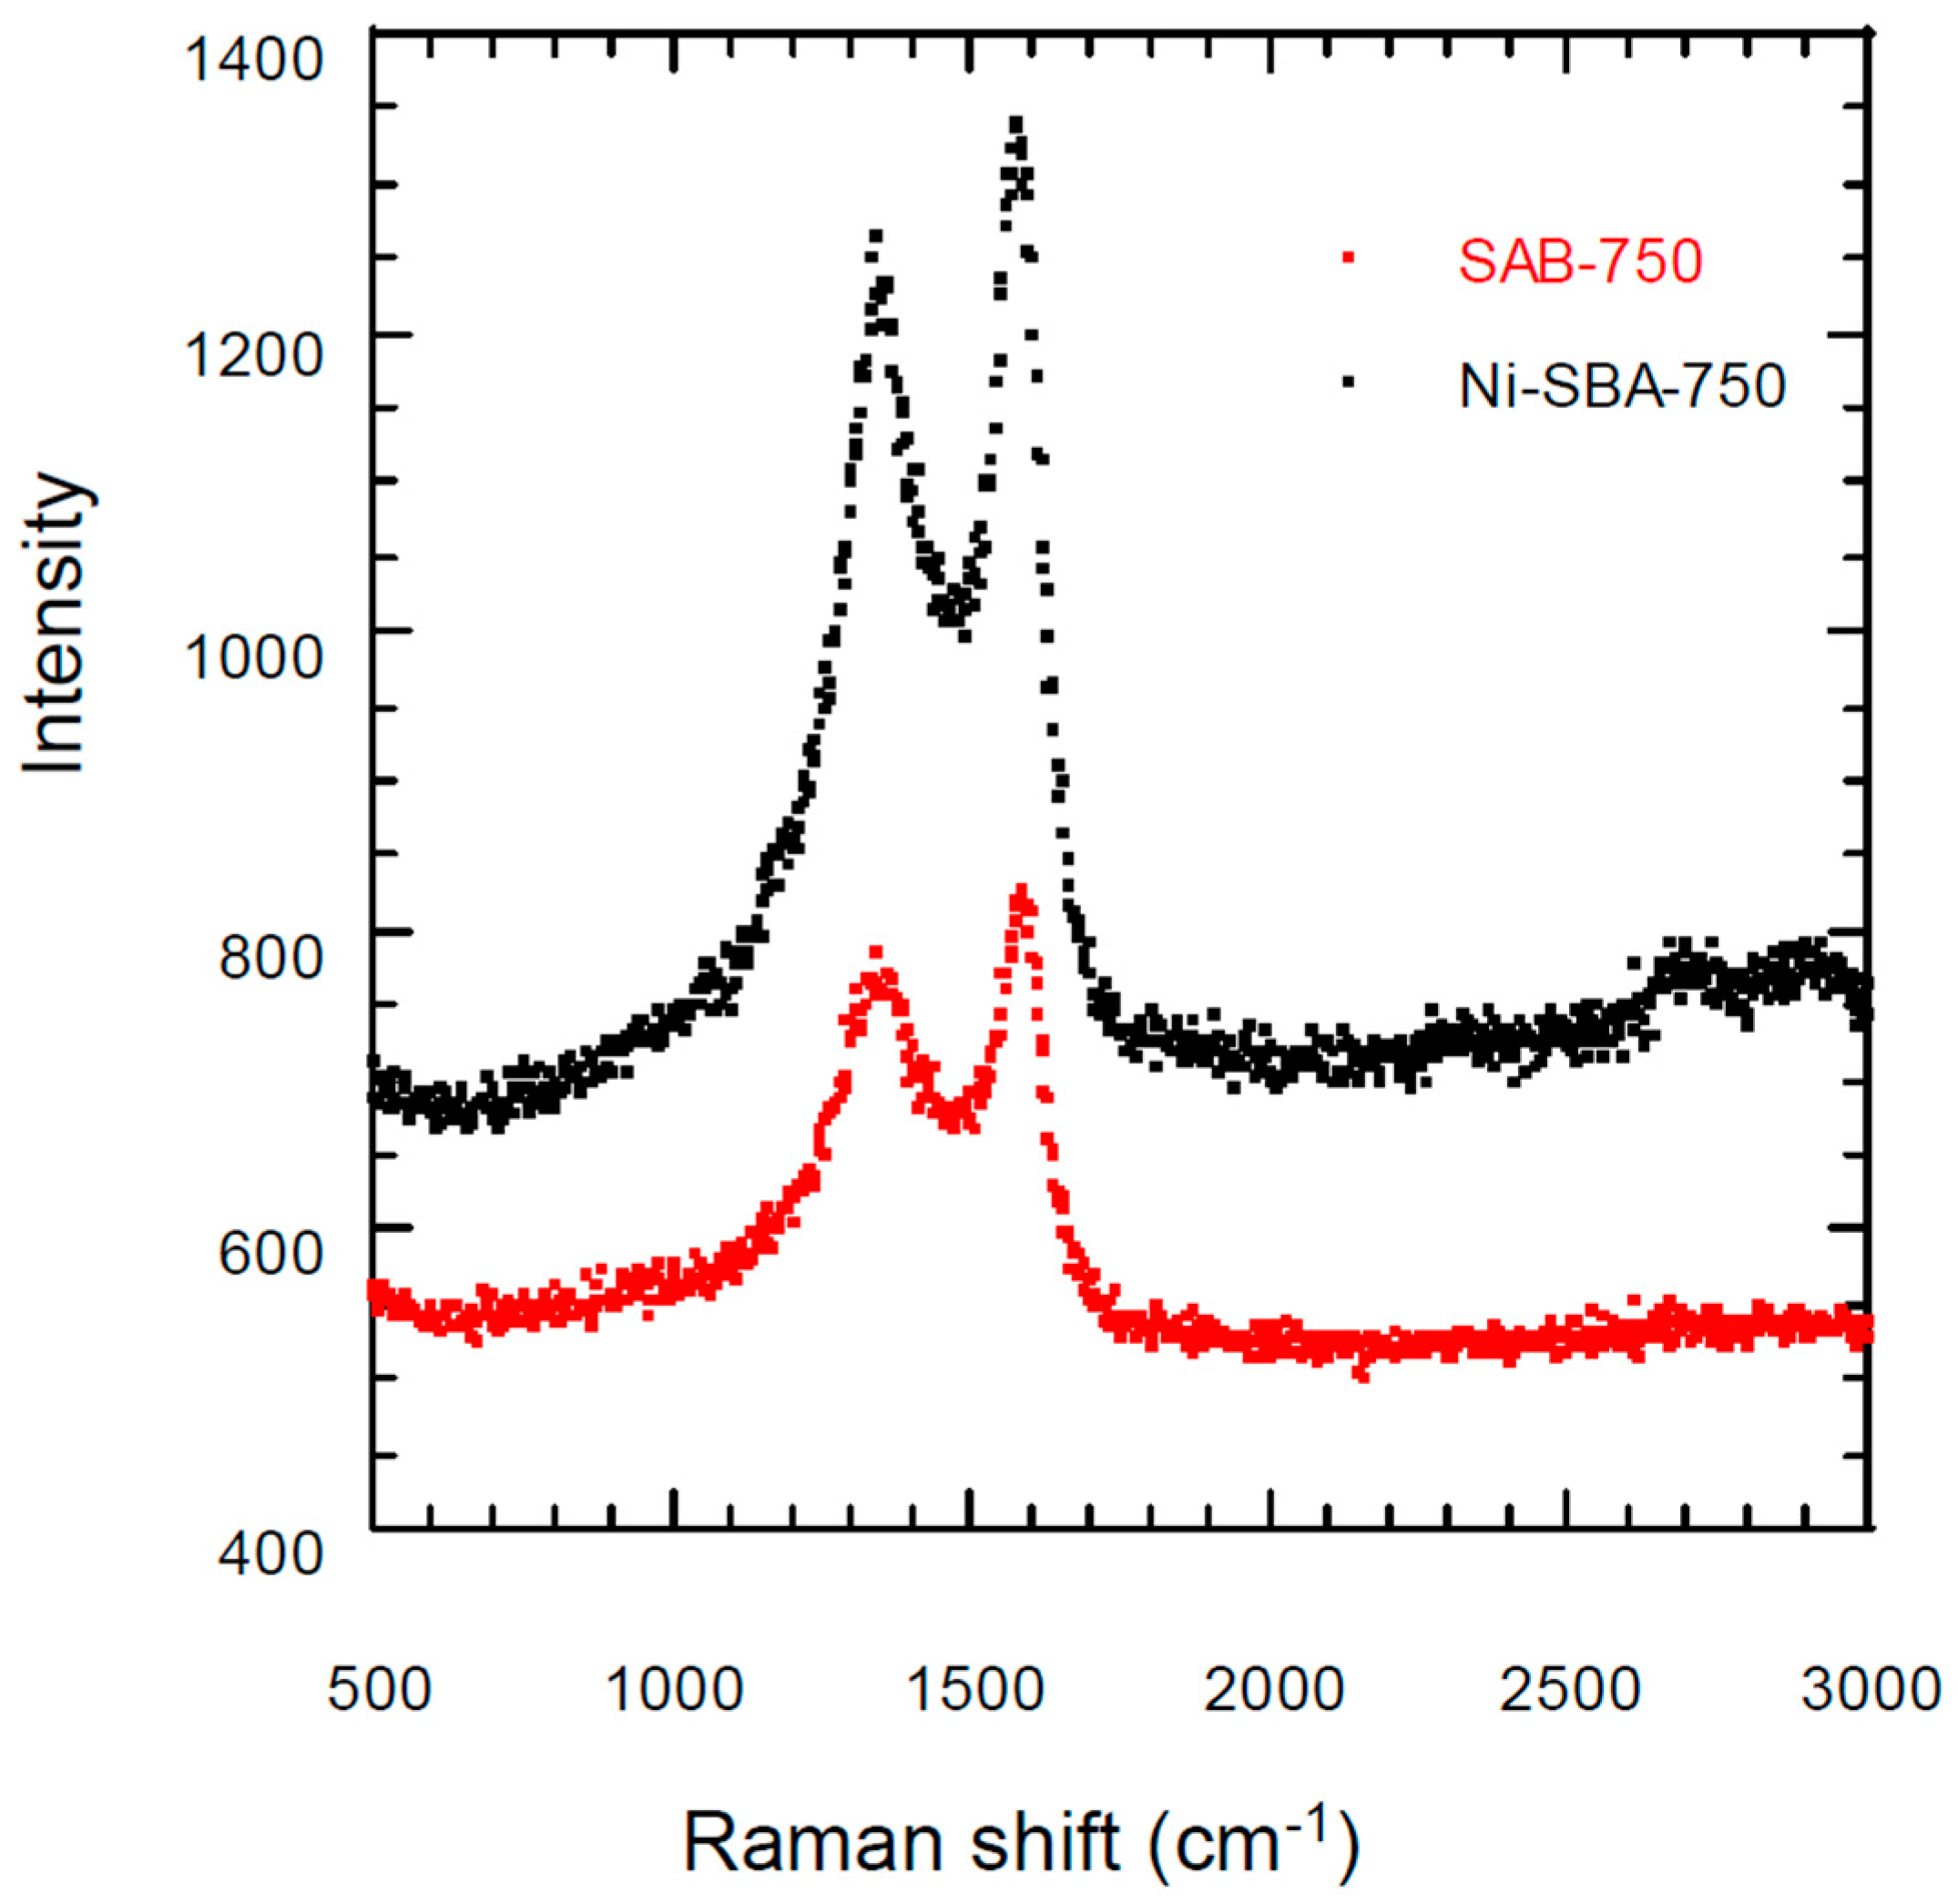
3.3. Raman Scattering Analysis
3.4. Element Constituents
3.4.1. Main Elements
3.4.2. Trace Elements
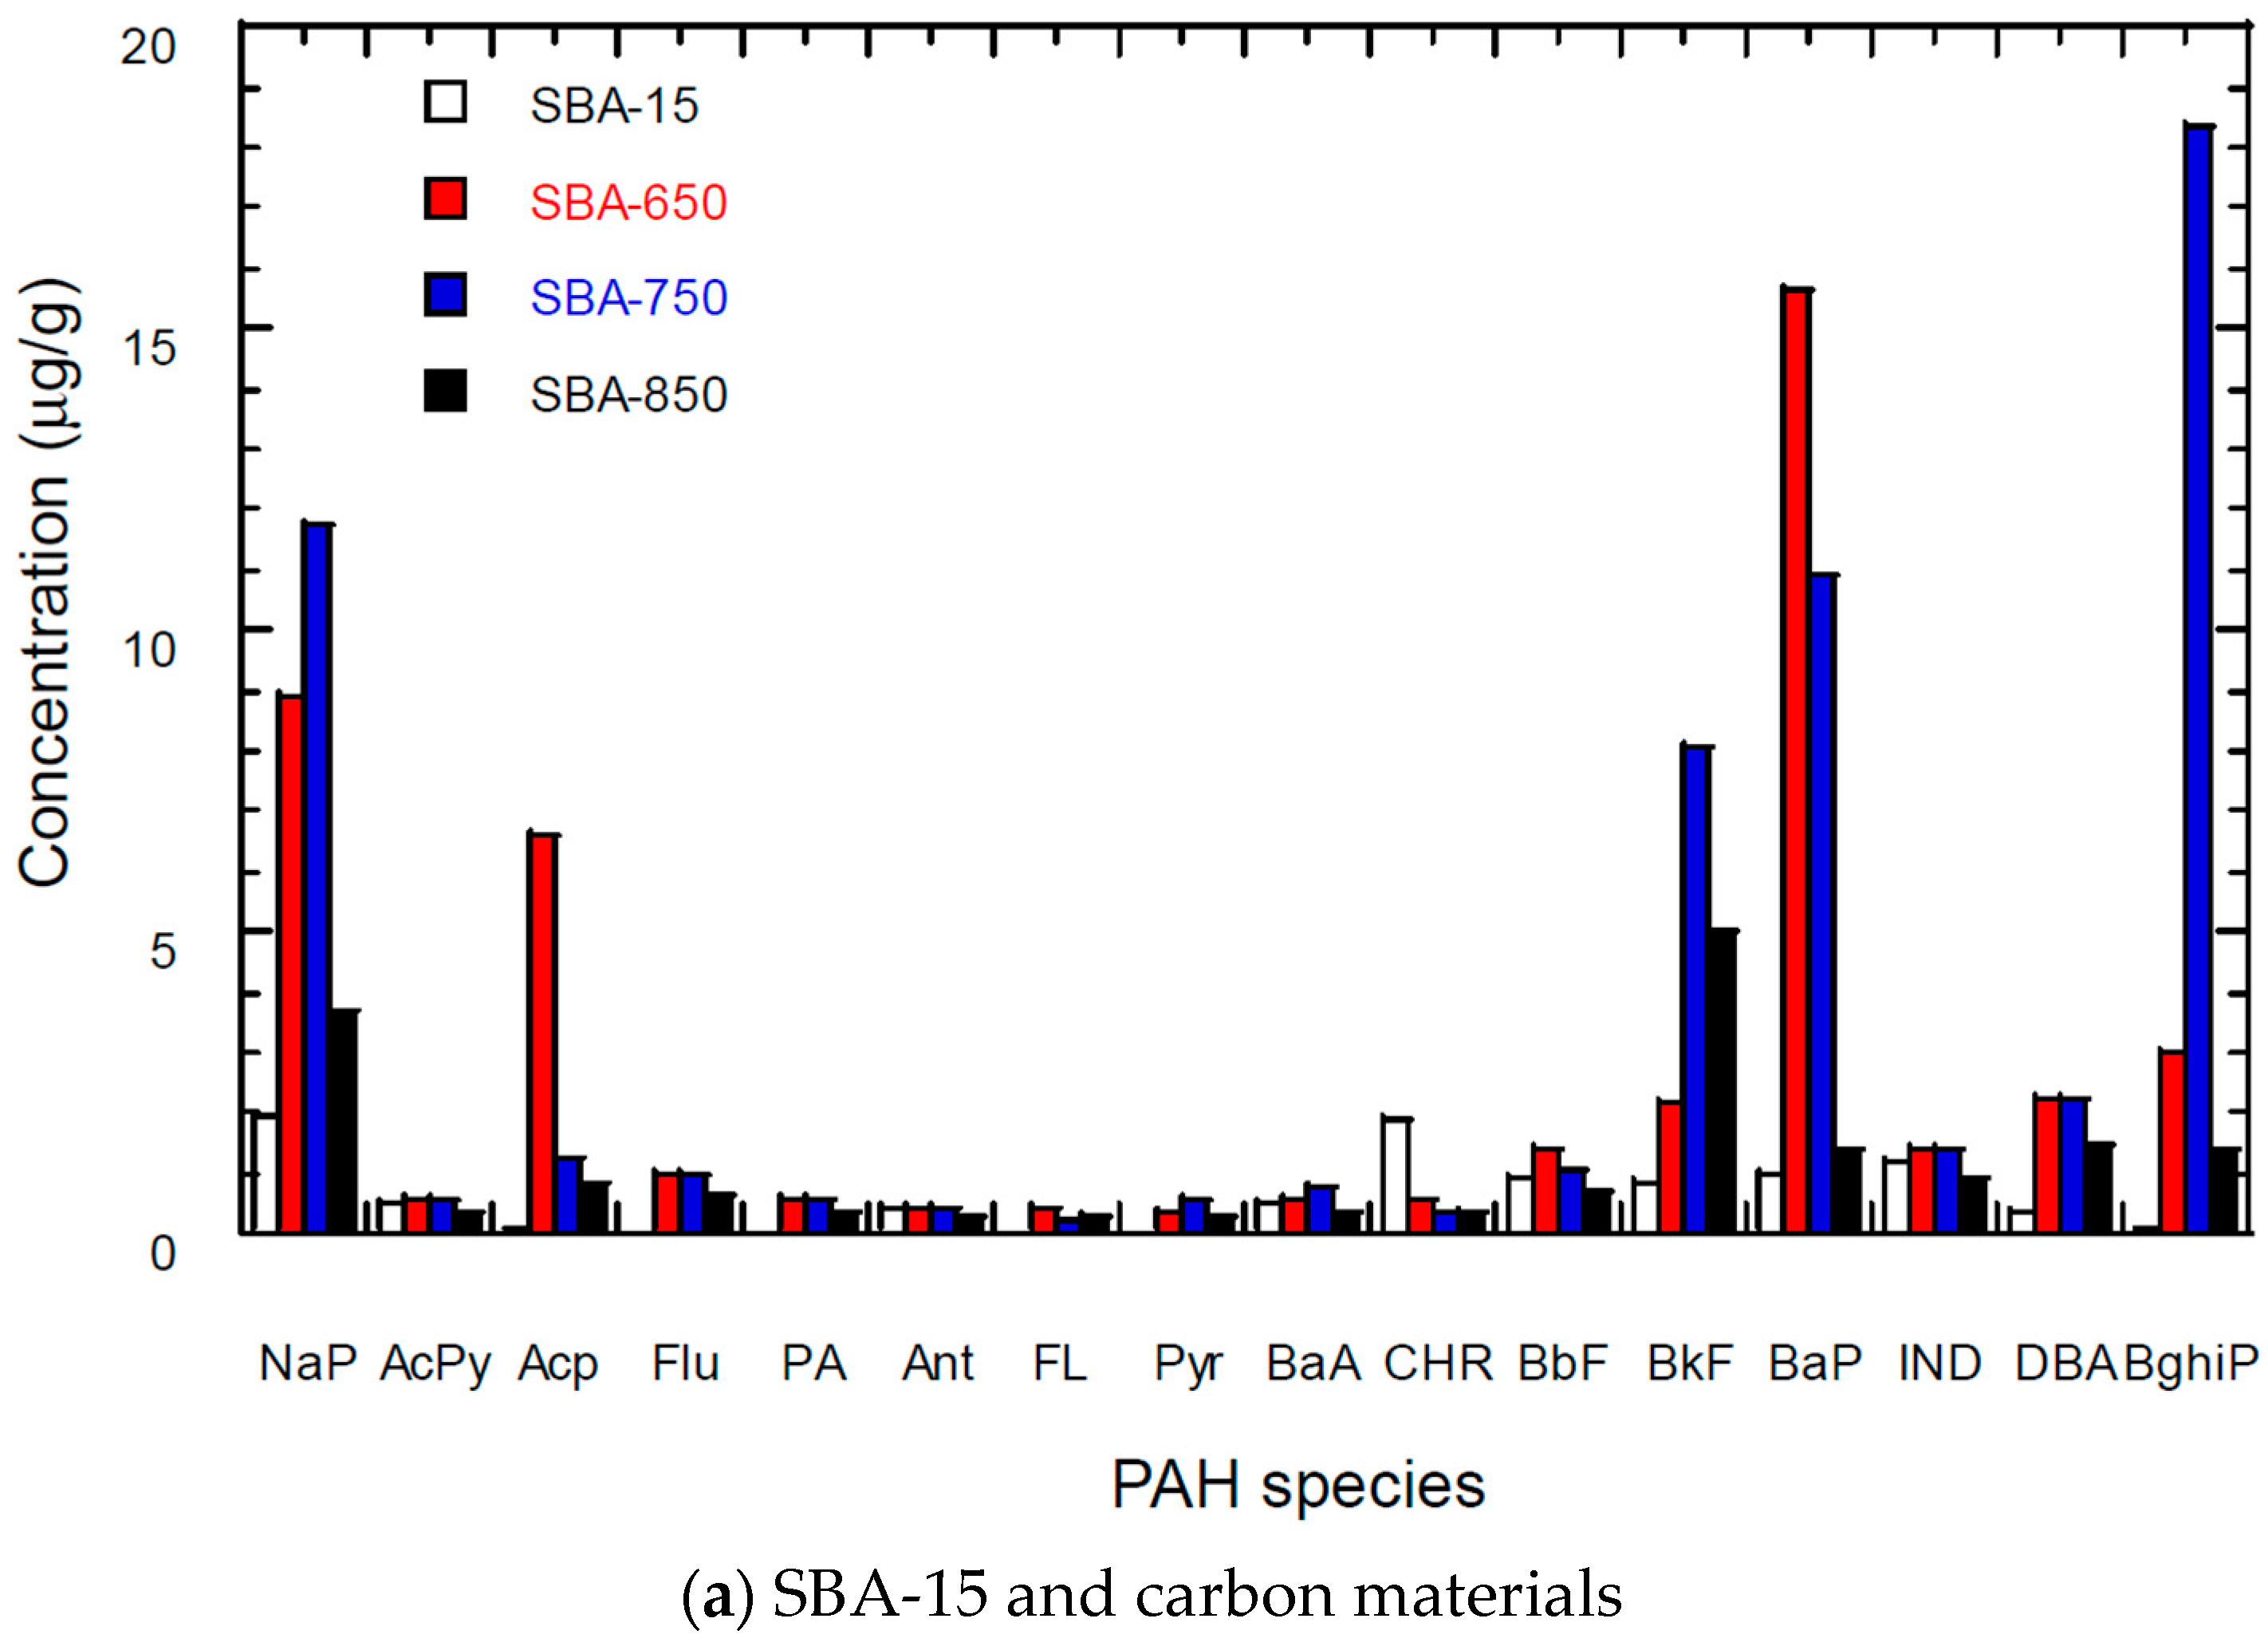
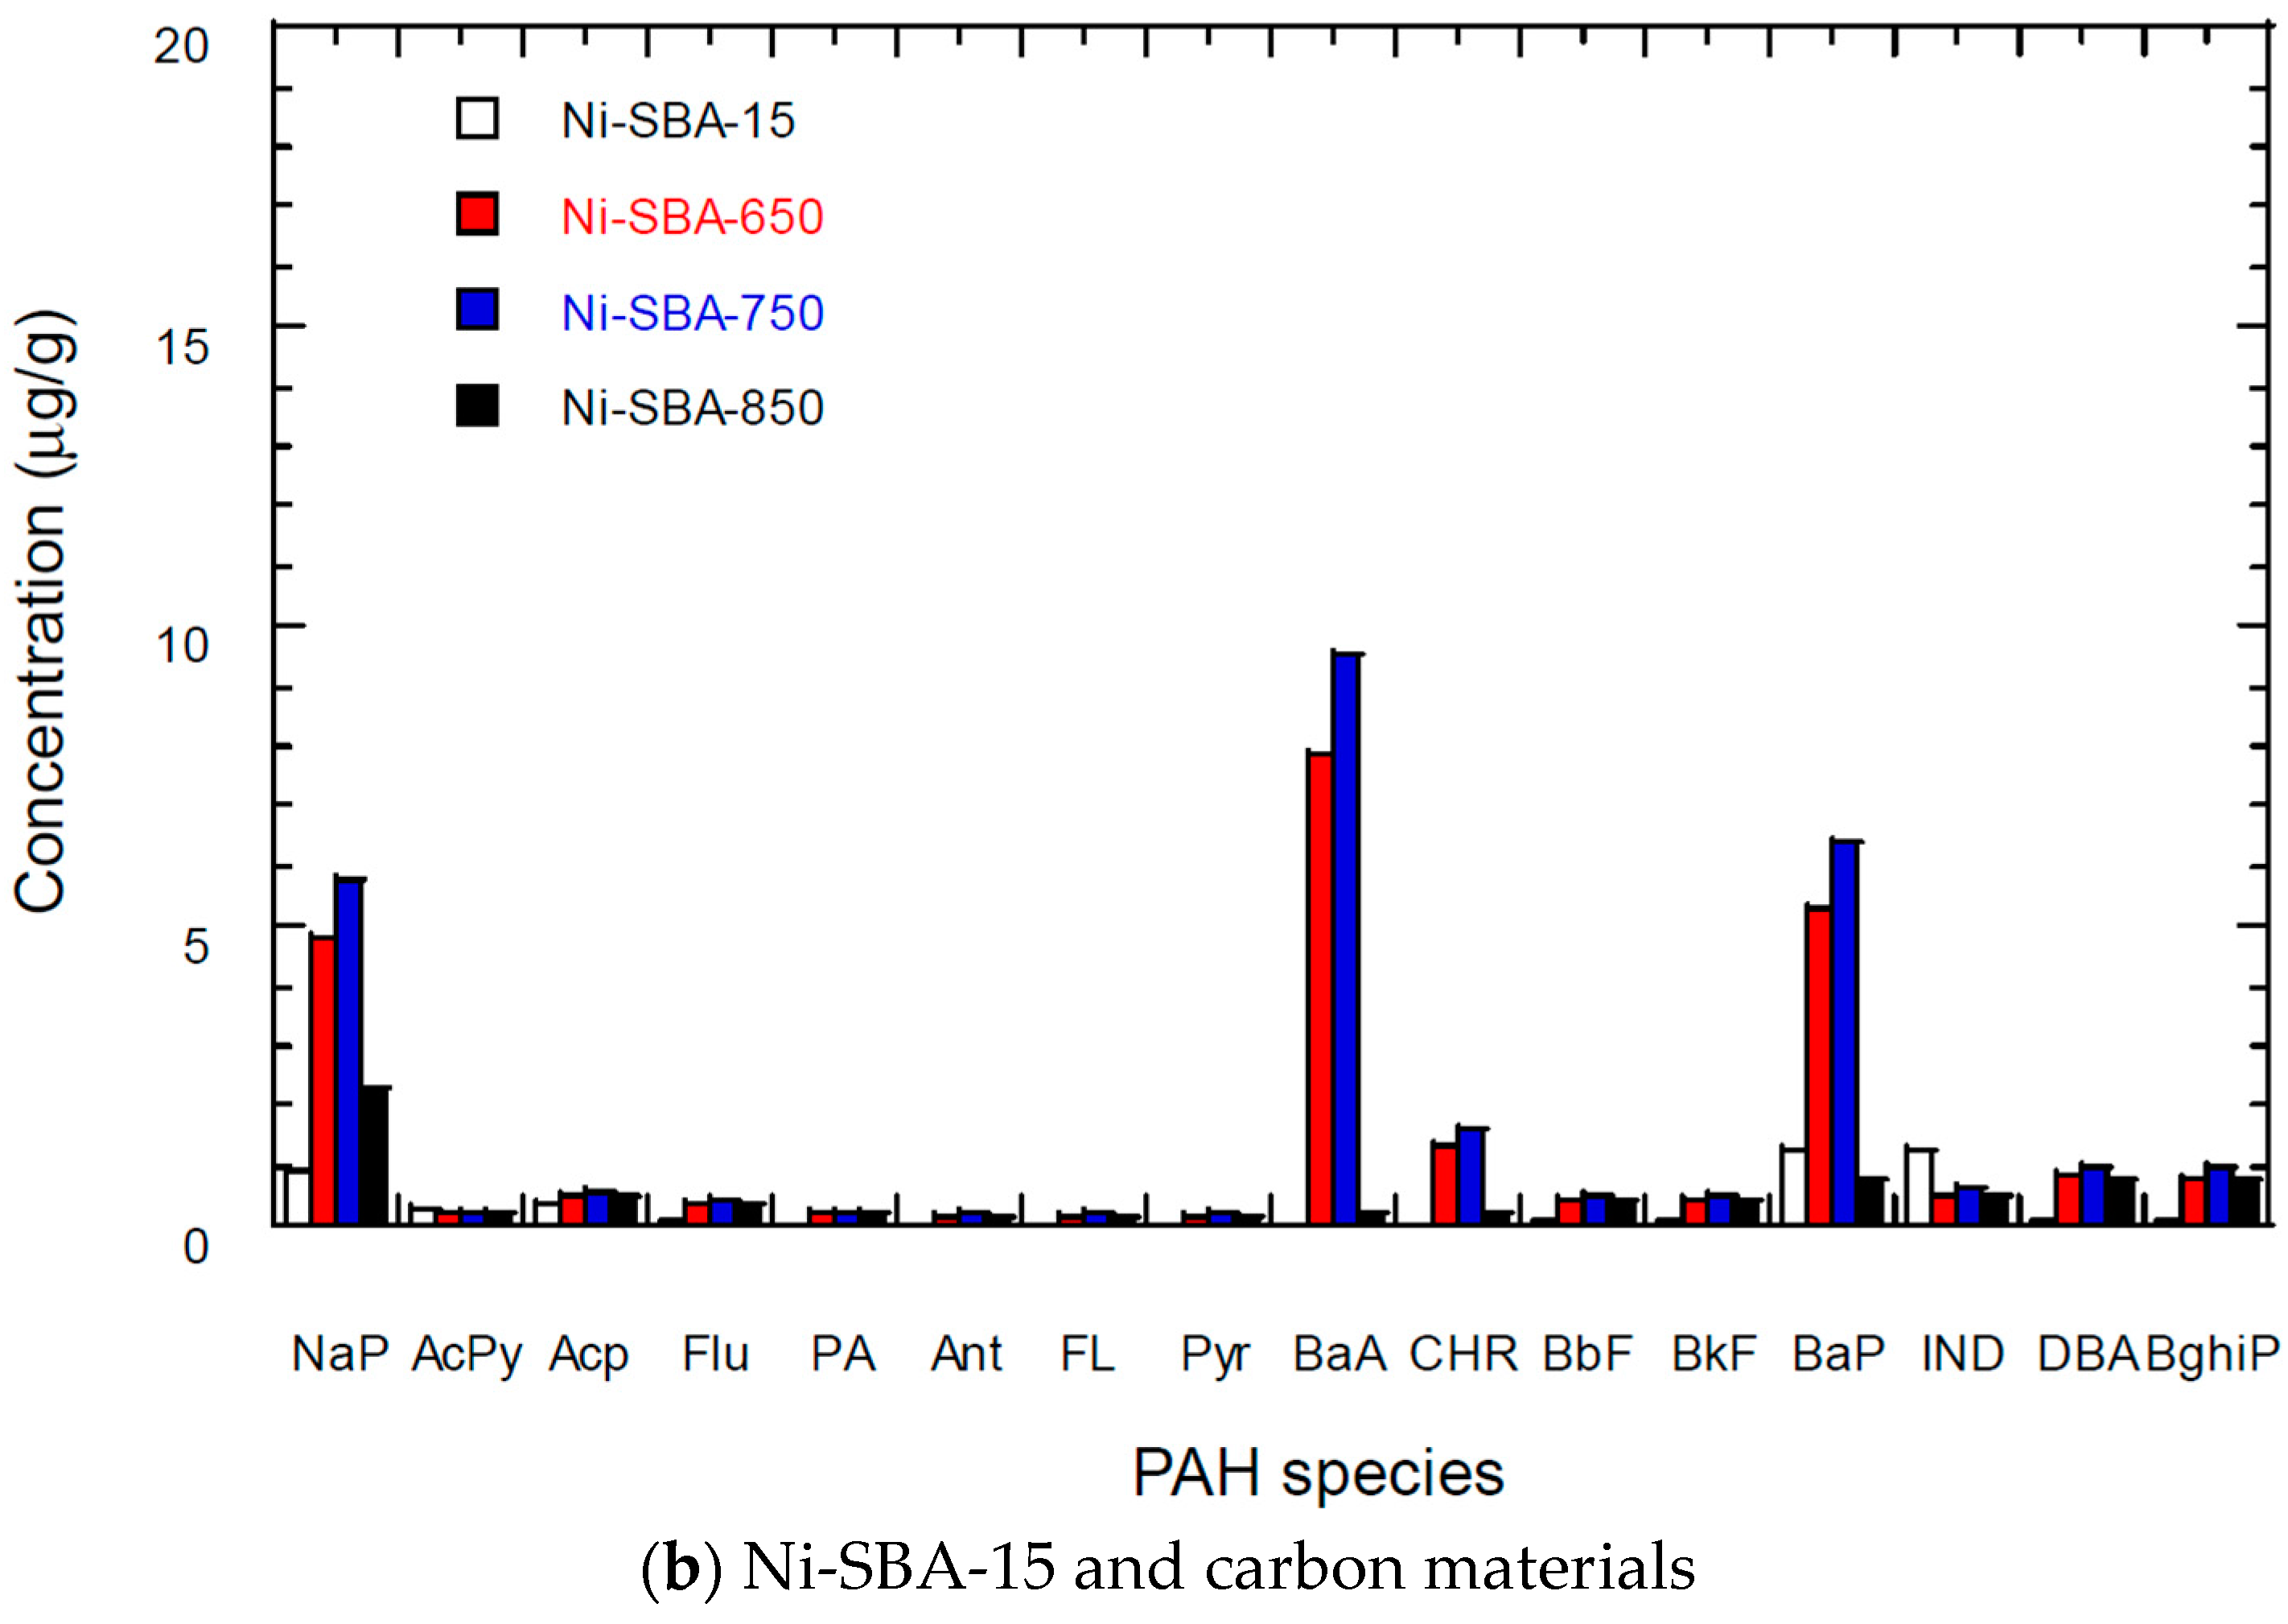
3.5. PAH Content of Carbon Materials
3.6. Particle Size and Surface Charge
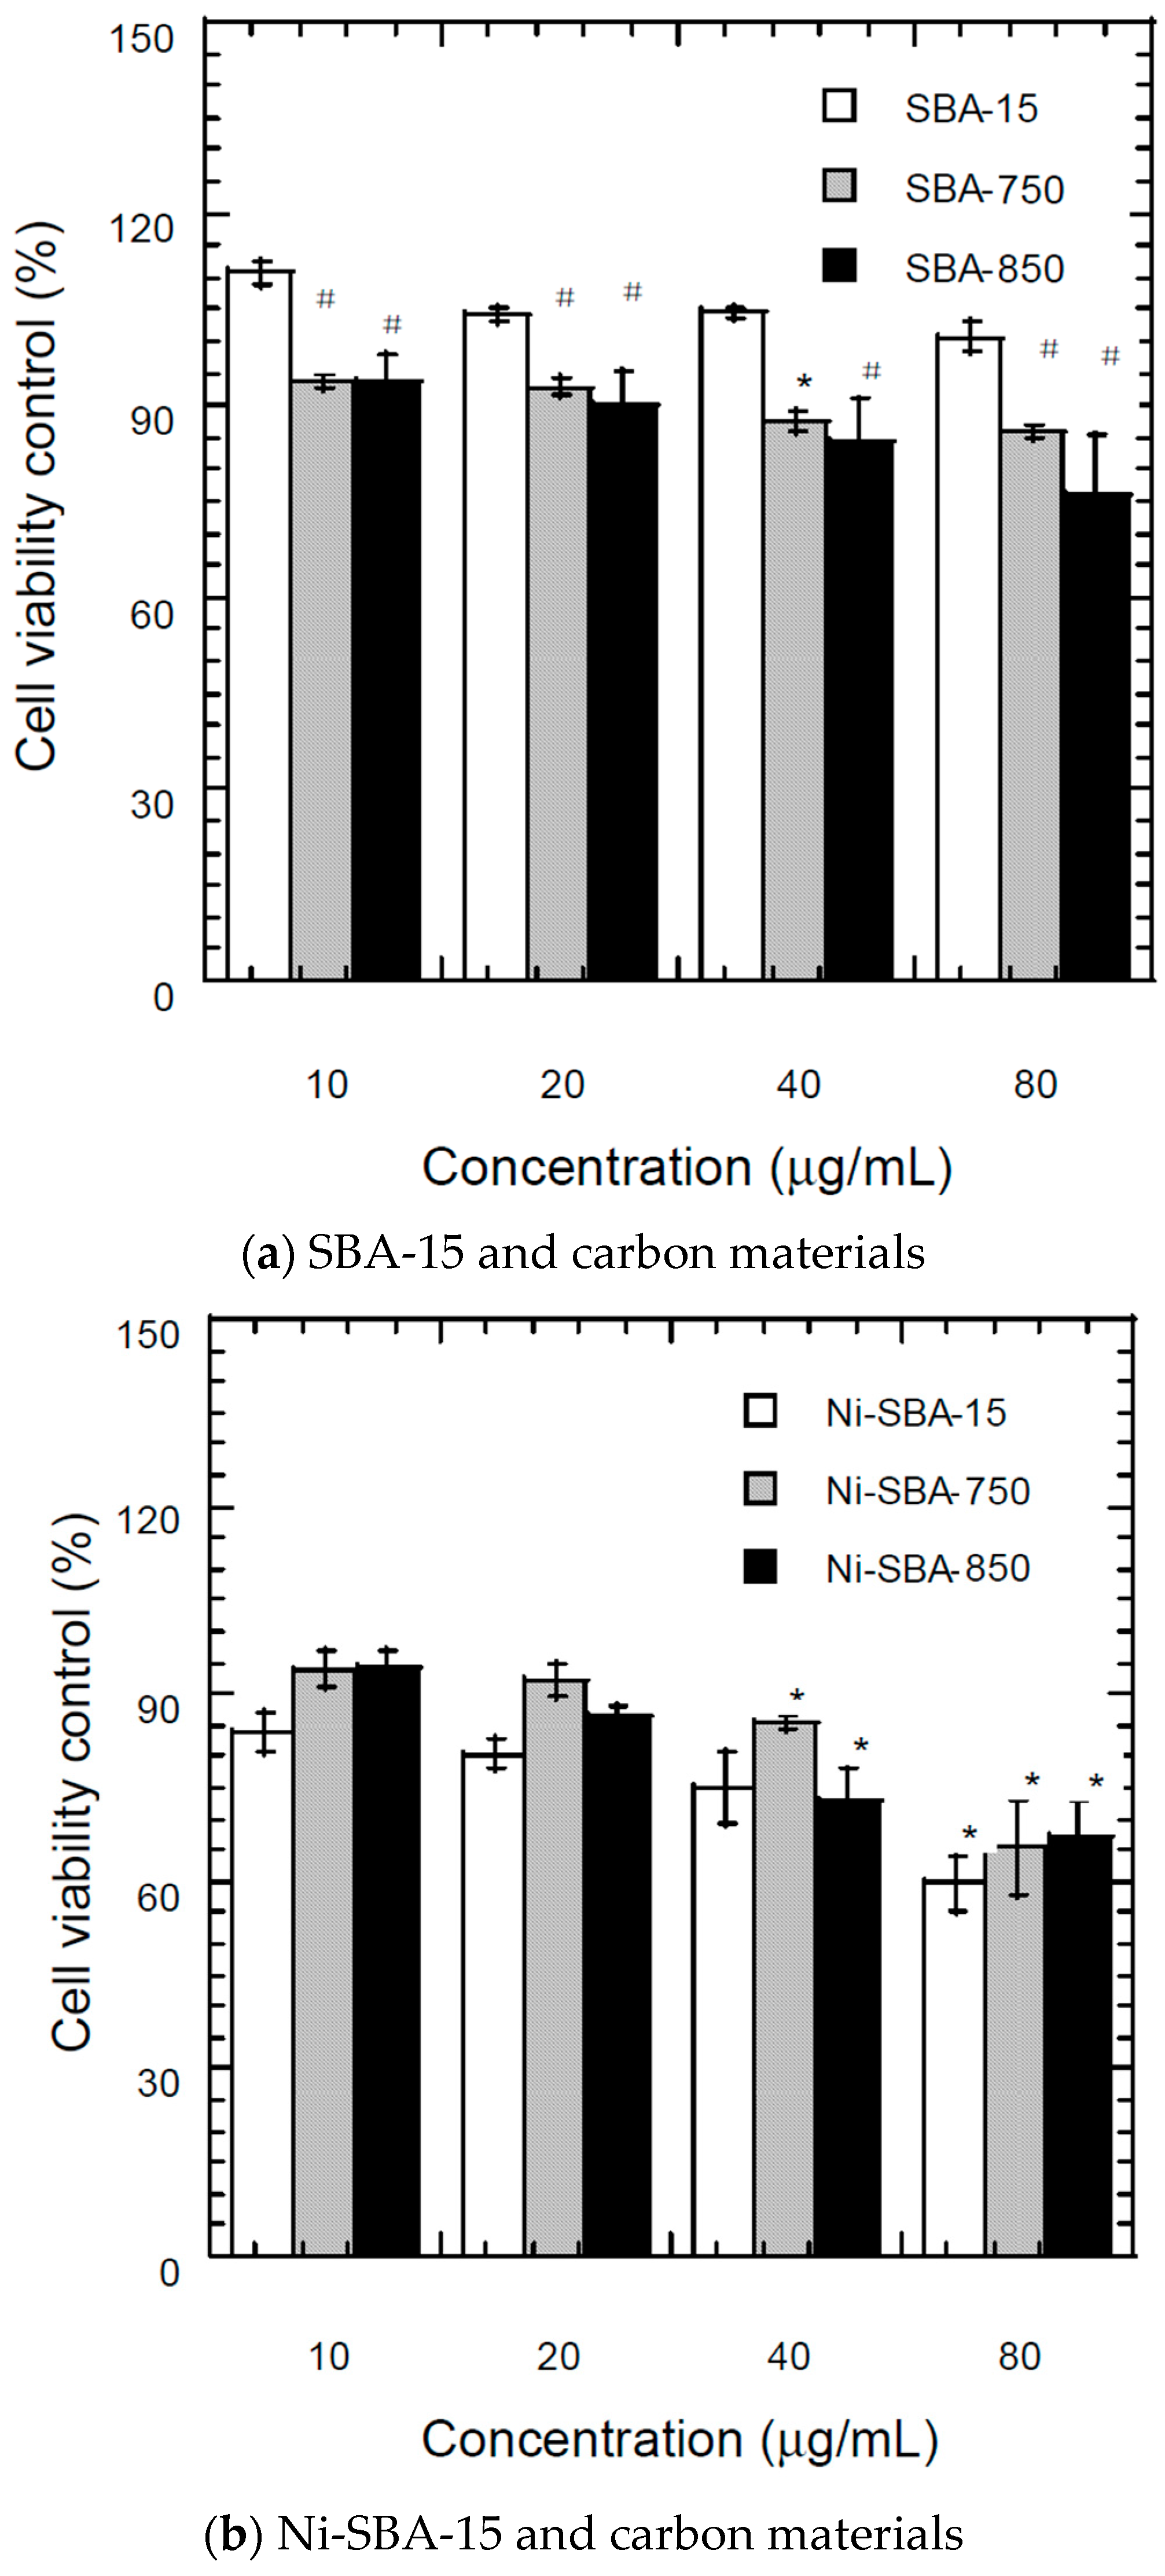
3.7. Bioactivity of Materials
3.7.1. MTT (3-(4,5-Dimethylthiazol-2-yl)-2,5-Diphenyltetrazolium Bromide) Assay
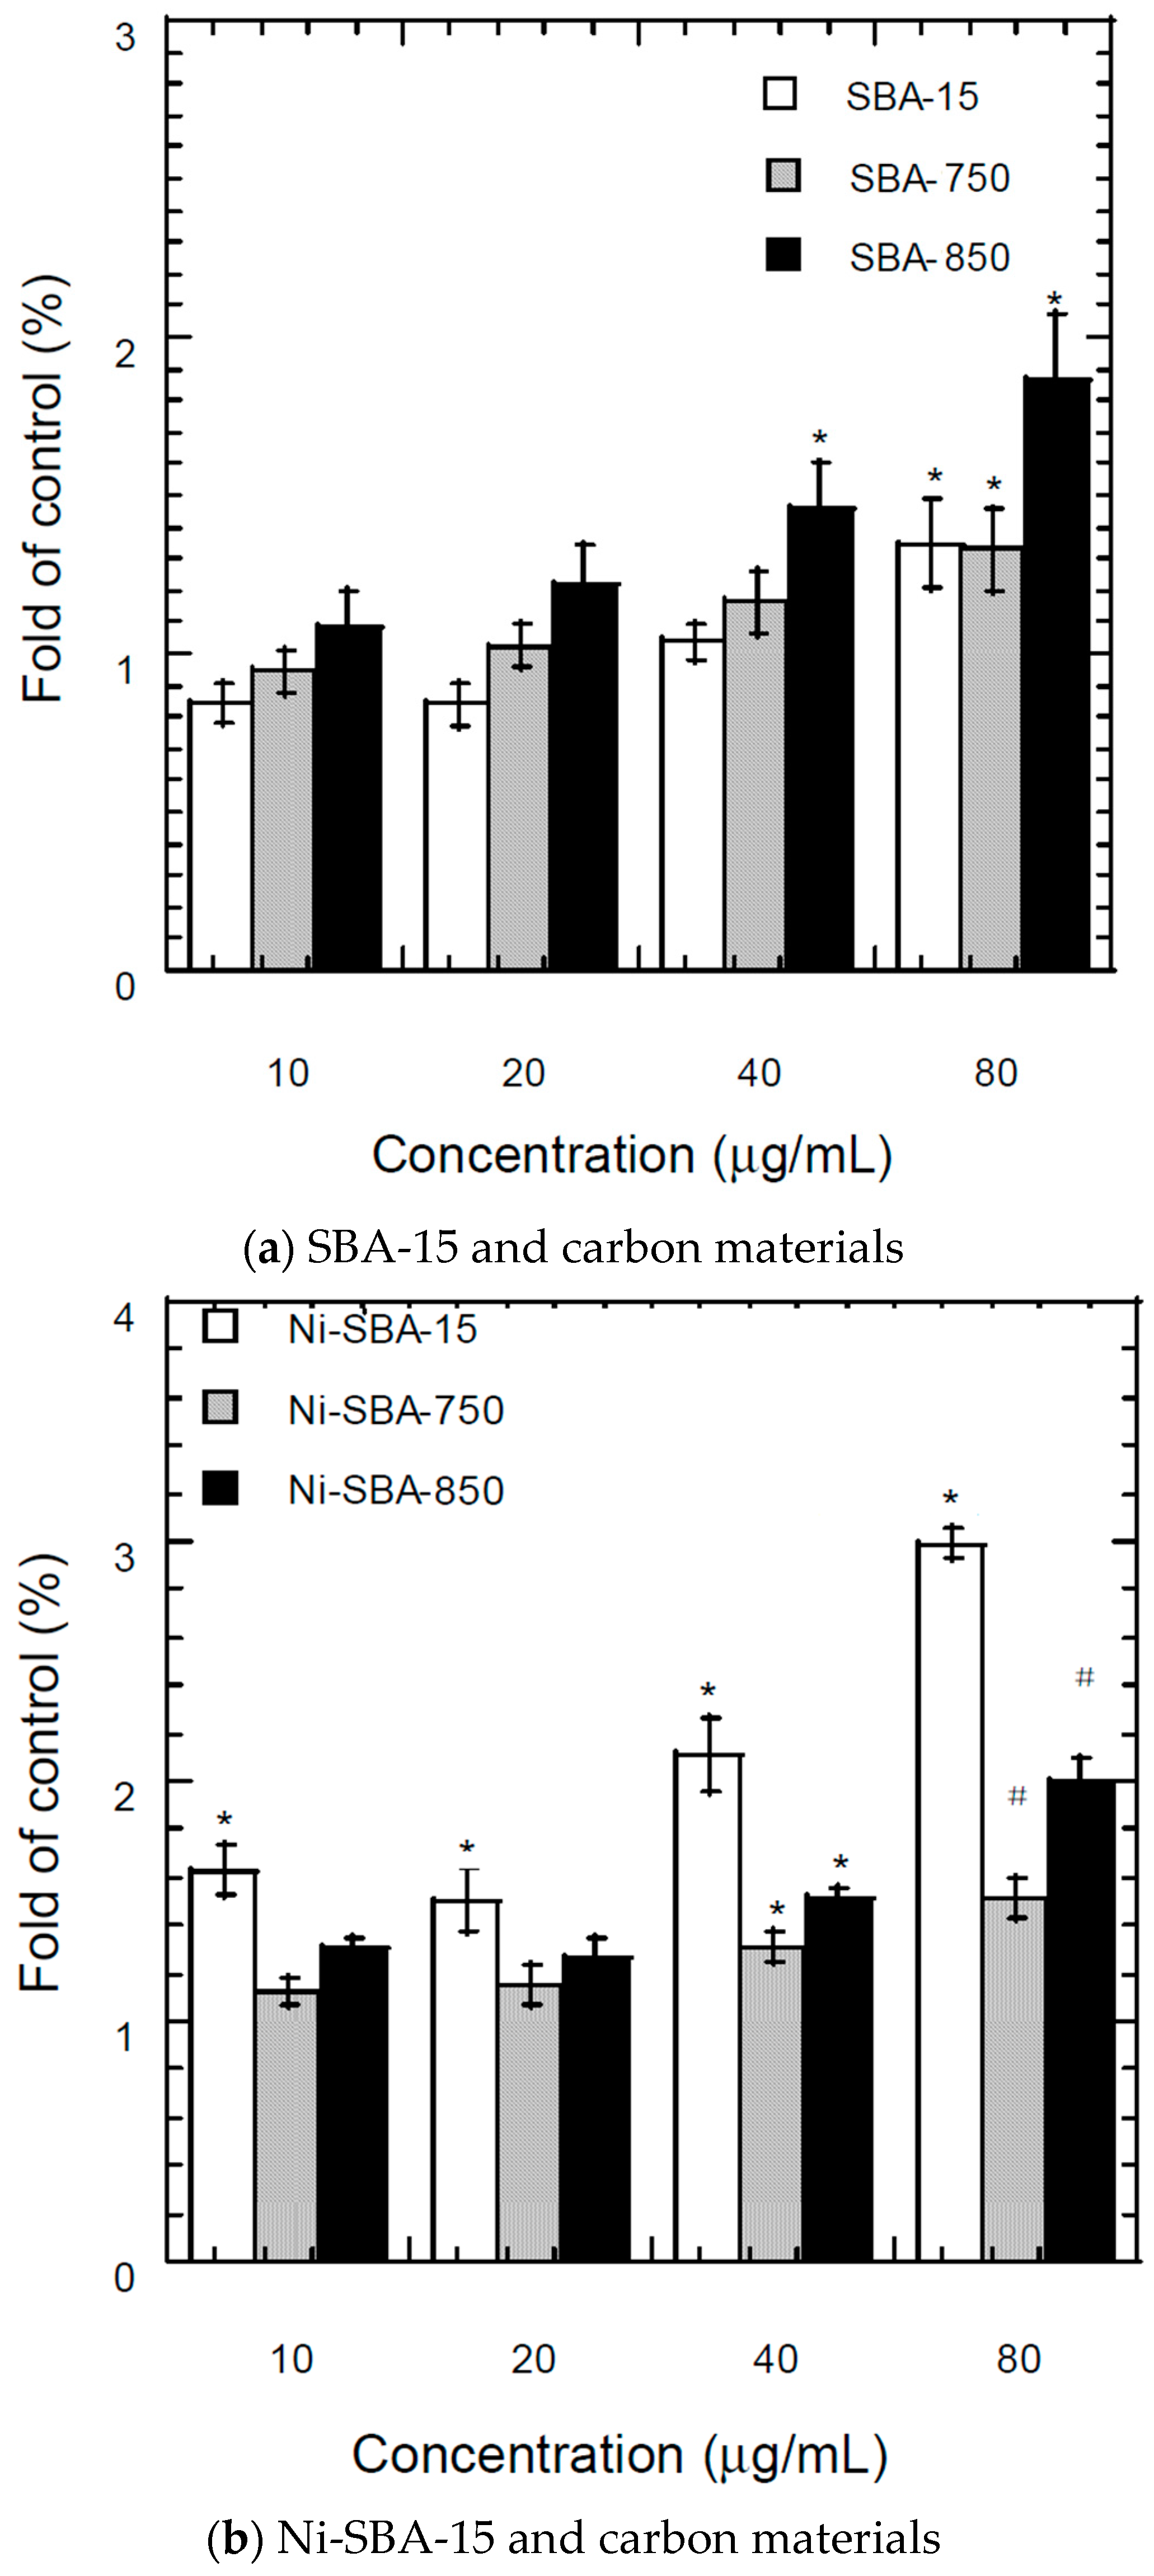
3.7.2. Fluorescence Assay of Intracellular ROS
4. Conclusions
Supplementary Materials
Acknowledgments
Author Contributions
Conflicts of Interest
References
- Kunz, R.G.; Theodore, L. Nanotechnology/Environmental Overview. In Nanotechnology: Environmental Implications and Solutions; John Wiley & Sons, Inc.: Hoboken, NJ, USA, 2005; pp. 1–60. [Google Scholar]
- Barker, P.E.; Christiansen, M.D.; Cruden, J.C.; Dunn, A.D.; Harris, P.; Hopson, R.K.; Kropf, R.L.; McKinney, S.G.; Miano, S.T.; Penny, W.L.; et al. RCRA Regulation of Wastes from the Production, Use and Disposal of Nanomaterials; American Bar Association: Chicago, IL, USA, 2006. [Google Scholar]
- Lin, W.; Huang, Y.W.; Zhou, X.D.; Ma, Y. In vitro toxicity of silica nanoparticles in human lung cancer cells. Toxicol. Appl. Pharmacol. 2006, 217, 252–259. [Google Scholar] [CrossRef] [PubMed]
- Warheit, D.B.; Webb, T.R.; Colvin, V.L.; Reed, K.L.; Sayes, C.M. Pulmonary bioassay studies with nanoscale and fine-quartz particles in rats: Toxicity is not dependent upon particle size but on surface characteristics. Toxicol. Sci. 2007, 95, 270–280. [Google Scholar] [CrossRef] [PubMed]
- Eom, H.J.; Choi, J. Oxidative stress of silica nanoparticles in human bronchial epithelial cell, Beas-2B. Toxicol. In Vitro 2009, 23, 1326–1332. [Google Scholar] [CrossRef] [PubMed]
- Napierska, D.; Thomassen, L.C.; Rabolli, V.; Lison, D.; Gonzalez, L.; Kirsch-Volders, M.; Martens, J.A.; Hoet, P.H. Size-dependent cytotoxicity of monodisperse silica nanoparticles in human endothelial cells. Small 2009, 5, 846–853. [Google Scholar] [CrossRef] [PubMed]
- Tian, F.; Cui, D.; Schwarz, H.; Estrada, G.G.; Kobayashi, H. Cytotoxicity of single-wall carbon nanotubes on human fibroblasts. Toxicol. In Vitro 2006, 20, 1202–1212. [Google Scholar] [CrossRef] [PubMed]
- Soto, K.; Garza, K.M.; Murr, L.E. Toxic effects of aggregated nanomaterials. Acta. Biomater. 2007, 3, 351–358. [Google Scholar] [CrossRef] [PubMed]
- Inoue, K.; Takano, H.; Koike, E.; Yanagisawa, R.; Sakurai, M.; Tasaka, S.; Ishizaka, A.; Shimada, A. Effects of pulmonary exposure to carbon nanotubes on lung and systemic inflammation with coagulatory disturbance induced by lipopolysaccharide in mice. Exp. Biol. Med. Maywood 2008, 233, 1583–1590. [Google Scholar] [CrossRef] [PubMed]
- Tabet, L.; Bussy, C.; Amara, N.; Setyan, A.; Grodet, A.; Rossi, M.J.; Pairon, J.C.; Boczkowski, J.; Lanone, S. Adverse effects of industrial multiwalled carbon nanotubes on human pulmonary cells. J. Toxicol. Environ. Health A 2009, 72, 60–73. [Google Scholar] [CrossRef] [PubMed]
- Herzog, E.; Byrne, H.J.; Davoren, M.; Casey, A.; Davoren, M.; Casey, A.; Duschl, A.; Oostingh, G.J. Dispersion medium modulates oxidative stress response of human lung epithelial cells upon exposure to carbon nanomaterial samples. Toxicol. Appl. Pharmacol. 2009, 236, 276–281. [Google Scholar] [CrossRef] [PubMed]
- Walker, V.G.; Li, Z.; Hulderman, T.; Schwegler-Berry, D.; Kashon, M.L.; Simeonova, P.P. Potential in vitro effects of carbon nanotubes on human aortic endothelial cells. Toxicol. Appl. Pharmacol. 2009, 236, 319–328. [Google Scholar] [CrossRef] [PubMed]
- Raffa, V.; Ciofani, G.; Vittorio, O.; Riggio, C.; Cuschieri, A. Physicochemical properties affecting cellular uptake of carbon nanotubes. Nanomedicine 2010, 5, 89–97. [Google Scholar] [CrossRef] [PubMed]
- Hu, X.; Cook, S.; Wang, P.; Hwang, H.M.; Liu, X.; Williams, Q.L. In vitro evaluation of cytotoxicity of engineered carbon nanotubes in selected human cell lines. Sci. Total Environ. 2010, 408, 1812–1817. [Google Scholar] [CrossRef] [PubMed]
- Kolosnjaj-Tabi, J.; Hartman, K.B.; Boudjemaa, S.; Ananta, J.S.; Morgant, G.; Szwarc, H.; Wilson, L.J.; Moussa, F. In vivo behavior of large doses of utrashort and full-length single-walled carbon nanotubes after oral and intraperitoneal administration to Swiss mice. ACS Nano 2010, 4, 1481–1492. [Google Scholar] [CrossRef] [PubMed]
- Rice, J.M.; Kovatch, R.M.; Anderson, L.M. Intraperitoneal mesotheliomas induced in mice by a polycyclic aromatic hydrocarbon. J. Toxicol. Environ. Health 1989, 27, 153–160. [Google Scholar] [CrossRef] [PubMed]
- Kagan, V.E.; Tyurina, Y.Y.; Tyurin, V.A.; Konduru, N.V.; Potapovich, A.I.; Osipov, A.N.; Kisin, E.R.; Schwegler-Berry, D.; Mercer, R.; Castranova, V.; et al. Direct and indirect effects of single walled carbon nanotubes on RAW 264.7 macrophages: Role of iron. Toxicol. Lett. 2006, 165, 88–100. [Google Scholar] [CrossRef] [PubMed]
- Guo, L.; Morris, D.; Liu, X.; Vaslet, C.; Hurt, R.H.; Kane, A.B. Iron bioavailability and redox activity in diverse carbon nanotube samples. Chem. Mater. 2007, 19, 3472–3478. [Google Scholar] [CrossRef]
- Lindberg, H.K.; Falck, G.C.; Suhonen, S.; Vippola, M.; Vanhala, E.; Catalán, J.; Savolainen, K.; Norppa, H. Genotoxicity of nanomaterials: DNA damage and micronuclei induced by carbon nanotubes and graphite nanofibres in human bronchial epithelial cells in vitro. Toxicol. Lett. 2009, 186, 166–173. [Google Scholar] [CrossRef] [PubMed]
- Monteiro-Riviere, N.A.; Nemanich, R.J.; Inman, A.O.; Wang, Y.Y.; Riviere, J.E. Multi-walled carbon nanotube interactions with human epidermal keratinocytes. Toxicol. Lett. 2005, 155, 377–384. [Google Scholar] [CrossRef] [PubMed]
- Pulskamp, K.; Diabate, S.; Krug, H.F. Carbon nanotubes show no sign of acute toxicity but induce intracellular reactive oxygen species in dependence on contaminants. Toxicol. Lett. 2007, 168, 58–74. [Google Scholar] [CrossRef] [PubMed]
- Pacurari, M.; Yin, X.J.; Zhao, J.; Ding, M.; Leonard, S.S.; Schwegler-Berry, D.; Ducatman, B.S.; Sbarra, D.; Hoover, M.D.; Castranova, V.; et al. Single-wall carbon nanotubes induce oxidative stress and activate MAPKs, AP-1, NF-kappaB, and Akt in normal and malignant human mesothelial cells. Environ. Health Perspect. 2008, 116, 1211–1217. [Google Scholar] [CrossRef] [PubMed]
- Jacobsen, N.R.; Pojana, G.; White, P.; Moller, P.; Cohn, C.A.; Korsholm, K.S.; Vogel, U.; Marcomini, A.; Loft, S.; Wallin, H. Genotoxicity, cytotoxicity, and reactive oxygen species induced by single-walled carbon nanotubes and C60 fullerenes in the FE1-Muta™ mouse lung epithelial cells. Environ. Mol. Mutagen. 2008, 49, 476–487. [Google Scholar] [CrossRef] [PubMed]
- Hirano, S.; Fujitani, Y.; Furuyama, A.; Kanno, S. Uptake and cytotoxic effects of multi-walled carbon nanotubes in human bronchial epithelial cells. Toxicol. Appl. Pharmacol. 2010, 249, 8–15. [Google Scholar] [CrossRef] [PubMed]
- Zhao, X.; Liu, R. Recent progress and perspectives on the toxicity of carbon nanotubes at organism, organ, cell, and biomacromolecule levels. Environ. Int. 2012, 40, 244–256. [Google Scholar] [CrossRef] [PubMed]
- Donaldson, K.; Aitken, R.; Tran, L.; Stone, V. Carbon nanotubes: A review of their properties in relation to pulmonary toxicology and workplace safety. Toxicol. Sci. 2006, 92, 5–22. [Google Scholar] [CrossRef] [PubMed]
- Shvedova, A.A.; Kisin, E.; Murray, A.R.; Johnson, V.J.; Gorelik, O.; Arepalli, S.; Hubbs, A.F.; Mercer, R.R.; Keohavong, P.; Sussman, N.; et al. Inhalation vs. aspiration of single-walled carbon nanotubes in C57BL/6 mice: Inflammation, fibrosis, oxidative stress, and mutagenesis. Am. J. Physiol. Lung Cell. Mol. Physiol. 2008, 295, 552–565. [Google Scholar] [CrossRef] [PubMed]
- Porter, D.W.; Hubbs, A.F.; Mercer, R.R.; Wu, N.; Wolfarth, M.G.; Sriram, K.; Leonard, S.; Battelli, L.; Schwegler-Berry, D.; Friend, S.; et al. Mouse pulmonary dose-and time course-responses induced by exposure to multi-walled carbon nanotubes. Toxicology 2010, 269, 136–147. [Google Scholar] [CrossRef] [PubMed]
- Braakhuis, H.M.; Park, M.V.D.Z.; Gosens, I.; de Jong, W.H.; Cassee, F.R. Physicochemical characteristics of nanomaterials that affect pulmonary inflammation. Part. Fibre Toxicol. 2014, 11, 11–18. [Google Scholar] [CrossRef] [PubMed]
- Chiang, H.L.; Wu, T.N.; Ho, Y.S.; Zeng, L.X. Carbon material formation on SBA-15 and Ni-SBA-15 and residue constituents during acetylene decomposition. J. Hazard. Mater. 2014, 276, 43–51. [Google Scholar] [CrossRef] [PubMed]
- Zhang, Y.; Smith, K.J. Carbon formation thresholds and catalyst deactivation during CH4 decomposition on supported Co and Ni catalysts. Catal. Lett. 2004, 95, 7–12. [Google Scholar] [CrossRef]
- Takenaka, S.; Serizawa, M.; Otsuka, K. Formation of filamentous carbons over supported Fe catalysts through methane decomposition. J. Catal. 2004, 222, 520–531. [Google Scholar] [CrossRef]
- Nichele, V.; Signoretto, M.; Menegazzo, F.; Gallo, A.; Santo, V.D.; Cruciani, G.; Cerrato, G. Glycerol steam reforming for hydrogen production: Design of Ni supported catalysts. Appl. Catal. B. Environ. 2012, 111, 225–232. [Google Scholar] [CrossRef]
- Park, Y.; Kang, T.; Lee, J.; Kim, P.; Kim, H.; Yi, J. Single-step preparation of Ni catalysts supported on mesoporous silicas (SBA-15 and SBA-16) and the effect of pore structure on the selective hydrodechlorination of 1,1,2-trichloroethane to VCM. Catal. Today 2004, 97, 195–203. [Google Scholar] [CrossRef]
- Park, J.I.; Lee, J.K.; Miyawaki, J.; Yoon, S.H.; Mochida, I. Catalytic oxidation of polycyclic aromatic hydrocarbons (PAHs) over SBA-15 supported metal catalysts. J. Ind. Eng. Chem. 2011, 17, 271–276. [Google Scholar] [CrossRef]
- Lu, B.; Kawamoto, K. Preparation of the highly loaded and well-dispersed NiO/SBA-15 for methanation of producer gas. Fuel 2013, 103, 699–704. [Google Scholar] [CrossRef]
- Leroi, P.; Cadete Santos Aires, F.J.; Goislard de Monsabert, T.; LePoche, H.; Dijon, J.; Rousset, J.L.; Bertolini, J.C. Nickel antigorite synthesis and carbon tubular nanostructures formation on antigorite-based nickel particles by acetylene decomposition. Appl. Catal. A Gen. 2005, 294, 131–140. [Google Scholar] [CrossRef]
- Atchudan, R.; Pandurangan, A.; Joo, J. Synthesis of multilayer graphene balls on mesoporous Co-MCM-41 molecular sieves by chemical vapour deposition method. Microporous Mesoporous Mater. 2013, 175, 161–169. [Google Scholar] [CrossRef]
- Tang, N.; Wen, J.; Zhang, Y.; Liu, F.; Lin, K.; Du, Y. Helical carbon nanotubes: Catalytic particle size-dependent growth and magnetic properties. ACS Nano 2010, 4, 241–250. [Google Scholar] [CrossRef] [PubMed]
- Chen, X.H.; Deng, F.M.; Wang, J.X.; Yang, H.S.; Wu, G.T.; Zhang, X.B.; Peng, J.C.; Li, W.Z. New method of carbon onion growth by radio-frequency plasma-enhanced chemical vapor deposition. Chem. Phys. Lett. 2001, 336, 201–204. [Google Scholar] [CrossRef]
- Xu, B.S. Prospects and research progress in nano onion-like fullerenes. New Carbon Mater. 2008, 23, 289–301. [Google Scholar] [CrossRef]
- Brubauer, S.; Emmett, H.P.; Teller, E. Adsorption of gases in multimolecular layers. J. Am. Chem. Soc. 1938, 60, 309–319. [Google Scholar] [CrossRef]
- Barrett, E.P.; Joyner, L.S.; Halenda, P.P. The determination of pore volume and area distributions in porous substances. I. Computations from nitrogen isotherms. J. Am. Chem. Soc. 1951, 73, 373–380. [Google Scholar] [CrossRef]
- Harkins, W.D.; Jura, G. Surfaces of solids. XIII. A vapor adsorption method for the determination of the area of a solid without the assumption of a molecular area, and the areas occupied by nitrogen and other molecules on the surface of a solid. J. Chem. Phys. 1944, 66, 1366–1373. [Google Scholar] [CrossRef]
- Lippens, B.C.; de Boer, J.H. Studies on pore systems in catalysts: V. The t method. J. Catal. 1965, 4, 319–323. [Google Scholar] [CrossRef]
- Chiang, H.M.; Xia, Q.; Zou, X.; Wang, C.; Wang, S.; Miller, B.J.; Howard, P.C.; Yin, J.J.; Beland, F.A.; Yu, H.; et al. Nanoscale ZnO induces cytotoxicity and DNA damage in human cell lines and rat primary neuronal cells. J. Nanosci. Nanotechnol. 2012, 12, 2126–2135. [Google Scholar] [CrossRef] [PubMed]
- Zhang, Y.; Newton, B.; Lewis, E.; Fu, P.P.; Kafoury, R.; Ray, P.C.; Yu, H. Cytotoxicity of organic surface coating agents used for nanoparticles synthesis and stability. Toxicol. In Vitro 2015, 29, 762–768. [Google Scholar] [CrossRef] [PubMed]
- Wang, C.C.; Wang, S.; Xia, Q.; He, W.; Yin, J.J.; Fu, P.P.; Li, J.H. Phototoxicity of zinc oxide nanoparticles in HaCaT keratinocytes-generation of oxidative DNA damage during UVA and visible light irradiation. J. Nanosci. Nanotechnol. 2013, 13, 3880–3888. [Google Scholar] [CrossRef] [PubMed]
- Hindi, T.E.I.; Ehlers, G.; Demchuk, M.; Pfitzner, I. Determination of the antioxidant capacity of an antioxidant combination using the fluoroscan assay in vitro and visualization of its effects using histological methods. Arch. Dermatol. Res. 2004, 296, 258–264. [Google Scholar] [CrossRef] [PubMed]
- Wang, F.; Jin, C.; Liang, H.; Tang, Y.; Zhang, H.; Yang, Y. Effects of fullerene C 60 nanoparticles on A549 cells. Environ. Toxicol. Pharmacol. 2014, 37, 656–661. [Google Scholar] [CrossRef] [PubMed]
- Kroto, H.W. The stability of the fullerenes Cn, with n = 24, 28, 32, 36, 50, 60 and 70. Nature 1987, 329, 529–531. [Google Scholar] [CrossRef]
- Wang, H.; Frenklach, M. A detailed kinetic modeling study of aromatics formation in laminar premixed acetylene and ethylene flames. Combust. Flame 1997, 110, 173–221. [Google Scholar] [CrossRef]
- Richter, H.; Howard, J.B. Formation of polycyclic aromatic hydrocarbons and their radicals in a nearly sooting premixed benzene flame. Prog. Energy Combust. Sci. 2000, 26, 2609–2618. [Google Scholar] [CrossRef]
- Verma, A.; Stellacci, F. Effect of surface properties on nanoparticle–cell interactions. Small 2010, 6, 12–21. [Google Scholar] [CrossRef] [PubMed]
- Oberdörster, G.; Maynard, A.; Donaldson, K.; Castranova, V.; Fitzpatrick, J.; Ausman, K.; Carter, J.; Karn, B.; Kreyling, W.; Lai, D.; et al. Principles for characterizing the potential human health effects from exposure to nanomaterials: Elements of a screening strategy. Part. Fibre Toxicol. 2005, 2, 2–8. [Google Scholar]
- Oberdörster, G.; Oberdörster, E.; Oberdörster, J. Nanotoxicology: An emerging discipline evolving from studies of ultrafine particles. Environ. Health Perspect. 2005, 113, 823–839. [Google Scholar] [CrossRef] [PubMed]
- Oberdörster, G.; Stone, V.; Donaldson, S.K. Toxicology of nanoparticles: A historical perspective. Nanotoxicology 2007, 1, 2–25. [Google Scholar] [CrossRef]
- Jiang, J.; Oberdörster, G.; Elder, E.; Gelein, R. Does nanoparticle activity depend upon size and crystal phase? Nanotoxicology 2008, 2, 33–42. [Google Scholar] [CrossRef] [PubMed]
- Gao, H.; Shi, W.; Freund, L.B. Mechanics of receptor-mediated endocytosis. Proc. Natl. Acad. Sci. USA 2005, 102, 9469–9474. [Google Scholar] [CrossRef] [PubMed]
- Alexis, F.; Pridgen, E.; Molnar, L.K.; Farokhzad, O.C. Factors affecting the clearance and biodistribution of polymeric nanoparticles. Mol. Pharm. 2008, 54, 505–515. [Google Scholar] [CrossRef] [PubMed]
- Gratton, S.E.A.; Ropp, P.A.; Pohlhaus, P.D.; Luft, J.C.; Madden, V.J.; Napier, M.E.; DeSimone, J.M. The effect of particle design on cellular internalization pathways. Proc. Natl. Acad. Sci. USA 2008, 105, 11613–11618. [Google Scholar] [CrossRef] [PubMed]
- He, C.; Hu, Y.; Yin, L.; Tang, C.; Yin, C. Effects of particle size and surface charge on cellular uptake and biodistribution of polymeric nanoparticles. Biomaterials 2010, 31, 3657–3666. [Google Scholar] [CrossRef] [PubMed]
- Nel, A.E.; Madler, L.; Velegol, D.; Xia, T.; Hoek, E.M.V.; Somasundaran, P.; Klaessig, F.; Castranova, V.; Thompson, M. Understanding biophysicochemical interactions at the nano–bio interface. Nat. Mater. 2009, 8, 543–557. [Google Scholar] [CrossRef] [PubMed]
- Wang, Y.; Gao, X.; Qin, H.J.; Ohta, Y.; Wu, X.; Eres, G.; Morokuma, K.; Irle, S. Quantum chemical simulations reveal acetylene-based growth mechanisms in the chemical vapor deposition synthesis of carbon nanotubes. Carbon 2014, 72, 22–37. [Google Scholar] [CrossRef]
- Donaldson, K.; Stone, K. Current hypotheses on the mechanisms of toxicity of ultrafine particles. Ann. Ist. Super. Sanita 2003, 39, 405–410. [Google Scholar] [PubMed]
- Risom, L.; Moller, P.; Loft, S. Oxidative stress-induced DNA damage by particulate air pollution. Mutat. Res. 2005, 592, 119–137. [Google Scholar] [CrossRef] [PubMed]
- Roduner, E. Size matters: Why nanomaterials are different. Chem. Soc. Rev. 2006, 35, 583–592. [Google Scholar] [CrossRef] [PubMed]


| Materials | SSA * (m2/g) | TPV (cm3/g) | PD (Å) | MSA (m2/g) | MPV (cm3/g) |
|---|---|---|---|---|---|
| SBA-15 | 652 ± 11 | 0.673 ± 0.013 | 41.35 ± 0.29 | 117.92 ± 4.81 | 0.062 ± 0.002 |
| SBA-650 | 7.85 ± 1.73 | 0.02455 ± 0.001 | 124.975 ± 18.29 | -** | - |
| SBA-750 | 9.57 ± 3.32 | 0.0222 ± 0.007 | 93.435 ± 4.43 | - | - |
| SBA-850 | 4.884 ± 0.18 | 0.0126 ± 0.003 | 102.803 ± 18.80 | - | - |
| Ni-SBA-15 | 472 ± 25 | 0.686 ± 0.003 | 58.2 ± 3.31 | 25.74 ± 4.74 | 0.0122 ± 0.002 |
| Ni-SBA-650 | 11.737 ± 0.26 | 0.0762 ± 0.006 | 259.45 ± 14.59 | - | - |
| Ni-SBA-750 | 5.8275 ± 2.62 | 0.0168 ± 0.005 | 91.36 ± 16.65 | - | - |
| Ni-SBA-850 | 5.405 ± 0.93 | 0.0125 ± 0.004 | 120.03 ± 21.84 | - | - |
| Material | C | O | Si | Ni |
|---|---|---|---|---|
| SBA-15 | 13.0 ± 4.6 | 36.7 ± 4.6 | 50.3 ± 8.4 | -* |
| SBA-650 | 47.6 ± 0.5 | 24.4 ± 2.2 | 28.1 ± 1.7 | - |
| SBA-750 | 60.3 ± 4.2 | 19.4 ± 2.6 | 20.3 ± 1.5 | - |
| SBA-850 | 61.8 ± 3.1 | 15.2 ± 2.9 | 23.0 ± 0.2 | - |
| Ni-SBA-15 | 19.8 ± 14.3 | 33.9 ± 2.9 | 37.5 ± 10.6 | 7.8 ± 2.5 |
| Ni-SBA-650 | 57.8 ± 3.9 | 14.4 ± 1.2 | 22.9 ± 3.4 | 4.9 ± 0.7 |
| Ni-SBA-750 | 60.4 ± 9.7 | 15.4 ± 3.0 | 19.9 ± 6.1 | 4.1 ± 0.6 |
| Ni-SBA-850 | 60.0 ± 4.8 | 14.9 ± 0.6 | 21.4 ± 4.2 | 3.7 ± 1.2 |
| Element | SBA-15 | SBA-650 | SBA-750 | SBA-850 | Ni-SBA-15 | Ni-SBA-650 | Ni-SBA-750 | Ni-SBA-850 |
|---|---|---|---|---|---|---|---|---|
| Ni | 21 ± 4.7 | 10 ± 3.2 | 8.3 ± 2.5 | 6.5 ± 3.1 | 57,100 ± 6543 | 45,860 ± 5325 | 36,500 ± 1549.1 | 23,470 ± 2974.2 |
| Zn | 153 ± 45.8 | 133 ± 50.3 | 105 ± 32.7 | 89 ± 45.6 | 201 ± 65.3 | 178 ± 84.1 | 125 ± 54.3 | 103 ± 47.7 |
| Na | 230 ± 119.4 | 175 ± 103.6 | 154 ± 85.1 | 72 ± 43.2 | 180 ± 89.5 | 154 ± 31.5 | 106 ± 37.9 | 86 ± 25.3 |
| K | 102 ± 21 | 89 ± 26.9 | 75 ± 17.6 | 64 ± 20.3 | 131 ± 34.5 | 116 ± 40.3 | 98.3 ± 17.9 | 82.5 ± 34.5 |
| Al | 95.2 ± 6.5 | 90.2 ± 10.1 | 87 ± 6.3 | 65 ± 5.4 | 86.3 ± 8.2 | 78.5 ± 9.1 | 68.9 ± 10.5 | 63.4 ± 7.8 |
| Ca | 43.1 ± 5.2 | 40.6 ± 8 | 35.3 ± 7.5 | 28.3 ± 3.4 | 57.3 ± 10.3 | 45.3 ± 4.5 | 38.7 ± 2.7 | 26.1 ± 5.2 |
| Mg | 50.2 ± 14.1 | 45.3 ± 18.9 | 40.6 ± 20.1 | 32.9±14.9 | 39.4 ± 12.5 | 38.6 ± 21.6 | 32.7 ± 11.5 | 24.6 ± 17.5 |
| Co | 12.3 ± 5.1 | 11.2 ± 5.2 | 9.7 ± 3.2 | 8.4 ± 4.2 | 37.8 ± 6.8 | 32.6 ± 6.7 | 28.5 ± 4.8 | 20.3 ± 3.1 |
| Fe | 45.1 ± 15.3 | 40.2 ± 6.7 | 38.7 ± 8.4 | 30.6 ± 4.9 | 37.4 ± 10.5 | 35.8 ± 5.3 | 30.2 ± 4.2 | 19.8 ± 1.6 |
| In | <5.0 | <5.0 | <5.0 | <5.0 | 7.29 ± 3.2 | 6.23 ± 3.6 | 5.87 ± 2.4 | 5.34 ± 2.1 |
| B | <5.0 | <5.0 | <5.0 | <5.0 | 5.57 ± 1.5 | <5.0 | <5.0 | <5.0 |
| Li | <5.0 | <5.0 | <5.0 | <5.0 | 5.11 ± 0.76 | <5.0 | <5.0 | <5.0 |
| Cd | 5.2 ± 1.5 | <5.0 | <5.0 | <5.0 | <5.00 | <5.0 | <5.0 | <5.0 |
| Materials | Zeta Potential (mV) | Particle Size (nm) |
|---|---|---|
| SBA-15 | −16.2 ± 1.35 | 3568.7 ± 505.5 |
| SBA-650 | −18.9 ± 1.35 | 5966.7 ± 844.9 |
| SBA-750 | −14.9 ± 2.01 | 2023.7 ± 631.0 |
| SBA-850 | −15.1 ± 1.99 | 2399.3 ± 407.4 |
| Ni-SBA-15 | −20.8 ± 0.1 | 2896.3 ± 381.5 |
| Ni-SBA-650 | −6.2 ± 0.68 | 2280.4 ± 509.4 |
| Ni-SBA-750 | −21.9 ± 3.81 | 3430.0 ± 604.7 |
| Ni-SBA-850 | −11.8 ± 1.95 | 3843.7 ± 853.3 |
© 2016 by the authors; licensee MDPI, Basel, Switzerland. This article is an open access article distributed under the terms and conditions of the Creative Commons Attribution (CC-BY) license (http://creativecommons.org/licenses/by/4.0/).
Share and Cite
Chiang, H.-M.; Cho, K.-Y.; Zeng, L.-X.; Chiang, H.-L. Characteristics of Carbon Material Formation on SBA-15 and Ni-SBA-15 Templates by Acetylene Decomposition and Their Bioactivity Effects. Materials 2016, 9, 350. https://doi.org/10.3390/ma9050350
Chiang H-M, Cho K-Y, Zeng L-X, Chiang H-L. Characteristics of Carbon Material Formation on SBA-15 and Ni-SBA-15 Templates by Acetylene Decomposition and Their Bioactivity Effects. Materials. 2016; 9(5):350. https://doi.org/10.3390/ma9050350
Chicago/Turabian StyleChiang, Hsiu-Mei, Kuan-Yu Cho, Li-Xuan Zeng, and Hung-Lung Chiang. 2016. "Characteristics of Carbon Material Formation on SBA-15 and Ni-SBA-15 Templates by Acetylene Decomposition and Their Bioactivity Effects" Materials 9, no. 5: 350. https://doi.org/10.3390/ma9050350