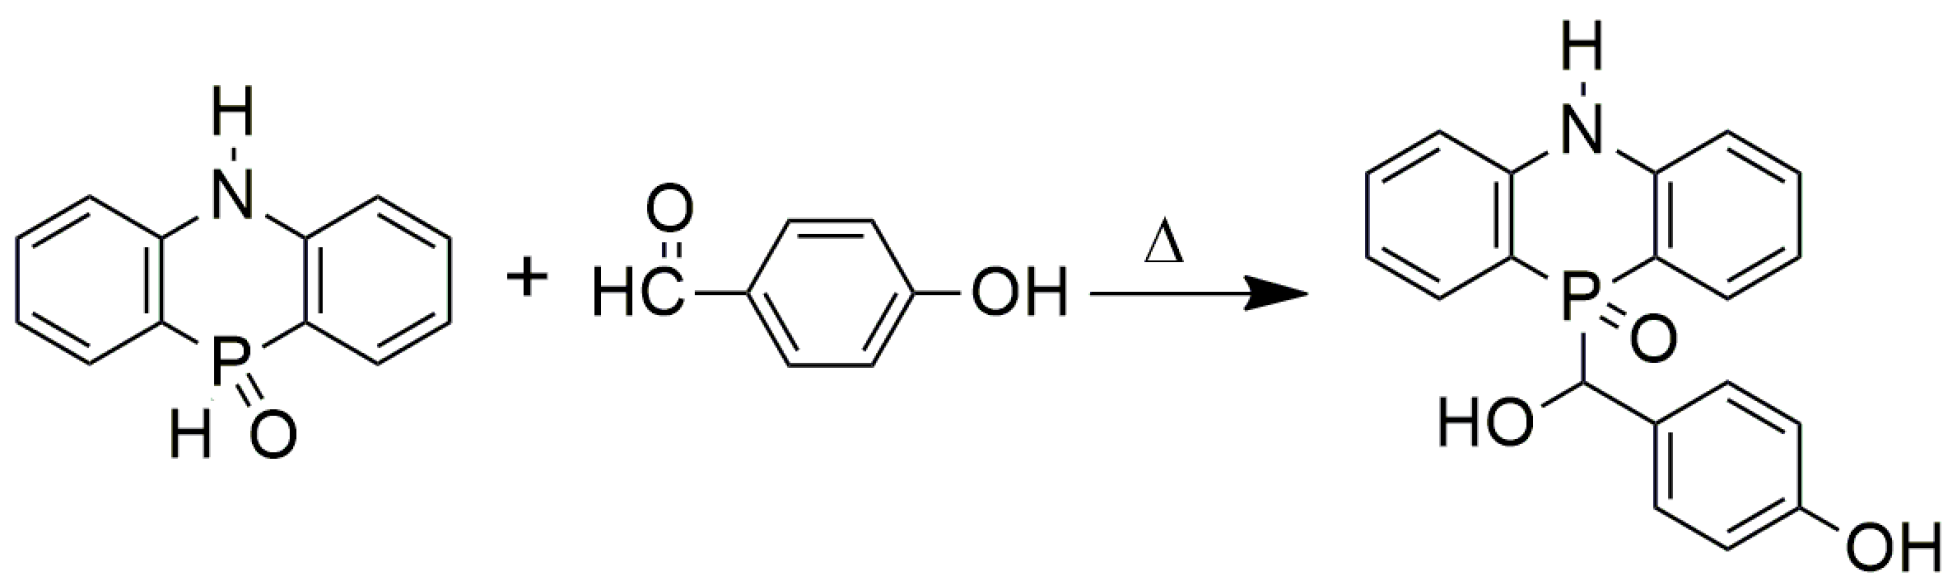
2.1. Synthesis and Characterization
In principle, HB-DPPA is produced through electrophilic addition reaction. That is, the electrophilic P–H group in DPPA reacts with the nucleophilic C=O group in HB. As shown by the Fourier transform infrared (FTIR) spectra of DPPA, HB, and HB-DPPA (
Figure S1), a few peaks disappear after the addition reaction between DPPA and HB, like the distinctive absorption peak at 2370 cm
−1 for P–H stretching vibration in DPPA and 1670 cm
−1 for C=O stretching vibration in HB. Meanwhile, a broad absorption appears at around 3229 cm
−1 for O–H. All the results confirm the occurrence of an addition reaction between DPPA and HB.
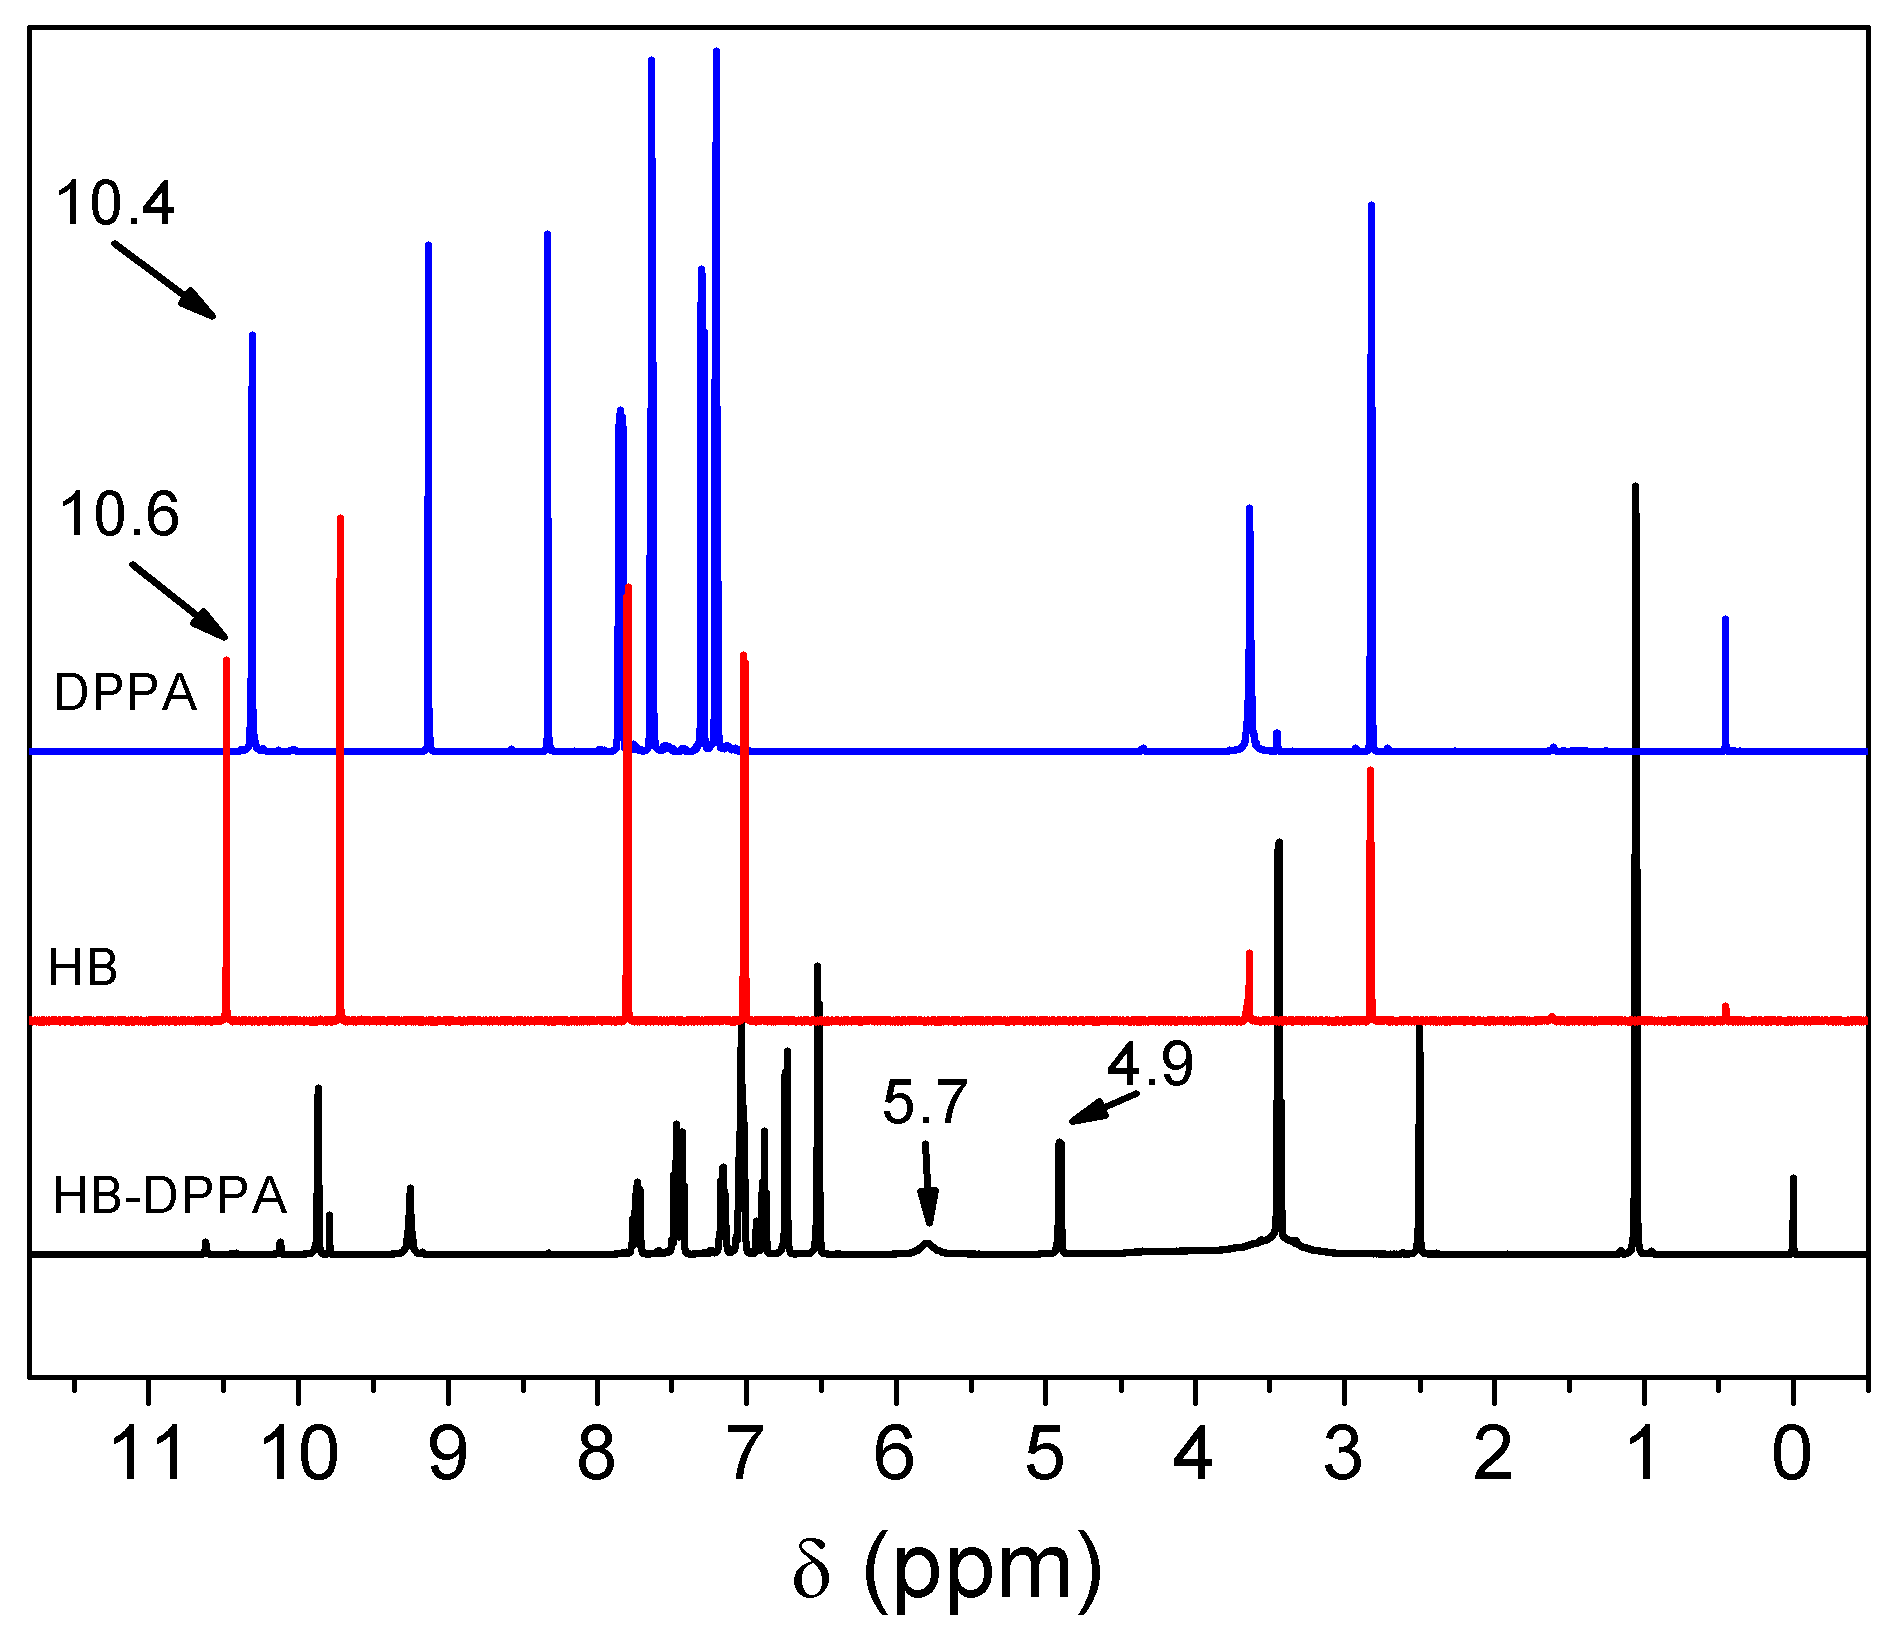
Figure 1 shows
1H nuclear magnetic resonance (NMR) spectra of DPPA, HB, and HB-DPPA. The characteristic proton of C–OH at δ = 4.9 ppm is found in HB-DPPA, following the disappearance of the peak of P–H (δ = 10.4 ppm) in DPPA and the peak of C(O)–H (δ = 10.6 ppm) in HB. Moreover, the proton of –C(OH)–H in HB-DPPA is also observed at δ = 5.7 ppm.
Mass spectrometry (MS) m/z: calcd for C19H16NO3P: 337.31, found: 338.09 (M + H+), 360.07 (M + Na+).
Clearly, the product HB-DPPA with the expected chemical structure has been successfully synthesized.
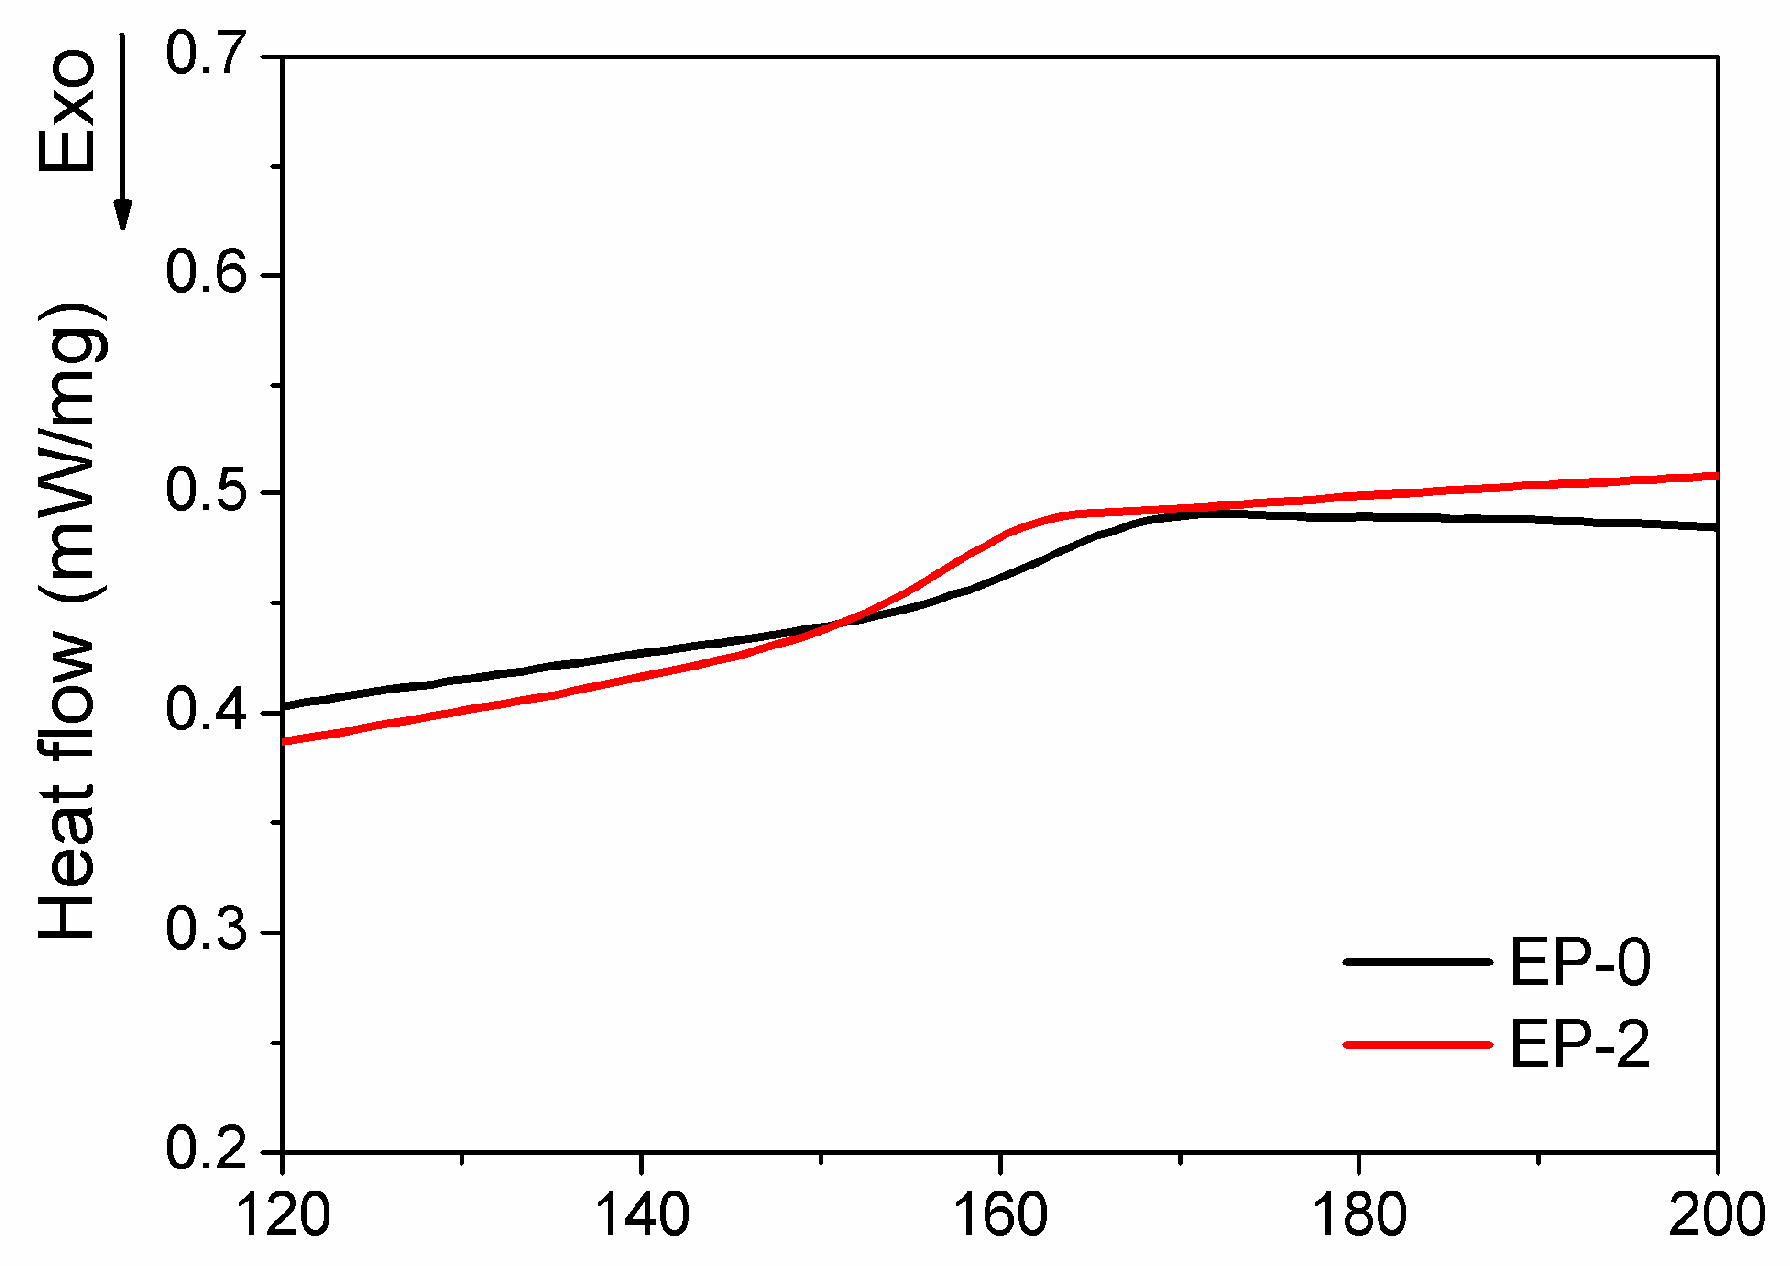
2.2. Curing Behavior
The thermal curing behavior of the flame-retarded epoxy was investigated by differential scanning calorimeter (DSC) (
Figure S2). The parameters of the curing process, including the onset curing temperature (T
o), exothermic peak temperature (T
p), and end curing temperature (T
e), were derived from the thermograms. As shown in
Table S1, the values of T
o, T
p, and T
e of EP-2 are all lower than those of EP-0. Since HB-DPPA is mixed first with DGEBA at high temperature until the solution becomes completely clear, it suggests that the N–H group in HB-DPPA molecule must have reacted with epoxide, producing a tertiary amine that catalyzes the subsequent curing reaction of DGEBA/DDM. As a consequence, the curing temperature decreases following the addition of HB-DPPA. The feasible reactivity of the N–H group in DPPA moiety with DGEBA is evidenced from the disappearance of the peak in
1H NMR analysis [
26] and the appearance of the broad exothermic peak from 170 °C to 230 °C (
Figure S3). Since the hydroxyl group possesses less nucleophilicity and would not attack the epoxide group in that temperature range, the detected exothermic peak represents the ring-opening reaction of DGEBA by the N–H group of HB-DPPA. It is noteworthy that the amount of N–H in HB-DPPA is much lower than that of epoxy in DGEBA, leading to a quite blunt and weak peak in the thermogram.
2.3. Flammability
As is widely known, the limiting oxygen index (LOI) measurement and UL-94 vertical burning test are commonly used as indicators to evaluate the flammability characteristics of epoxy resin [
32]. The results of LOI and UL-94 vertical burning tests are presented in
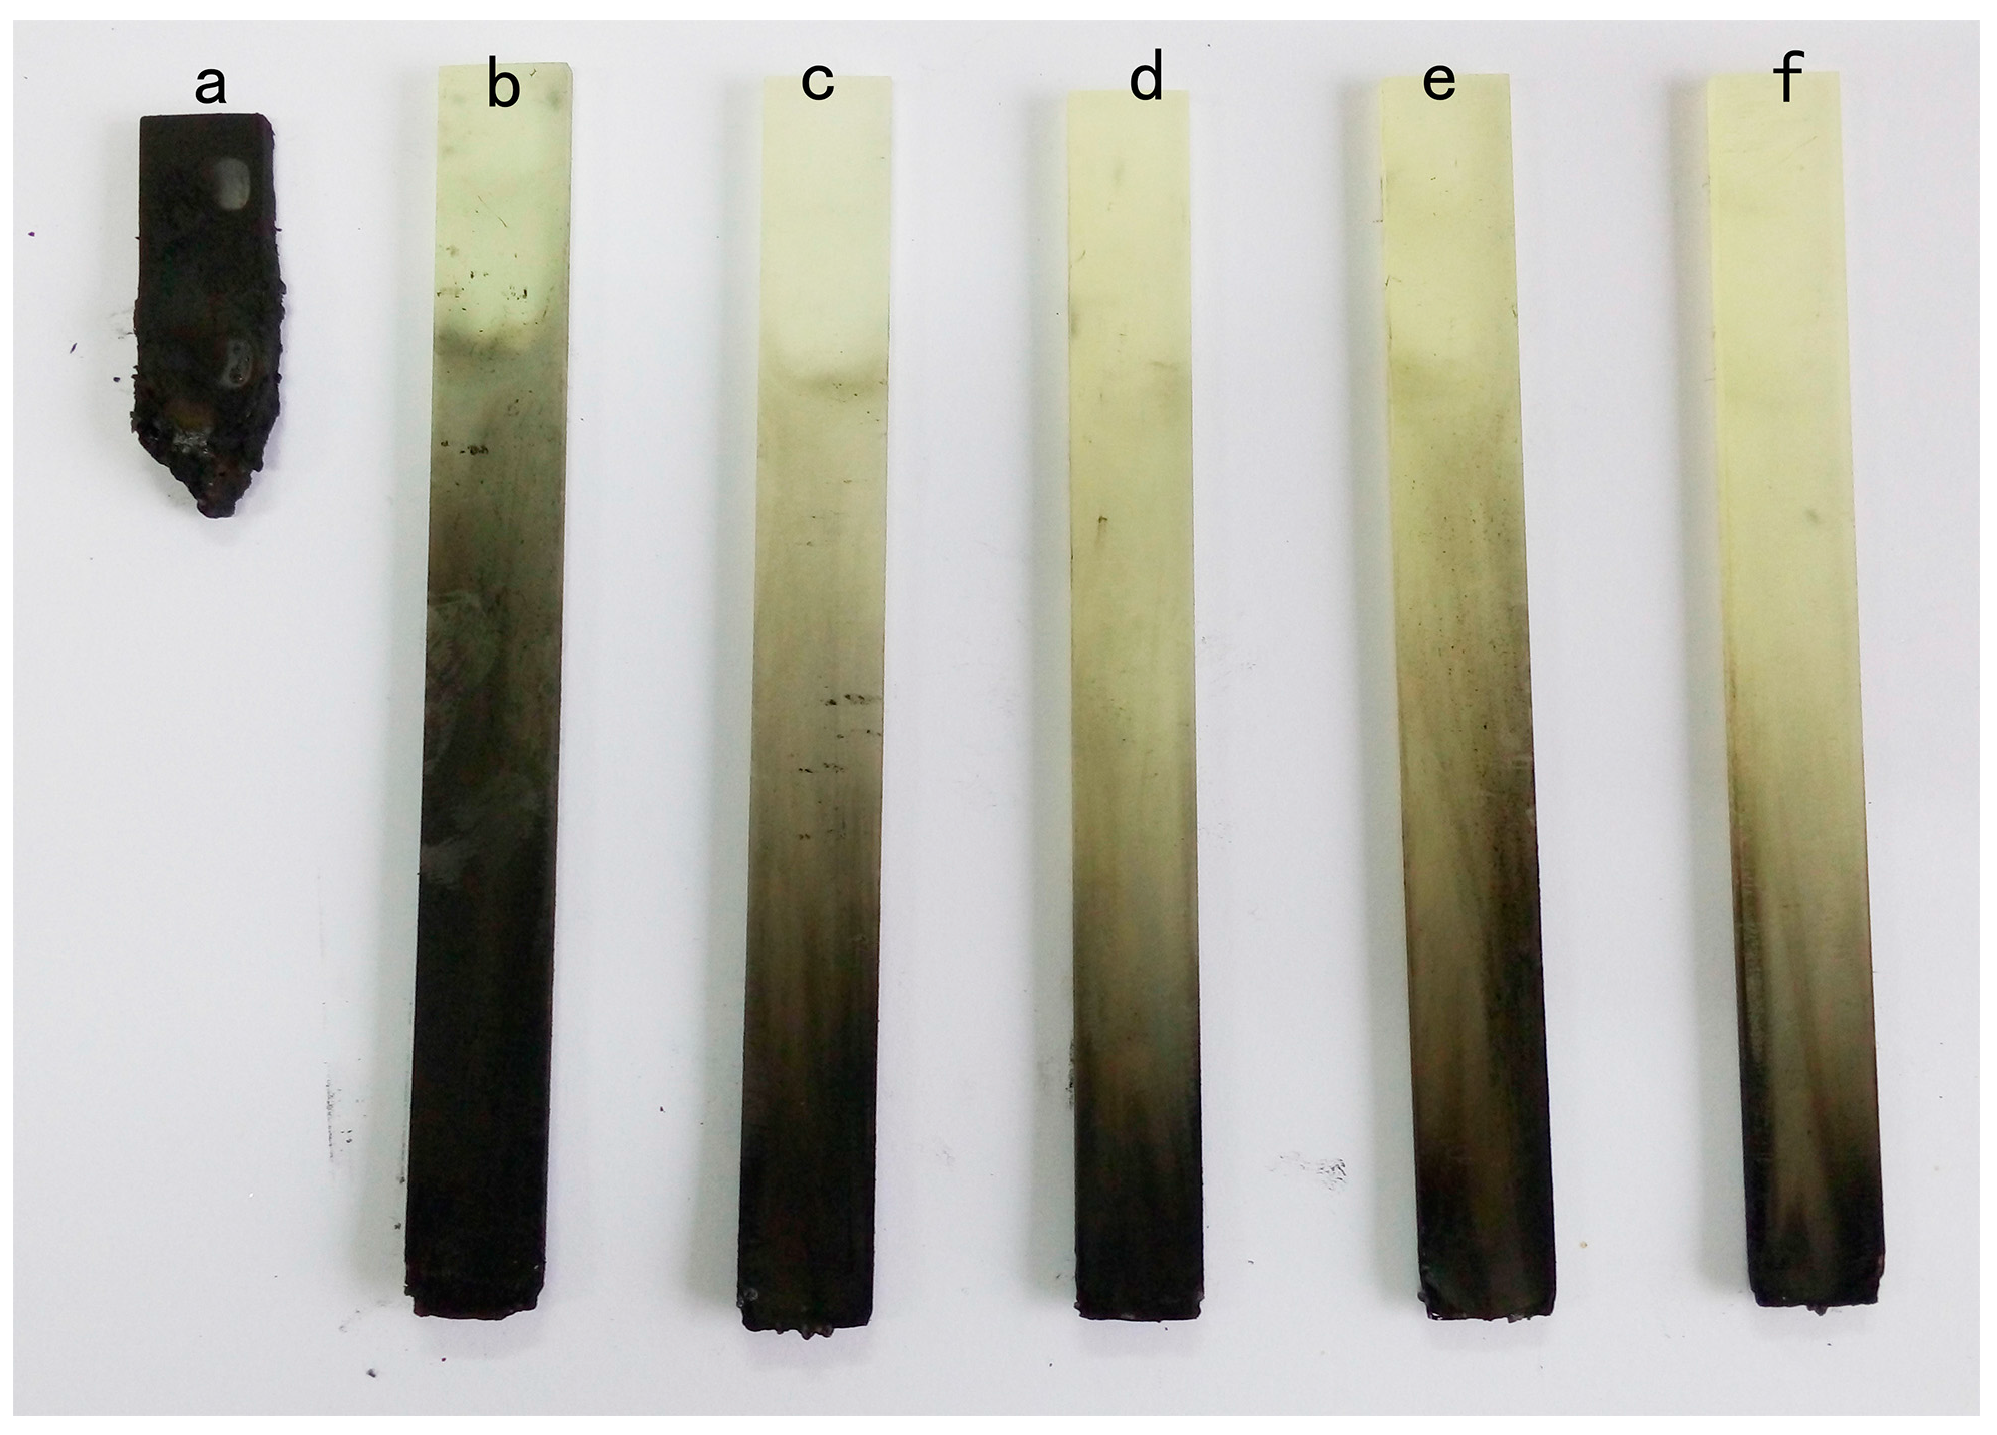
Table 1. LOI increases gradually with a rise in HB-DPPA content, and reaches a high value of 29.3% for EP-2. At the same time, it is observed that severe combustion is followed by a quick diffusion of flame and intense burning drips from EP-0 owing to the high combustible nature of DGEBA/DDM. Interestingly, during the UL-94 vertical burning tests, the burning behavior of the cured epoxy changes greatly after the introduction of HB-DPPA, even a tiny amount. The dripping phenomenon is not observed anymore and the burning time decreases sharply. As shown from the digital photos (
Figure 2), the cured epoxy resins with HB-DPPA have almost the same shape and dimension before and after UL-94 test. In regard to the fire safety requirement, 2.0 wt % of HB-DPPA (the corresponding phosphorus content of the system is 0.18 wt %) is needed to aid DGEBA/DDM for achieving the UL-94 V-0 rating. As for EP-2 and EP-2.5, a char layer is generated rapidly after ignition, which is then intumesced by the emission of gaseous products that consequently form airflow inside out as the result of pressurization. Eventually, the flame extinguishes right after the igniter is removed, and the smoke is completely blown out from the specimen. To the best of our knowledge, such low phosphorus content is hardly seen in this field, particularly for DGEBA/DDM system. Therefore, it is known that the usage of HB-DPPA provides DGEBA/DDM with super effective flame retardancy.
A cone calorimeter is an effective tool to evaluate the forced combustion behavior of polymer materials [
31,
33]. The main combustion parameters of EP-0 and EP-2 offered by cone calorimeter measurements are shown in
Table 2.
Clearly, the TTI value increases from 54 s of EP-0 to 65 s of EP-2, implying that the accumulation rate of the combustible volatiles on the surface of the flame-retarded material decreases; thus a longer time is needed to reach the critical concentration for ignition. Compared with EP-0, the peak HRR, mean HRR, and THR values of EP-2 decrease by 9.1%, 8.7%, and 13.4%, respectively, while the residual weight significantly increases by 80%. The HB-DPPA molecule contains both P–C and P=O bonds that might cleave in advance and subsequently forms pyrophosphate or polyphosphate substances, being able to promote the dehydration of the polymer matrix and the formation of a char layer [
32]. The reduction in mean HRR and mean MLR indicates that the flame retardation slows down combustion of the polymer matrix. In correlation with the drastic increases of residual weight, the stable char layer is proven to be formed during the combustion, which protects the underlying material from heat exchange and gas release. Therefore, it can be preliminarily concluded that HB-DPPA exerts a flame retardancy effect on the condensed phase.
2.4. Thermal Analysis
The glass transition temperature (T
g) of cured epoxy was evaluated from DSC thermograms in
Figure 3. A slight decrement on T
g emerges following the flame retardation, in which the value decreases from 162.2 °C of EP-0 to 157.4 °C of EP-2. The result is caused by the reduction of crosslink density of the thermoset that bears the bulky rigid aromatic group of the HB-DPPA molecule [
23,
26].
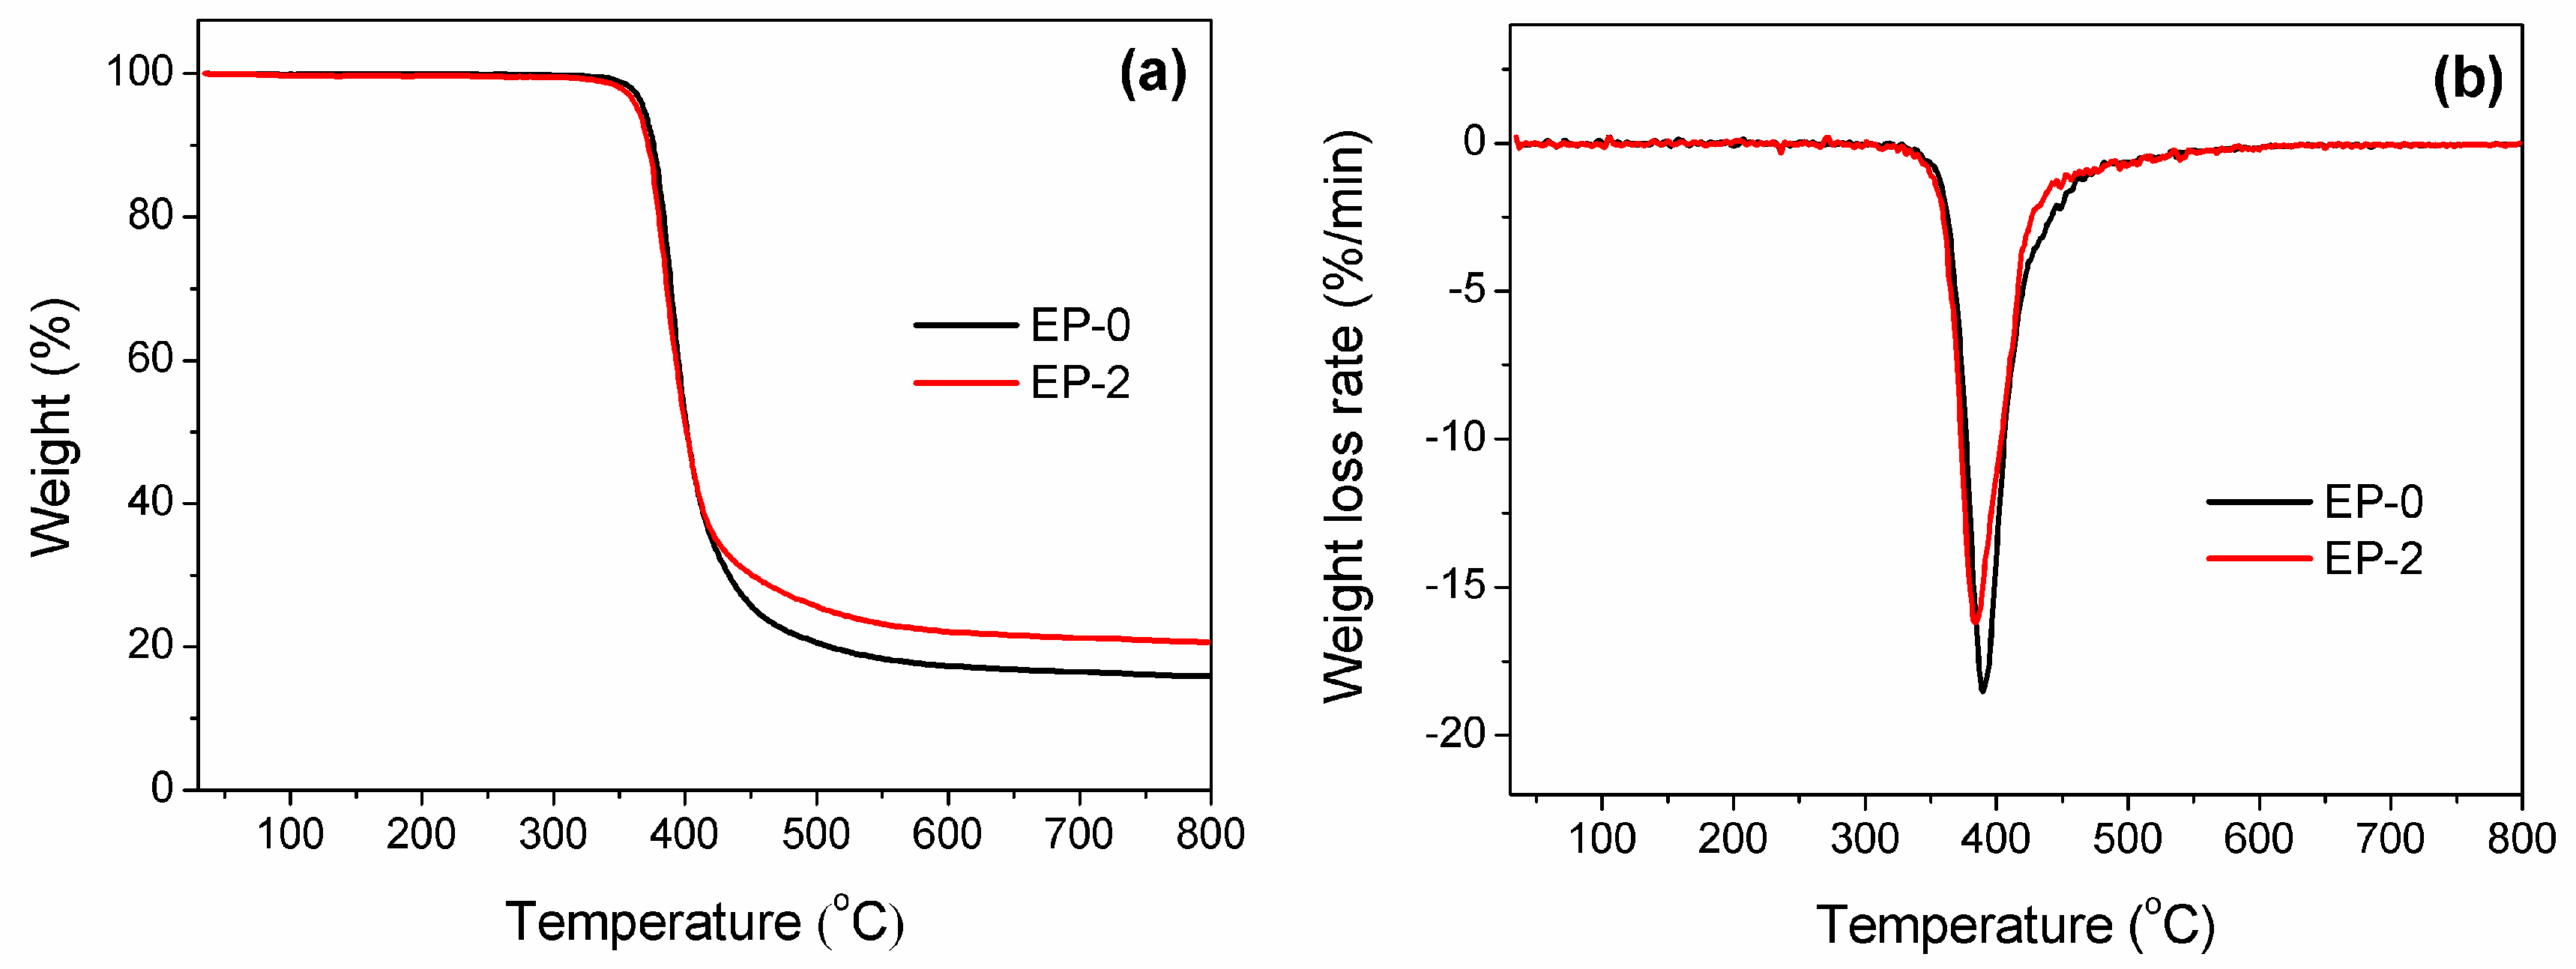
To investigate the impact of HB-DPPA on the thermal stability and decomposition of DGEBA/DDM, Thermogravimetric analysis (TGA) was carried out at a constant heating rate of 10 °C/min under a nitrogen atmosphere. According to the results shown in
Figure 4 and
Table 3, it is known that both cured epoxies possess single-step decomposition from the cleavage of ether linkage and alkyl chain [
34], though the T
5% and T
max of EP-2 are slightly lower than those of EP-0 due to the presence of phosphorus-containing groups that decompose at a relatively lower temperature [
35].
In fact, the thermal stability of epoxy thermoset mostly decreases after the flame-retarded modification by organophosphorus compounds. The introduction of DOPO derivatives drops T
5% by 25–30 °C for the flame-retardant DGEBA/DDM [
36,
37]. As in our previous study using DPPA, the reduction of T
5% is adequately suppressed but still over 10 °C [
26]. In addition to the superior efficiency in the flame-retardant aspect, where a smaller amount of HB-DPPA is needed for passing UL-94 test, the inclusion of an aromatic benzene ring in the HB-DPPA molecule provides a more rigid structure to the polymer network. As a result, the thermal stability of the flame-retardant epoxy maintains a high level, in which the value of T
5% only decreases by 4.6 °C. This feature makes the flame-retardant epoxy suitable for the high-temperature soldering process of printed circuit boards (PCBs), which commonly ranges from 350 °C to 380 °C. It is noteworthy that the decrement in mass loss rate signifies a deceleration of the combustible volatiles emission, which agrees with the extension of TTI in the cone calorimeter test.
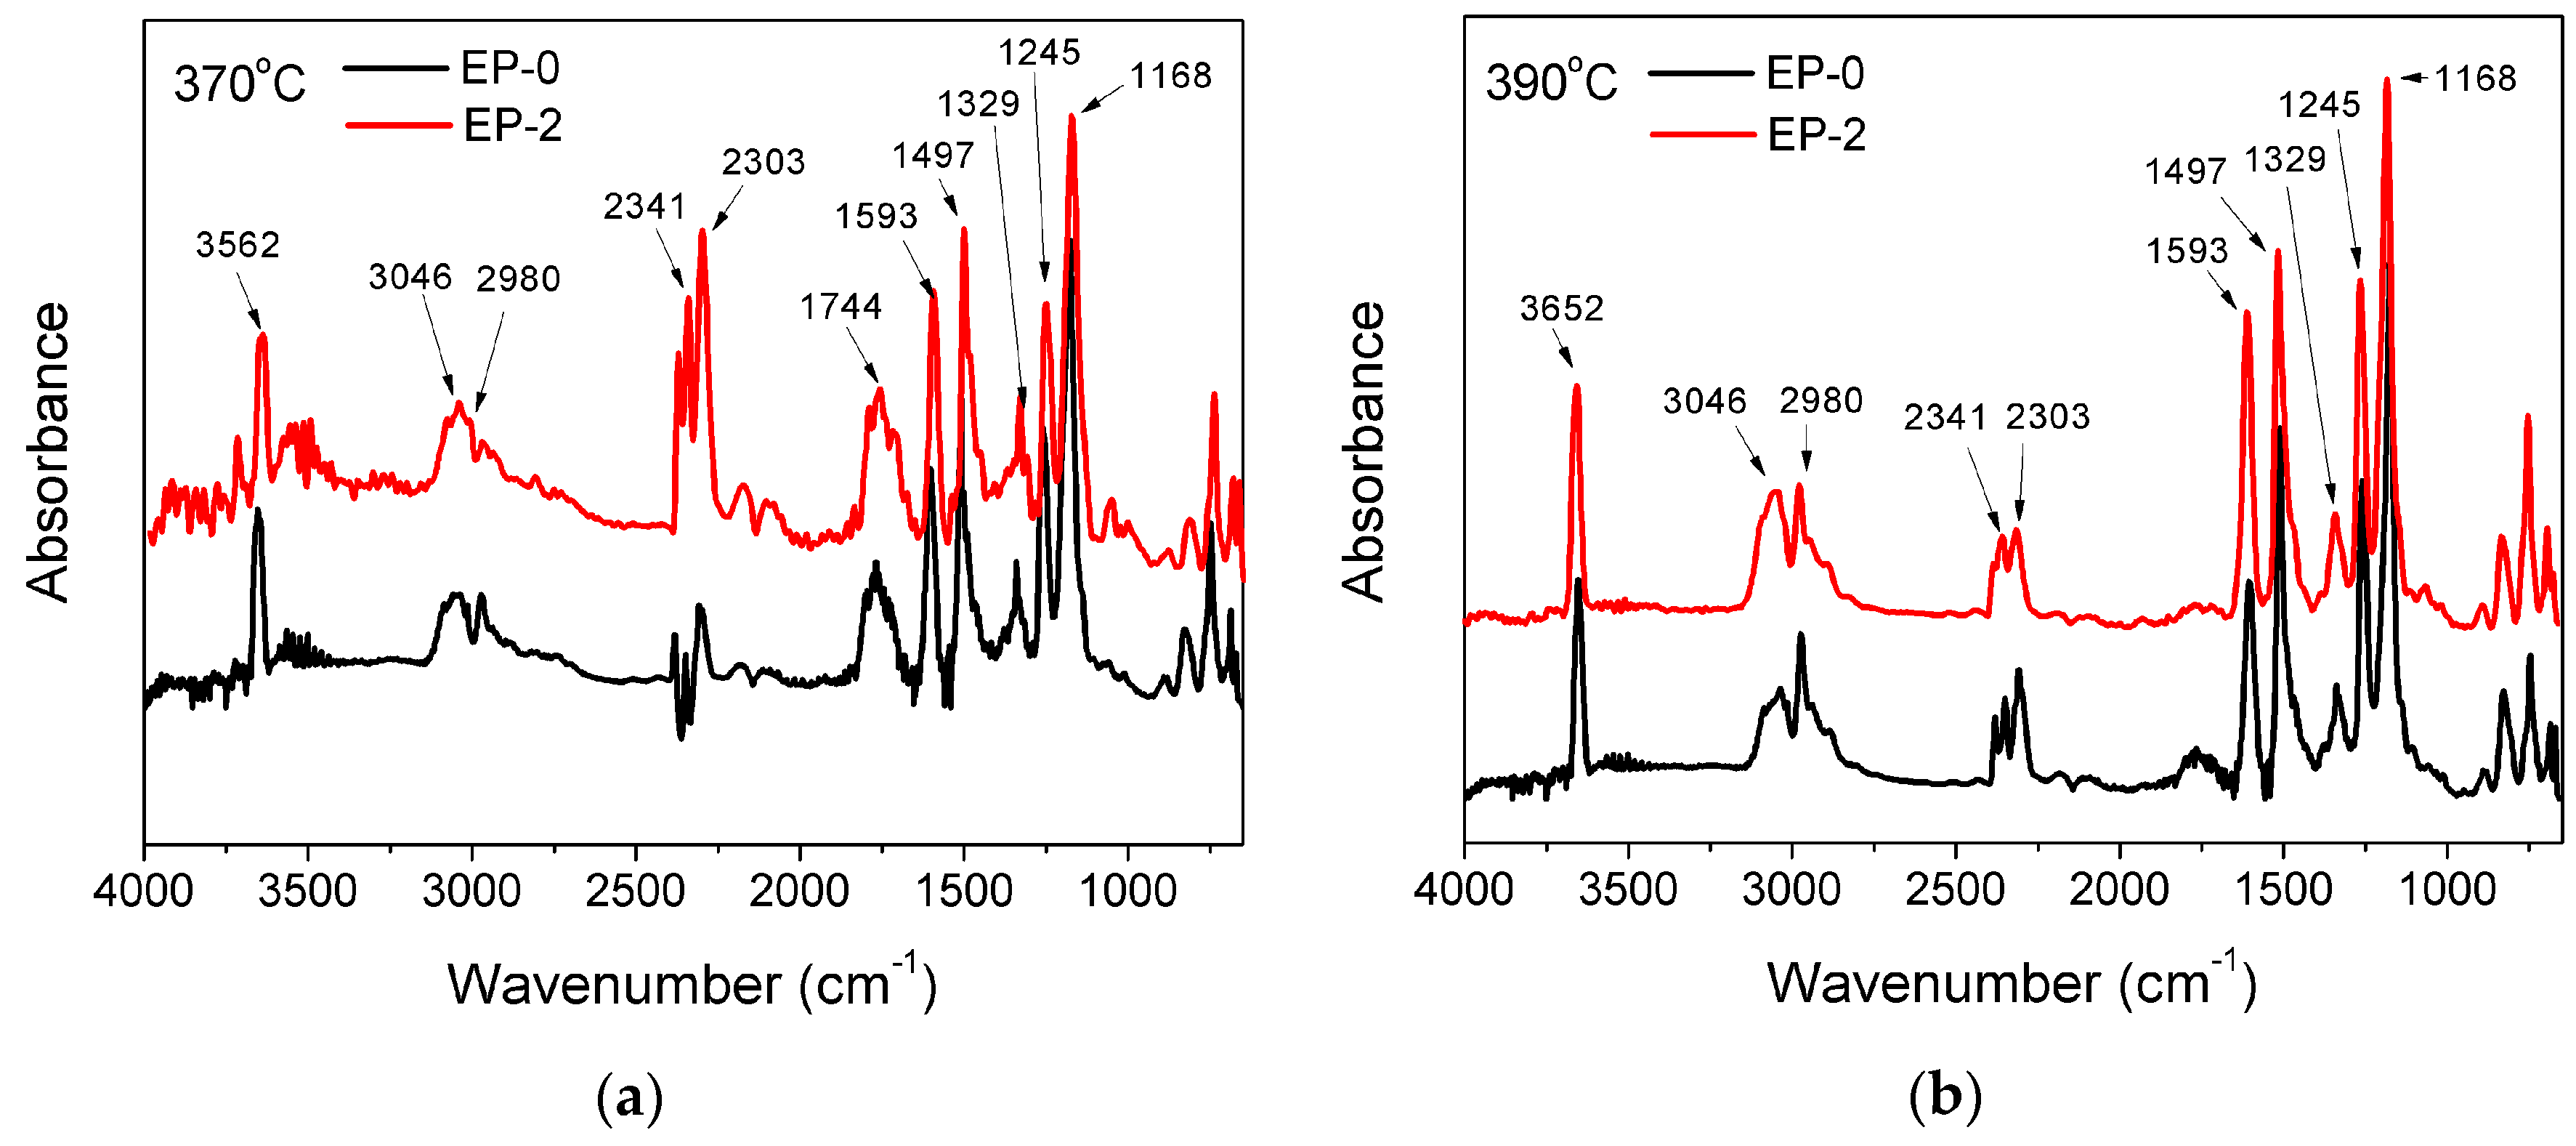
The gaseous product from the thermal degradation of cured epoxy was characterized using the TGA–FTIR method. Based on the TGA result, EP-0 and EP-2 both exhibit singular decomposition process. Accordingly, the FTIR spectra at the initial and maximum degradation temperatures (corresponding to 370 and 390 °C, respectively) are illustrated in
Figure 5. The major decomposition products of DGEBA/DDM are observed from the following peaks on the EP-0 spectrum: 3500–3800 cm
−1 (phenol derivatives, water, or amine compounds), 1593, 1515, 1497, and 1329 cm
−1 (aromatic compounds), 3046 and 2980 cm
−1 (aliphatic hydrocarbons), 1744, 1245, and 1168 cm
−1 (ester and ether compounds), 2341 and 2303 cm
−1 (CO
2), and 2187 and 2116 cm
−1 (CO) [
38,
39]. Epoxy thermoset flame-retarded by phosphorus-containing compounds commonly generates phosphorus-containing volatiles at high temperature, which can be distinctly analyzed from the TGA–FTIR spectrum. Intriguingly, the spectra of EP-2 are extremely similar to those of EP-0, in which almost no additional peak is detected at both temperatures despite the introduction of HB-DPPA. It indicates that unlike the common organophosphorus compounds, such as DOPO and its derivatives, HB-DPPA chemically bonded to epoxy does not experience further decomposition to generate volatilizable phosphorus-containing species, which might be caused by the greater stability of the phosphorus element attached with two benzene rings. The result suggests that HB-DPPA mainly exerts its flame-retardant effect through improvement of the condensed phase, while the impact on the gaseous phase seems to be insignificant.
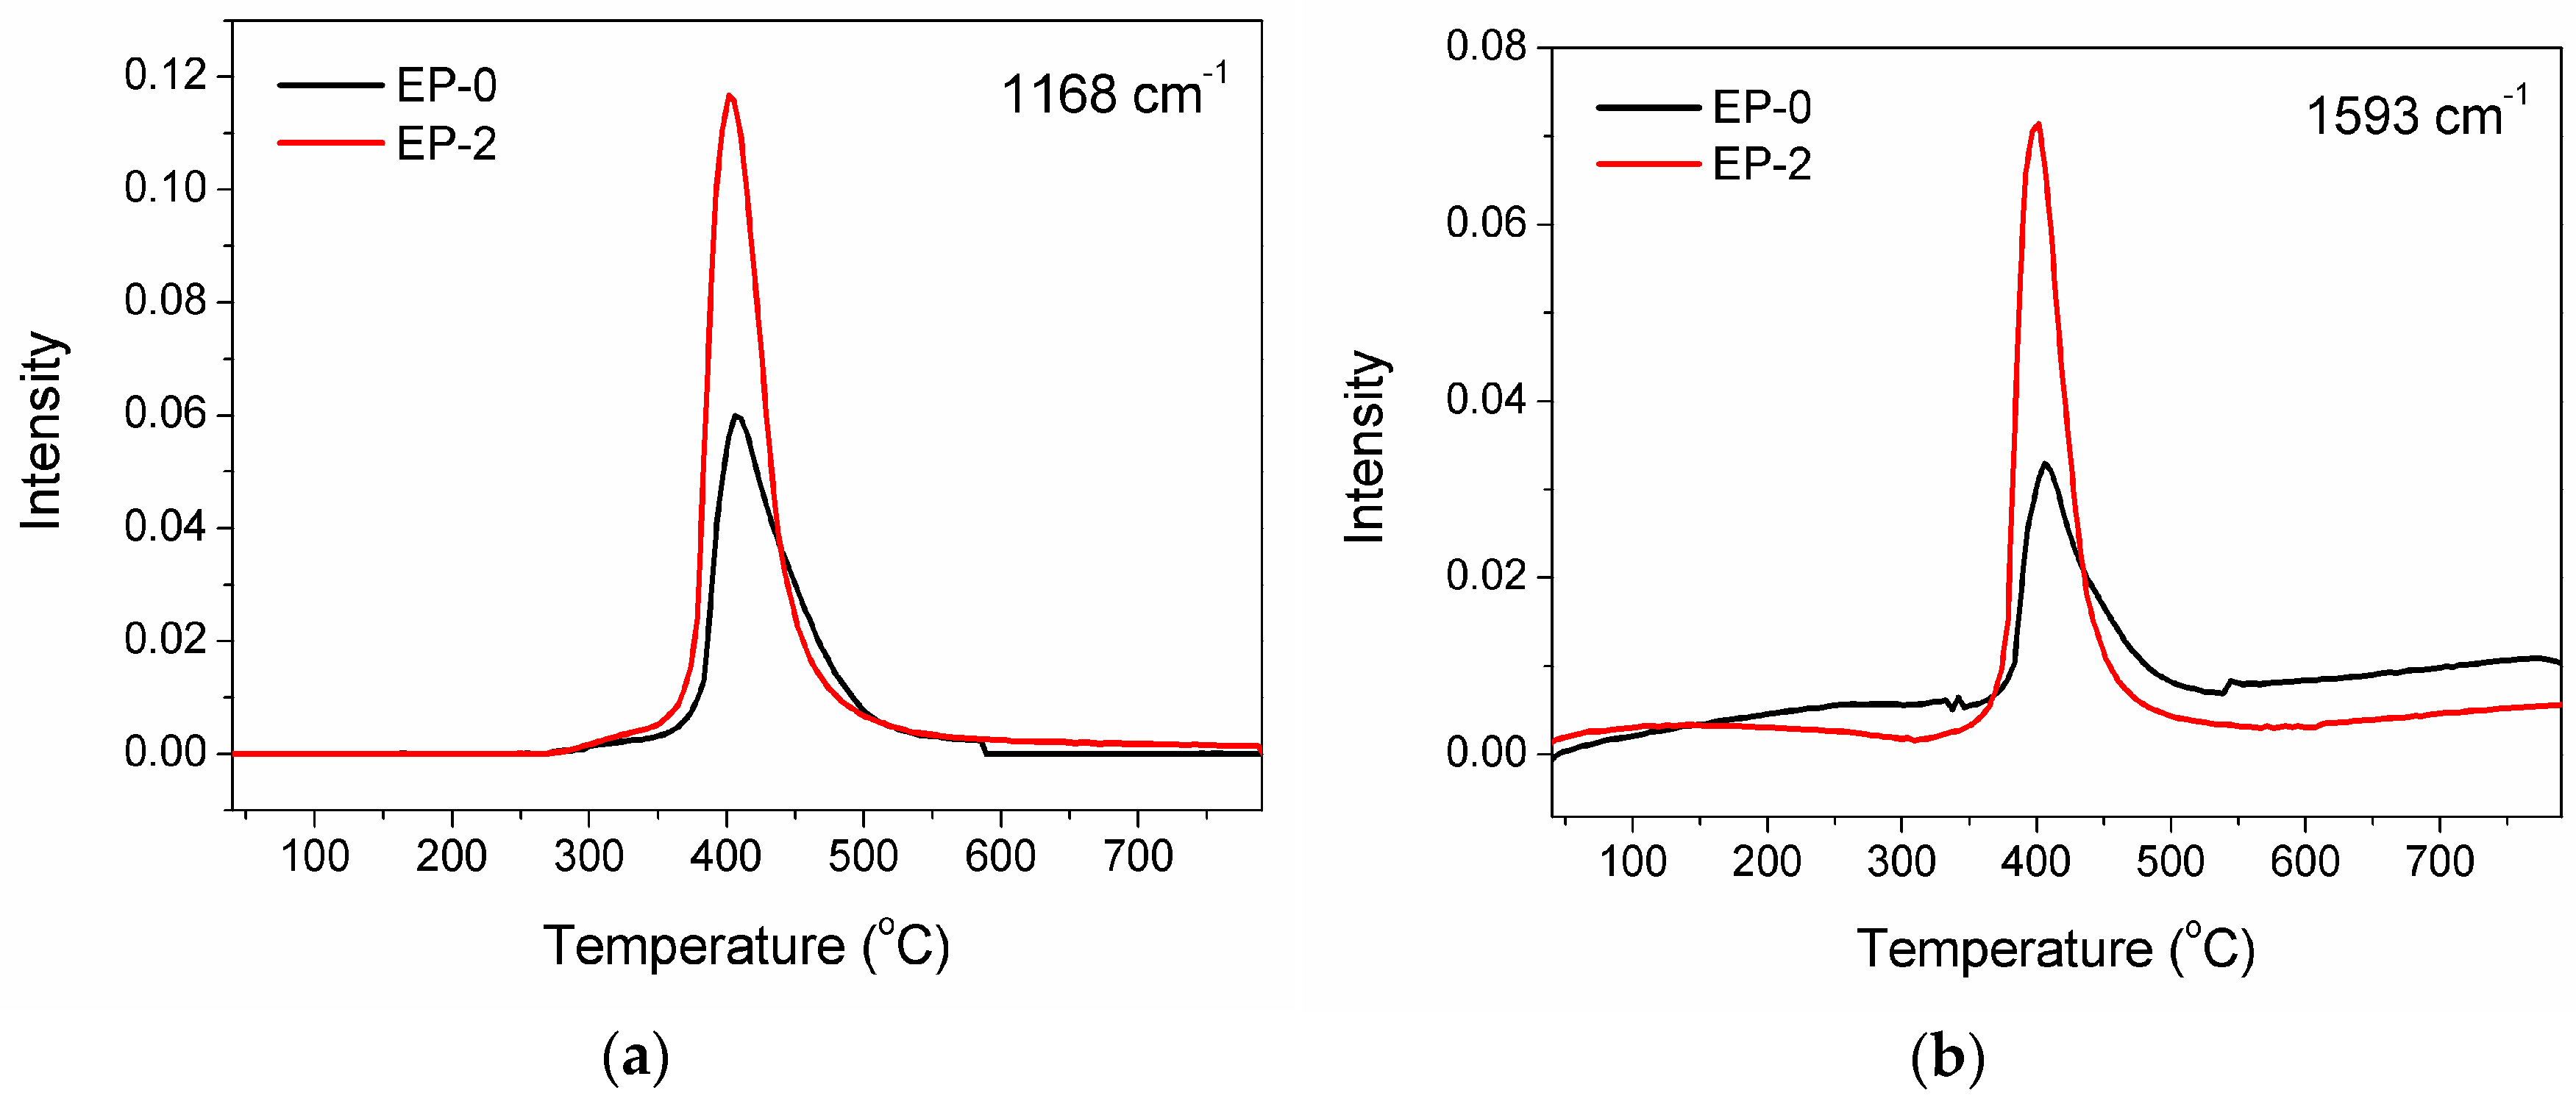
However, there exists an alteration in the absorbance intensity of pyrolysis products. Two main degradation products of DGEBA/DDM, ether and aromatic compounds (the corresponding characteristic peaks appear at 1168 and 1593 cm
−1, respectively), are selected to be studied further, and the quantitative results of absorbance intensity are shown in
Figure 6. For the equal sample weight, the detected signals for EP-2 are much stronger than those for EP-0. The result signifies the stimulating degradation effect of the phosphorus-containing moiety in HB-DPPA, which promotes decomposition and causes excessive emission of volatile substances as the gas source to induce the blowing-out effect.
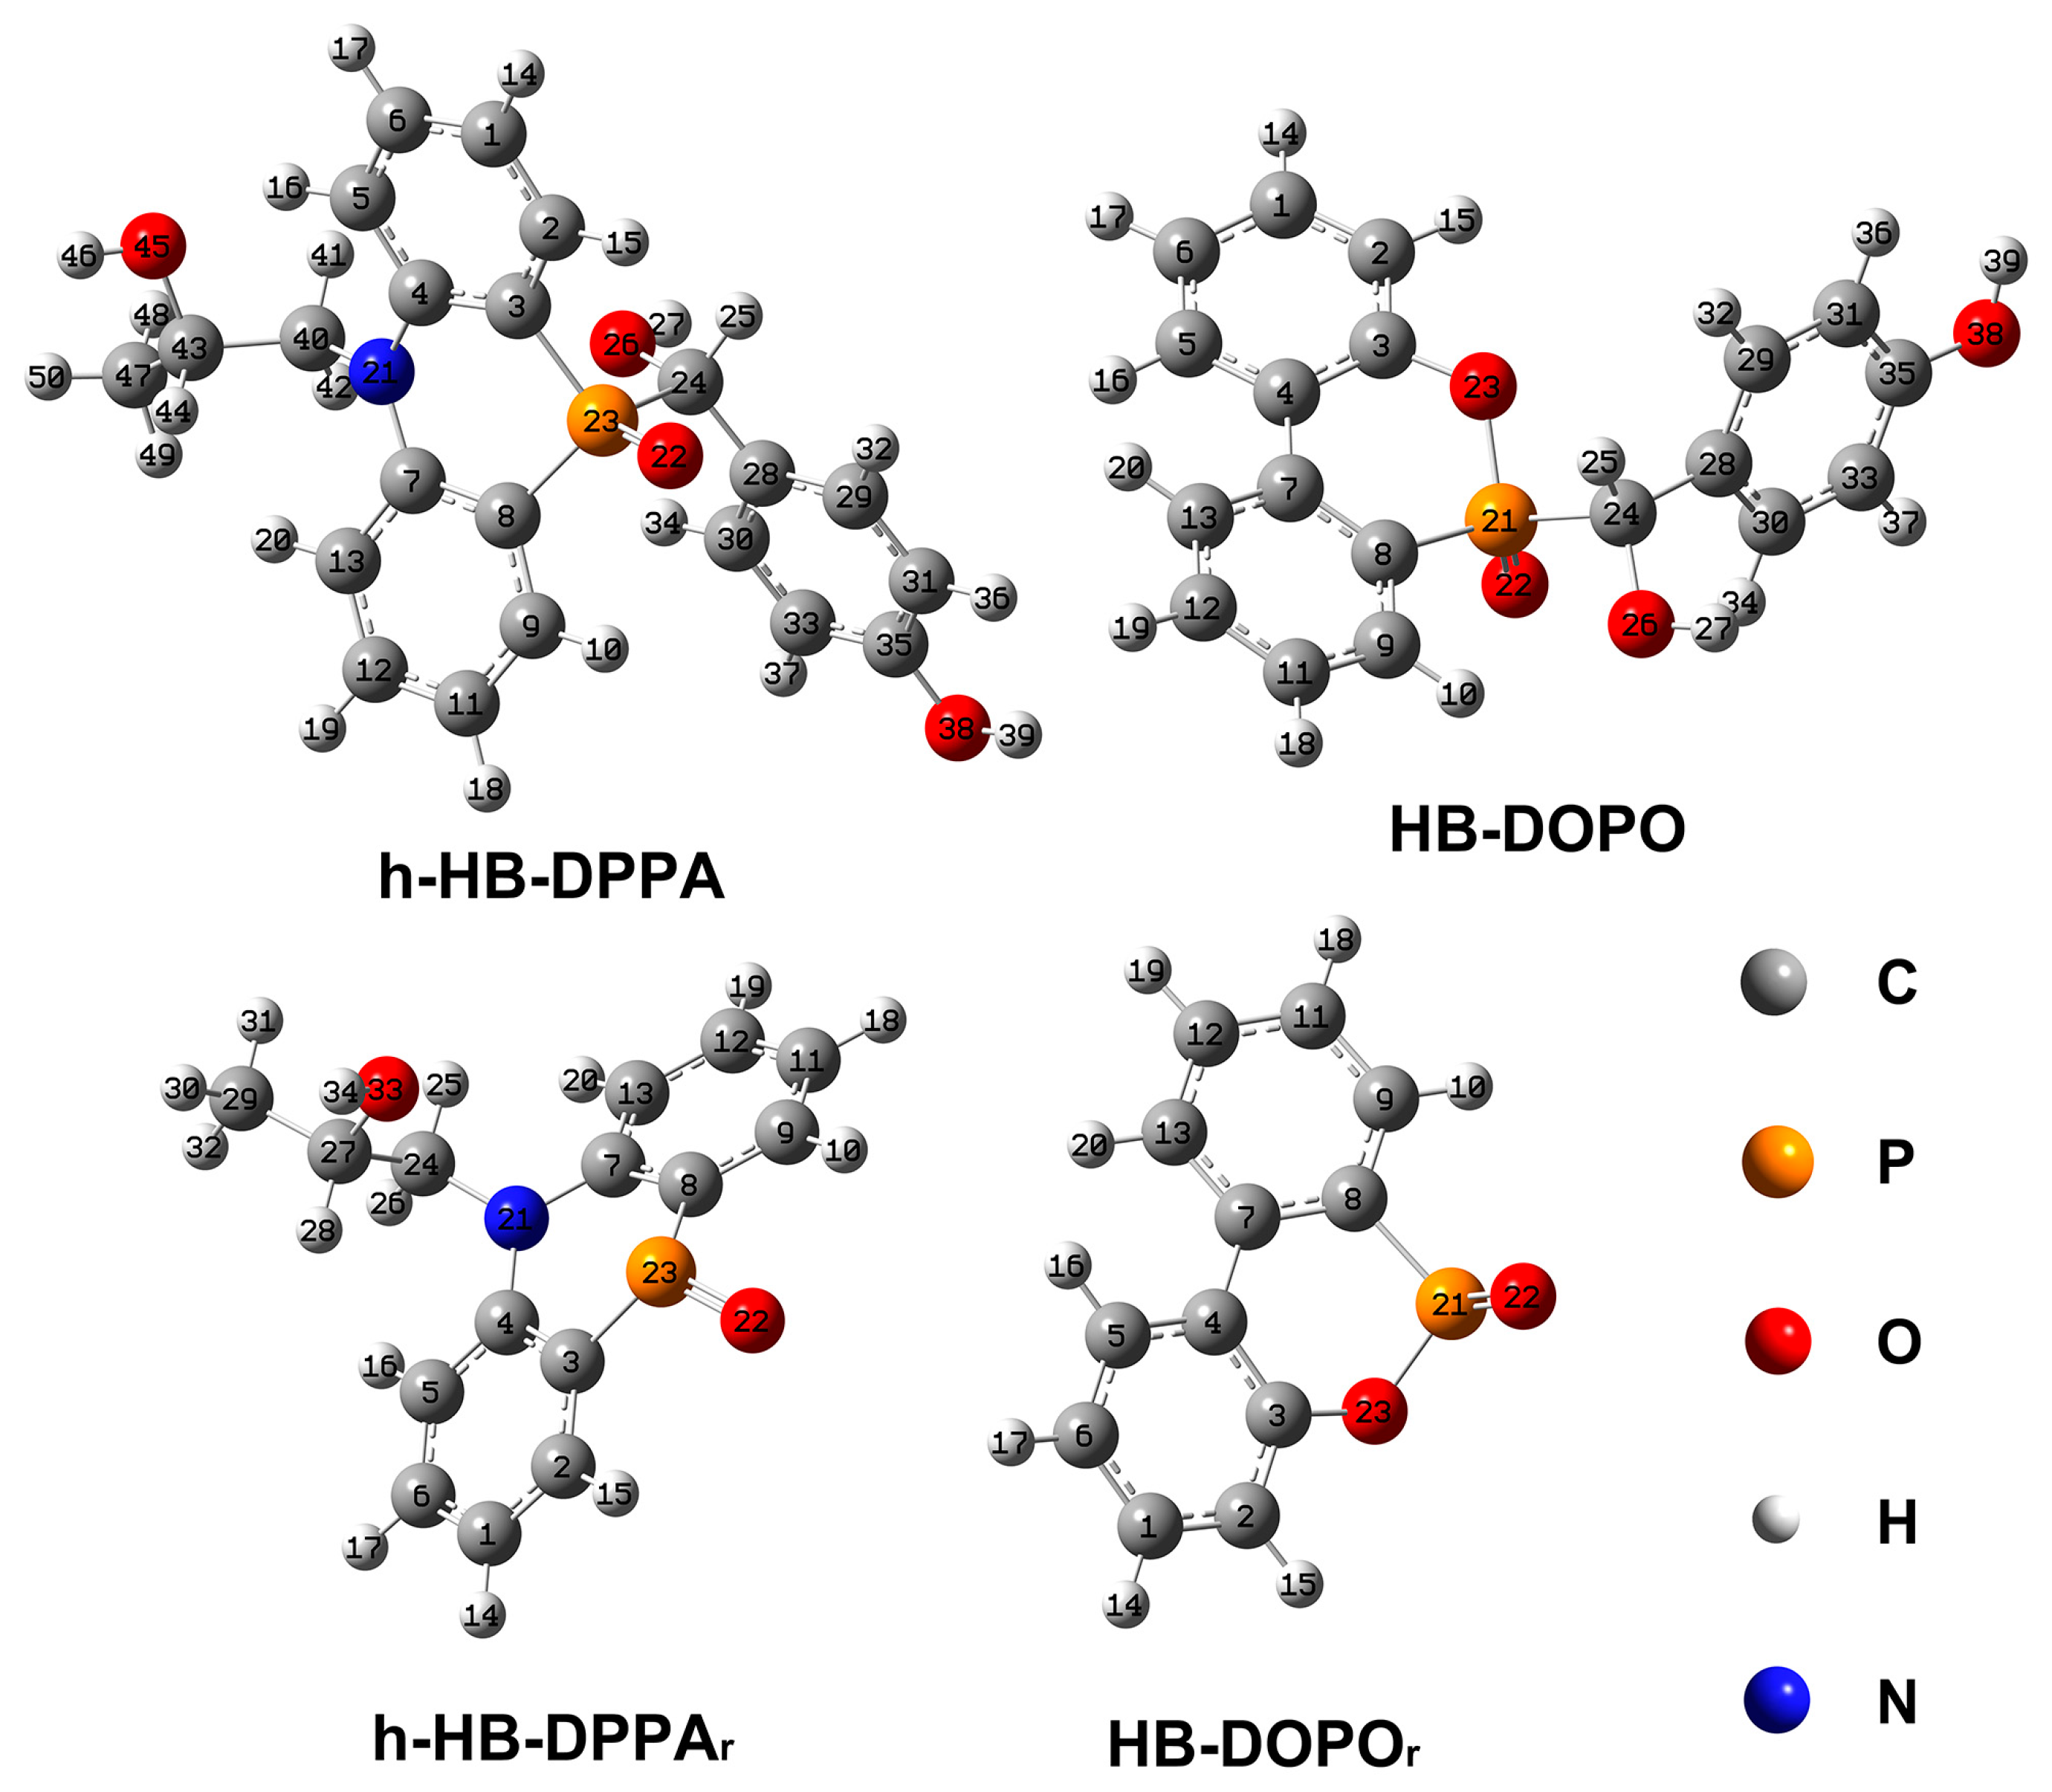
To clarify the higher stability of the phosphorus-containing group in HB-DPPA, the molecular structures of the related moieties are calculated by DFT/B3LYP/6-31G(d) level with Gaussian 09 software package (
Figure 7), along with the length of covalent bonds adjacent to the phosphorus atom (
Table 4). There is a general knowledge that the shorter the bond length, the higher the energy needed to dissociate the bond. In this work, bond length is calculated to describe the stability of the chemical bond. For EP-2, N–H in HB-DPPA reacts with the epoxy group in DGEBA. To simplify the calculation, such reaction product moiety adjacent with the nitrogen atom may be replaced with 2-hydroxypropyl, named h-HB-DPPA. For comparison, DOPO reacting with 4-hydroxybenzaldehyde is introduced and named HB-DOPO. It has been verified that the simplified calculation does not affect the bond length result in such a moiety. The result proves that the P–C bond in both structures (P23–C24 in h-HB-DPPA and P21–C24 in HB-DOPO) possesses the largest length, therefore such a P–C bond in the cured epoxy networks might break first at the high temperature producing radicals h-HB-DPPA
r and HB-DOPO
r.
P–C bonds in h-HB-DPPAr (P23–C3 and P23–C8) are shorter than those in HB-DOPOr (P21–C8), and the former possess greater stability that might restrain further decomposition to generate phosphorus-containing species (PO• and PO2•). In fact, cleavage of the covalent bonds may also be influenced by the overall structure of the polymer network. Although further study is needed to show how the complex molecule affects the decomposition process, HB-DPPA might not decompose into the volatilizable phosphorus-containing species, as seen from our experimental results.
2.5. Char Layer
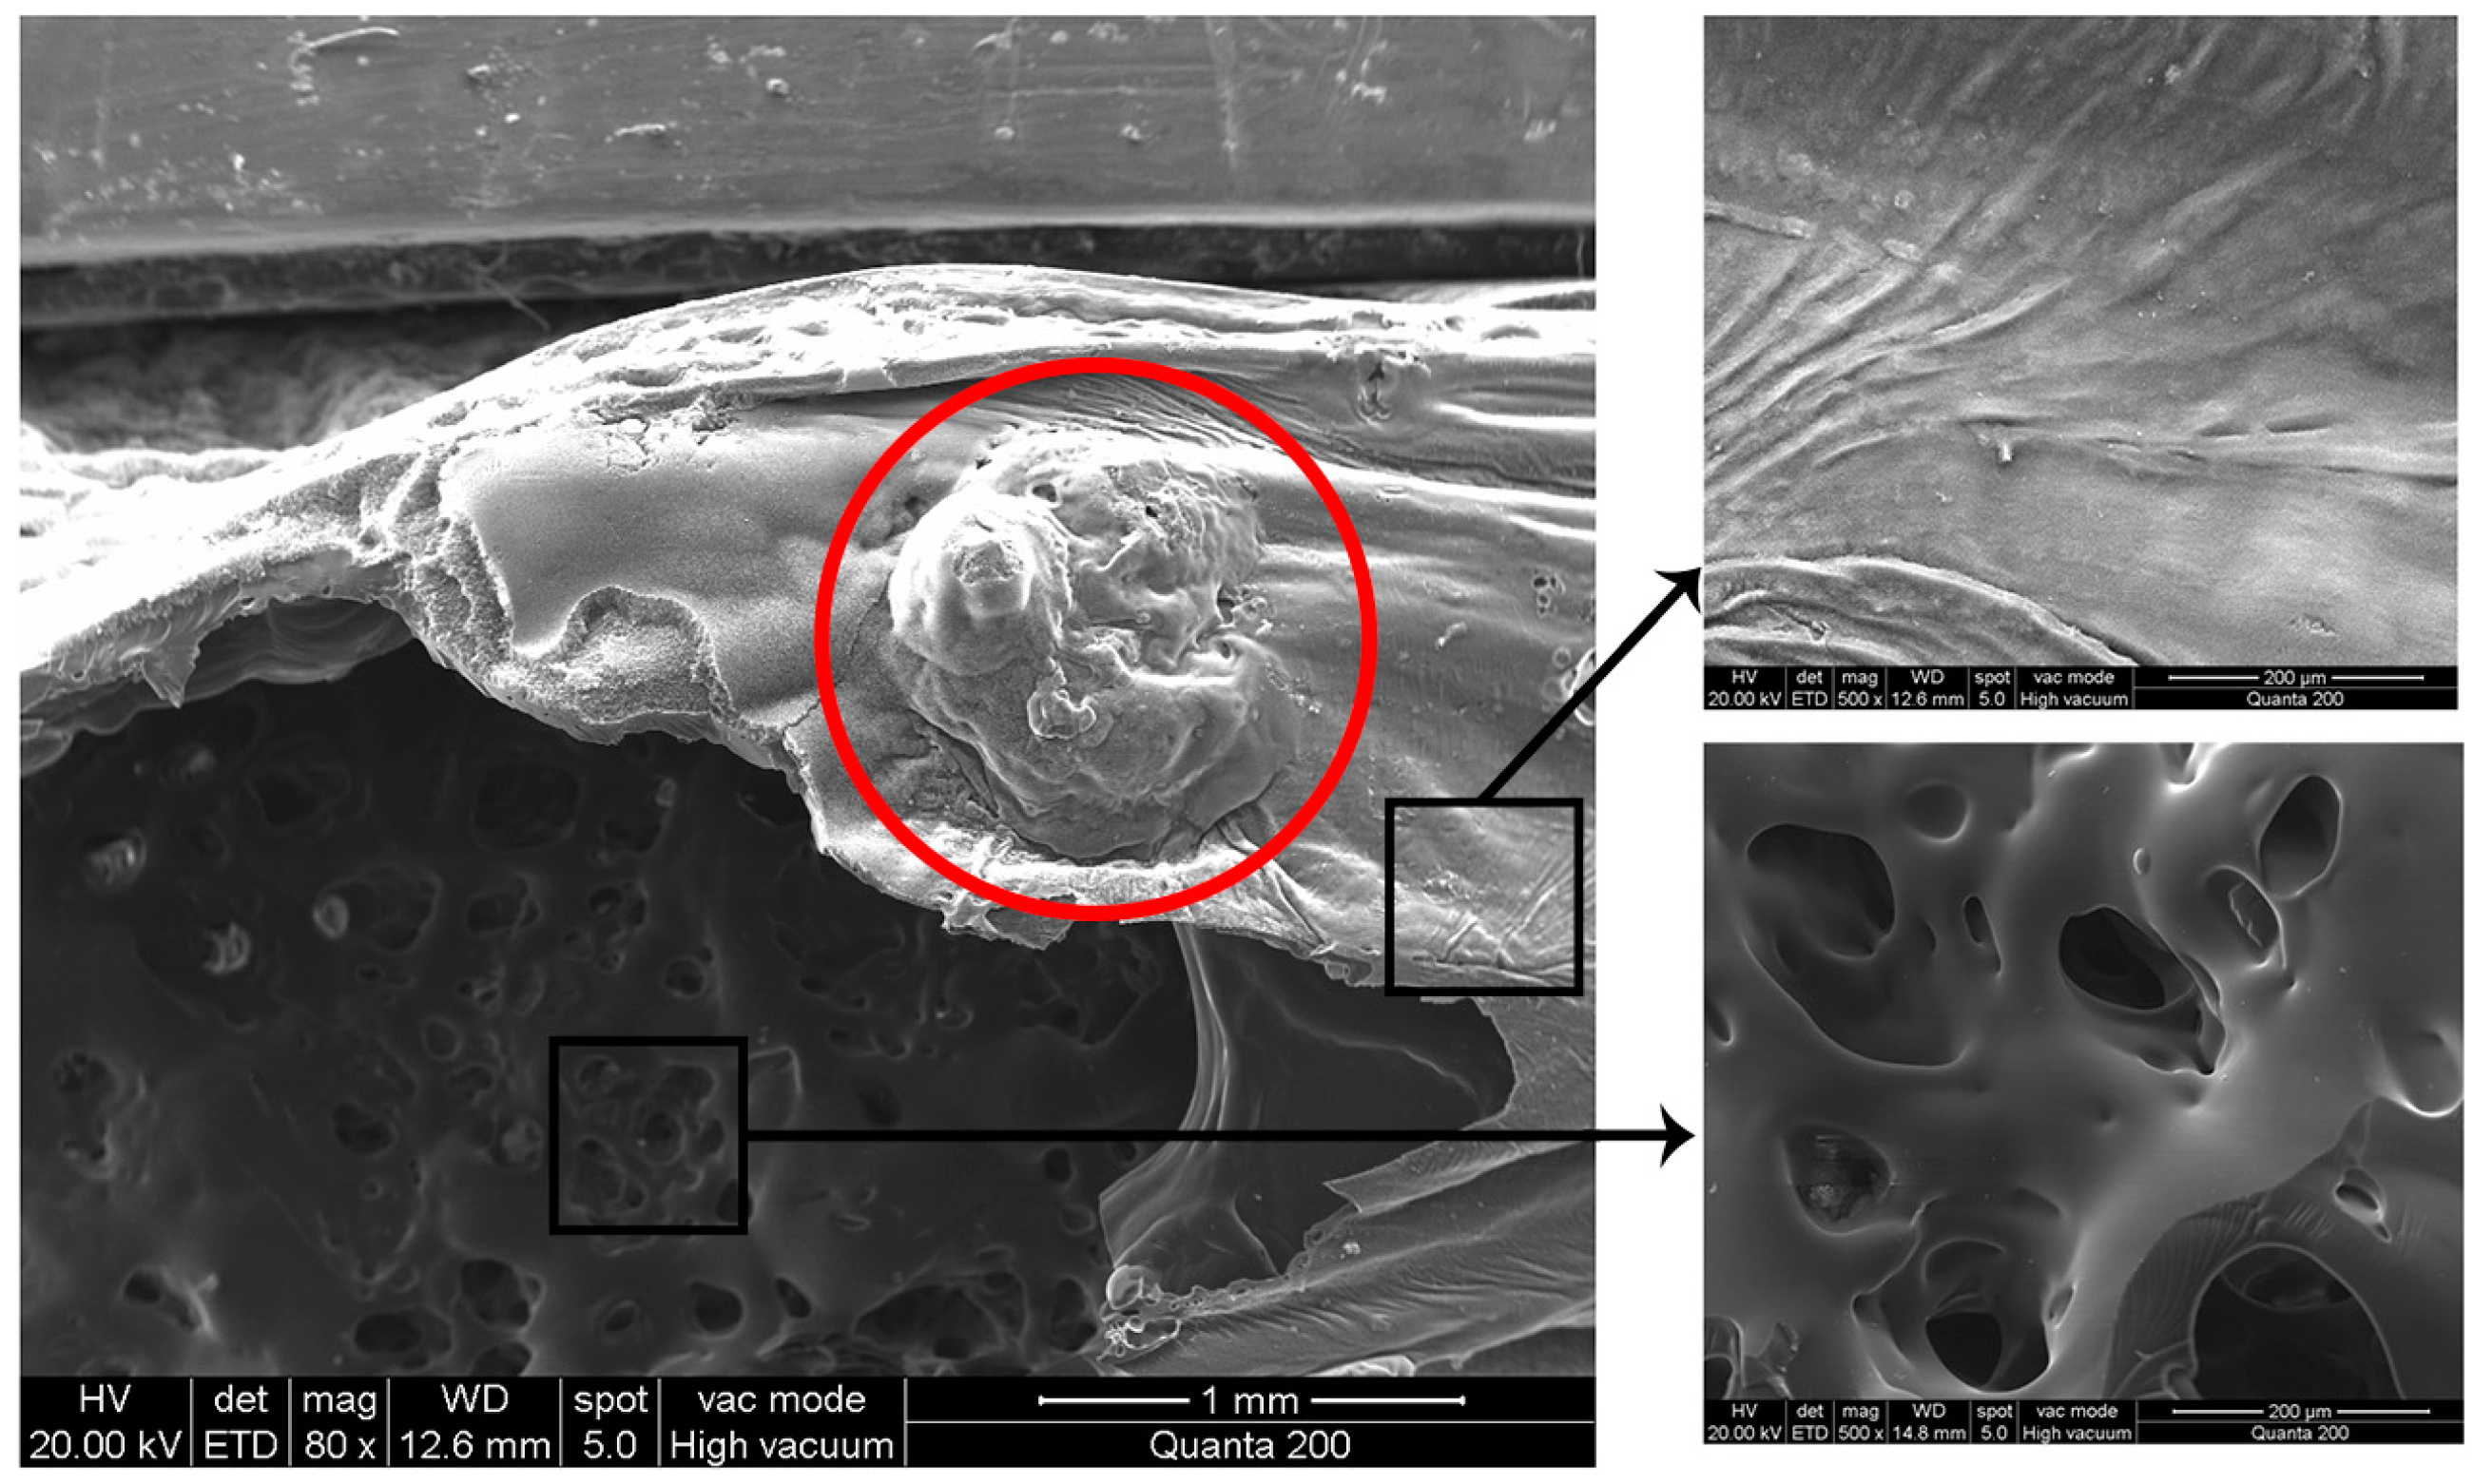
The flame-retardant mechanism of HB-DPPA in the condensed phase can be further studied from the char layer. The morphology of the char residue collected from the EP-2 sample after the vertical burning test is investigated by scanning electron microscopy (SEM) (
Figure 8). It can be clearly seen that the char residue has a compact external surface with a multiporous structure inside. The compact layer acts as a barrier to protect the unburned matrix from the attack of heat and oxygen. A convex expanded layer is observed and marked with a circle. According to the visualization result, the rigid char layer is formed during combustion, while the evolved gases accumulate in the cavity to expand the char layer. Furthermore, due to the increase in the inner gas pressure following the thermal decomposition of the polymer matrix, the char layer is subsequently broken and the gases gush out of the site. The spurted airflow with high rate is able to blow the flame away from the material surface, thus realizing the blowing-out effect.
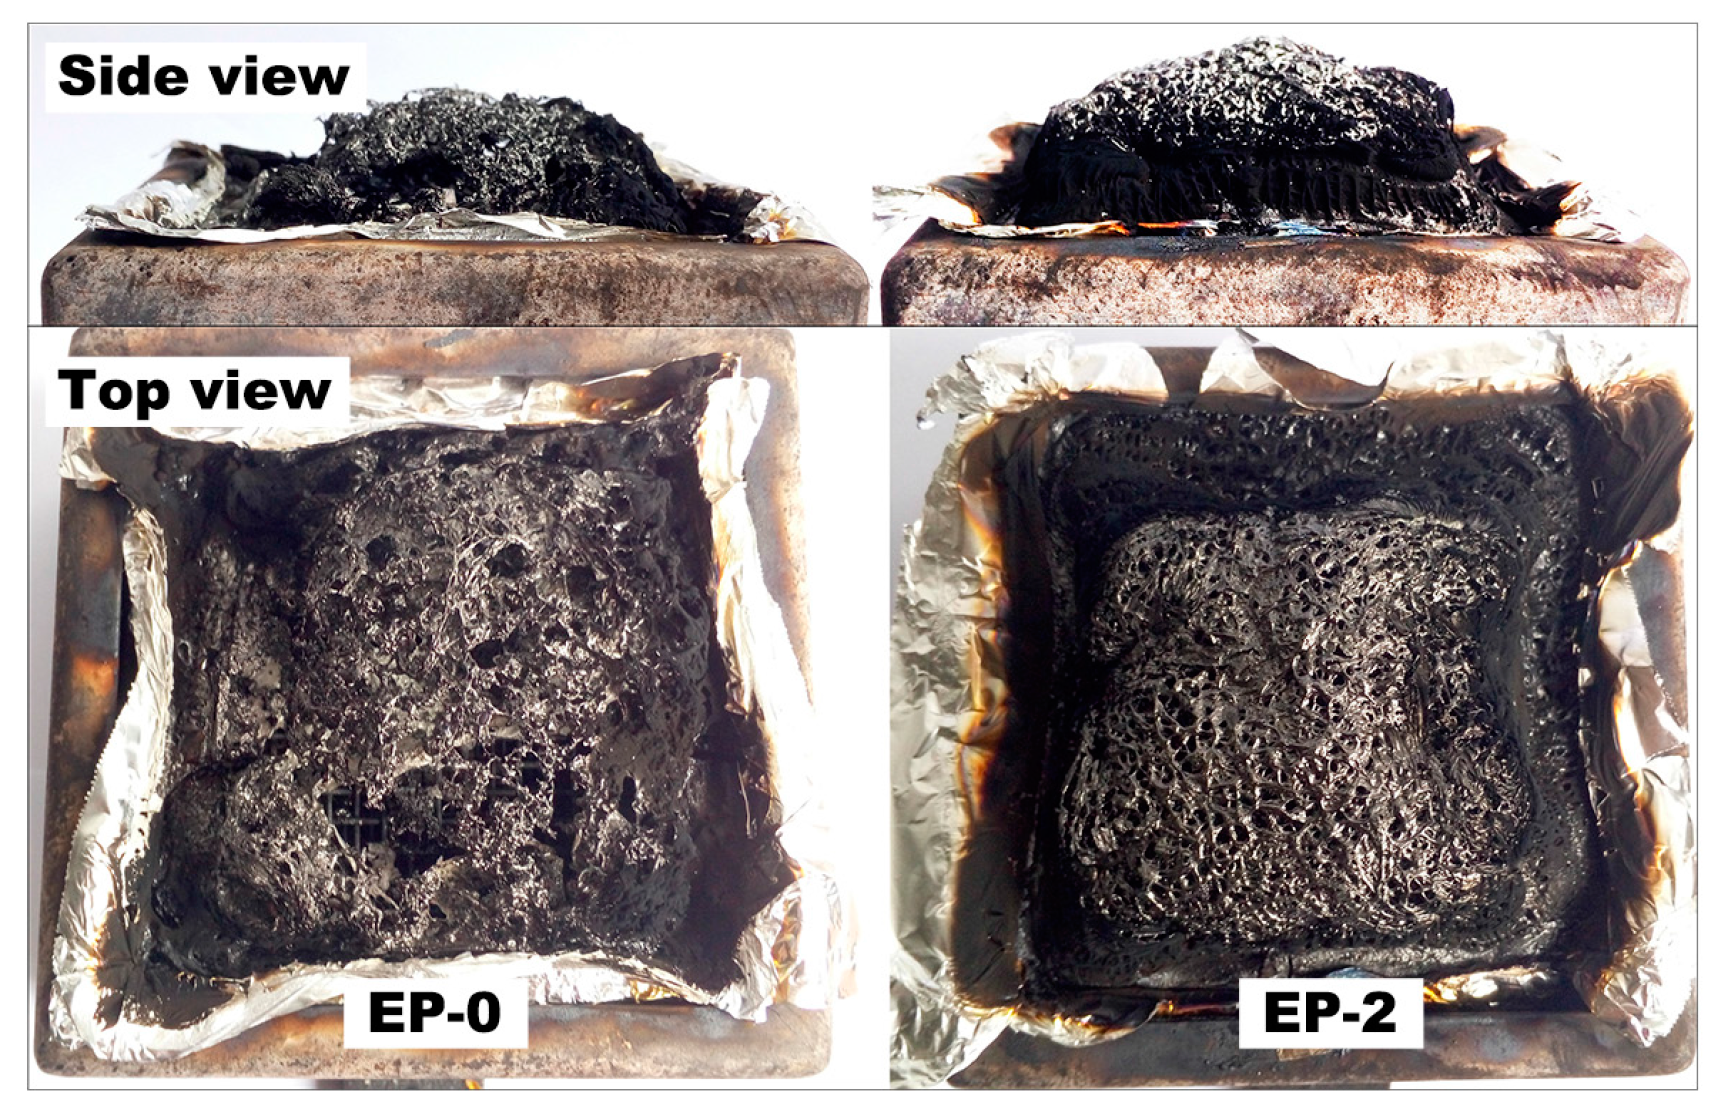
The char layers of EP-0 and EP-2 are also examined after the cone calorimeter test (
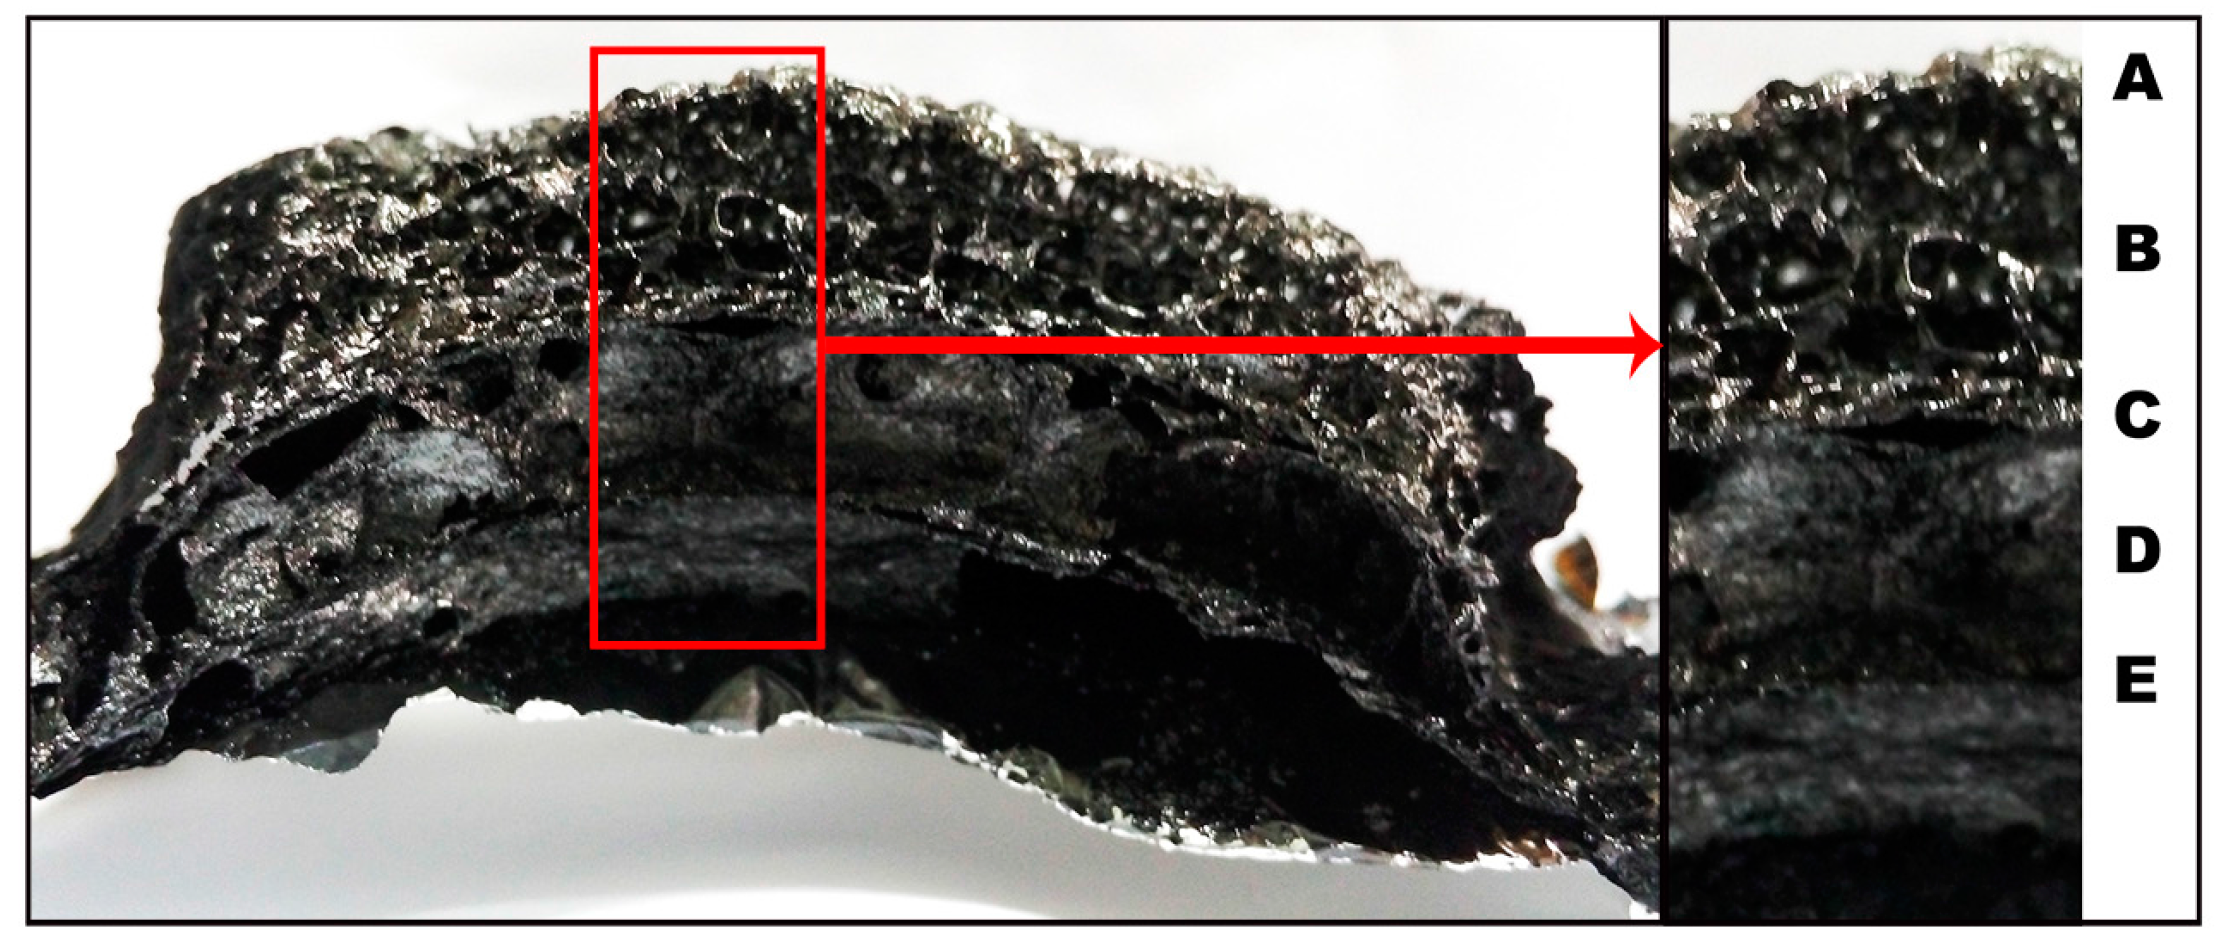
Figure 9). The residual char of EP-0 seems to be quite thin, loose, and fragmentary, with large holes on the top surface. This is indicative of a lack of strength in the char layer formed during combustion, which suffers severe breakage by the heat and gas diffusions. As for EP-2, an expanded bulky char layer with compact and firm top surface is observed. In order to examine the interior characteristics, the char is cleaved vertically in the middle and the side view of the interior part is exhibited in
Figure 10. There exists a unique char structure with five discernible layers, each with different morphologies and features.
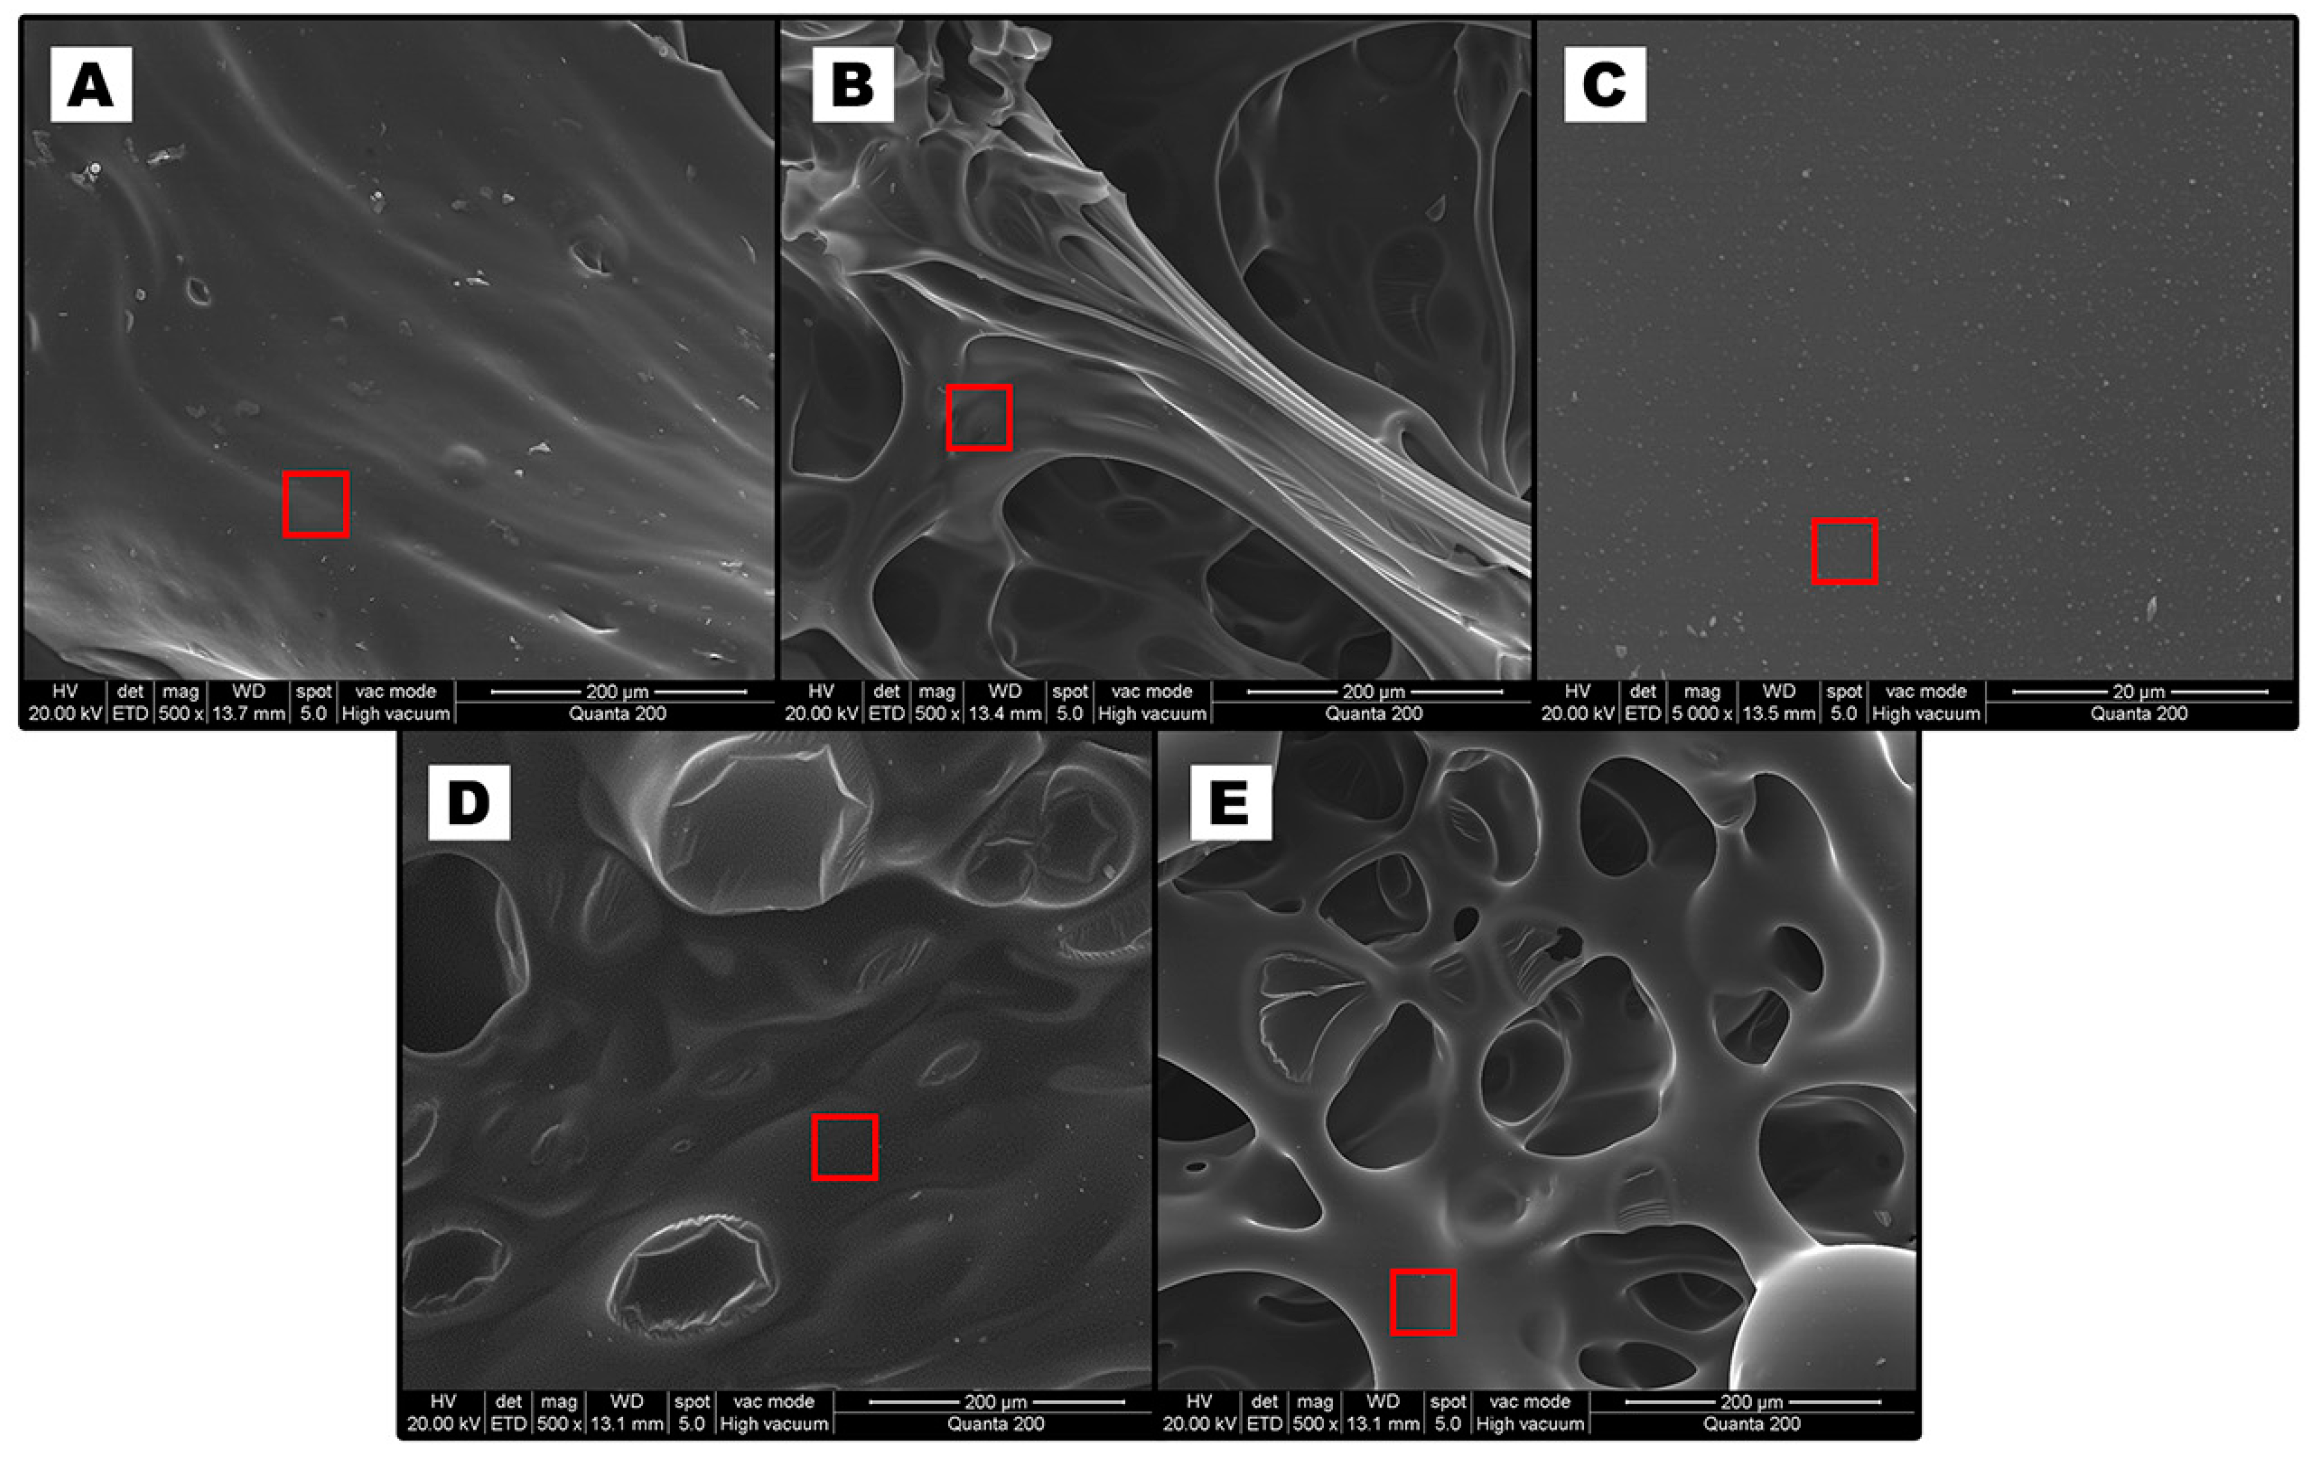
The morphology of the layered char is further analyzed by SEM (
Figure 11) and the elemental composition is obtained from the area indicated by the red square in the figures using energy dispersive spectroscope (EDS) (
Table 5). The layers A and C show continuous and sealed morphology with higher phosphorus content. The layer B demonstrates an open-cavity structure that supports the above layer. Convex spheres are clearly evidenced from layer D, determining the presence of lower pressure gases. The innermost layer E presents multiporous morphology with a smaller size of hole as compared with that in layer B. Moreover, there are only a few phosphorus and nitrogen atoms in the layers exhibiting open-cavity structure (B and E), suggesting that the phosphorus-containing substances mostly migrate upwards and accumulate to form phosphorus-rich carbonaceous layers (corresponding to layers A and C). The scantiness of nitrogen indicates the stimulating degradation effect of the phosphorus-containing substances, which accelerates the decomposition of the thermoset and the generation of outward gases.
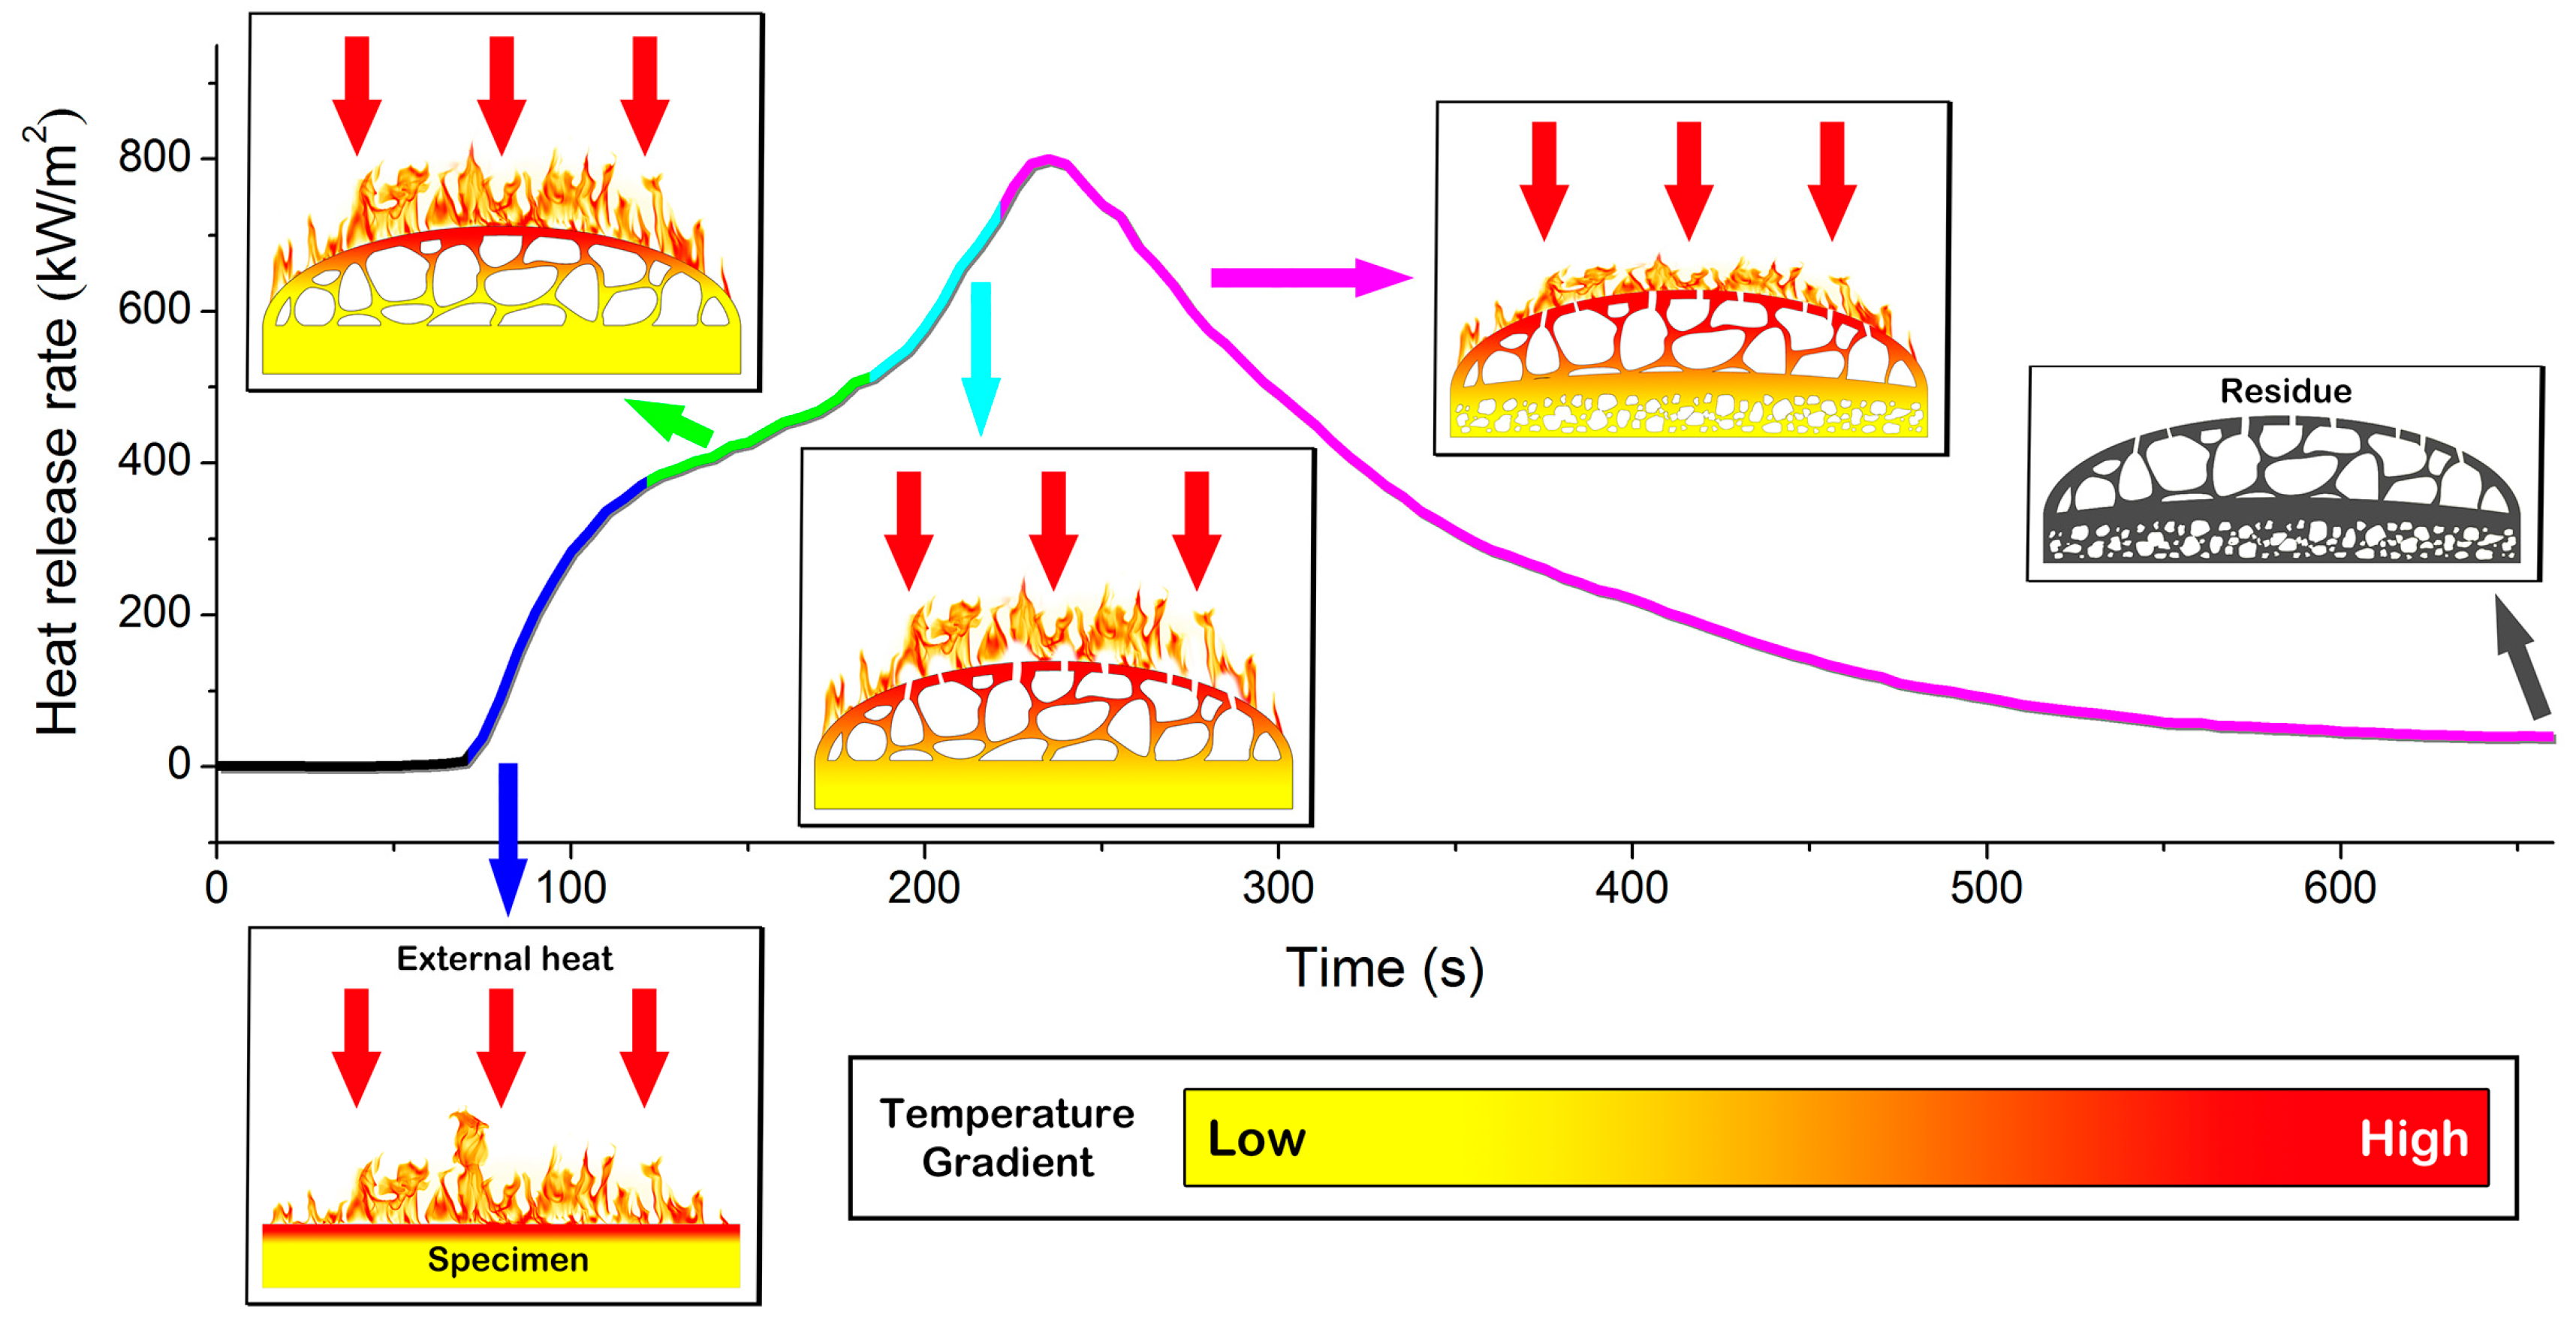
According to the above discussion, the formation mechanism of the unique char layer is proposed in
Figure 12, along with the HRR curve to add the time scale and relate it to the combustion circumstance. Firstly, the sample is ignited from the irradiation of external heat and starts to decompose, which is represented by the release of heat (blue line). The decomposition of the phosphorus-containing moiety in the upper surface promotes the dehydration of the epoxy matrix, thus rapidly generating compact char layer A. The pyrolysis gases from the substance underneath cause the expansion of the char layer and the open-cavity structure layer B is formed accordingly. As a result of the formation of these two layers that act as a heat barrier, the heat release is decelerated in this period (green line). With an increase in the heat, the continually accumulated gases in layer B successfully break through the top layer A and gush outwards; meanwhile, the external heat infiltrates deeper and the lower layer subsequently decomposes, as manifested by the intensification of heat release (turquoise line). Moreover, another compact firm layer, C, is constructed. Since layer B possesses a cavity structure filled with air, the thermal conduction slackens and a heat gradient subsequently emerges, as reflected by the temperature distribution. The pyrolytic gases generated from the layers beneath (D and E) are no longer able to perforate the char layer above due to the lack of inner pressure. Therefore, they tend to construct a convex sphere in layer D. Following the exhaustion of combustion fuel from the decomposition of material, the heat release rate decreases (purple line) and the flame eventually extinguishes, leaving the unique residual char layer.
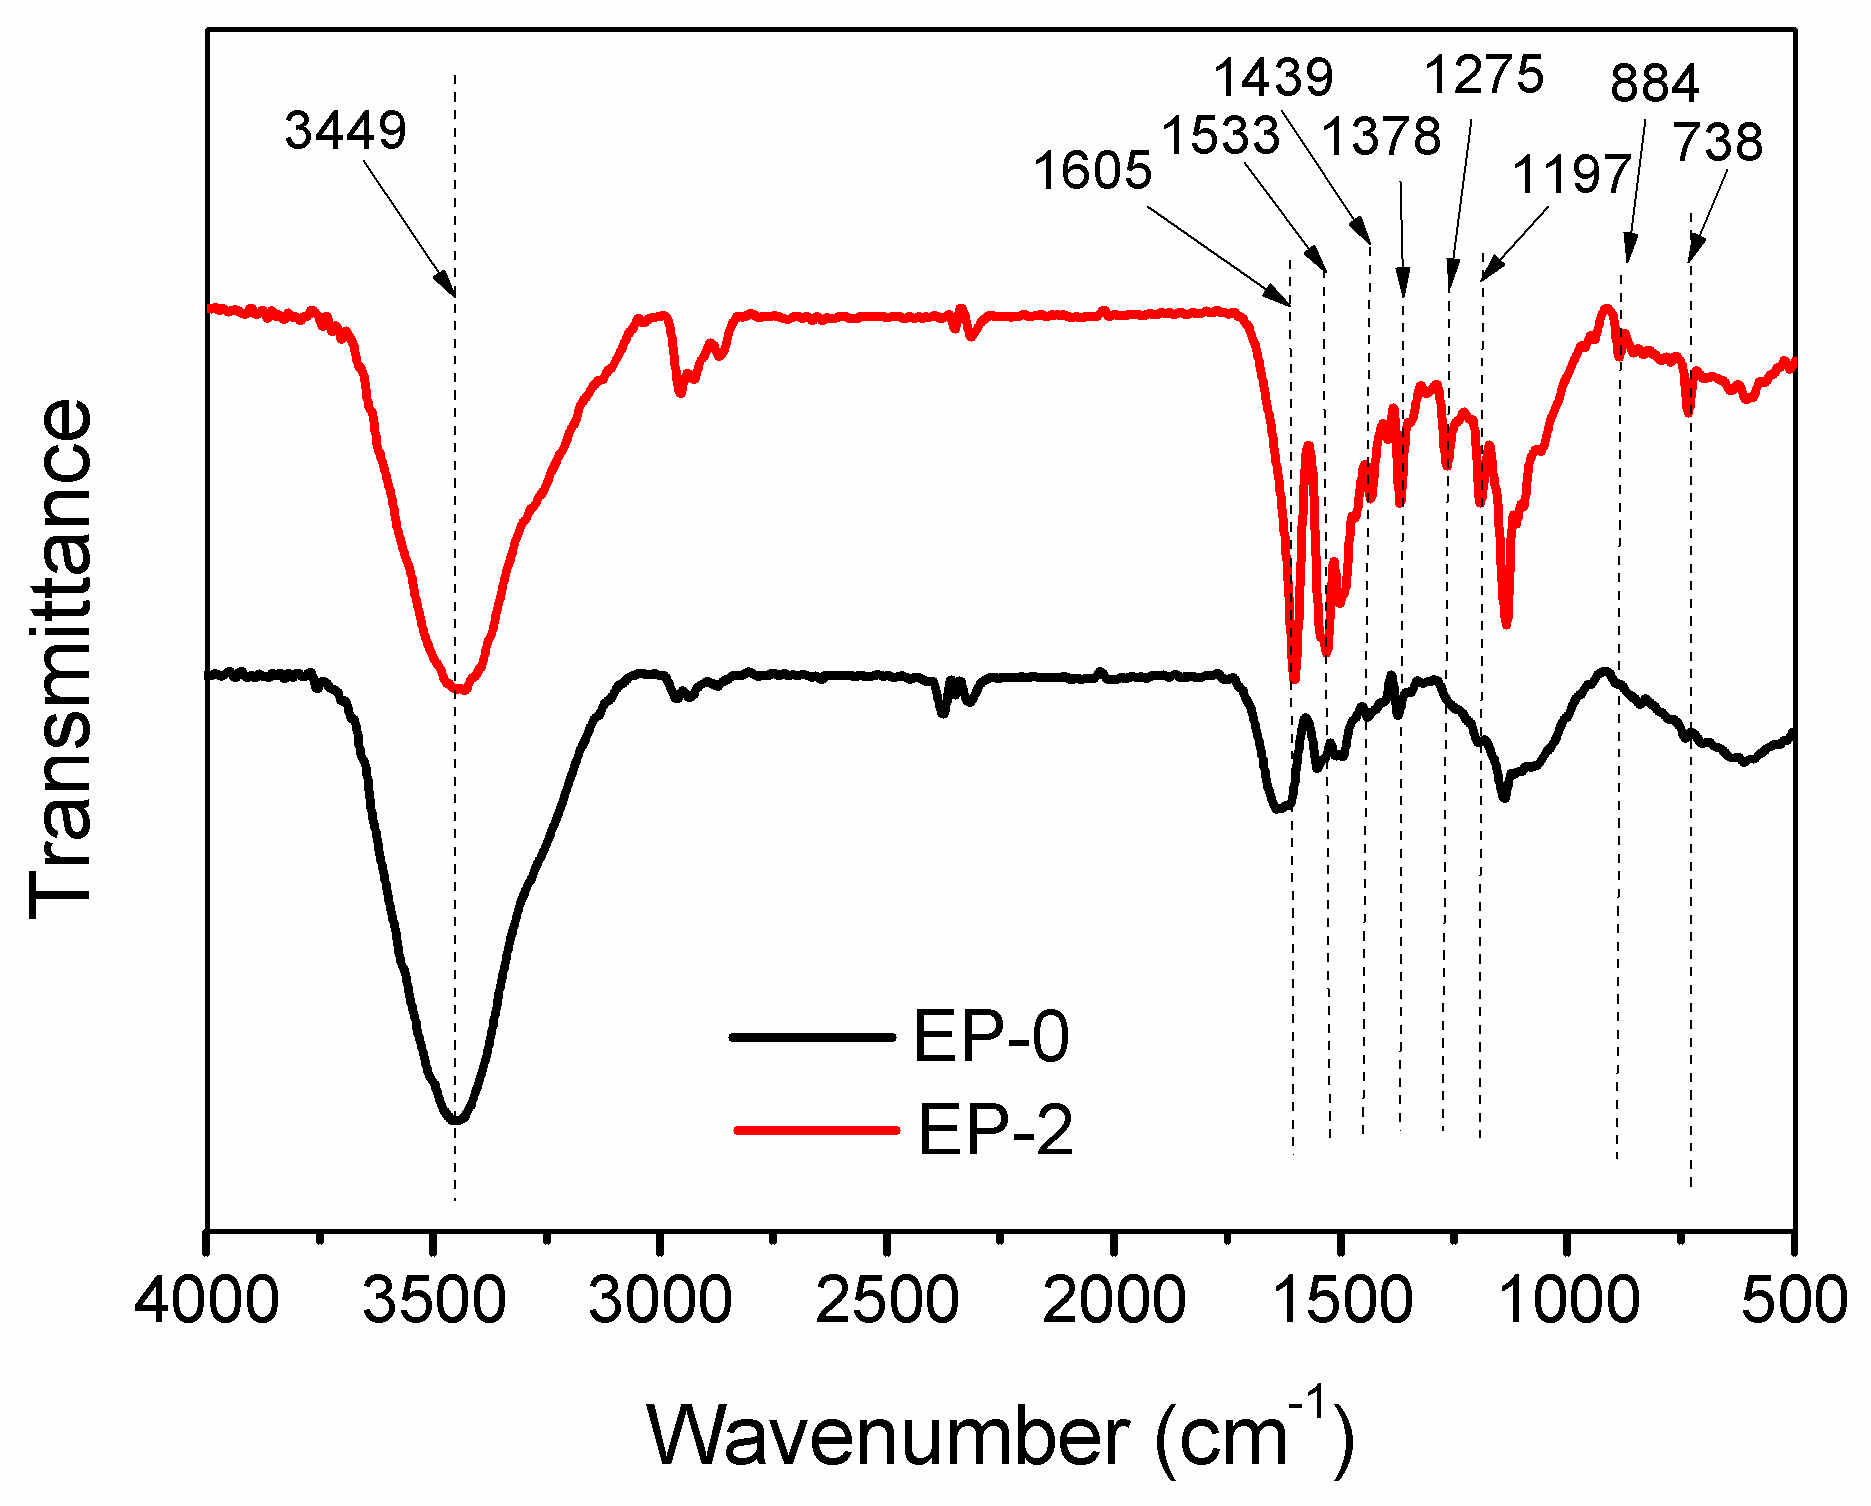
The chemical structure of the char residue after the cone calorimeter test is further analyzed by FTIR spectroscopy (
Figure 13). Unlike the gaseous phase, the utilization of HB-DPPA brings about a massive discrepancy in the FTIR spectrum of char residue, presuming that the chemical composition of the char residue is altered following the flame retardation. Compared with EP-0, several new peaks are detected in EP-2, which are attributed to the phosphorus-containing bands as follows: 1439 cm
−1 (P–Ar), 1275 cm
−1 (P=O), 1197 and 884 cm
−1 (P–O–Ar), and 738 cm
−1 (Ar–H of substituted aromatic ring of DPPA moiety) [
40]. In addition, the intensification of peaks at 1605, 1533, and 1378 cm
−1 signifies the formation of more aromatic carbon networks during the combustion. The spectroscopy result further implies that the phosphorus-containing substances are left in the condensed phase and join in the formation of a phosphorus-rich char layer, in addition to the stimulation of carbonization of the polymer matrix.


 ,
, 


