
Scalable Fabrication of Natural-Fiber Reinforced Composites with Electromagnetic Interference Shielding Properties by Incorporating Powdered Activated Carbon

 ,
,
Abstract
:1. Introduction
2. Materials and Methods
2.1. Materials
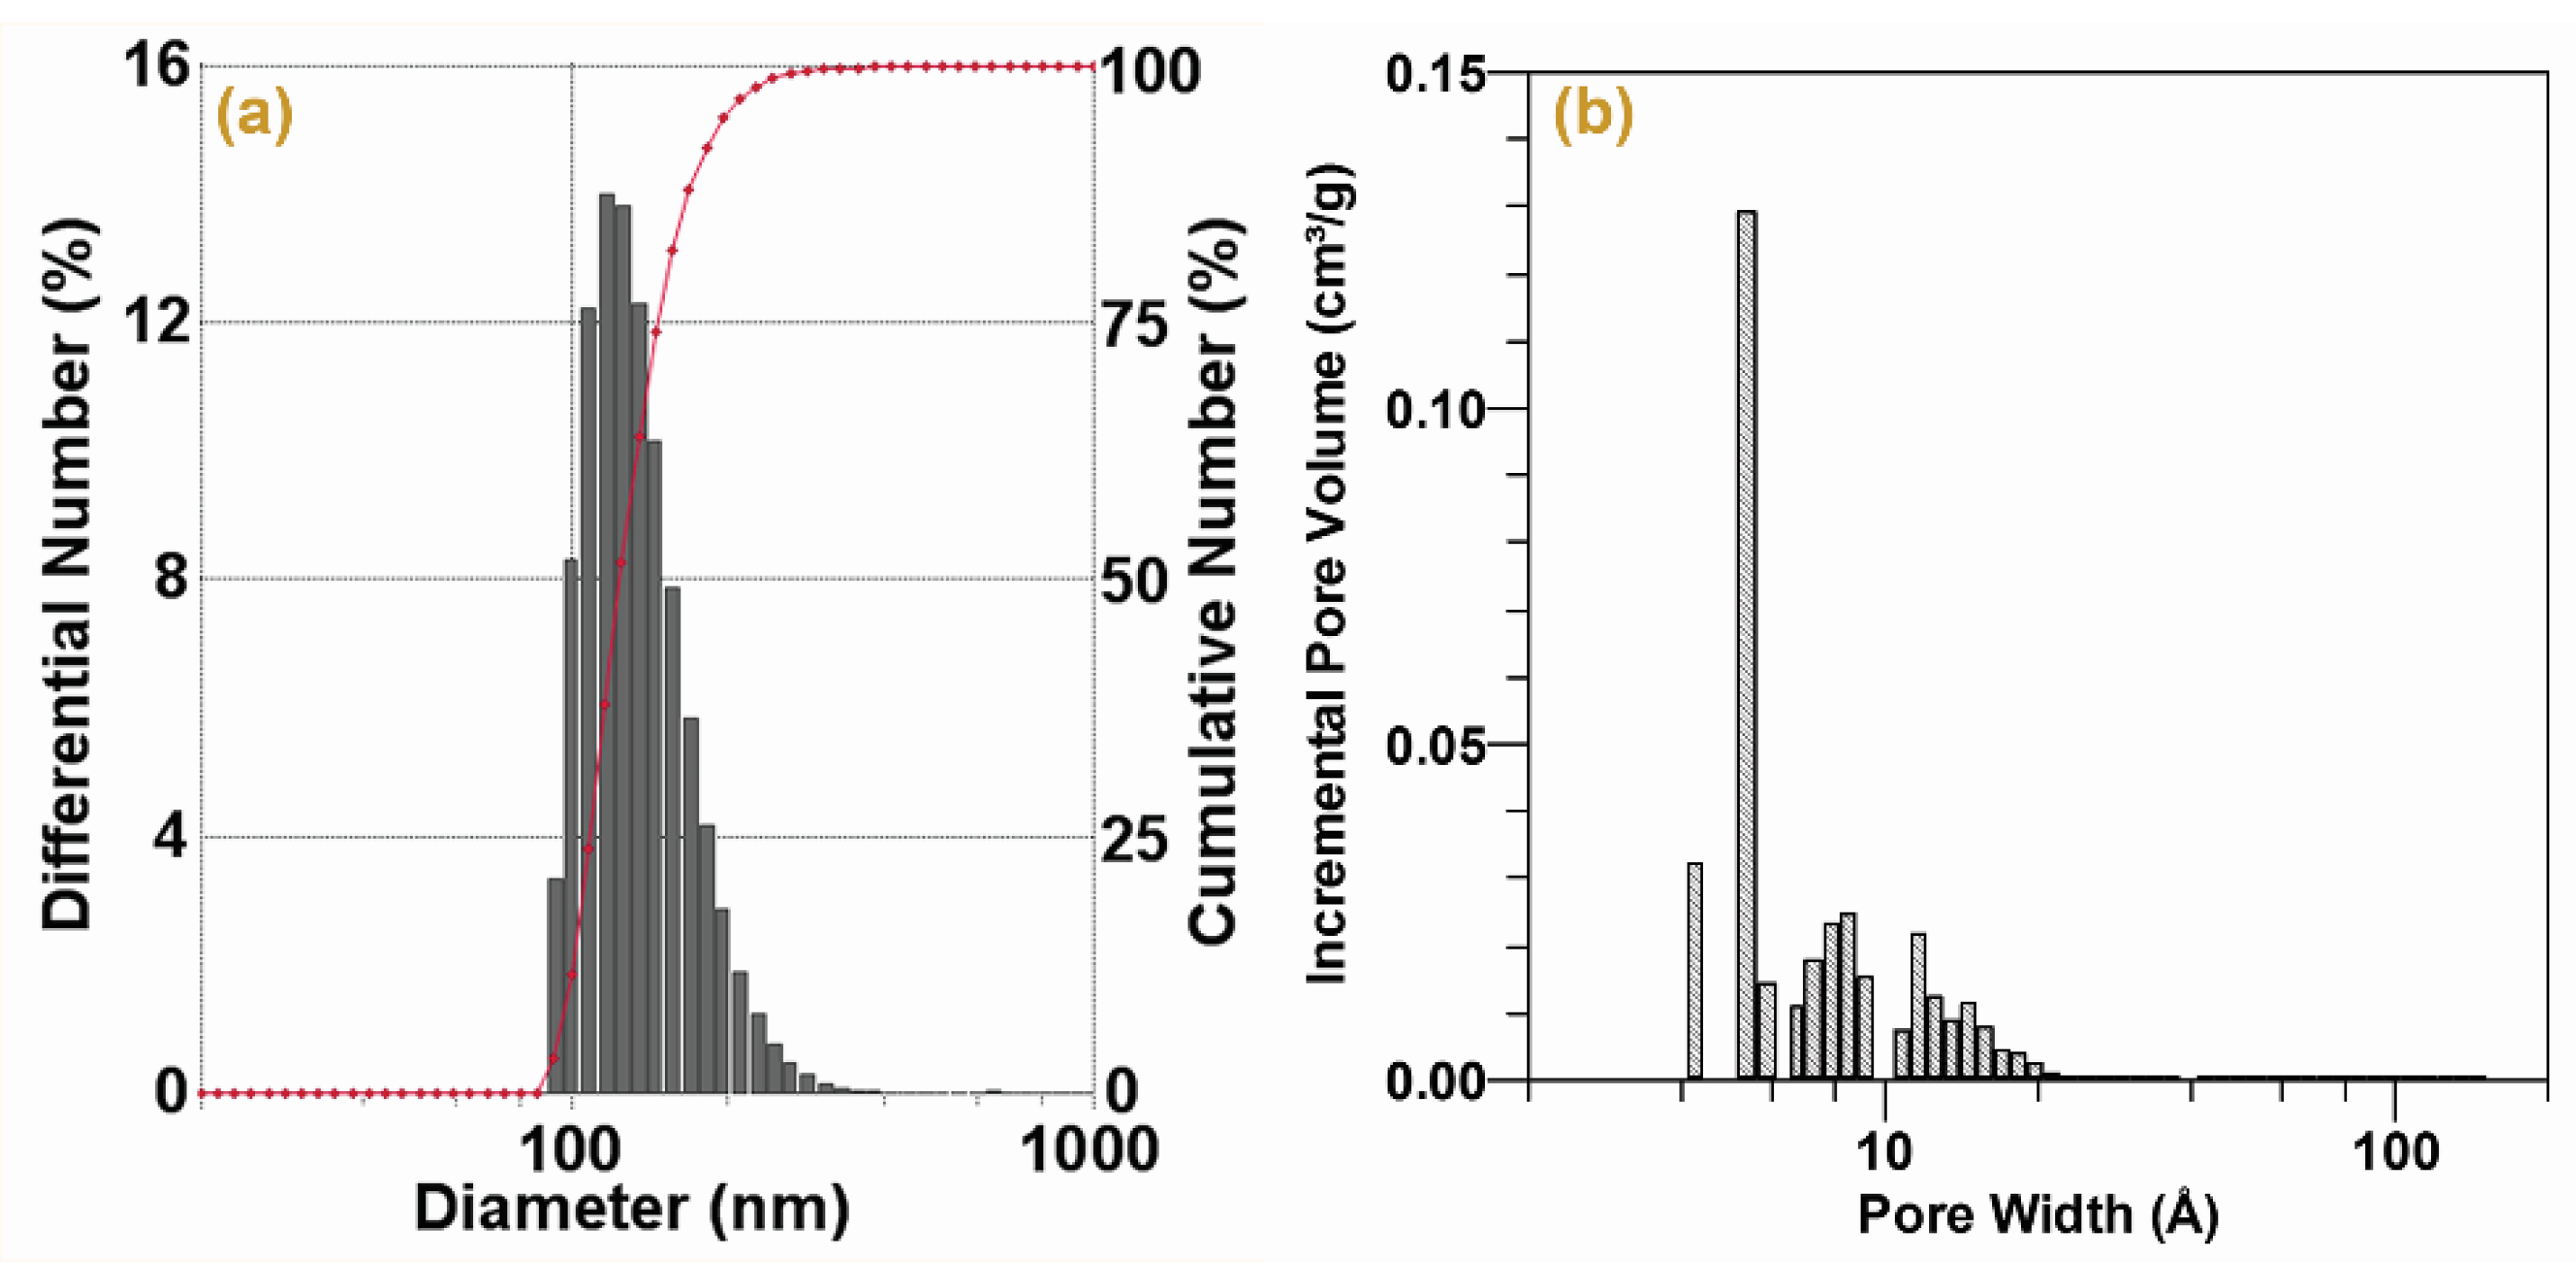
2.2. Preparation of Powdered Activated Carbon
2.3. Preparation of Preformed Mats
2.4. Composites Fabrication through VARTM Process
2.5. Specific Surface Area and Pore Structure Analysis
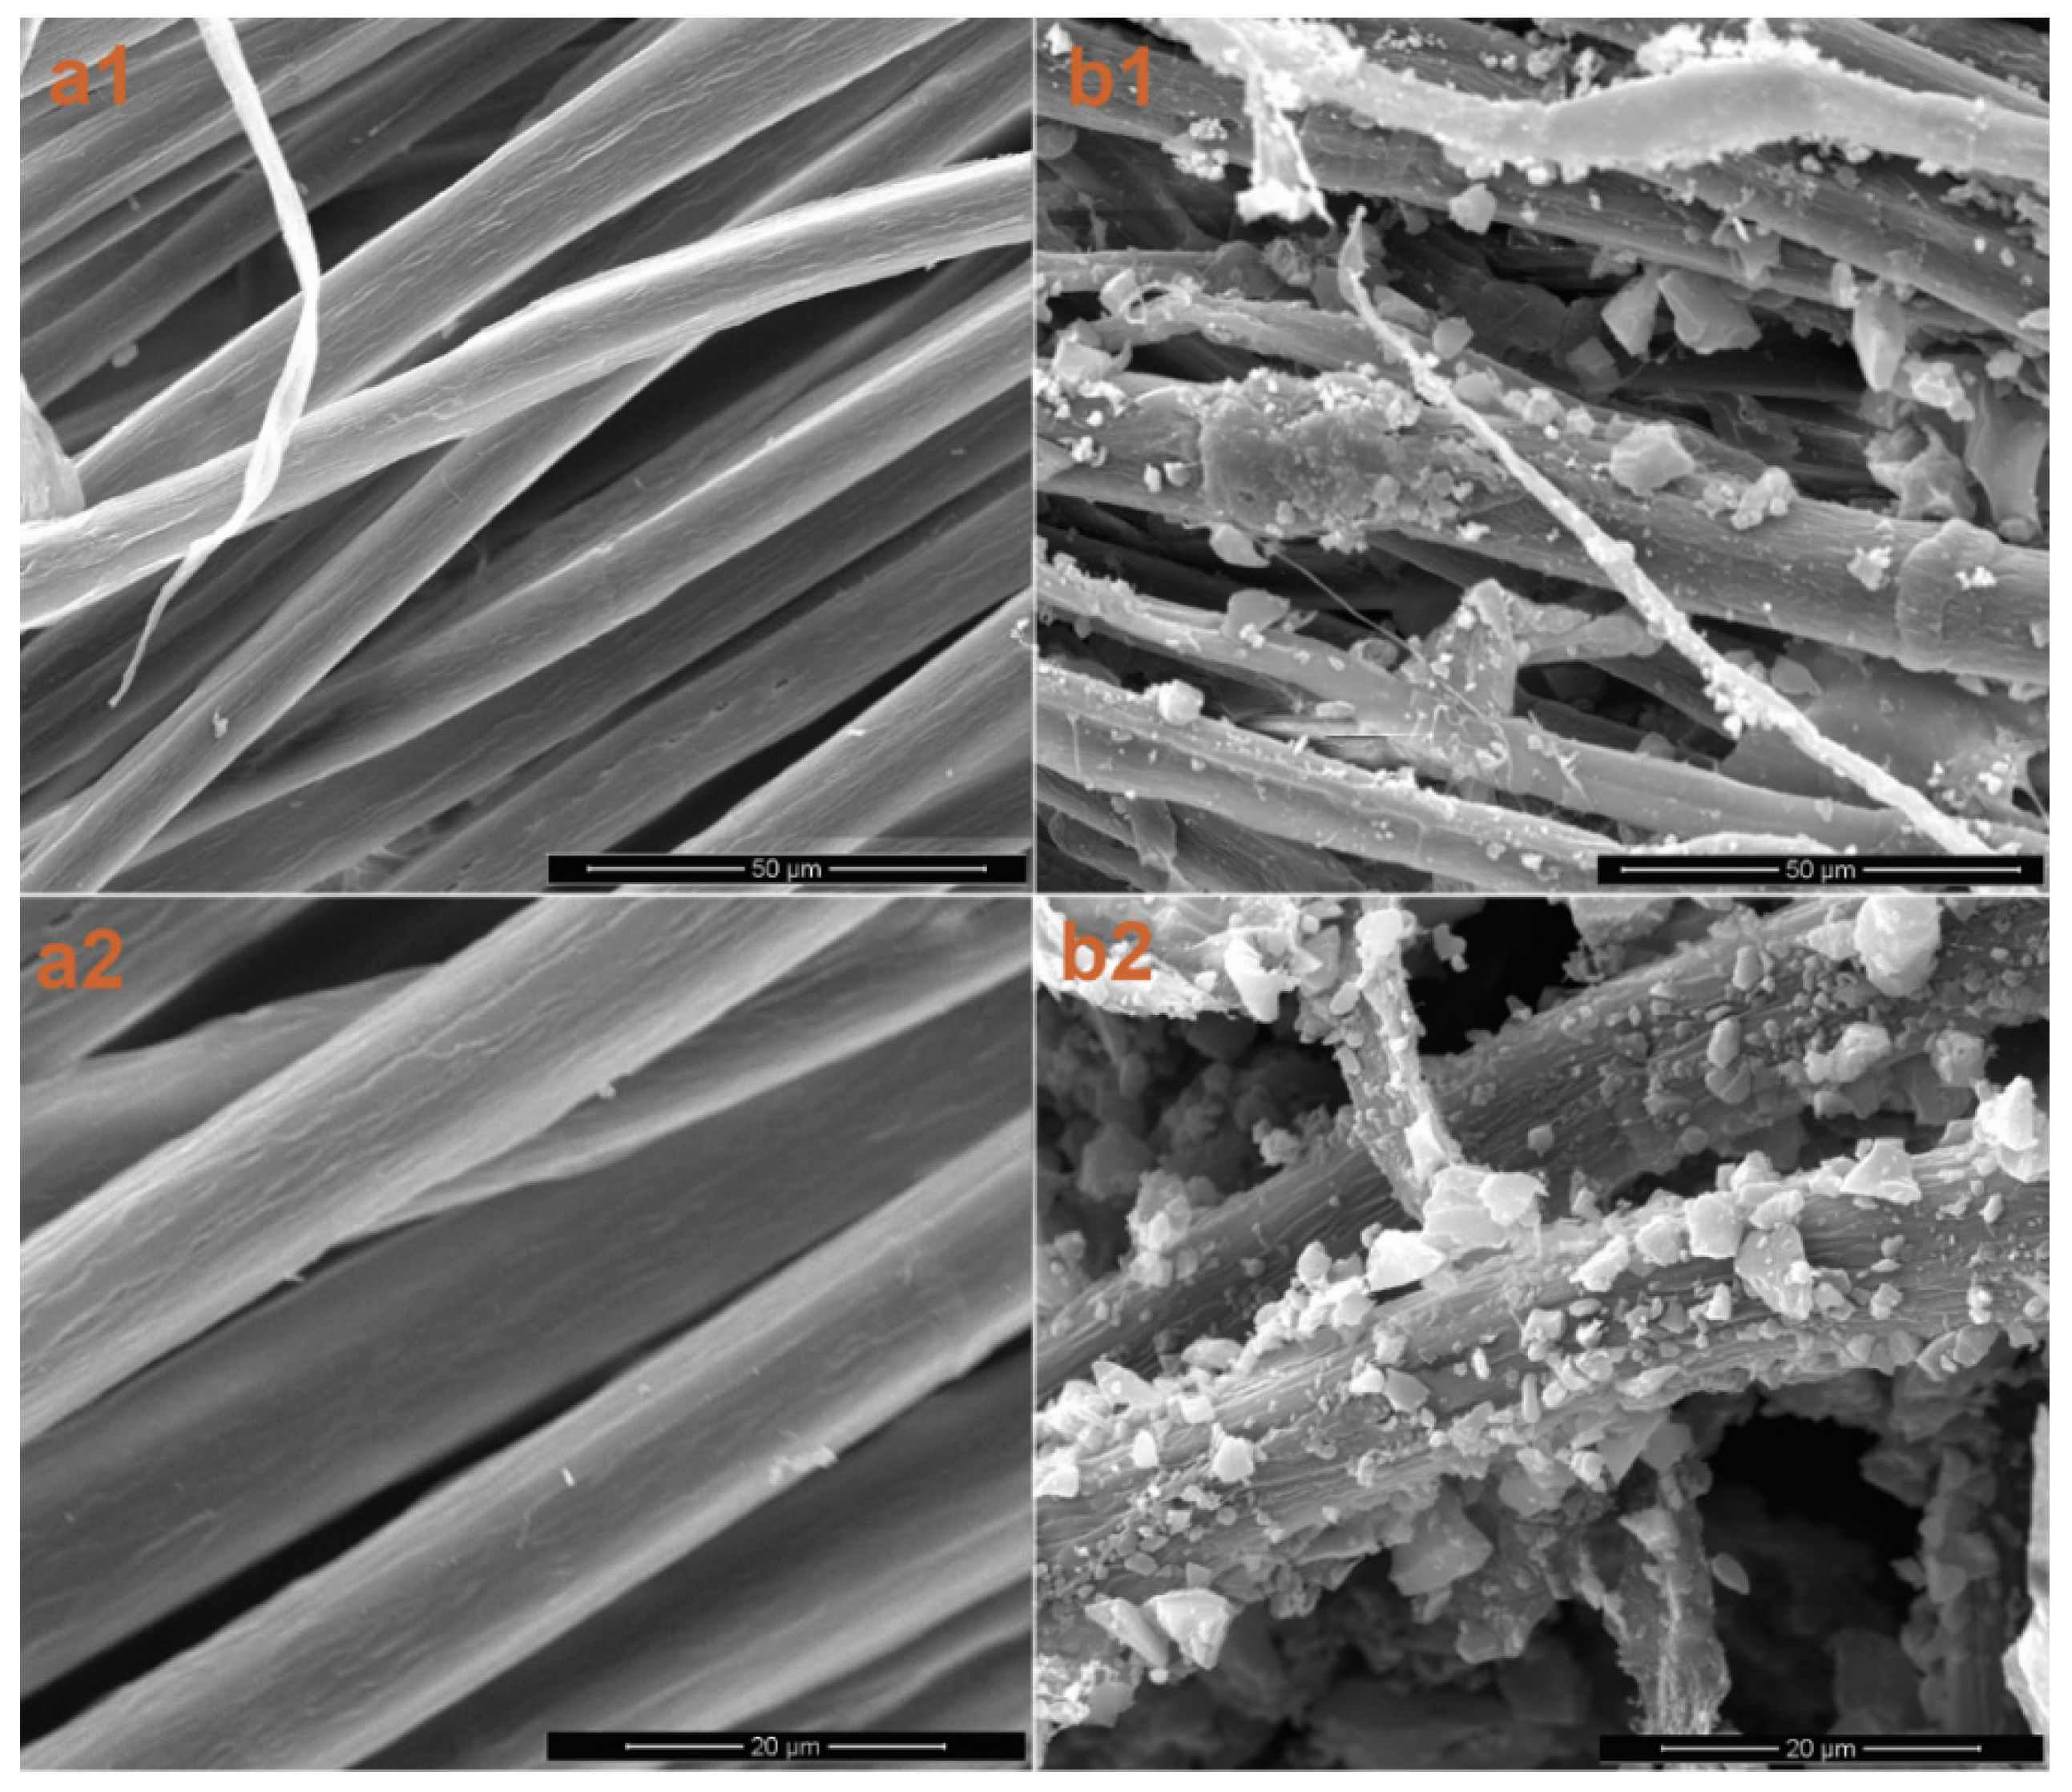
2.6. Microtopography Analysis of Fibers
2.7. Electromagnetic Interference Shielding Tests
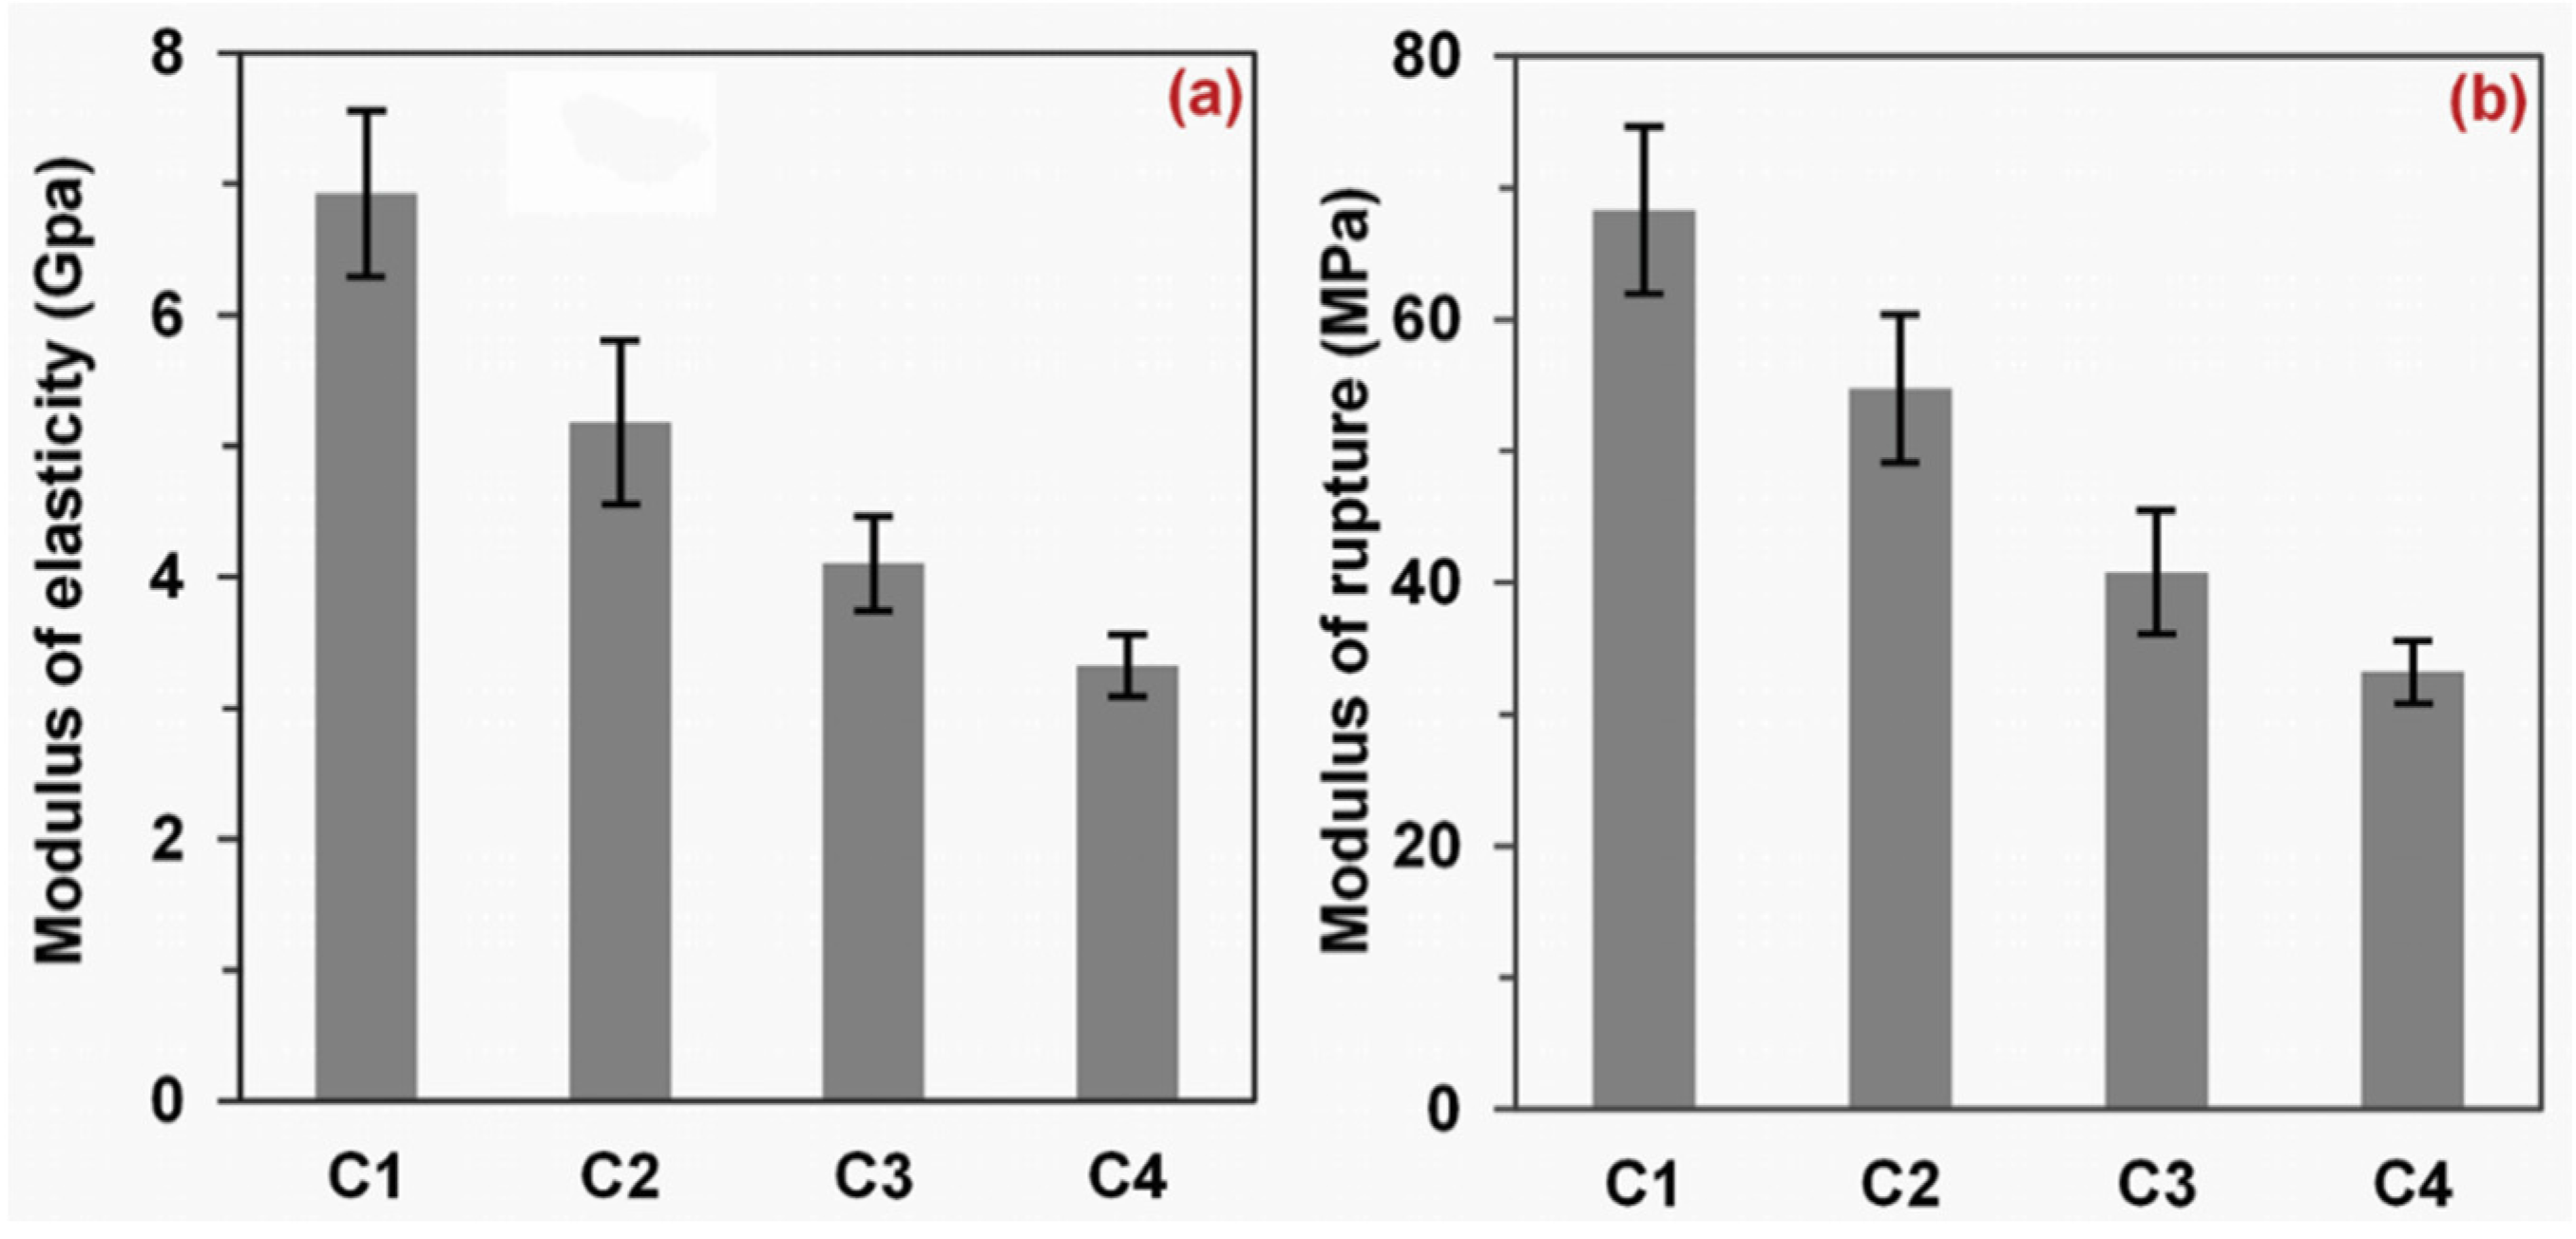
2.8. Mechanical Property Tests
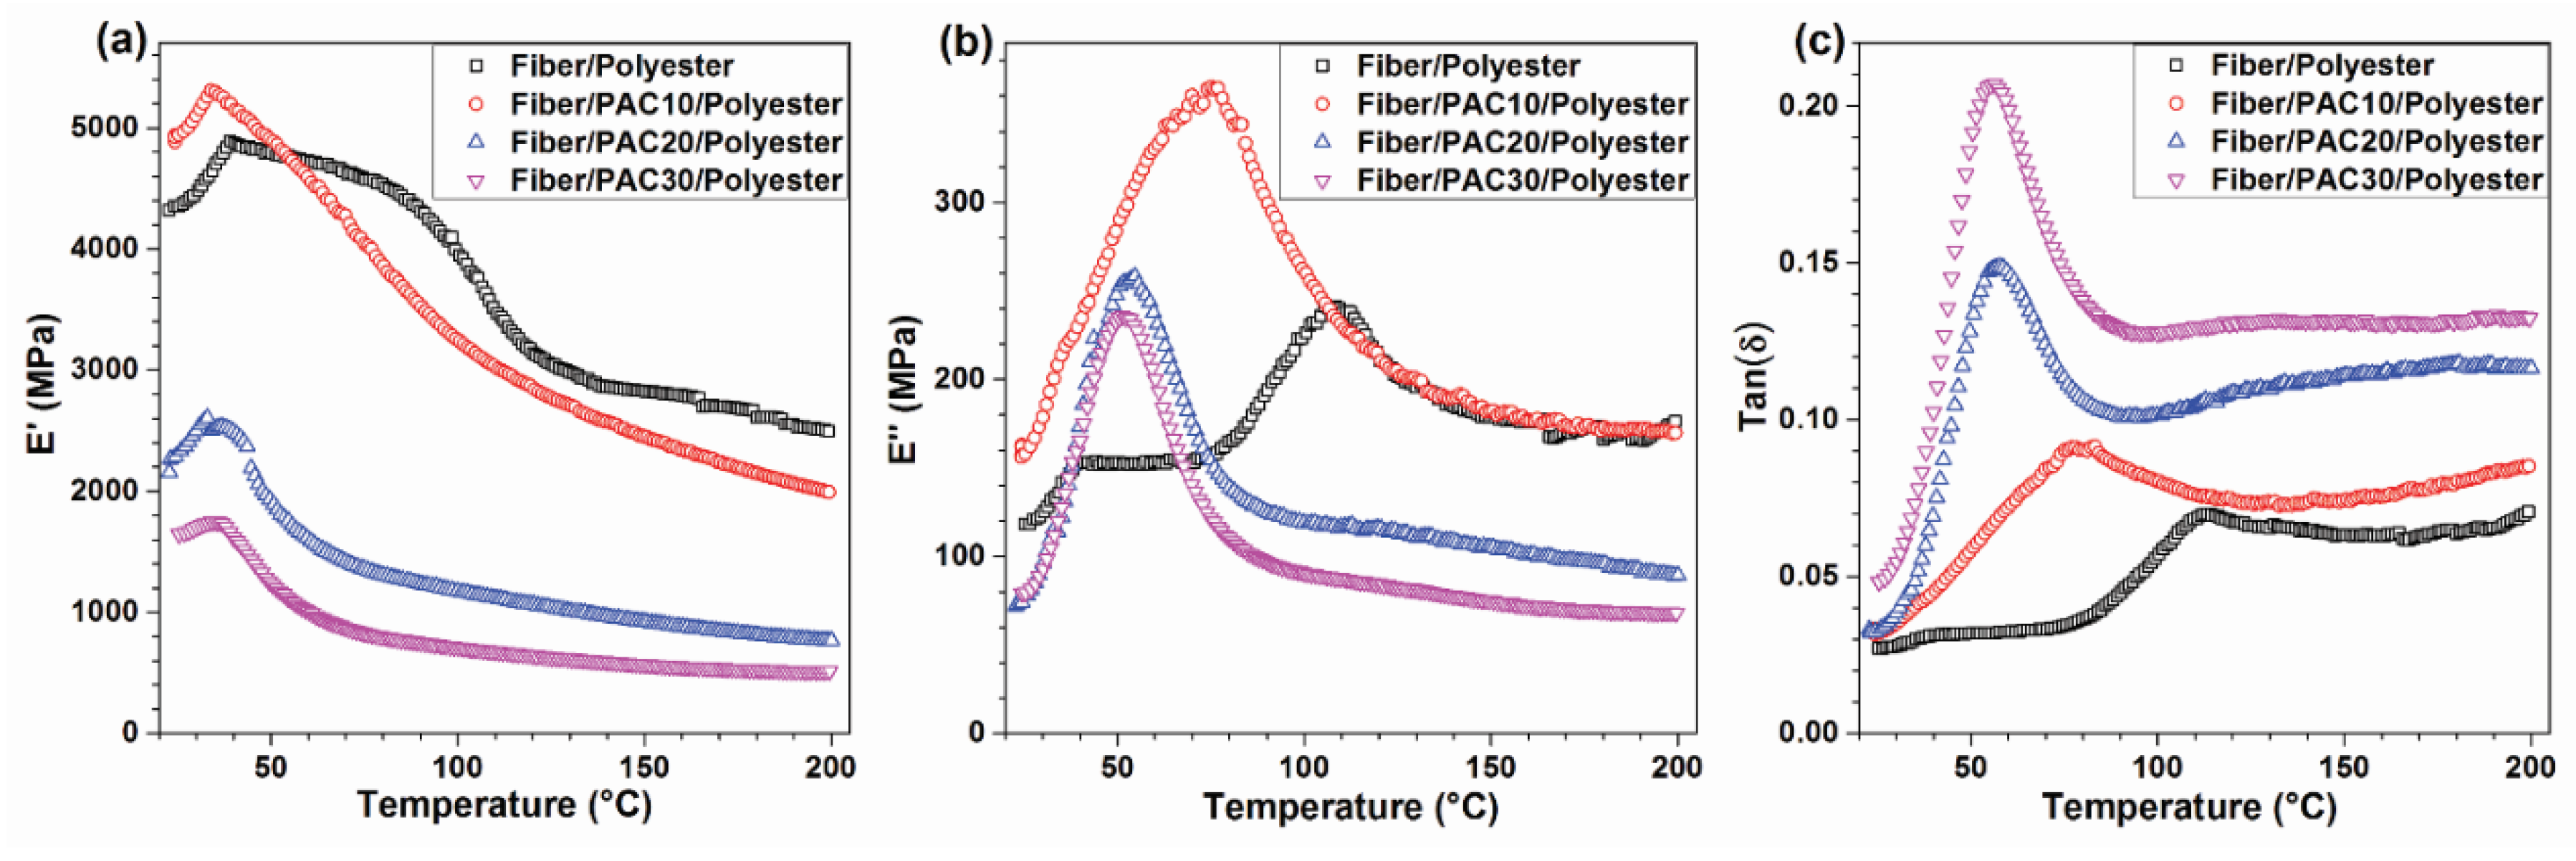
2.9. Dynamic Mechanical Analysis
3. Results and Discussion
3.1. Fiber Characterization


| Specimen | PAC Feed | PAC Loading Effectiveness | Content (%) | |
|---|---|---|---|---|
| (g) | (%) | PAC a | Fiber | |
| Fiber | – | – | 0.0 | 100.0 |
| Fiber/PAC10 | 10 | 66.6 | 13.4 | 86.6 |
| Fiber/PAC20 | 20 | 77.9 | 26.2 | 73.8 |
| Fiber/PAC30 | 30 | 84.7 | 38.0 | 62.0 |
3.2. Composites Properties
| Composite | Density | Thickness | Content (%) | ||
|---|---|---|---|---|---|
| (Kg·m−3) | (mm) | Fiber | PAC b | Resin c | |
| Fiber/polyester | 1159.4 (44.5) a | 2.6 (0.2) | 66.7 | 0.0 | 33.3 |
| Fiber/PAC10/polyester | 1157.3 (15.1) | 3.5 (0.1) | 64.2 | 10.0 | 25.8 |
| Fiber/PAC20/polyester | 1064.7 (20.4) | 4.2 (0.1) | 57.9 | 20.5 | 21.7 |
| Fiber/PAC30/polyester | 1036.2 (18.8) | 4.8 (0.2) | 47.1 | 28.9 | 24.1 |


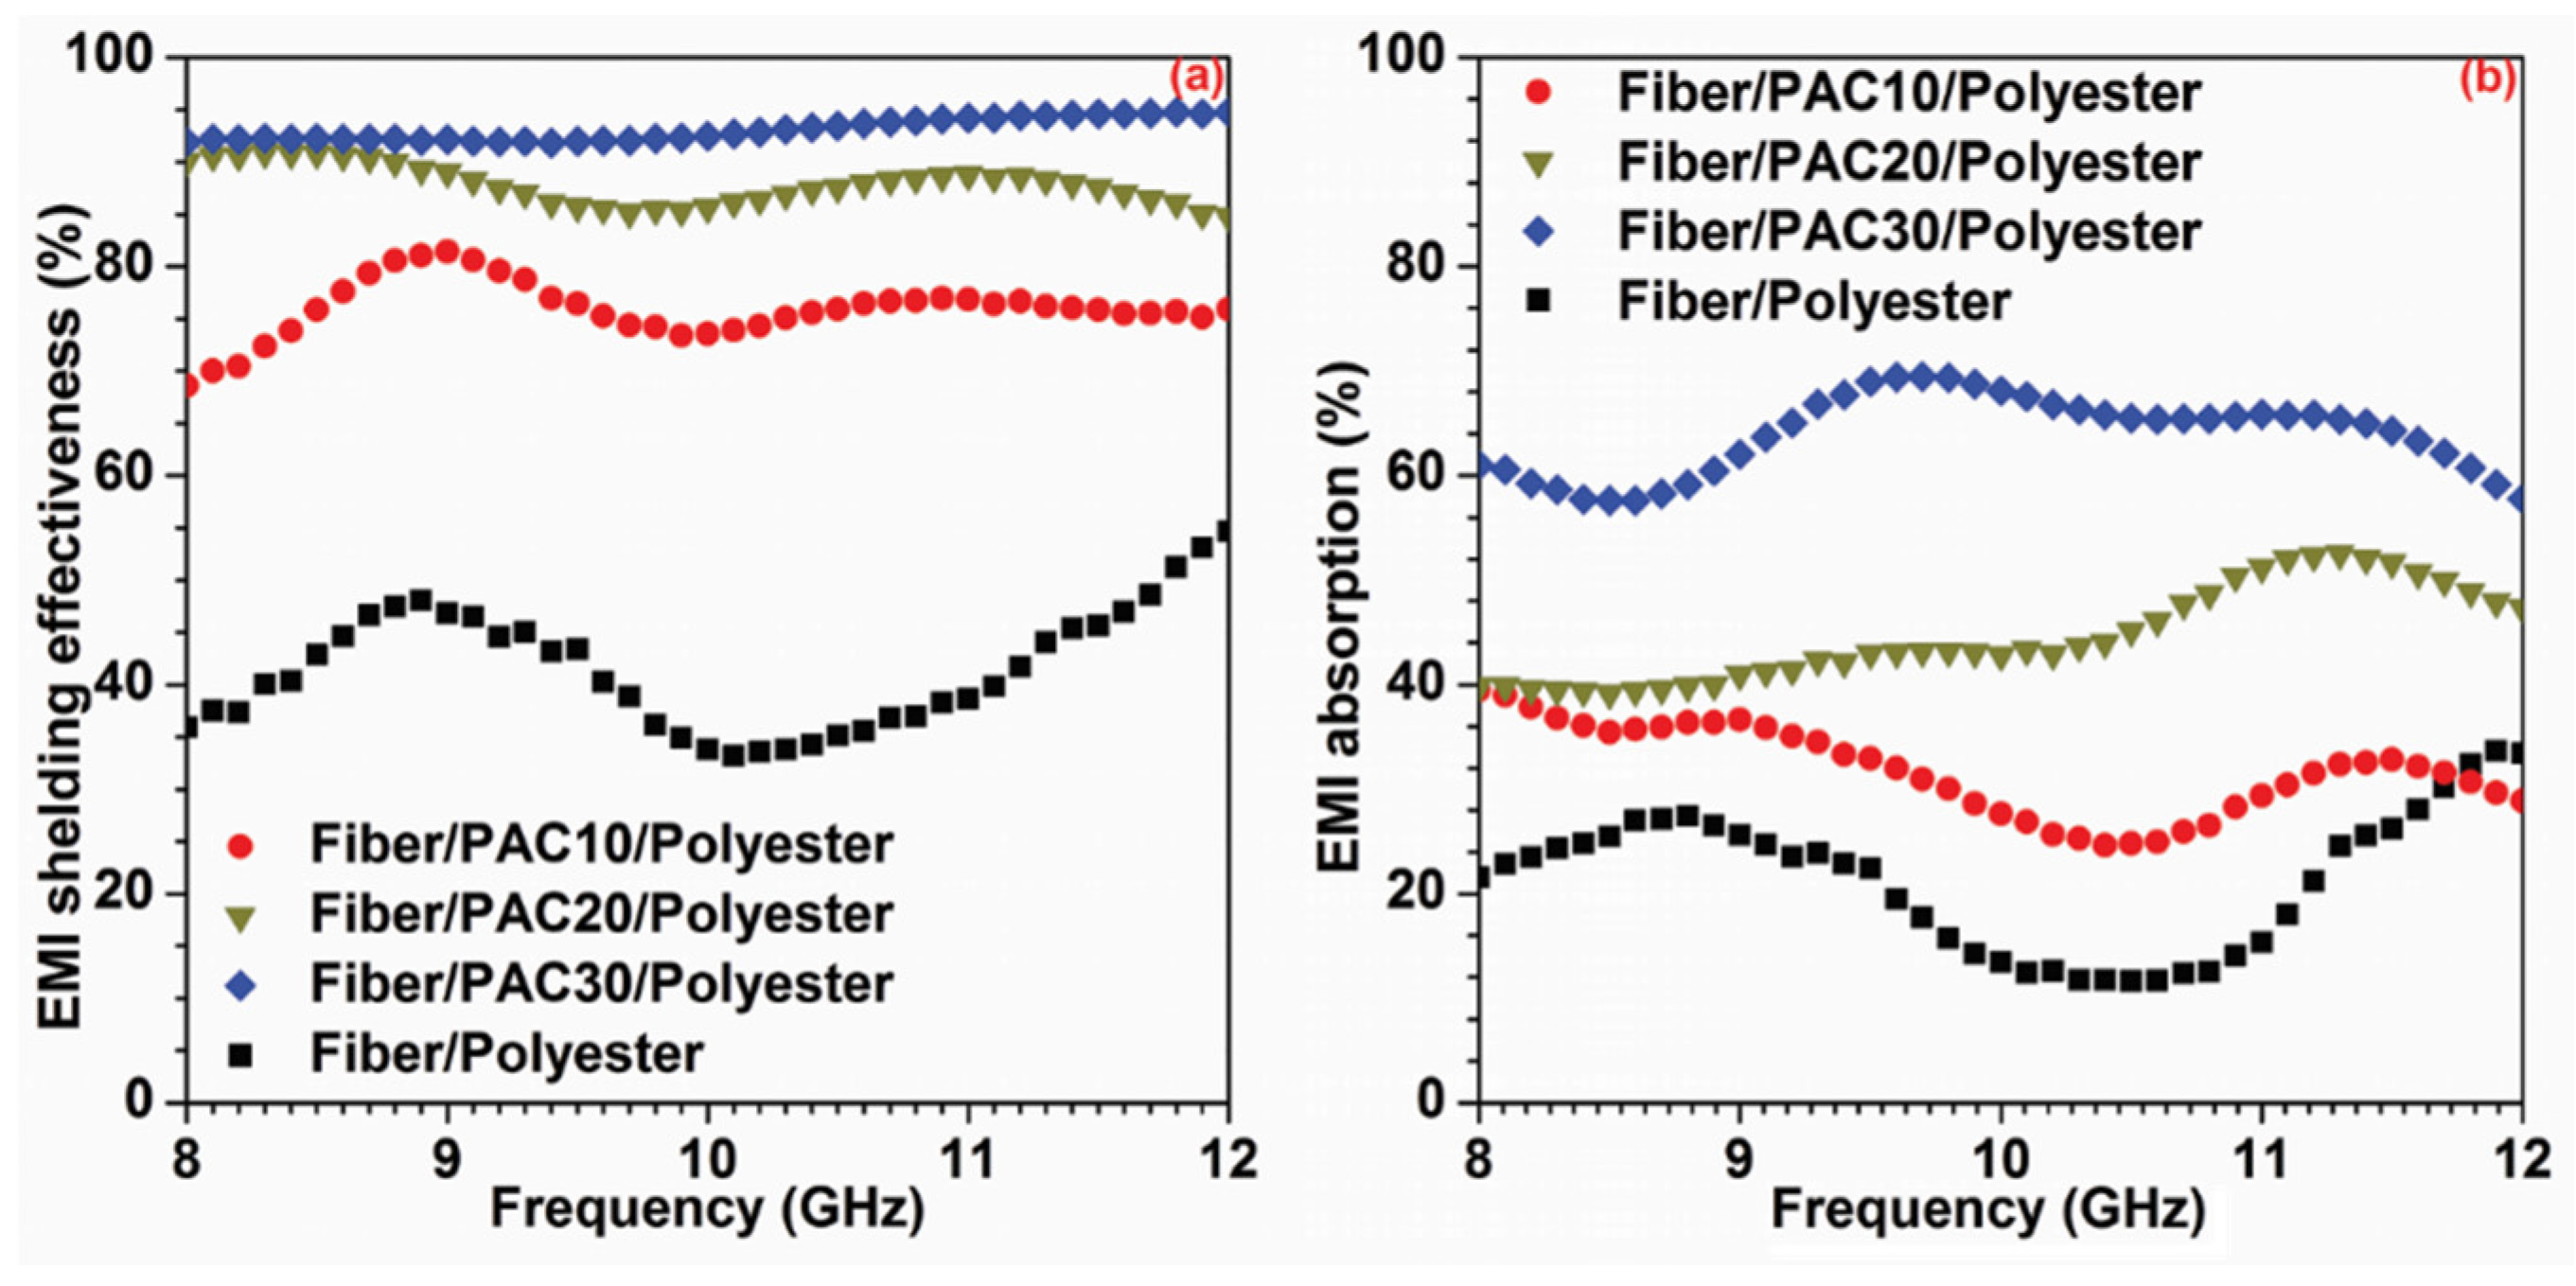
3.3. EMI Shielding
| Composite | EMI Shielding | EMI Absorption a | EMI Absorption/Shielding |
|---|---|---|---|
| (%) | (%) | (%) | |
| Fiber/PAC10/polyester | 76.0 (2.6) b | 31.7 (4.2) | 41.8 (5.7) |
| Fiber/PAC20/polyester | 87.9 (1.8) | 44.7 (4.4) | 50.9 (5.4) |
| Fiber/PAC30/polyester | 93.0 (1.1) | 64.0 (3.7) | 68.7 (4.1) |
| Fiber/polyester | 41.4 (5.5) | 21.2 (6.5) | 50.1 (10.3) |
| Increment (%) c | 124.6 | 201.7 | 37.1 |
4. Conclusions
Acknowledgments
Author Contributions
Conflicts of Interest
References
- Huynen, I.; Quievy, N.; Bailly, C.; Bollen, P.; Detrembleur, C.; Eggermont, S.; Molenberg, I.; Thomassin, J.M.; Urbanczyk, L.; Pardoen, T. Multifunctional hybrids for electromagnetic absorption. Acta Mater. 2011, 59, 3255–3266. [Google Scholar] [CrossRef]
- Thomassin, J.; Jerome, C.; Pardoen, T.; Bailly, C.; Huynen, I.; Detrembleur, C. Polymer/carbon based composites as electromagnetic interference (EMI) shielding materials. Mater. Sci. Eng. R 2013, 74, 211–232. [Google Scholar] [CrossRef]
- Mihut, D.M.; Lozano, K.; Tidrow, S.C.; Garcia, H. Electromagnetic interference shielding effectiveness of nanoreinforced polymer composites deposited with conductive metallic thin films. Thin Solid Films 2012, 520, 6547–6550. [Google Scholar] [CrossRef]
- Liang, J.; Wang, Y.; Huang, Y.; Ma, Y.; Liu, Z.; Cai, F.; Zhang, C.; Gao, H.; Chen, Y. Electromagnetic interference shielding of graphene/epoxy composites. Carbon 2009, 47, 922–925. [Google Scholar] [CrossRef]
- Joshi, A.; Bajaj, A.; Singh, R.; Anand, A.; Alegaonkar, P.S.; Datar, S. Processing of graphene nanoribbon based hybrid composite for electromagnetic shielding. Compos. Part B 2015, 69, 472–477. [Google Scholar] [CrossRef]
- Xu, X.; Li, Z.; Shi, L.; Bian, X.; Xiang, Z. Ultralight conductive carbon-nanotube-polymer composite. Small 2007, 3, 408–411. [Google Scholar] [CrossRef] [PubMed]
- Luo, X.C.; Chung, D.D.L. Electromagnetic interference shielding using continuous carbon-fiber carbon-matrix and polymer-matrix composites. Compos. Part B 1999, 30, 227–231. [Google Scholar] [CrossRef]
- Chiang, W.; Ao, J. Effect of surface treatment of carbon fiber on the electrical and mechanical properties of high-Impact polystyrene composite. J. Polymer Res. 1995, 2, 83–89. [Google Scholar] [CrossRef]
- Chen, Y.; Li, Y.; Chu, B.T.T.; Kuo, I.; Yip, M.; Tai, N. Porous composites coated with hybrid nano carbon materials perform excellent electromagnetic interference shielding. Compos. Part B 2015, 70, 231–237. [Google Scholar] [CrossRef]
- Mohanraj, G.T.; Chaki, T.K.; Chakraborty, A.; Khastgir, D. AC impedance analysis and EMI shielding effectiveness of conductive SBR composites. Polymer Eng. Sci. 2006, 46, 1342–1349. [Google Scholar] [CrossRef]
- Hu, Q.; Kim, M. Electromagnetic interference shielding properties of CO2 activated carbon black filled polymer coating materials. Carbon Lett. 2008, 9, 298–302. [Google Scholar] [CrossRef]
- Das, A.; Hayvaci, H.T.; Tiwari, M.K.; Bayer, I.S.; Erricolo, D.; Megaridis, C.M. Superhydrophobic and conductive carbon nanofiber/PTFE composite coatings for EMI shielding. J. Colloid Interface Sci. 2011, 353, 311–315. [Google Scholar] [CrossRef] [PubMed]
- Xia, C.; Shi, S.Q. Self-activation for activated carbon from biomass: Theory and parameters. Green Chem. 2016. [Google Scholar] [CrossRef]
- Sun, L.; Li, J.; Wang, L. Electromagnetic interference shielding material from electroless copper plating on birch veneer. Wood Sci. Technol. 2012, 46, 1061–1071. [Google Scholar] [CrossRef]
- Lee, B.O.; Woo, W.J.; Park, H.S.; Hahm, H.S.; Wu, J.P.; Kim, M.S. Influence of aspect ratio and skin effect on EMI shielding of coating materials fabricated with carbon nanofiber/PVDF. J. Mater. Sci. 2002, 37, 1839–1843. [Google Scholar] [CrossRef]
- Chung, D.D.L. Electromagnetic interference shielding effectiveness of carbon materials. Carbon 2001, 39, 279–285. [Google Scholar] [CrossRef]
- Yu, X.; Shen, Z.; Cai, C. Millimeter wave electromagnetic interference shielding by coating expanded polystyrene particles with a copper film using magnetron sputtering. Vacuum 2009, 83, 1438–1441. [Google Scholar] [CrossRef]
- Xia, C.; Ren, H.; Shi, S.Q.; Zhang, H.; Cheng, J.; Cai, L.; Chen, K.; Tan, H. Natural fiber composites with EMI shielding function fabricated using VARTM and Cu film magnetron sputtering. Appl. Surf. Sci. 2016, 362, 335–340. [Google Scholar] [CrossRef]
- Jalali, M.; Dauterstedt, S.; Michaud, A.; Wuthrich, R. Electromagnetic shielding of polymer-matrix composites with metallic nanoparticles. Compos. Part B 2011, 42, 1420–1426. [Google Scholar] [CrossRef]
- Wang, L.; Li, J.; Liu, Y. Surface characteristics of electroless nickel plated electromagnetic shielding wood veneer. J. For. Res. 2005, 16, 233–236. [Google Scholar]
- Xia, C.; Shi, S.Q.; Cai, L.; Nasrazadani, S. Increasing inorganic nanoparticle impregnation efficiency by external pressure for nature fibers. Ind. Crop. Prod. 2015, 69, 395–399. [Google Scholar] [CrossRef]
- Xia, C.; Zhang, S.; Shi, S.Q.; Cai, L.; Huang, J. Property enhancement of kenaf fiber reinforced composites by in situ aluminum hydroxide impregnation. Ind. Crop. Prod. 2016, 79, 131–136. [Google Scholar] [CrossRef]
- Xia, C.; Shi, S.Q.; Cai, L. Vacuum-assisted resin infusion (VARI) and hot pressing for CaCO3 nanoparticle treated kenaf fiber reinforced composites. Compos. Part B 2015, 78, 138–143. [Google Scholar] [CrossRef]
- Mohan, D.; Pittman, C.U., Jr. Activated carbons and low cost adsorbents for remediation of tri-and hexavalent chromium from water. J. Hazard Mater. 2006, 137, 762–811. [Google Scholar] [CrossRef] [PubMed]
- Xia, C.; Shi, S.Q.; Cai, L.; Hua, J. Property enhancement of kenaf fiber composites by means of vacuum-assisted resin transfer molding (VARTM). Holzforschung 2015, 69, 307–312. [Google Scholar] [CrossRef]
- Chen, X.; Wu, S.; Zhou, J. Influence of porosity on compressive and tensile strength of cement mortar. Constr. Build. Mater. 2013, 40, 869–874. [Google Scholar] [CrossRef]
- Islam, M.S.; Hamdan, S.; Talib, Z.A.; Ahmed, A.S.; Rahman, M.R. Tropical wood polymer nanocomposite (WPNC): The impact of nanoclay on dynamic mechanical thermal properties. Compos. Sci. Technol. 2012, 72, 1995–2001. [Google Scholar] [CrossRef]
© 2015 by the authors; licensee MDPI, Basel, Switzerland. This article is an open access article distributed under the terms and conditions of the Creative Commons by Attribution (CC-BY) license (http://creativecommons.org/licenses/by/4.0/).
Share and Cite
Xia, C.; Zhang, S.; Ren, H.; Shi, S.Q.; Zhang, H.; Cai, L.; Li, J. Scalable Fabrication of Natural-Fiber Reinforced Composites with Electromagnetic Interference Shielding Properties by Incorporating Powdered Activated Carbon. Materials 2016, 9, 10. https://doi.org/10.3390/ma9010010
Xia C, Zhang S, Ren H, Shi SQ, Zhang H, Cai L, Li J. Scalable Fabrication of Natural-Fiber Reinforced Composites with Electromagnetic Interference Shielding Properties by Incorporating Powdered Activated Carbon. Materials. 2016; 9(1):10. https://doi.org/10.3390/ma9010010
Chicago/Turabian StyleXia, Changlei, Shifeng Zhang, Han Ren, Sheldon Q. Shi, Hualiang Zhang, Liping Cai, and Jianzhang Li. 2016. "Scalable Fabrication of Natural-Fiber Reinforced Composites with Electromagnetic Interference Shielding Properties by Incorporating Powdered Activated Carbon" Materials 9, no. 1: 10. https://doi.org/10.3390/ma9010010