2.1. Effects of Nb Concentration on Phase and Microstructure
Using transmission electron microscopy (TEM), selected area electron diffraction (SAED) pattern analysis, and X-ray diffraction (XRD) analysis, the phases of cast alloys were characterized. The phases were identified by matching each characteristic peak with the JCPDS files (JCPDS card No.44-1294 for α-Ti) [
15].
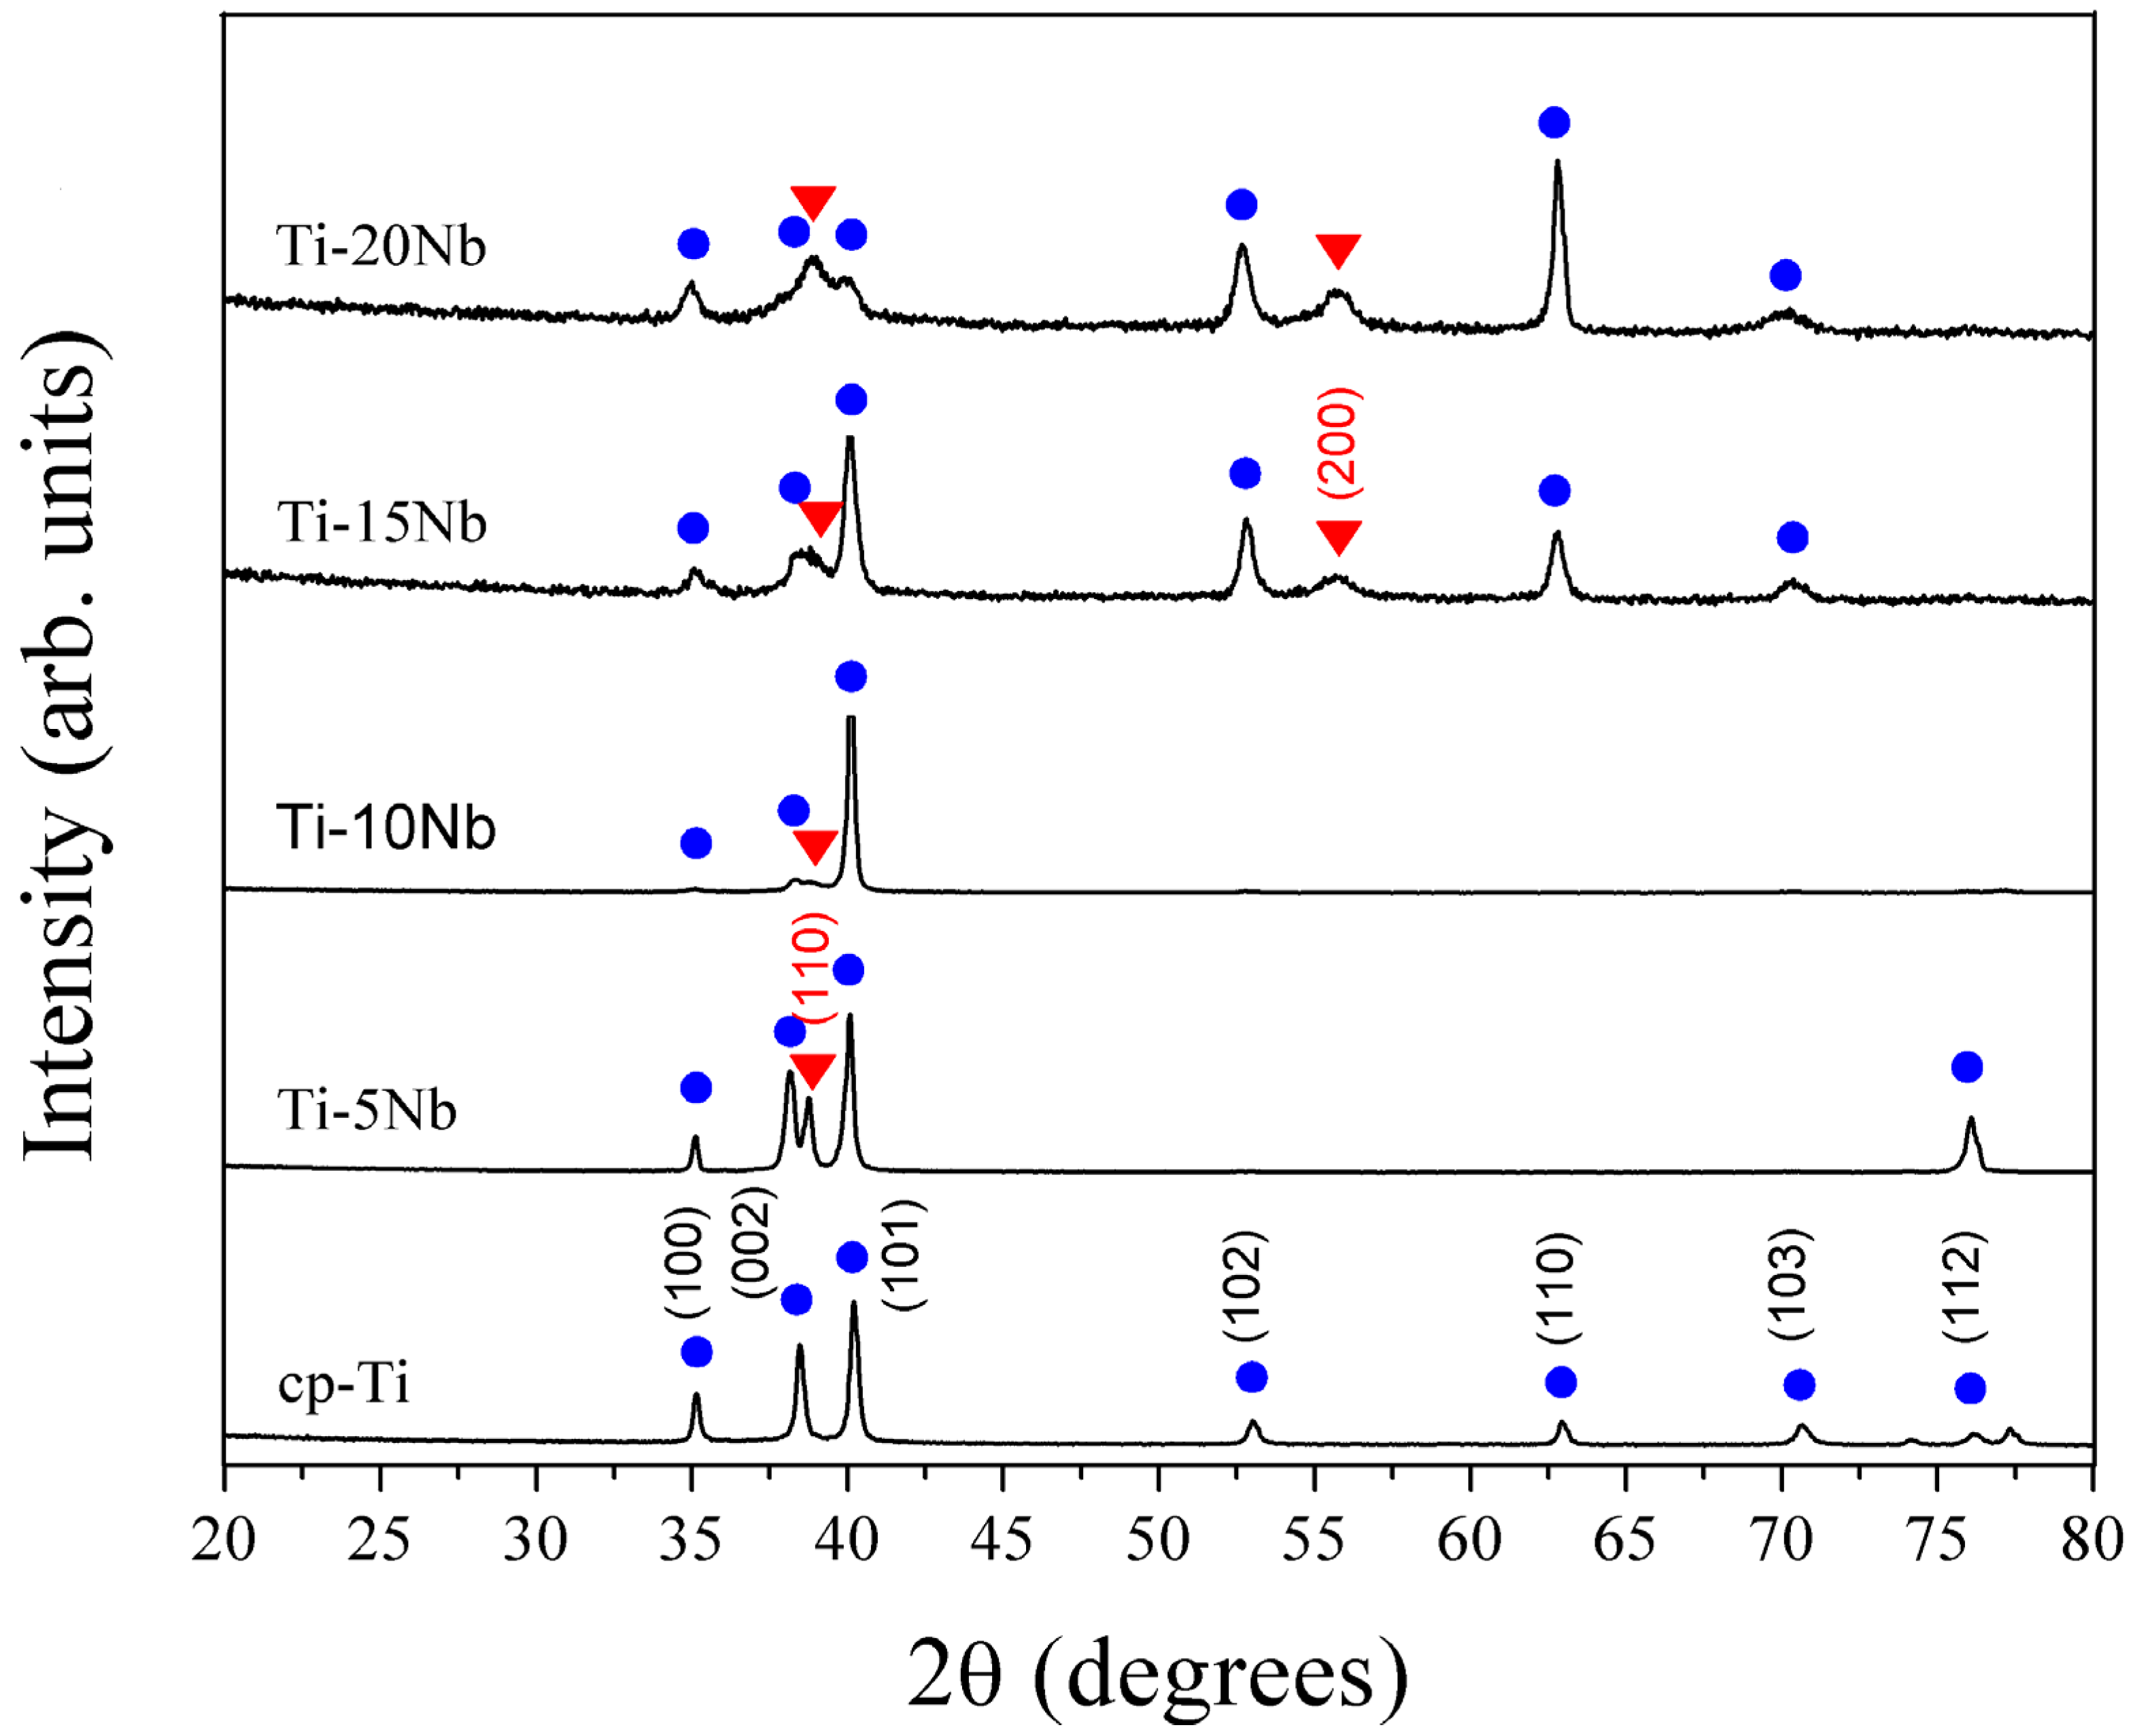
Figure 1 displays the XRD patterns for a series of Ti-xNb alloys compared with cp-Ti. The phase boundaries were in good agreement with the existing phase diagram [
16]. The XRD patterns of all alloys indicated the coexistence of both α and β phases. For the Ti-5Nb alloy, the main phase constituent was the α phase. The presence of Nb in the Ti-5Nb alloy caused an increase in lattice parameters of the α phase (P6
3/
mmc,
a = 2.9554(1),
c = 4.7207(1) Å). The primary α phase peak increased as Nb content increased to 10 wt %. When Nb content increased over 10 wt %, the α phase peak diminished gradually. It was reported that both the β phase and the ω phase were formed in the binary Ti-Nb systems with Nb content of 12–32 wt %, and the ω phase had a highly distorted transitional hexagonal structure [
17]. However, the possible presence of the ω phase was not detected in the XRD profile due to the detection limit of the XRD instrument. The ω phase was easily detected by TEM and is discussed in greater detail in later sections.
Figure 1.
XRD patterns of cast cp-Ti and the series of binary Ti-xNb alloys. The hexagonal Ti and cubic β-Ti peaks are marked with • and ▼ symbols, respectively.
Figure 1.
XRD patterns of cast cp-Ti and the series of binary Ti-xNb alloys. The hexagonal Ti and cubic β-Ti peaks are marked with • and ▼ symbols, respectively.
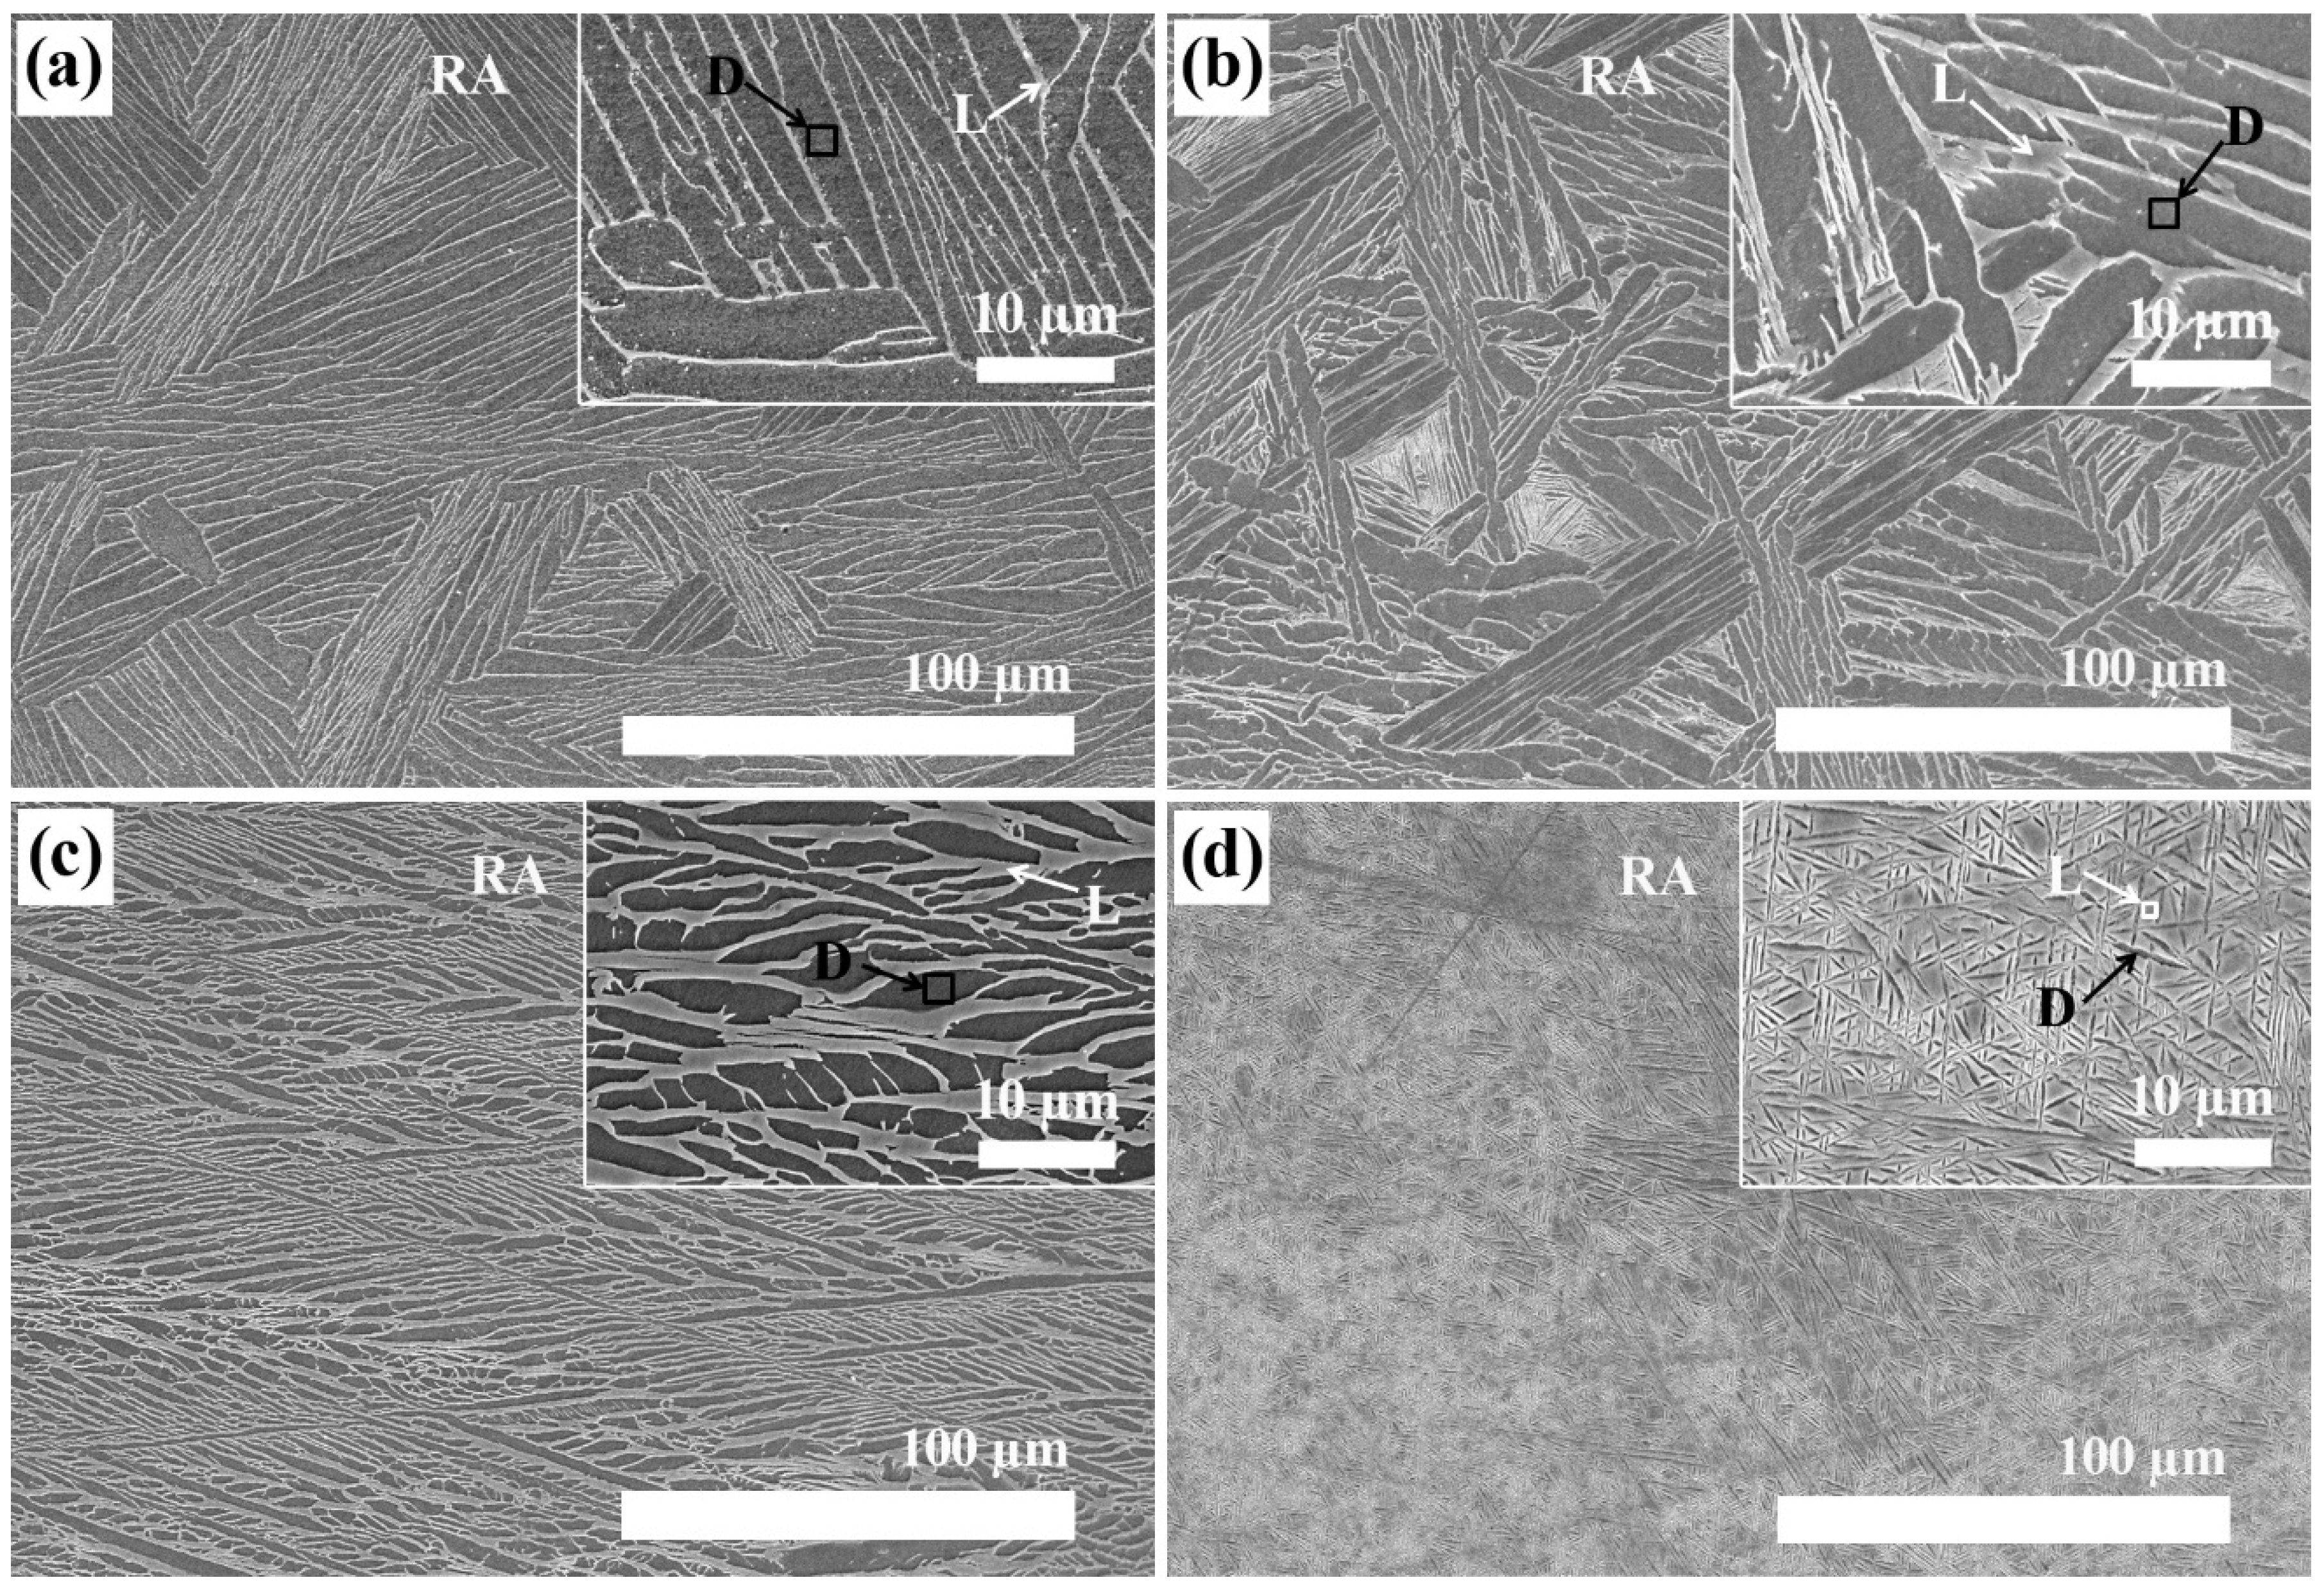
The SEM images of Ti-xNb with differing Nb content (5, 10, 15, and 20 wt %) are shown in
Figure 2. Microstructural examination showed that significant amounts of β phase existed in all samples, and this finding was in agreement with phase identification by XRD. As can be seen in
Table 1, the light and dark regions displayed the Nb-rich phase and the Ti matrix, respectively, in SEM images of polished surfaces shown in
Figure 2a–d. The Ti matrix and the Nb-rich phase were analyzed using an energy dispersive X-ray (EDX) detector attached to the SEM. The Ti-5Nb alloy exhibited typical lath type morphology, while the Ti-20Nb alloy showed an entirely acicular structure. In the selected rectangular area (RA), the Nb weight percentage in the Ti-xNb alloys was similar to the nominal wt % of Ti-xNb alloys (
Table 1). As the content of Nb in Ti-xNb alloys increased, the weight percentages of Nb in the light region increased from 12.4 to 27.7 wt %, and those in the dark region increased from 3.6 to 8.9 wt %.
Figure 2.
Low-magnification and higher-magnification (inset) SEM images of (a) Ti-5Nb; (b) Ti-10Nb; (c) Ti-15Nb; and (d) Ti-20Nb alloys. (RA: rectangular area, 250 µm × 170 µm, D: dark region, L: light region).
Figure 2.
Low-magnification and higher-magnification (inset) SEM images of (a) Ti-5Nb; (b) Ti-10Nb; (c) Ti-15Nb; and (d) Ti-20Nb alloys. (RA: rectangular area, 250 µm × 170 µm, D: dark region, L: light region).
Table 1.
EDX (energy dispersive X-ray) analysis results obtained from selected areas in
Figure 2 (
n = 5).
Table 1.
EDX (energy dispersive X-ray) analysis results obtained from selected areas in Figure 2 (n = 5).
| Element | Weight Percentage (wt%) |
|---|
| Ti-5Nb | Ti-10Nb | Ti-15Nb | Ti-20Nb |
|---|
| RA | D | L | RA | D | L | RA | D | L | RA | D | L |
|---|
| Ti | 94.7 (0.2) | 96.4 (0.5) | 87.6 (0.8) | 89.1 (0.4) | 95.3 (0.7) | 77.3 (1.4) | 83.7 (0.4) | 94.4 (0.5) | 73.1 (0.7) | 79.1 (0.7) | 91.1 (0.8) | 72.3 (0.7) |
| Nb | 5.3 (0.2) | 3.6 (0.5) | 12.4 (0.8) | 10.9 (0.4) | 4.7 (0.7) | 22.7 (1.4) | 16.3 (0.4) | 5.6 (0.5) | 26.9 (0.7) | 20.9 (0.7) | 8.9 (0.8) | 27.7 (0.7) |
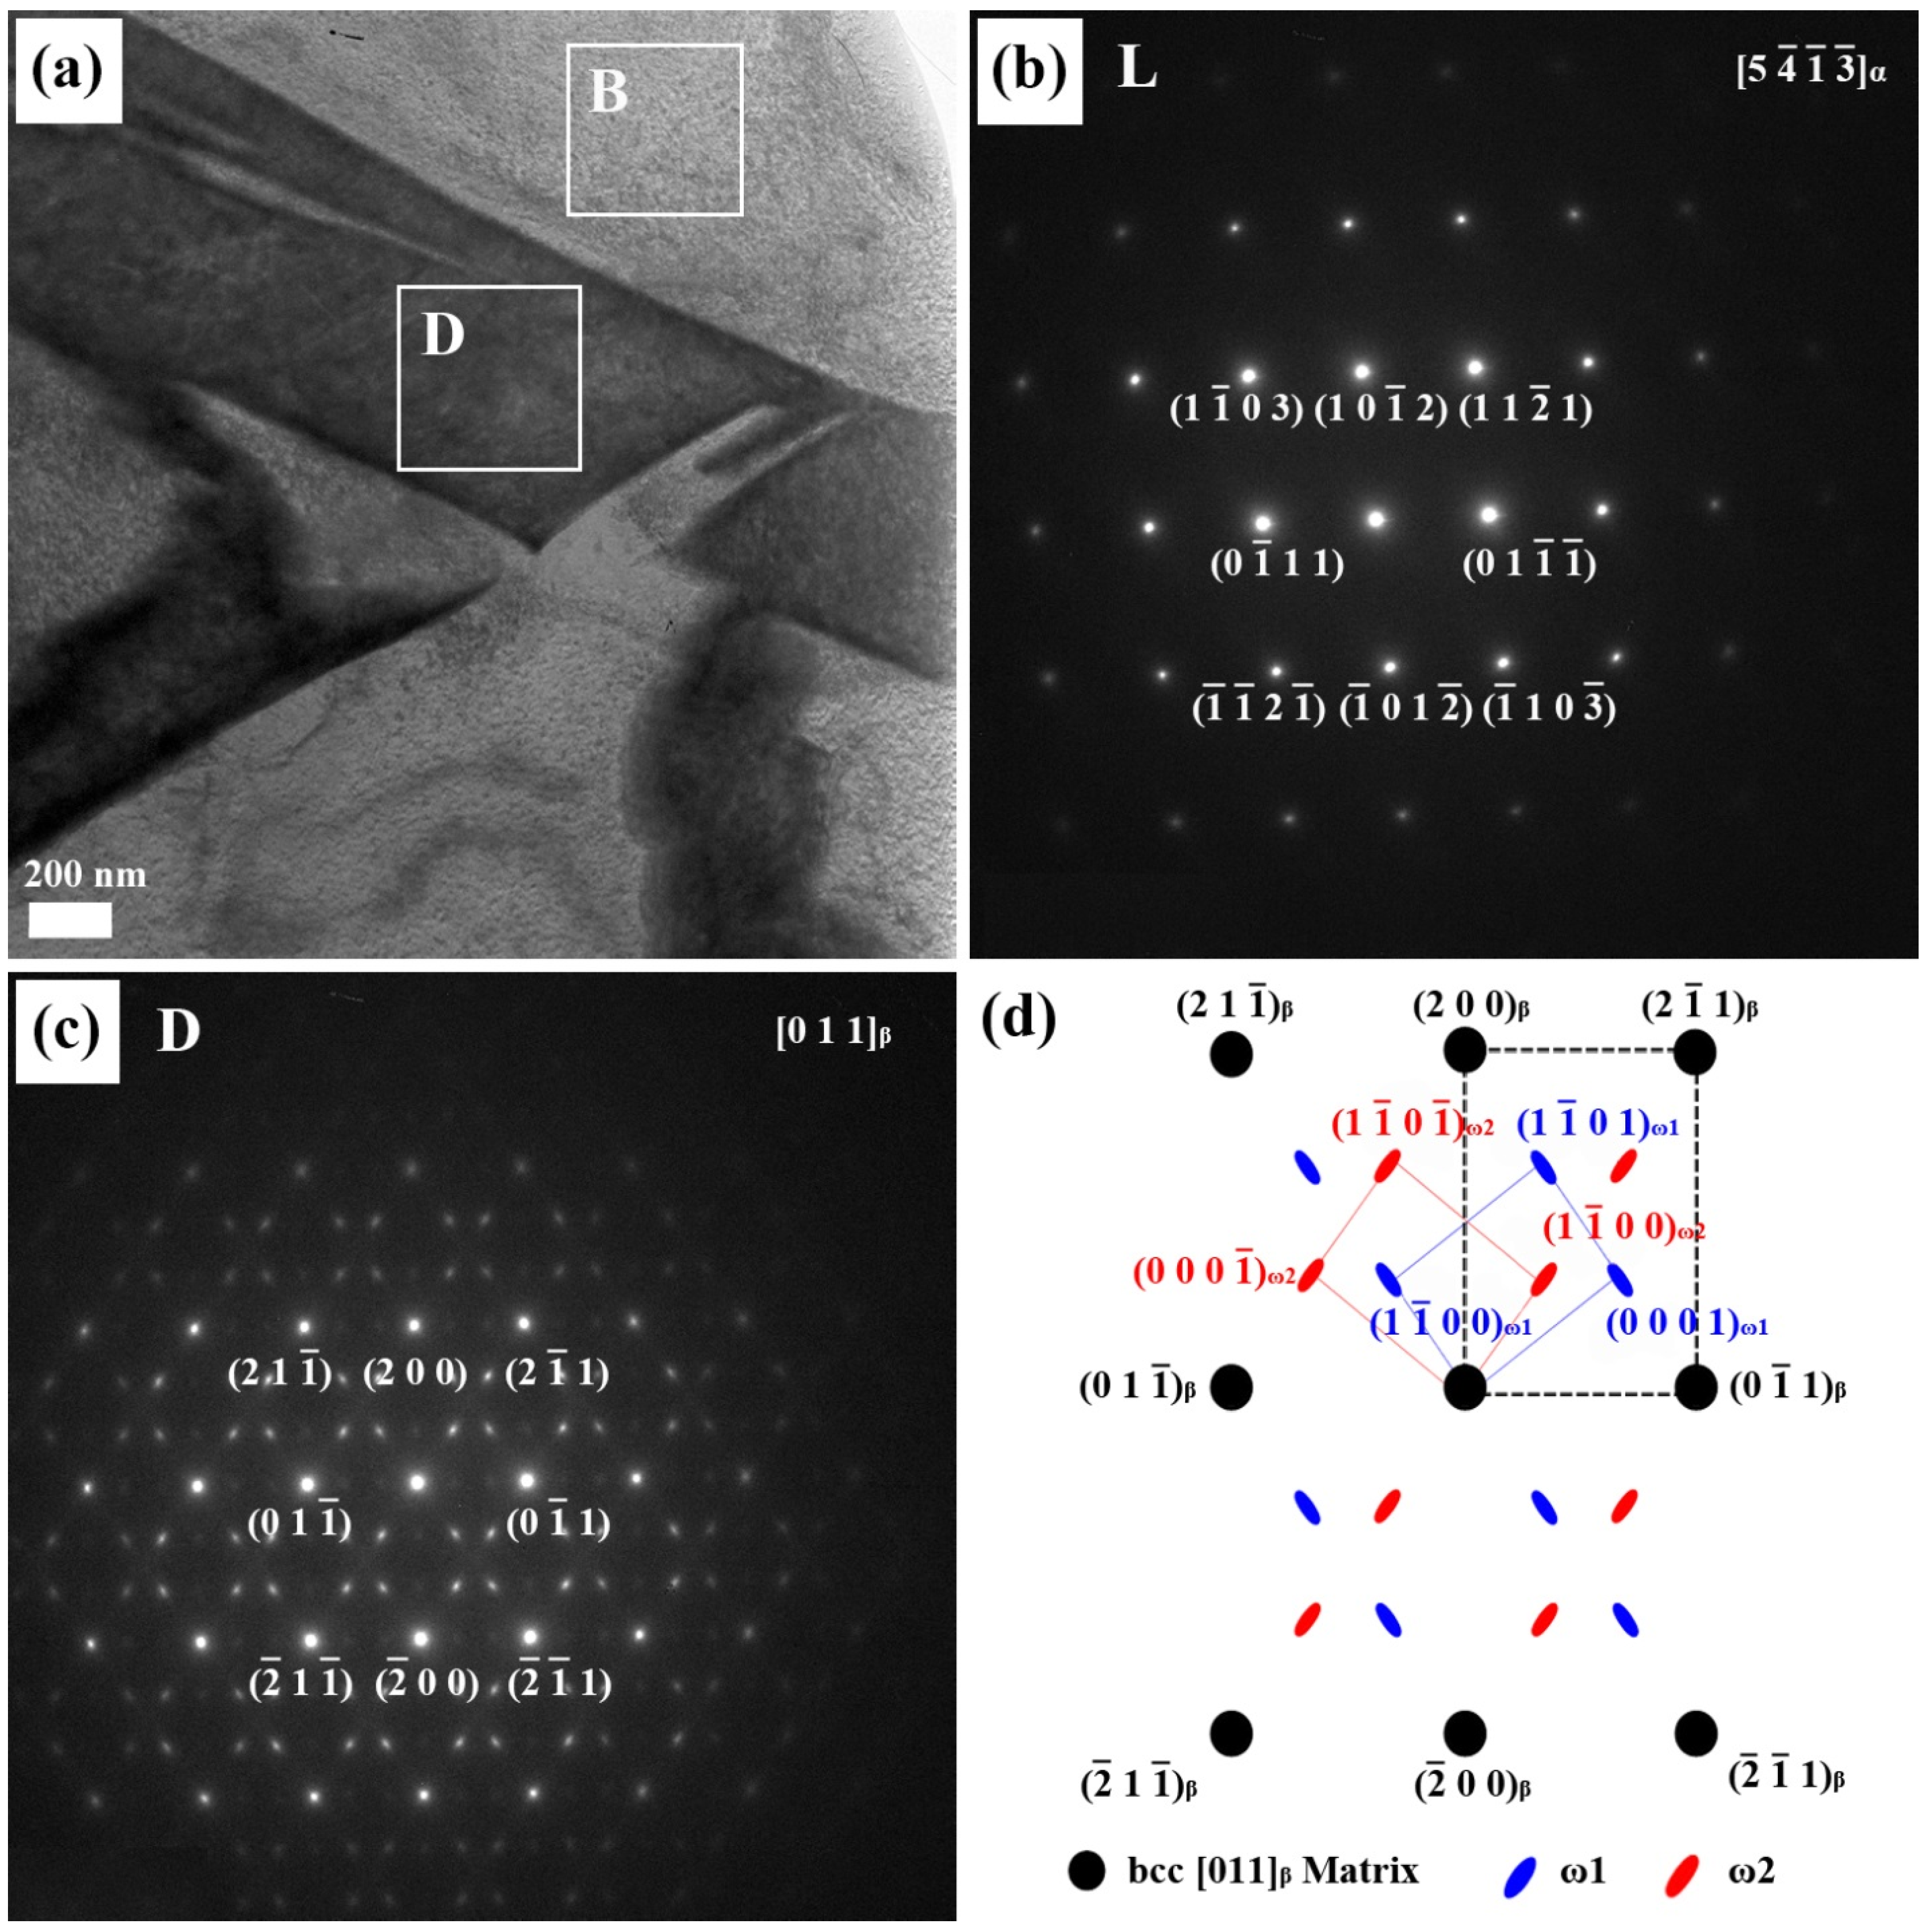
In order to understand the relationship between the microstructure and mechanical properties of Ti alloyed with Nb, microstructural observations were carried out using a high resolution transmission electron microscope (HR-TEM). As Nb content increased in the Ti-xNb alloys, the proportion of the α phase decreased gradually. The Ti-xNb alloys (x = 10, 15, and 20 wt %) were comprised of α, β, and ω phases, while the Ti-5Nb alloy was comprised of α and β phases. Although the ω phase was hardly detected by XRD, it was easily identified by TEM. The typical bright-field TEM image of the Ti-10Nb alloy, along with SAED patterns obtained from respective phases, is shown in
Figure 3. Similar morphology to the Ti-10Nb alloy was also observed in the Ti-15Nb alloy. The bright regions in
Figure 3a correspond to the α phase. The corresponding SAED pattern is shown in
Figure 3b, which could be indexed in terms of
α zone axis of a hexagonal structure. The dark area represents the Nb-rich phase. The corresponding SAED pattern is shown in
Figure 3c. A strong spot in the corresponding SAED pattern is obtained from the [011]
β zone axis of the matrix phase. Apart from the β phase spots, several weak diffuse diffraction spots were obtained from
]
ω zone axis; one set was indexed as ω
1 and the other was assigned as ω
2 [
18]. The orientation relationship between the ω phase and the β phase was thus deduced as
ω//[011]
β.
Figure 3.
(a) The bright-field TEM image of the Ti-10Nb alloy; (b) the corresponding selected-area electron diffraction (SAED) patterns from the bright area (B); (c) the SAED patterns from the dark area (D); and (d) the key diagram of (c).
Figure 3.
(a) The bright-field TEM image of the Ti-10Nb alloy; (b) the corresponding selected-area electron diffraction (SAED) patterns from the bright area (B); (c) the SAED patterns from the dark area (D); and (d) the key diagram of (c).
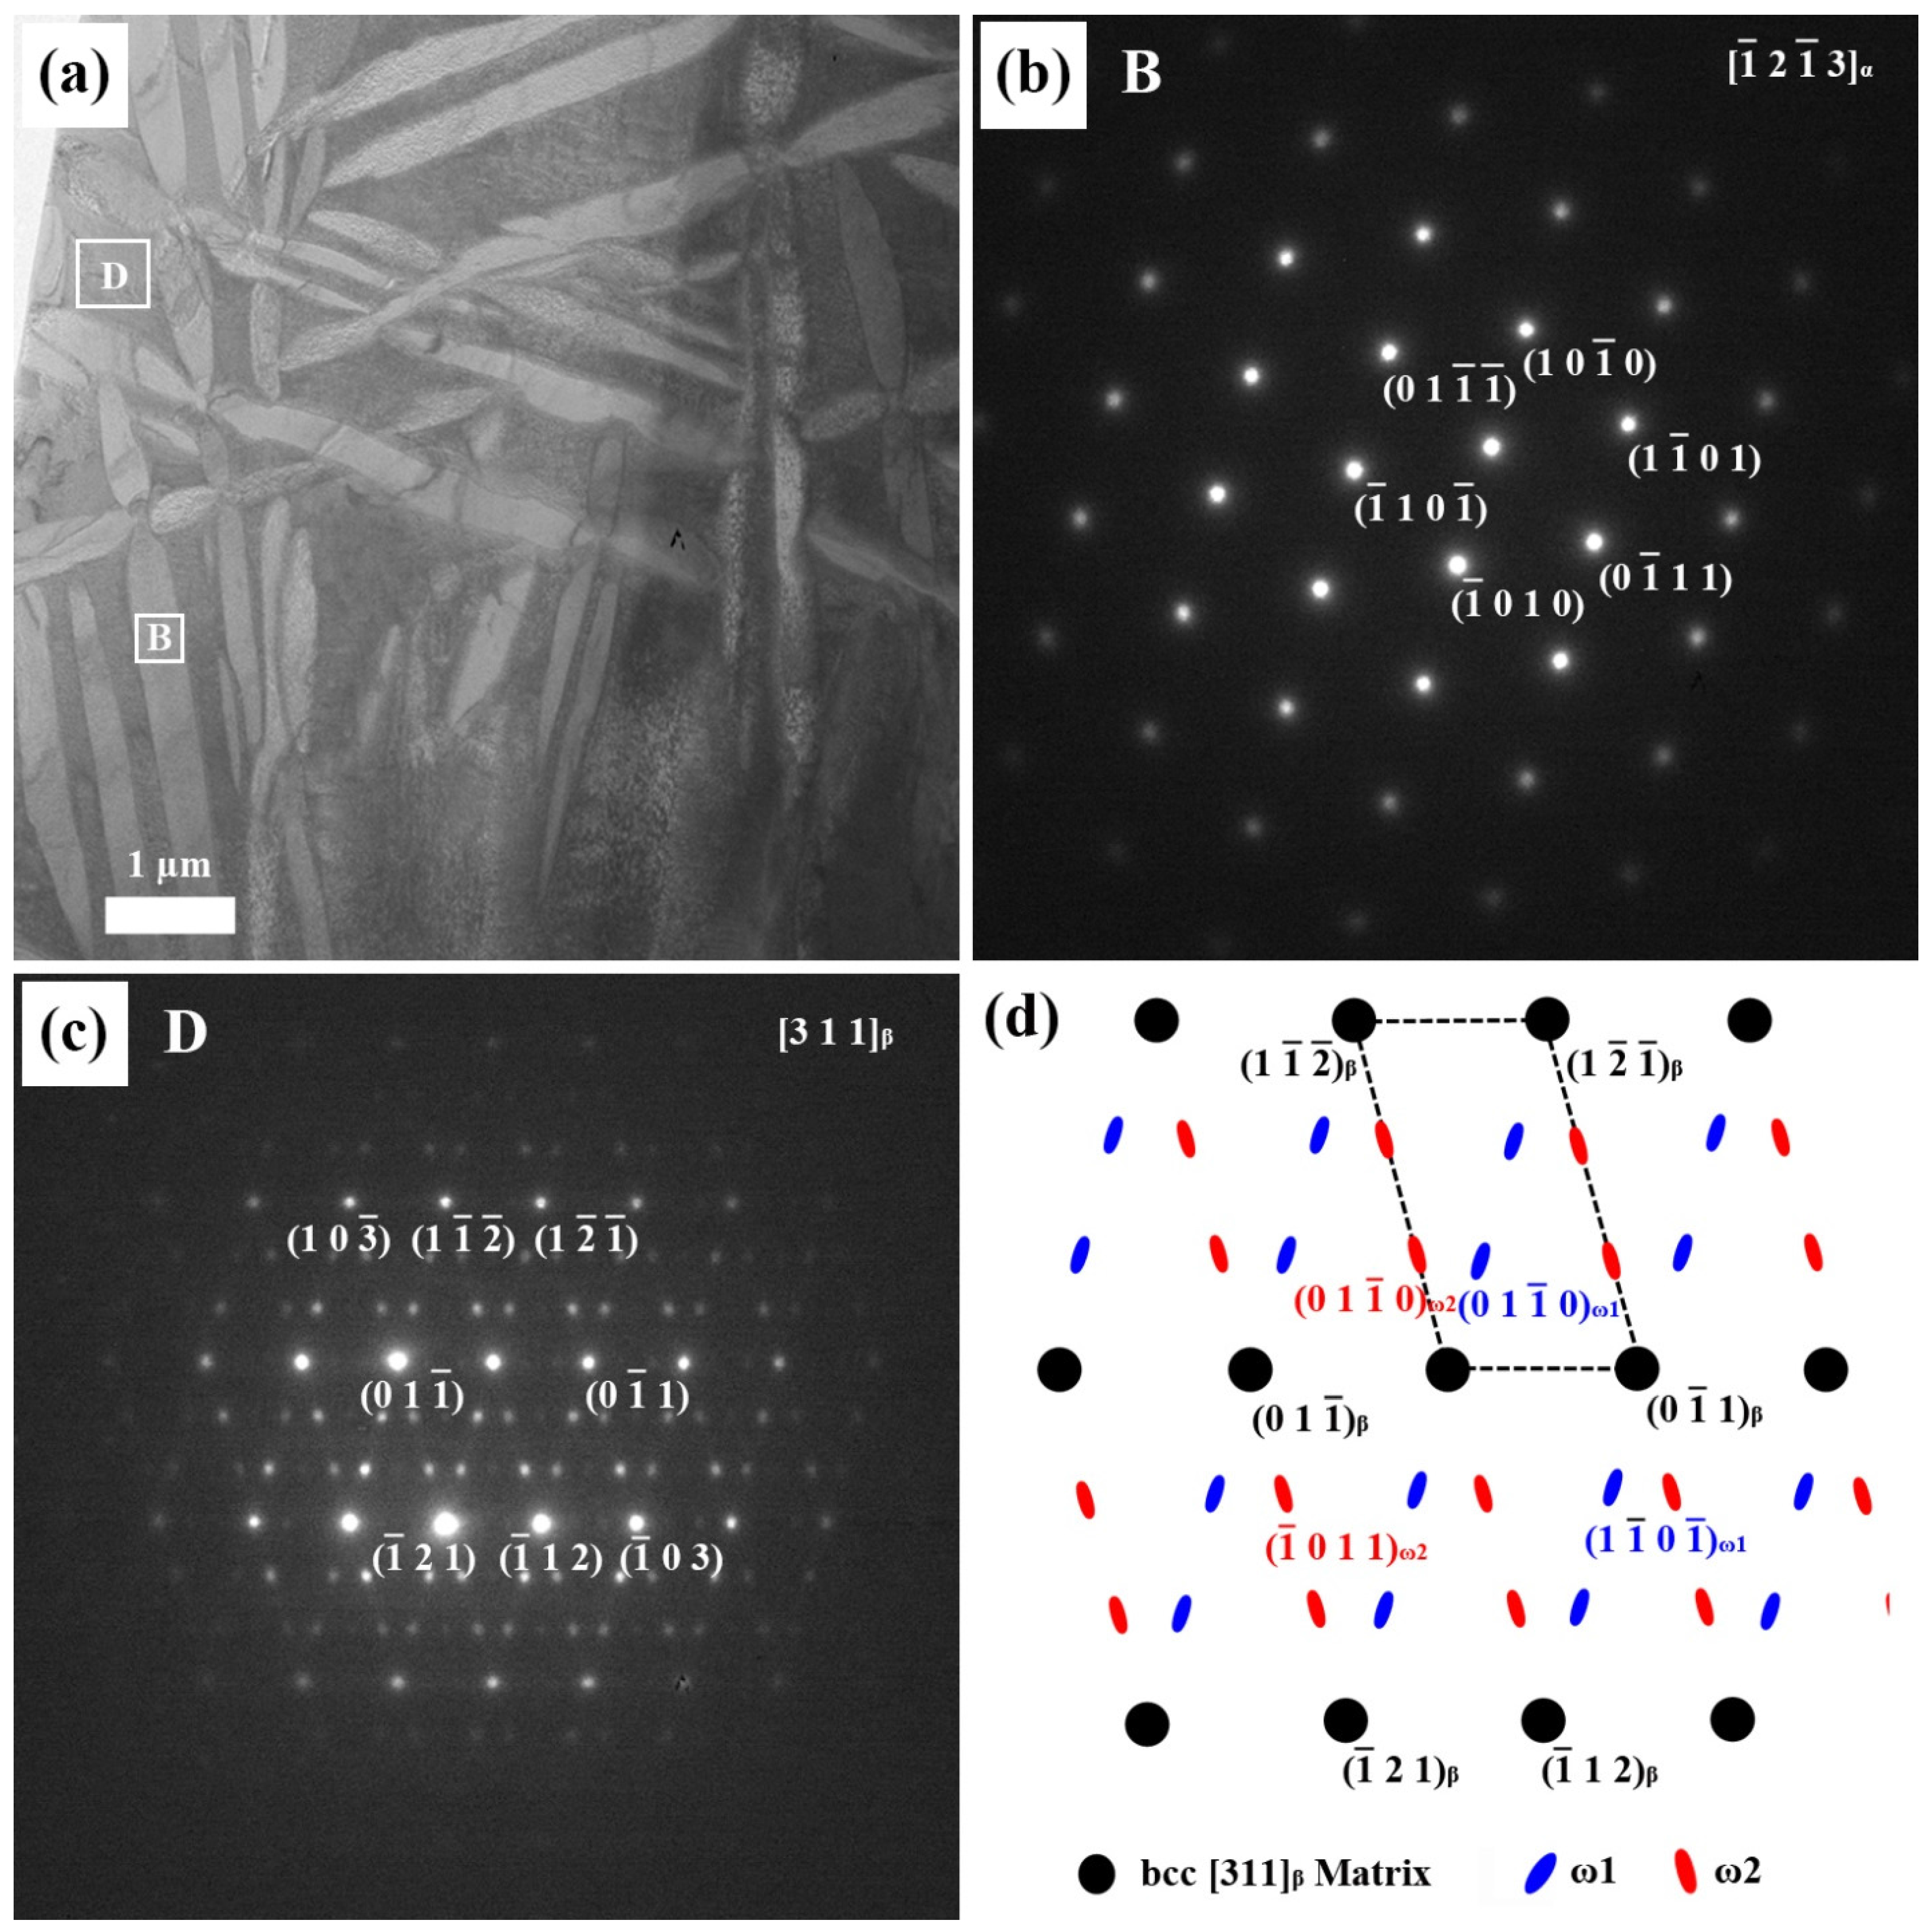
Similar behavior was observed in the Ti-20Nb alloy, as shown in
Figure 4. In this case, the orientation of the α phase in Ti-20Nb was close to
]
α as shown in
Figure 4b. The dark area in
Figure 4a represents the Nb-rich phase, and its corresponding SAED patterns were obtained from the [311]
β zone axis and
ω zone axis. The ω spots were fainter and more diffuse than the β spots. The observed orientation relationship was
ω//[311]
β, which is consistent with previous reports [
19,
20].
Figure 4.
(a) The bright-field TEM image of the Ti-20Nb alloy; (b) corresponding selected-area electron diffraction (SAED) pattern from the bright area (B); (c) SAED pattern from the dark area (D); and (d) the key diagram of (c).
Figure 4.
(a) The bright-field TEM image of the Ti-20Nb alloy; (b) corresponding selected-area electron diffraction (SAED) pattern from the bright area (B); (c) SAED pattern from the dark area (D); and (d) the key diagram of (c).
2.2. Effects of Nb Concentration on the Mechanical Properties
Phase transformation behaviors of the Ti-xNb alloys were measured by using differential scanning calorimetry (DSC). It was found that Nb addition was effective in decreasing the β-transus temperature. In the case of pure Ti, the phase transformation from α to β phase occurred at about 882 °C. The β-transus temperature of the Ti-15Nb alloy was 777 °C, whereas that of Ti-20Nb alloys was 734 °C. This result implies that Nb addition to the Ti alloy acted as a β stabilizer, thus lowering the β-transus temperature.
We investigated the effects of alloying Nb on the mechanical properties and corrosion behavior of Ti.
Table 2 shows Vickers hardness and elastic modulus values for each Ti-xNb alloy in comparison with those of cp-Ti. All of the Ti-xNb alloys had higher Vickers hardness values (
p < 0.05) than that of cp-Ti (165 VHN). The Ti-5Nb alloy with α + β phases exhibited a hardness value of 358 VHN, higher than that of cp-Ti due to the solid solution strengthening by Nb addition. As Nb content increased from 5 to 10 wt %, the Ti-10Nb alloy showed decreased hardness, since the fraction of the β phase decreased in the α + β phases. The reduction of the β phase in Ti-10Nb alloy was an unexpected result. This point would need further study to examine the phase transition under various conditions of cooling after heat treatment. The Ti-15Nb alloy exhibited the highest hardness value of 413 VHN. This increase in hardness could be attributed to the increase in the β phase and the strengthening effect of the ω phase [
16]. A similar result was observed in the study by Lee
et al. [
21]. When Nb content increased from 15 wt % to 20 wt %, the hardness of the Ti-20Nb alloy decreased to 332 VHN. In addition to high strength, a low modulus is essential for many load-bearing implant materials, because using implant materials with lower moduli (closer to that of human bone) can reduce the stress shielding effect [
22]. Compared to the elastic modulus of the cp-Ti, that of the Ti-5Nb alloy was reduced due to the presence of the β phase. The increase in the elastic modulus of the Ti-10Nb alloy was related to the appearance of the ω phase in the microstructure. The values for Ti-xNb (x = 5, 10, 15, and 20) alloys were in the range of 114–149 GPa. Among the Ti-xNb alloys tested, Ti-10Nb and Ti-15Nb exhibited the highest and the lowest elastic modulus, respectively.
Table 2.
Vickers hardness and elastic modulus values of Ti-xNb alloys and cp-Ti (n = 5).
Table 2.
Vickers hardness and elastic modulus values of Ti-xNb alloys and cp-Ti (n = 5).
| Alloy Code | Vickers Hardness ± SD * (VHN) | Elastic Modulus ± SD (GPa) |
|---|
| cp-Ti | 165 ± 4 a* | 132 ± 12 a |
| Ti-5Nb | 358 ± 27 b | 127 ± 7 c |
| Ti-10Nb | 338 ± 24 c | 149 ± 6 a |
| Ti-15Nb | 413 ± 21 a | 114 ± 5 b |
| Ti-20Nb | 332 ± 13 c | 127 ± 5 a |
For clinical use in dentistry, alloys must be able to bond to dental porcelains. It is known that Ti reacts strongly with gaseous elements such as oxygen at high temperature. The resultant Ti produces an excessively thick layer of TiO
2, resulting in inadequate metal-ceramic bond strength [
23]. The mismatch of the thermal expansion coefficient of titanium and ceramic may also affect the bond strength of the titanium ceramic system [
23]. For proper bonding, the thickness of the metal oxide layer should be controlled and the thermal expansion coefficient of titanium should be compatible with that of the ceramic.
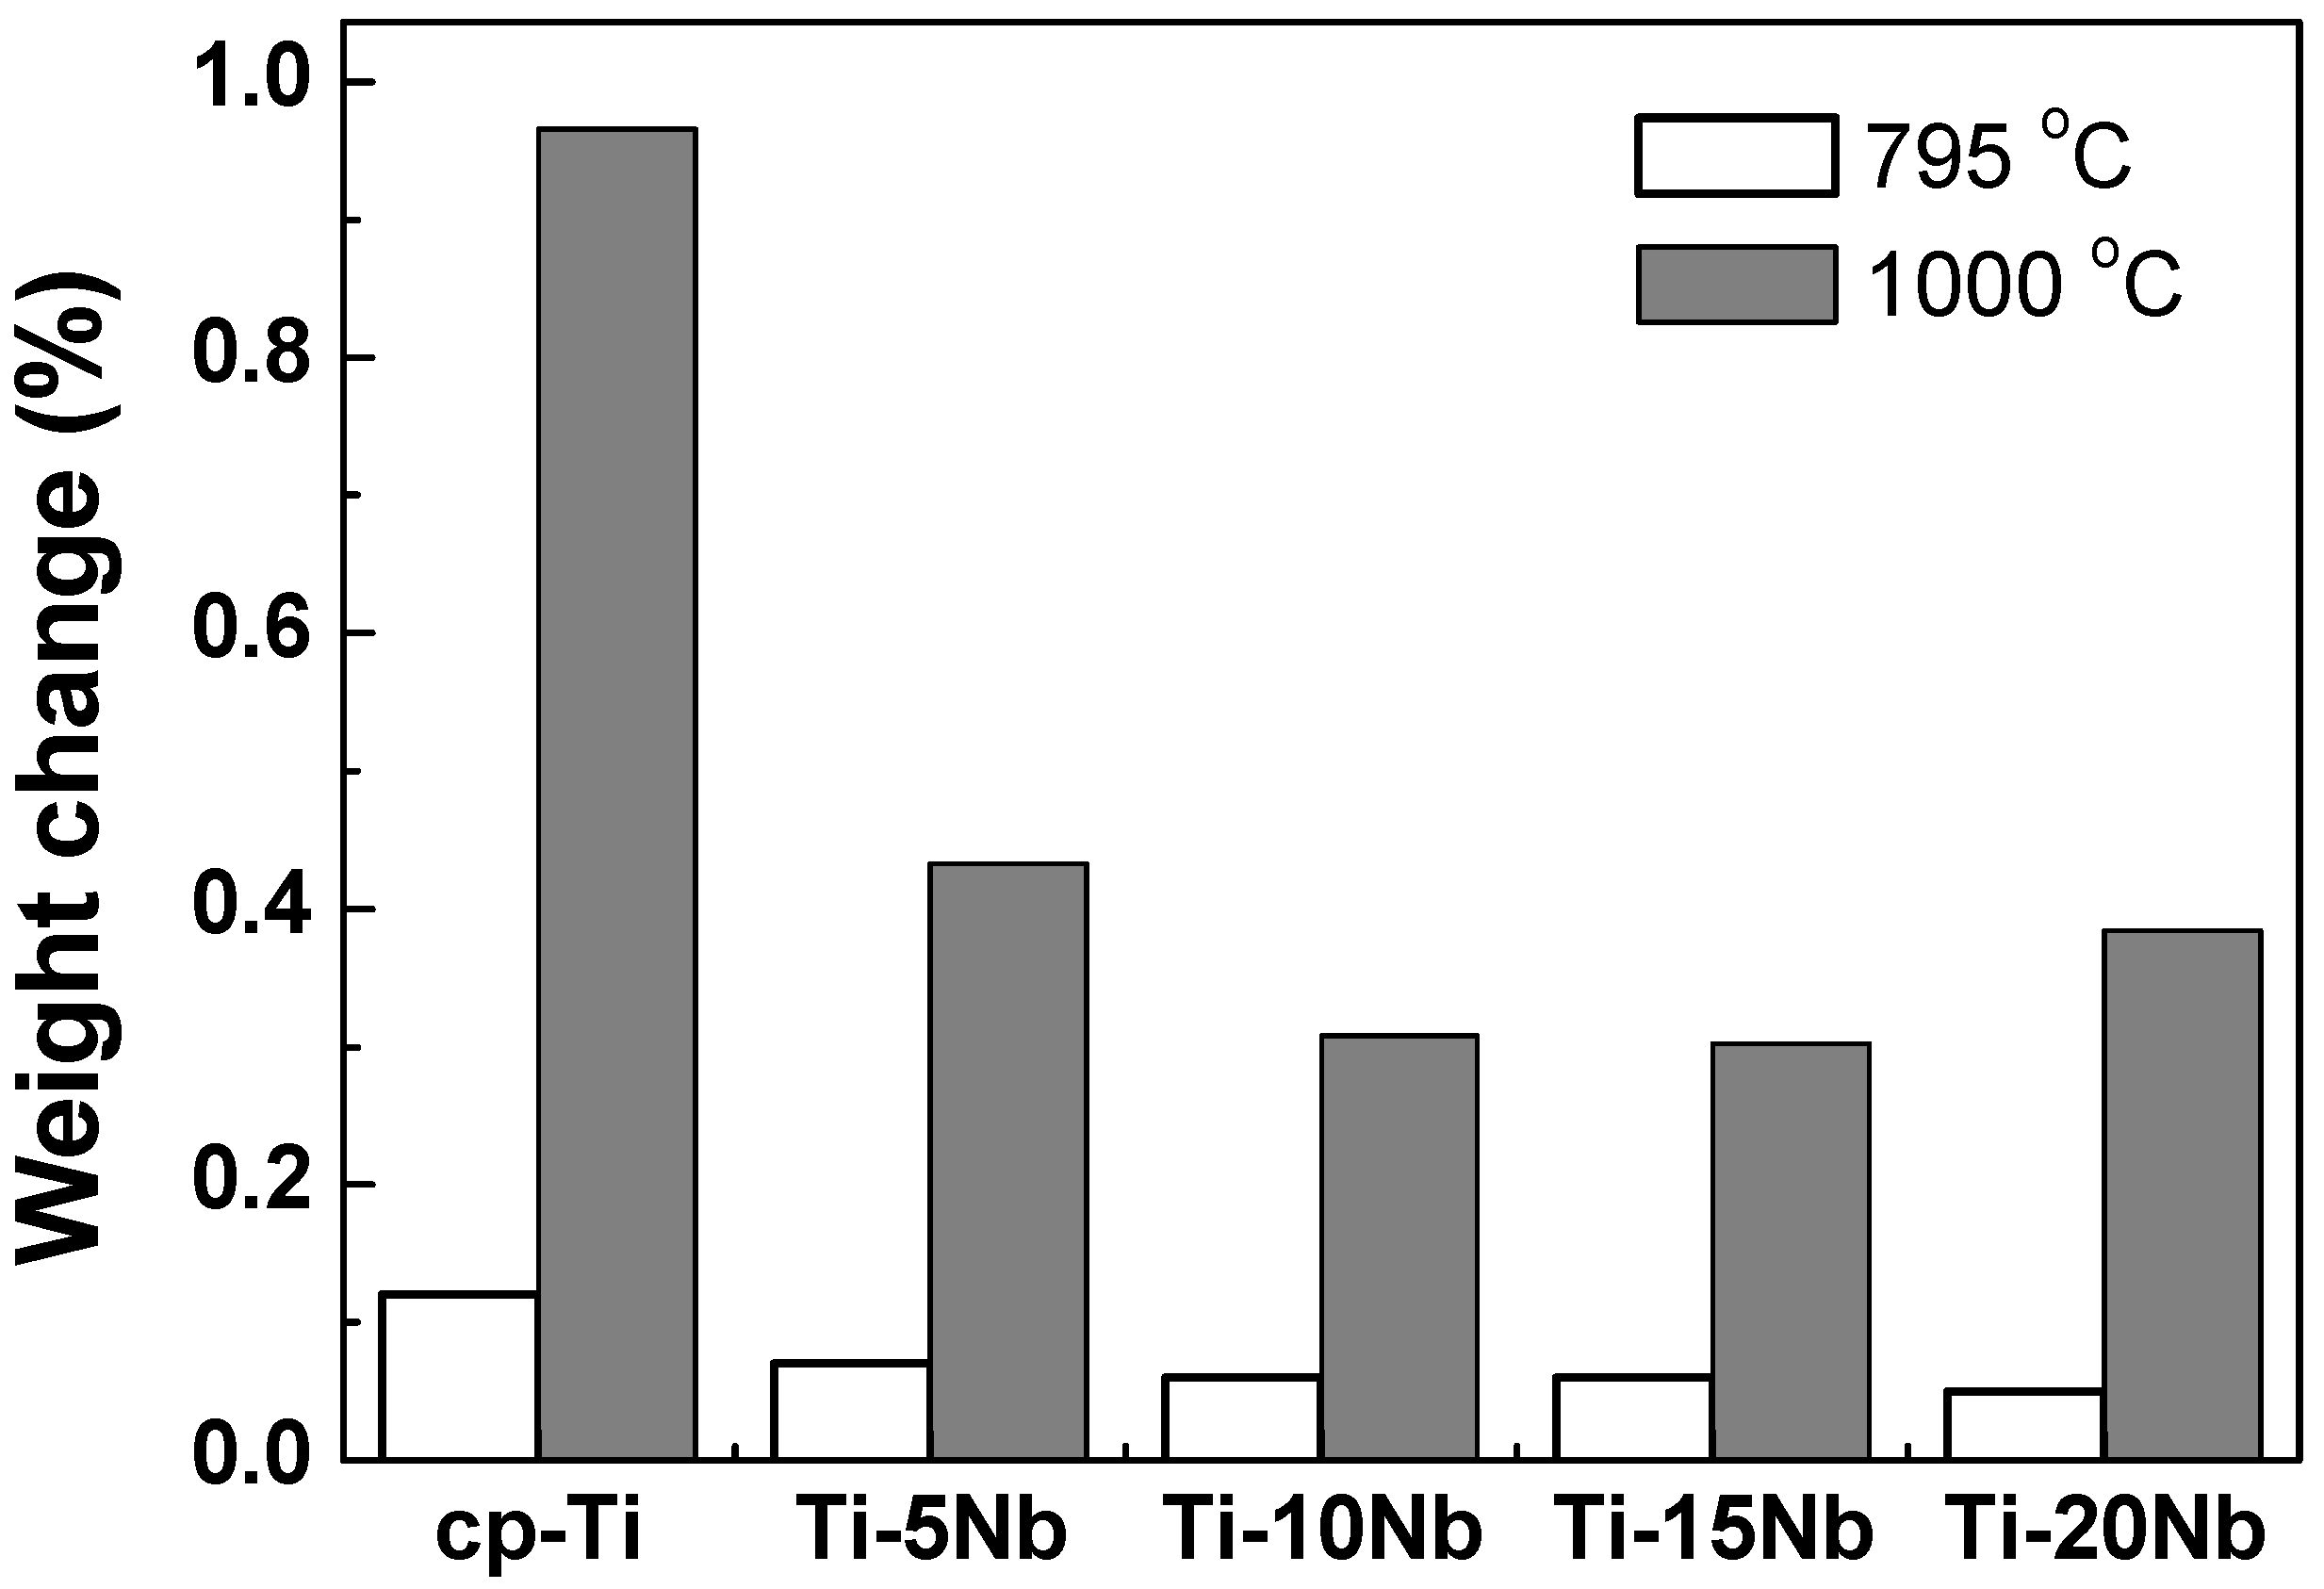
The oxidation behavior of Ti-xNb alloys was assessed using thermogravimetric analysis (TGA).
Figure 5 shows the result of the TGA experiment when the cp-Ti and Ti-xNb alloys were heated up to 795 °C and 1000 °C at a heating rate of 10 °C/min in air. Each of the samples was oxidized, and the weight gain was compared with that of the non-oxidized samples. All of the samples showed a single parabolic increase in mass during oxidation. All of the cp-Ti and Ti-xNb alloys had low mass changes (0.008–0.01 wt %) from room temperature to 580 °C. At a temperature higher than 580 °C, both cp-Ti and Ti-xNb alloys were rapidly oxidized, resulting in a significant increase in mass. All of the Nb containing samples showed a weight gain of about 0.1%–0.2% at a temperature of 795 °C, whereas at a temperature of 1000 °C, significant increases in mass of 0.4%–0.5% were observed. However, the final changes in the mass of Ti-xNb alloys were significantly less than that for the oxidation of cp-Ti, indicating that Nb addition to cp-Ti may restrict the oxidation rate of the alloy, and that Ti-xNb alloys show high oxidation protection ability. Weight gain decreased as Nb content increased.
Figure 5.
TGA analysis of cp-Ti and Ti-xNb alloys showing various degrees of weight gain (%) by heating in air.
Figure 5.
TGA analysis of cp-Ti and Ti-xNb alloys showing various degrees of weight gain (%) by heating in air.
Thermal expansion coefficients (TEC) of Ti alloys with 5 and 20 wt % of Nb content were measured in the temperature range of 30–500 °C and compared with that of cp-Ti. The TEC of the ceramic used in this experiment was 8.6 × 10
−6 °C
−1. The TEC of cp-Ti (9.5 × 10
−6 °C
−1, 30–500 °C) was in agreement with the previously reported value (9.9 × 10
−6 °C
−1, 25–550 °C) [
24]. The TEC of Ti-xNb was slightly lower than that of cp-Ti. The TEC values of Ti-5Nb and Ti-20Nb alloys in the temperature range of 30–500 °C were 9.35 × 10
−6 °C
−1 and 9.37 × 10
−6 °C
−1, respectively. The value of 0.5 × 10
−6 °C
−1 has been proposed as the acceptable difference in TEC between two materials [
25]. Thus, alloying Ti with Nb was effective in reducing internal stress because these alloys had lower thermal expansion coefficients than cp-Ti.
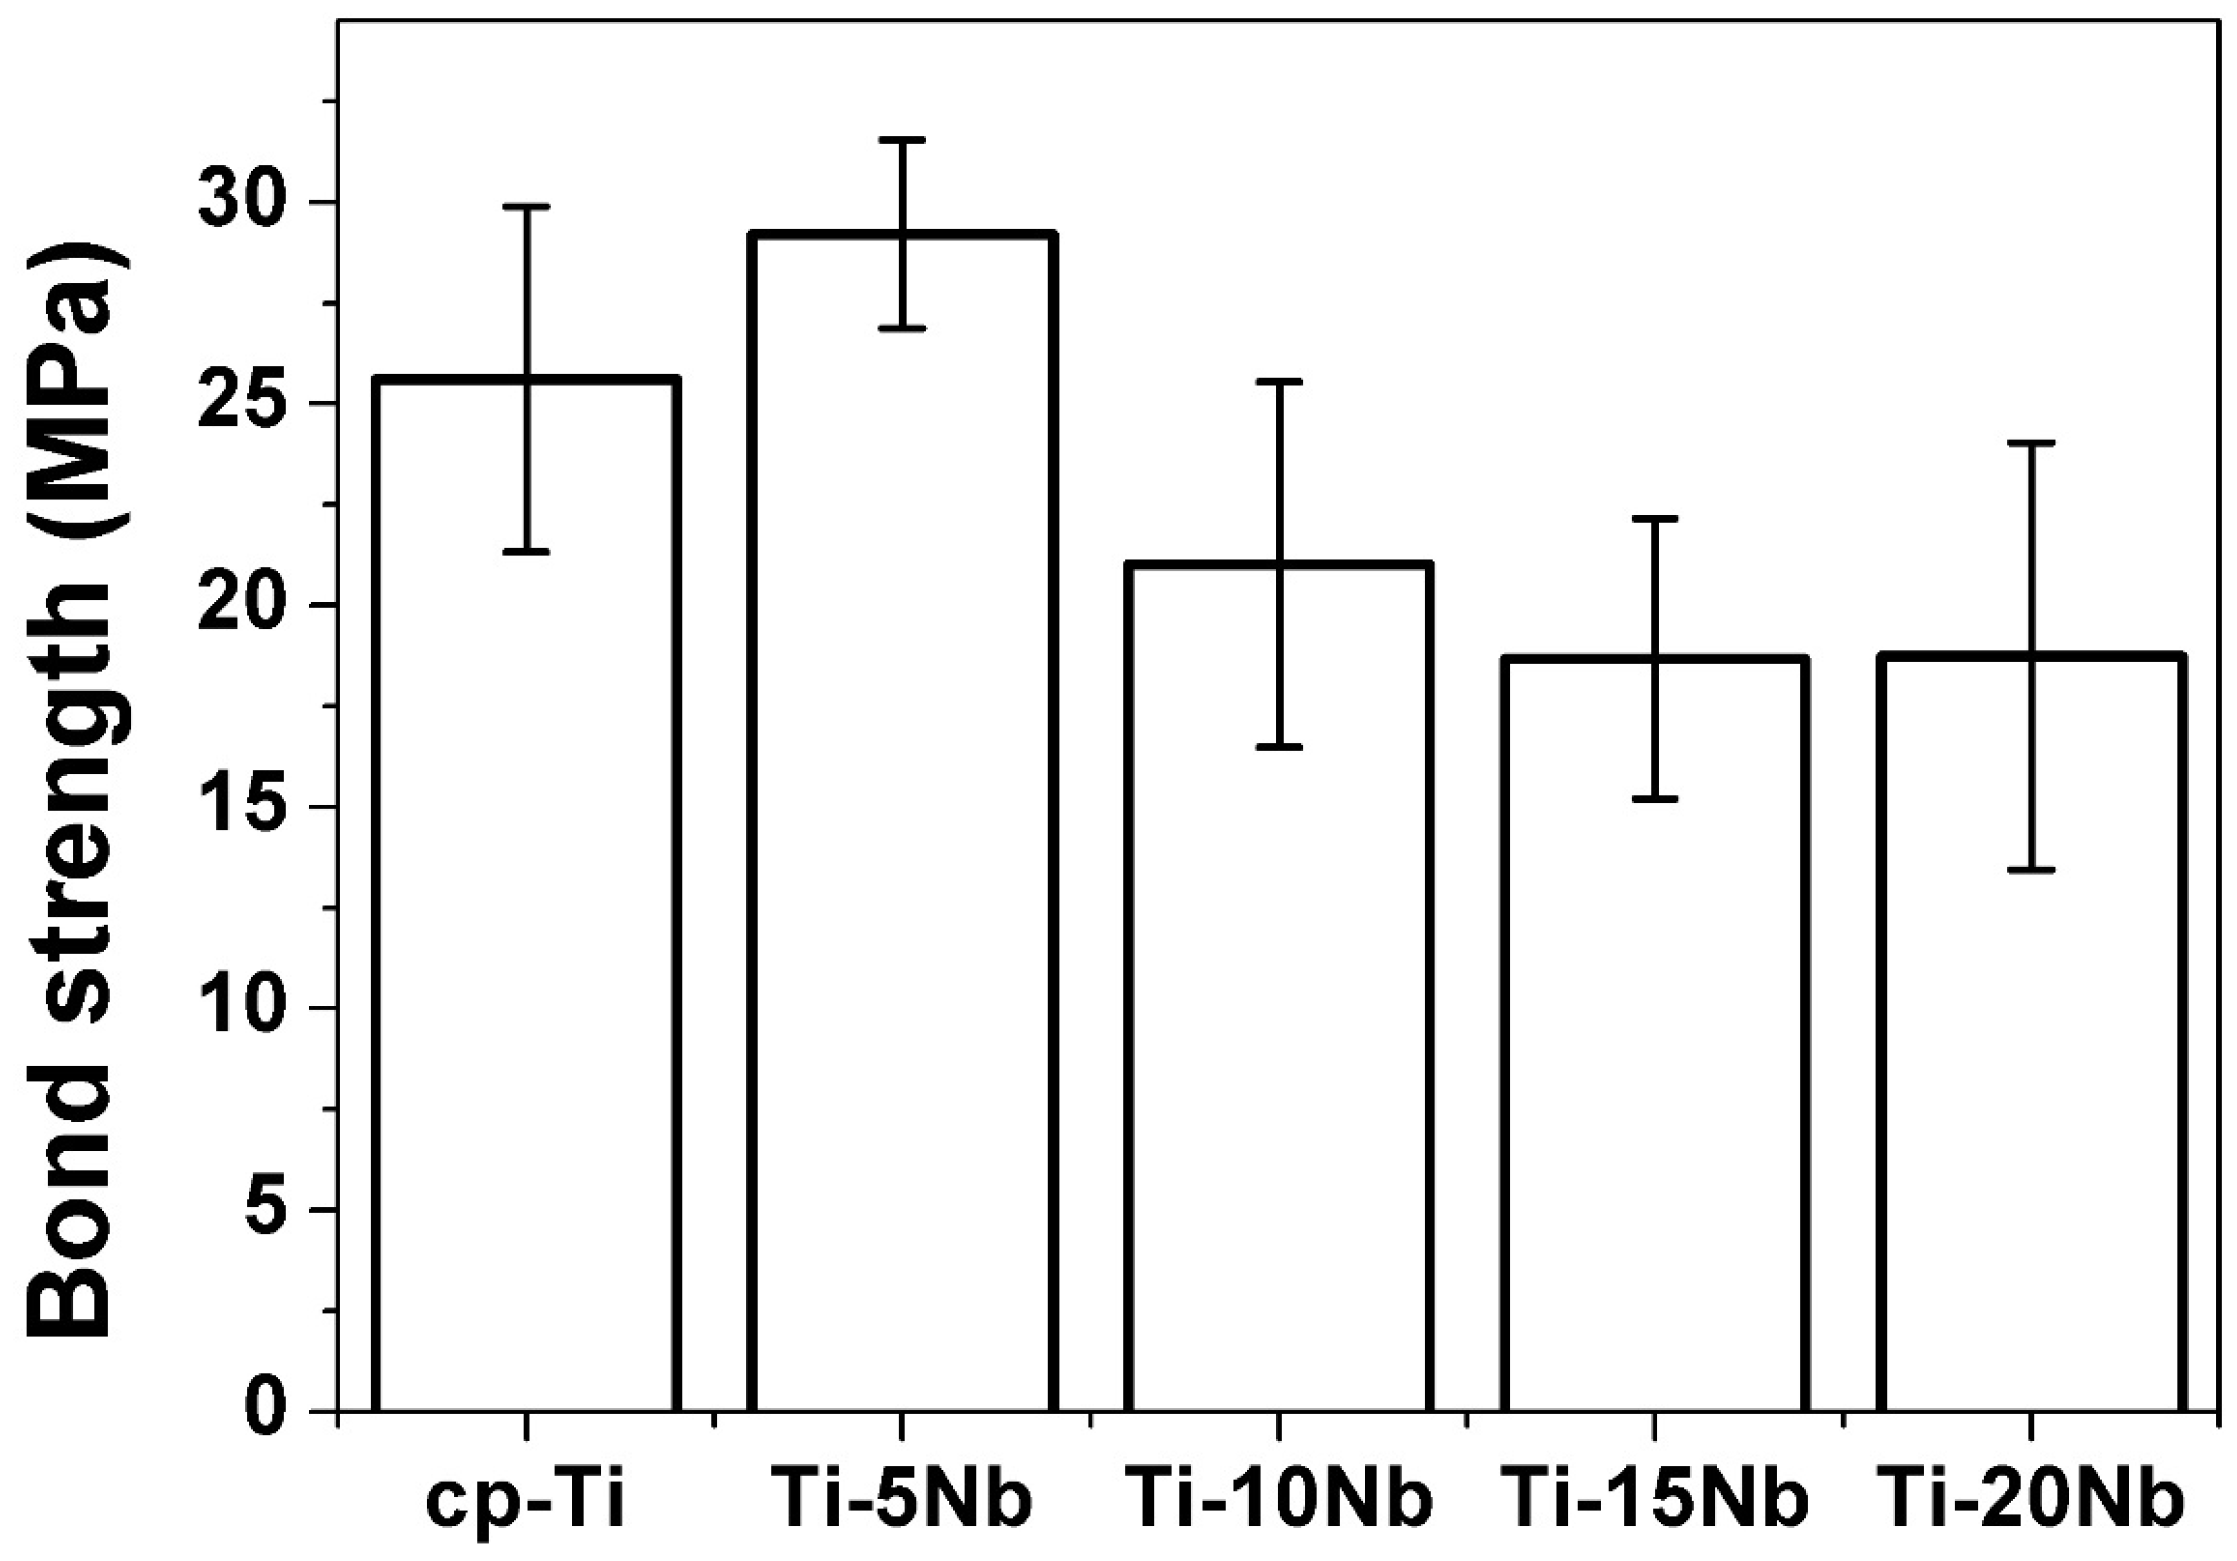
The bonding strengths of cp-Ti and Ti-xNb alloys to ceramic were investigated using a three-point bending test, and the results are shown in
Figure 6. In the present study, the bond strength of cp-Ti was 25.6 MPa, which falls within the range of values reported by Pröbster
et al. (21.4–34.0 MPa) [
26]. Thus, the values determined in the present study can be considered to be reasonable. The bonding strength is affected by the characteristics of the surface oxide layer on cp-Ti and Ti-xNb alloys, and by the TEC value differences between substrate metal and ceramic coating material. The bond strength between Ti-5Nb and ceramic was 29.2 MPa, which was higher than the minimum value required according to the International Standard Organization (ISO) specification (25 MPa) [
27]. The higher bond strength of Ti-5Nb could be attributed to the lower TEC difference between the Ti-5Nb alloy and the ceramic coating material. The bond strength of the Ti-xNb alloys tended to decrease as Nb content increased up to 15 wt % even though statistical significance was not found.
2.3. Effects of Nb Concentration on Corrosion Behavior
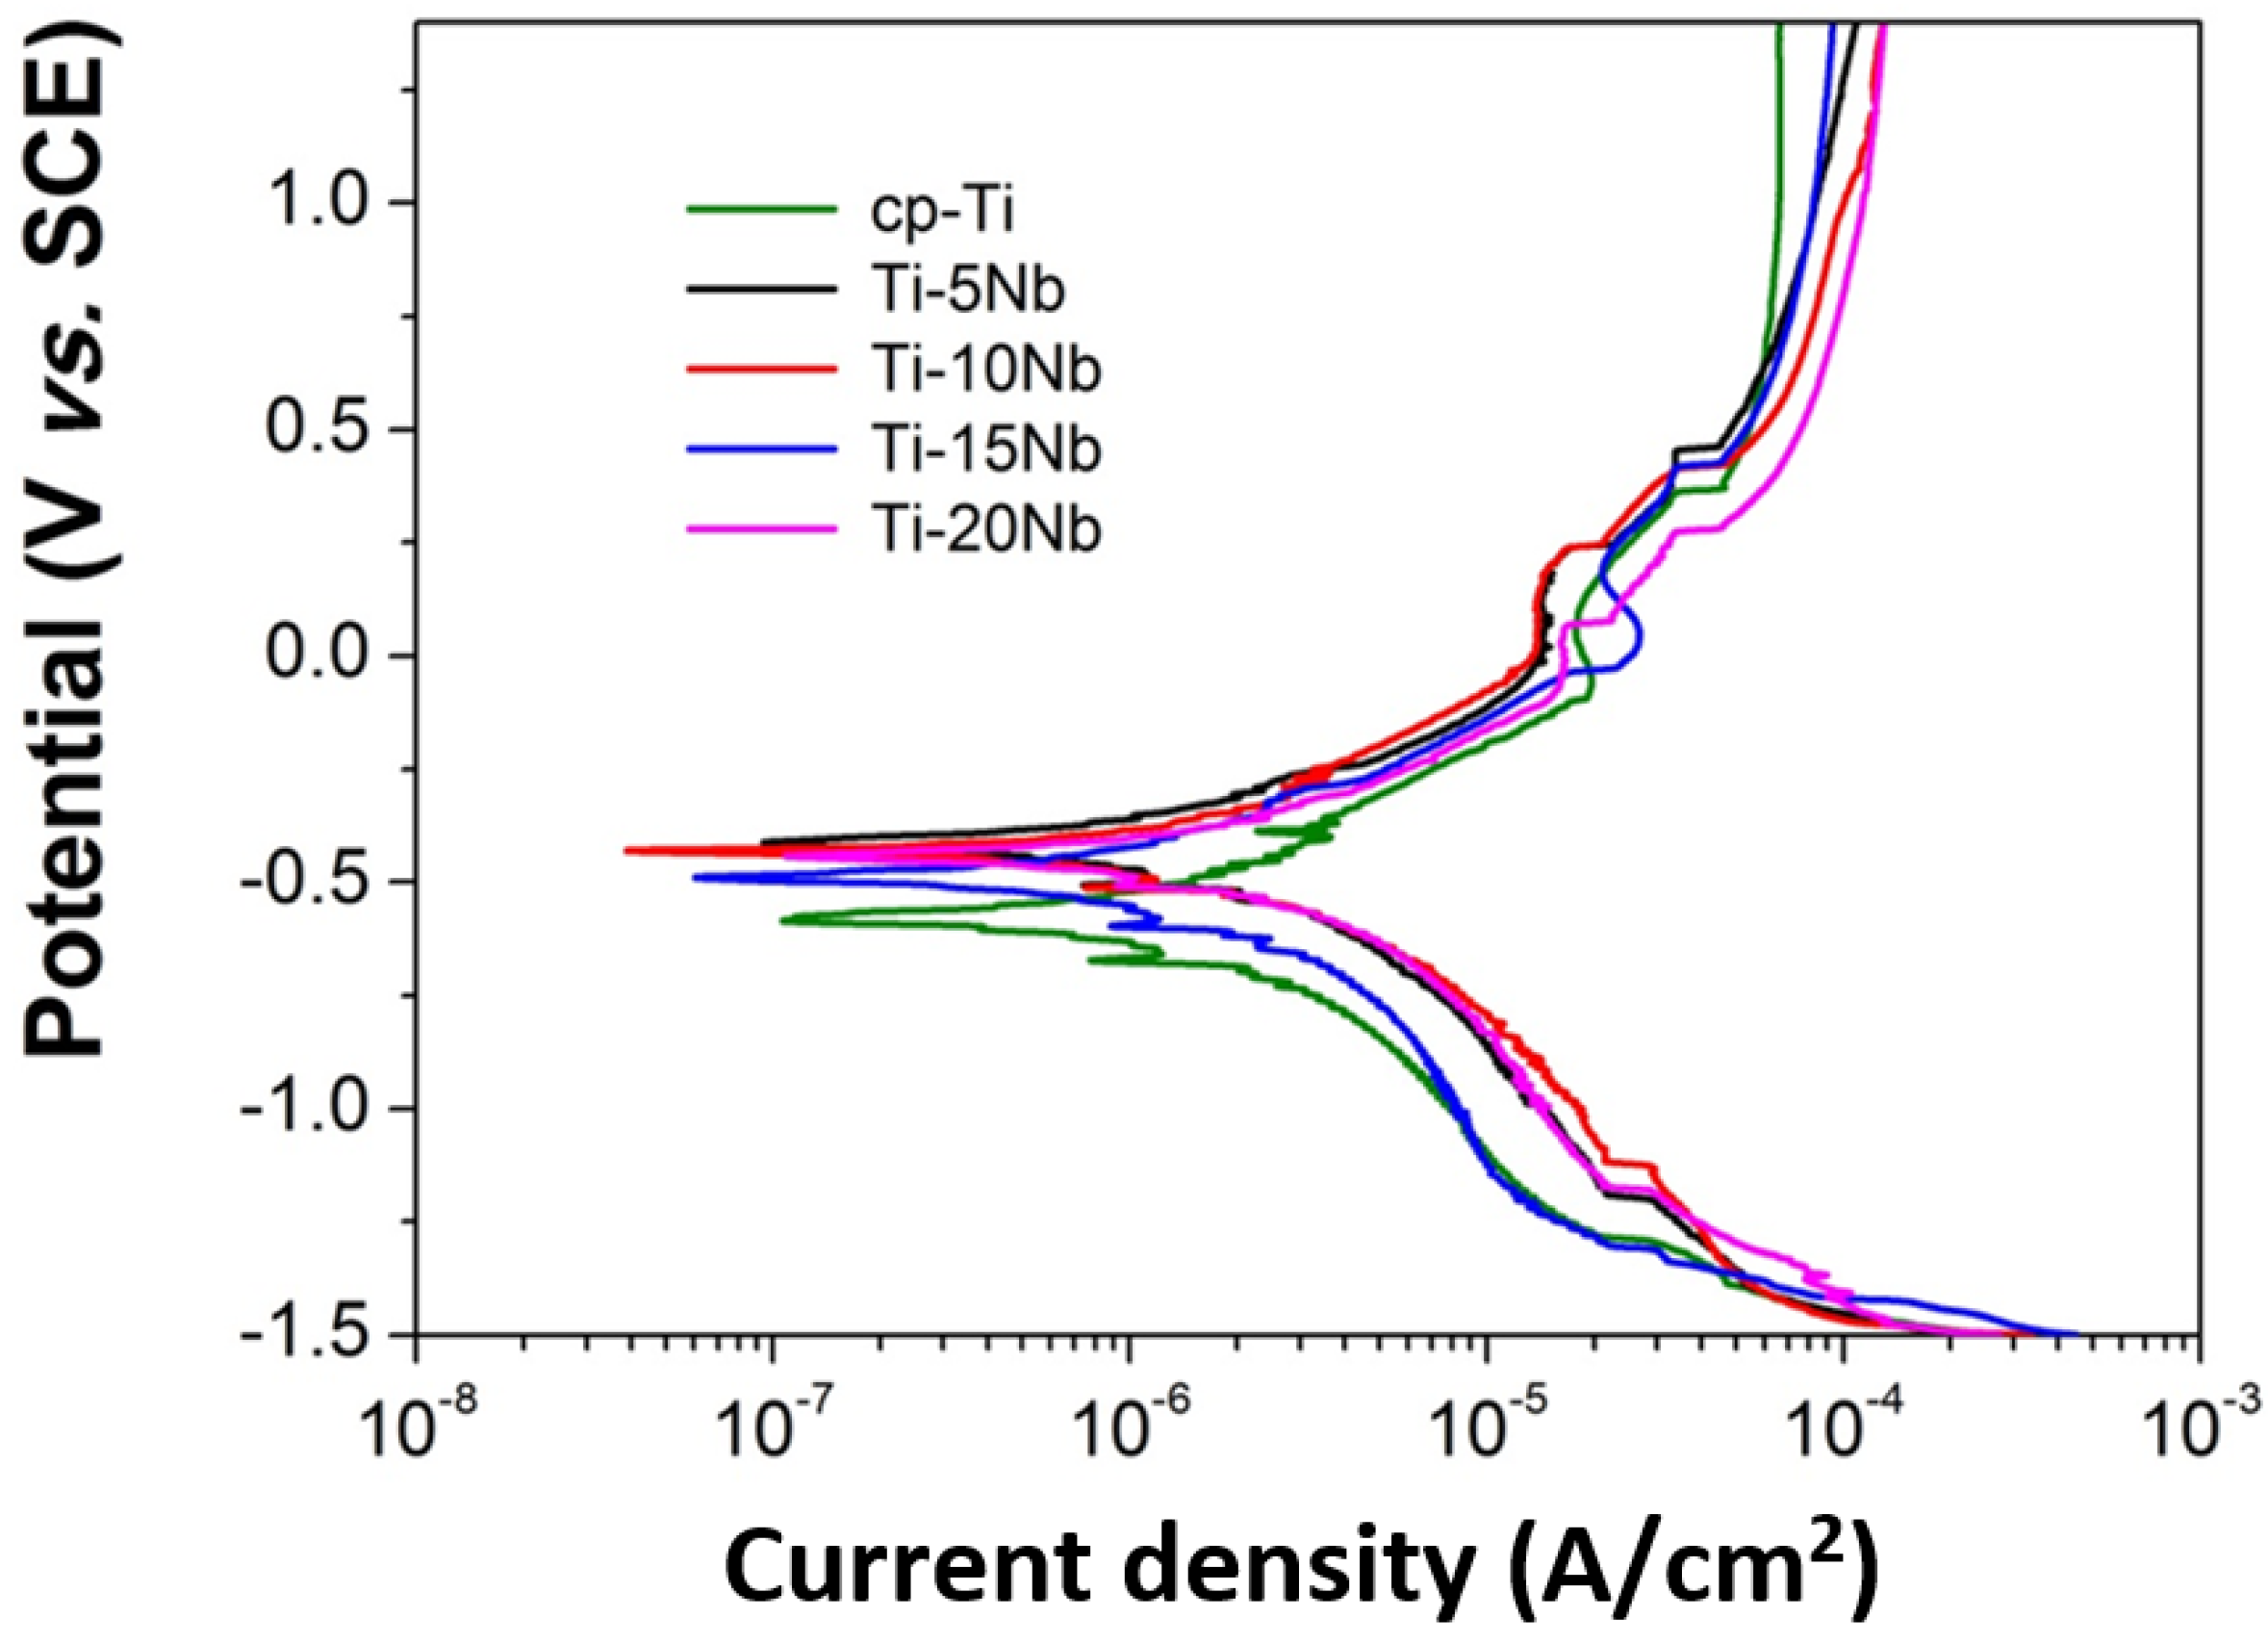
The corrosion behavior of the Ti-xNb alloys was evaluated using potentiodynamic polarization to investigate the effect of Nb content on the polarization curve in order to ascertain their suitability for dental implant applications. Potentiodynamic polarization curves of cp-Ti and Ti-xNb alloys were obtained in a potential range from –1.5 to +1.5 V in 0.9% NaCl solution and the results are shown in
Figure 7. All curves exhibited similar general features. Cathodic branches exhibited a current density that decreased as the applied potential increased. This was attributed to hydrogen evolution and/or oxygen reduction on the electrode surface. Anodic branches exhibited an active-passive transition in all cases, with apparently small current density oscillation. These regions may be associated with the formation of one or more protective films. It is known that the addition of a small amount of Pt or Pd to Ti is very effective in improving the corrosion resistance of titanium due to promotion of the active-passive transition by the enhanced cathodic reaction [
28]. The shift in the electrochemical potential of the Ti-xNb alloys could be explained in the same manner. Our experimental results showed a similar trend of a shift in electrochemical potential in the positive direction by addition of Nb to Ti, indicating a remarkable enhancement of corrosion resistance due to Nb addition [
29].
Figure 6.
Bond strength of cp-Ti and Ti-xNb alloys to the ceramic (n = 5).
Figure 6.
Bond strength of cp-Ti and Ti-xNb alloys to the ceramic (n = 5).
Figure 7.
Representative potentiodynamic polarization curves of the cp-Ti and Ti-xNb alloys.
Figure 7.
Representative potentiodynamic polarization curves of the cp-Ti and Ti-xNb alloys.
Using the Tafel extrapolation method, corrosion parameters of cp-Ti and Ti-xNb alloys were calculated in both the anodic and cathodic branches of the potentiodynamic polarization curves (shown in
Table 3).
Table 3 shows the values of corrosion potential (
Ecorr), corrosion current density (
Icorr), Tafel slopes (β
a and β
c), and corrosion rate (
CR). The
Ecorr and
Icorr of cp-Ti were found to be approximately −0.575 V and 0.611 μA/cm
2, respectively, which were in agreement with the previously reported values [
30]. The corrosion rate of cp-Ti was 1.88 × 10
−2 mm/year. Average corrosion potentials of the investigated Ti-xNb (5, 10, 15 wt % Nb) alloys were higher than that of cp-Ti (
p < 0.05). Also, the addition of Nb to Ti resulted in the lowering of the passive current density (0.33–0.47 μA/cm
2), which indicated the formation of a more protective passive film. The decreased
Icorr and increased
Ecorr values in the positive direction for Ti-xNb alloys demonstrated a higher corrosion resistance than that of cp-Ti. Low corrosion rates were observed for all of the Ti-xNb alloys. Among the Ti-xNb alloys, Ti-10Nb displayed the greatest corrosion resistance with an
Ecorr of −0.456 V,
Icorr of 0.33 μA/cm
2, and
CR of 0.964 × 10
−2 mm/year.
Table 3.
Corrosion potential (Ecorr) and corrosion current density (Icorr) of cp-Ti and Ti-xNb alloys (n = 3).
Table 3.
Corrosion potential (Ecorr) and corrosion current density (Icorr) of cp-Ti and Ti-xNb alloys (n = 3).
| Alloy Code | Ecorr (± SD) (V) | Icorr (±SD) (μA/cm2) | βa | βc | CR (mm/year) |
|---|
| cp-Ti | −0.58 (0.04) a,* | 0.61(0.17) a | 0.27(0.09) a | −0.19(0.02) b | 1.88(0.54) × 10−2 b |
| Ti-5Nb | −0.46 (0.07) a | 0.40 (0.06) a,b | 0.19(0.04) a | −0.13(0.02) a | 1.20(0.19) × 10−2 a |
| Ti-10Nb | −0.46 (0.05) a | 0.33 (0.05) b | 0.18(0.02) a | −0.14(0.04) a | 0.96(0.14) × 10−2 a |
| Ti-15Nb | −0.49 (0.09) a | 0.40 (0.03) a,b | 0.19(0.02) a | −0.14(0.03) a,b | 1.13(0.09) × 10−2 a |
| Ti-20Nb | −0.52 (0.14) a | 0.47(0.16) a,b | 0.18(0.03) a | −0.14(0.01) a | 1.31(0.46) × 10−2 a,b |
2.4. Cytotoxicity Based on the Agar Overlay Test and WST-1 Assay
The results of the agar-overlay test are shown in
Table 4. Five specimens were prepared for each material to test the cytotoxicity. Toxicity was evaluated by the size of the zone of decolorization (zone index) and the degree of cell lysis (lysis index). All of the Ti-xNb alloys and pure Nb specimens did not decolorize the neutral red stained cells in the agar overlay test (
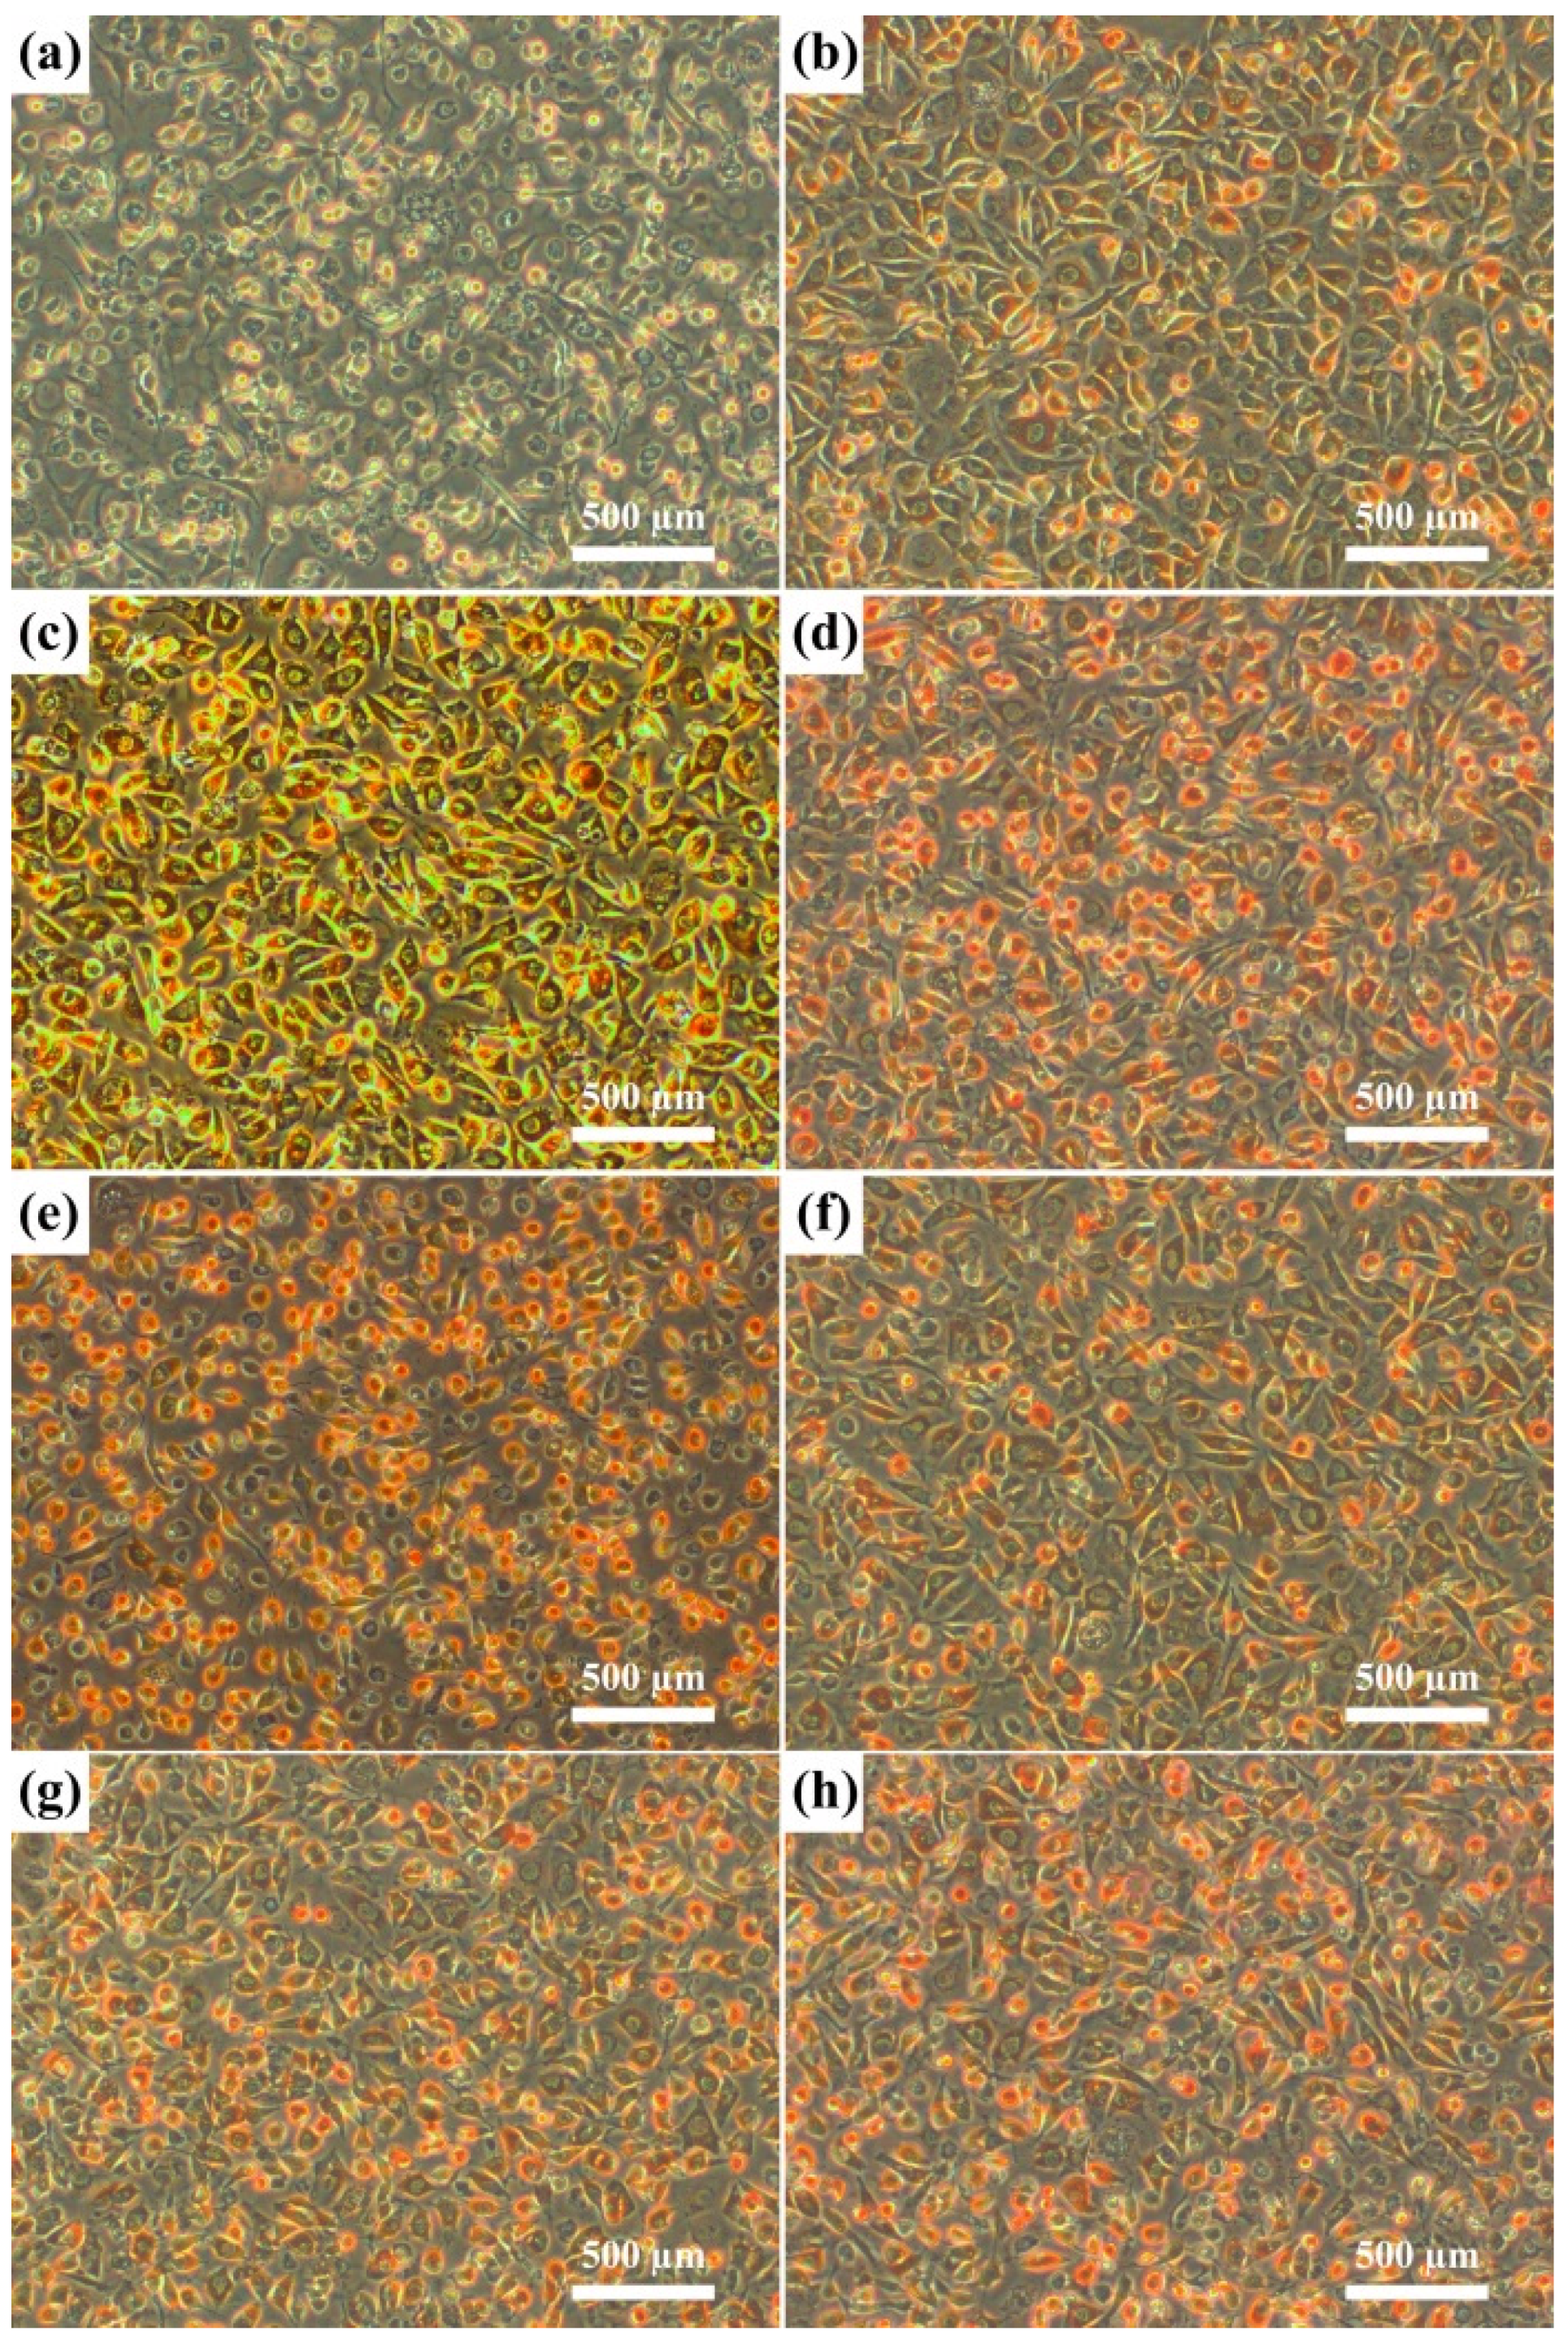
Figure 8). Therefore, based on the agar overlay test, cp-Ti and pure Nb were noncytotoxic with an average cell response of 0/0. The cytotoxicity of Ti-xNb alloys was also found to be unaltered by the Nb content in the alloy. Cell viability was determined by the water-soluble tetrazolium-1 (WST-1) assay. The samples are considered to be biocompatible if cell viability on the metal was equivalent to or greater than that of the control group.
Table 4.
Cytotoxicity of pure metal and Ti-xNb alloys based on the agar overlay test (n = 5).
Table 4.
Cytotoxicity of pure metal and Ti-xNb alloys based on the agar overlay test (n = 5).
| Alloy Code | Decolorization Index (DI) | Lysis Index (LI) | Cell Response | Cytotoxicity |
|---|
| cp-Ti | 0 | 0 | 0/0 | none |
| Pure Nb | 0 | 0 | 0/0 | none |
| Positive control (polyurethane) | 3 | 3 | 3/3 | moderate |
| Negative control (polyethylene) | 0 | 0 | 0/0 | none |
| Ti-5Nb | 0 | 0 | 0/0 | none |
| Ti-10Nb | 0 | 0 | 0/0 | none |
| Ti-15Nb | 0 | 0 | 0/0 | none |
| Ti-20Nb | 0 | 0 | 0/0 | none |
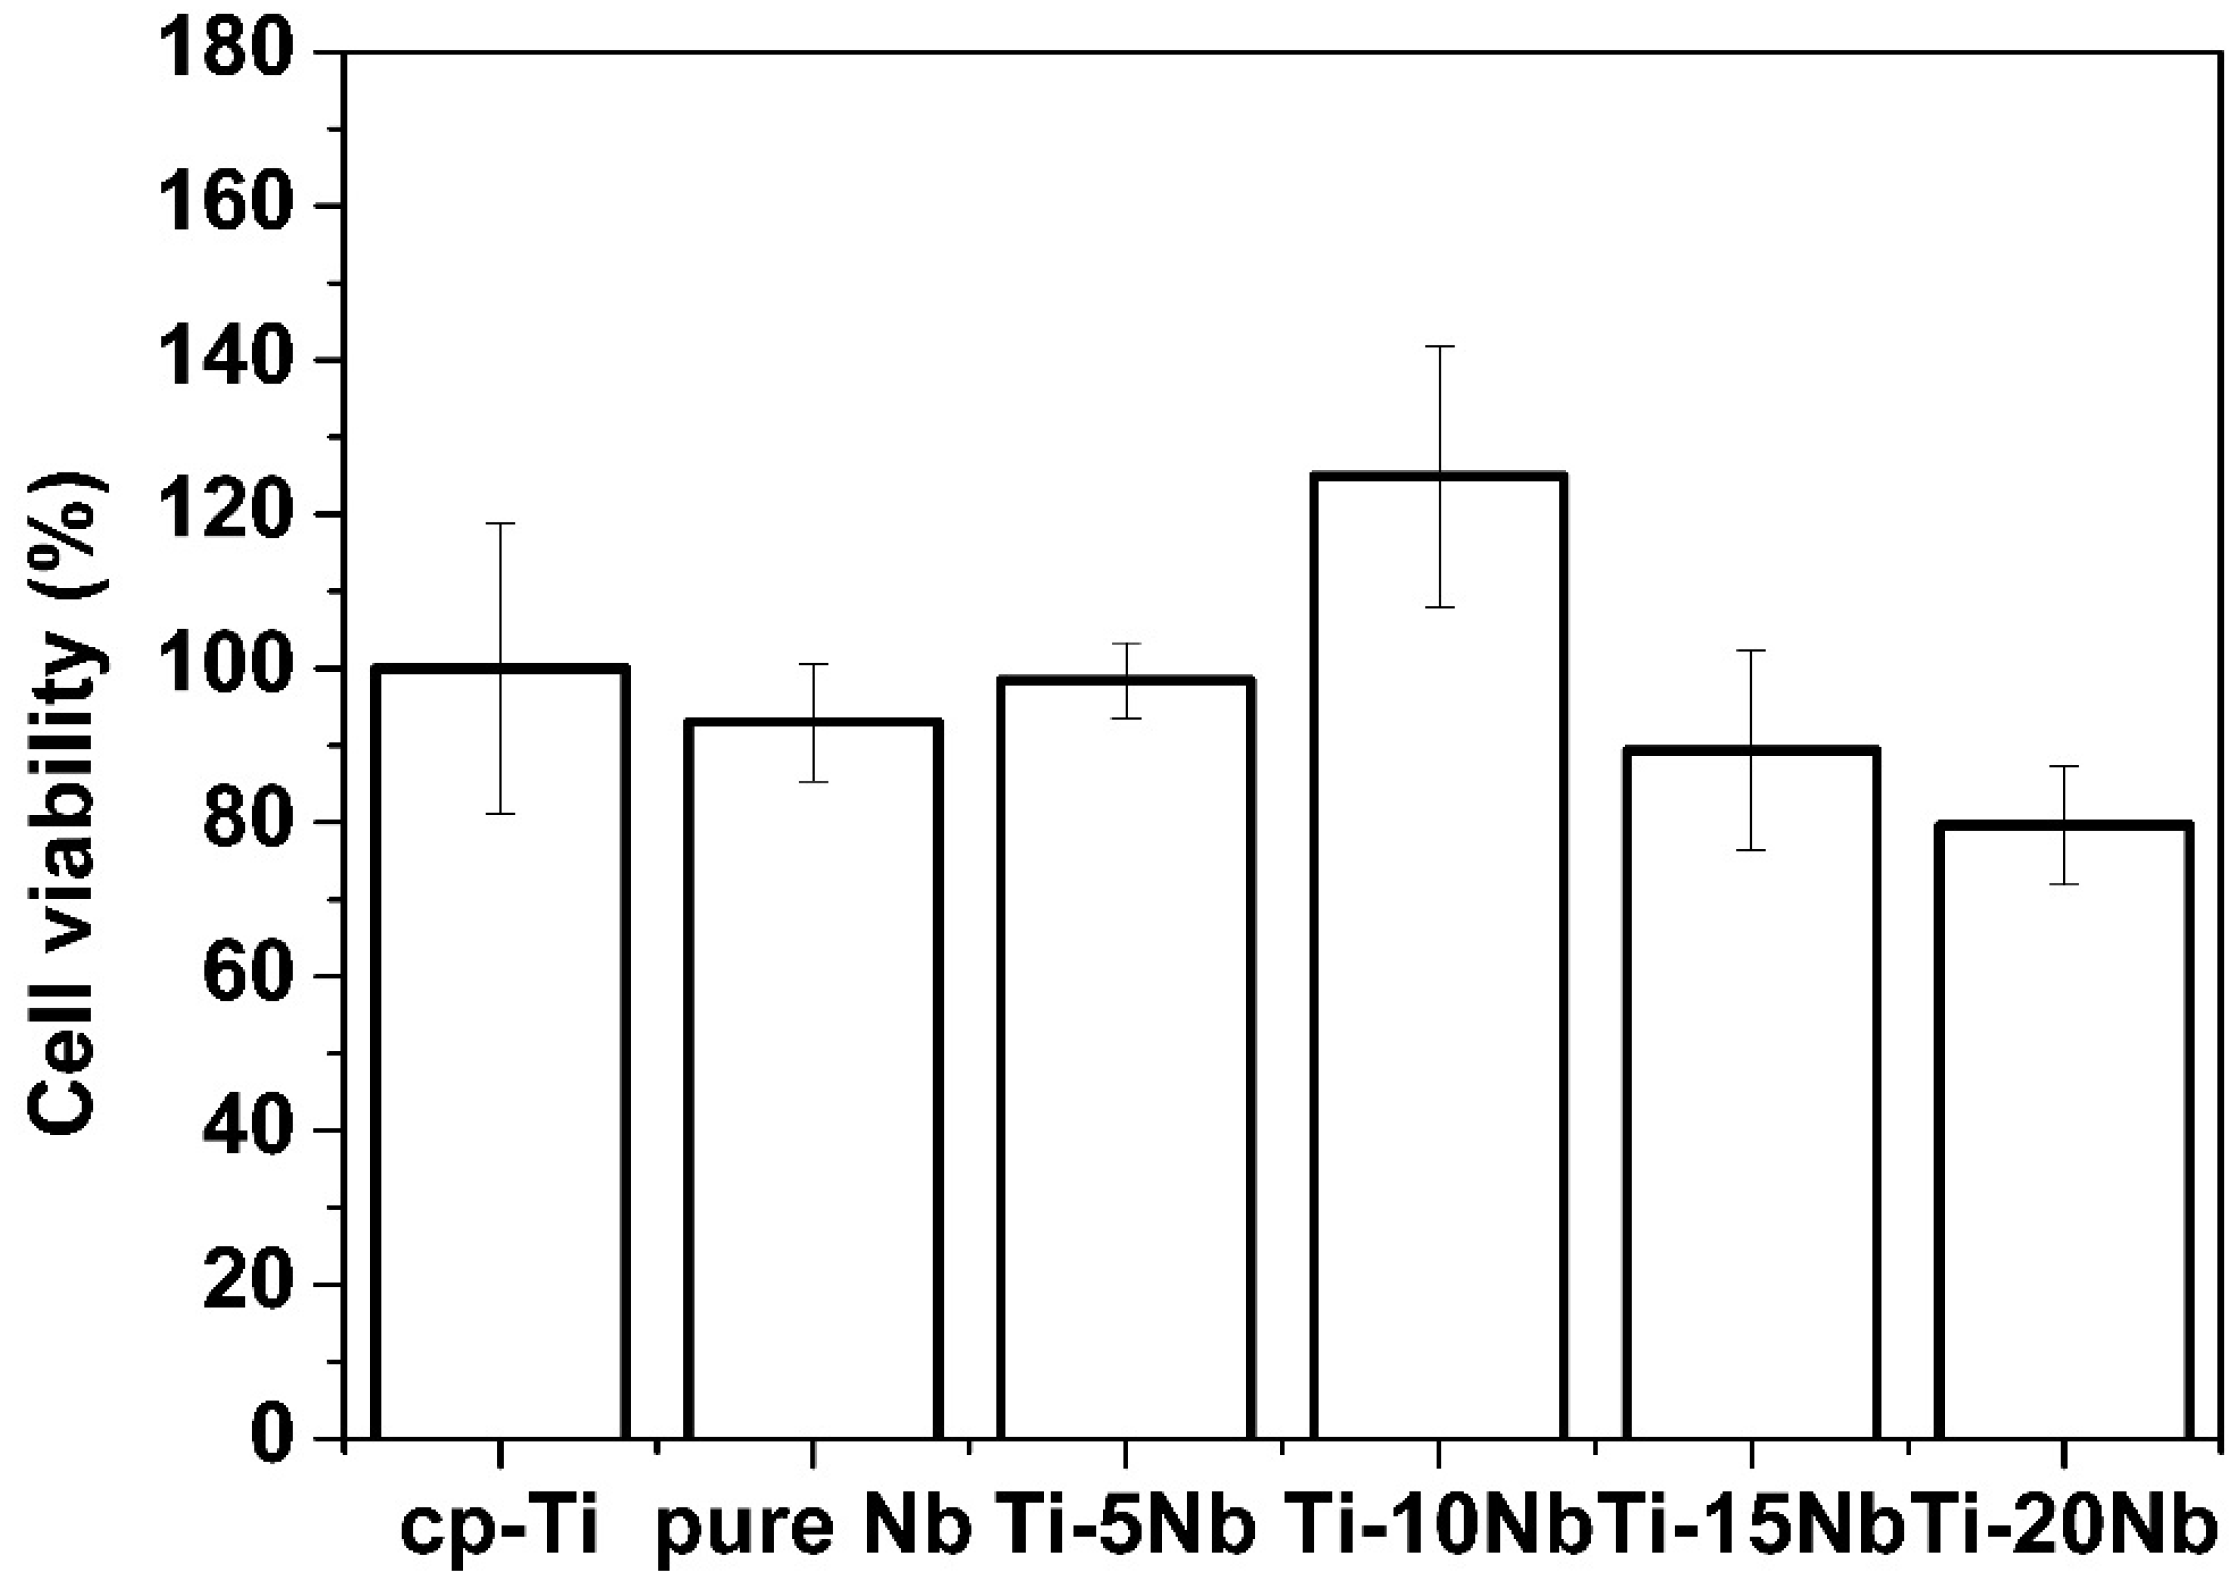
As shown in
Figure 9, pure Nb demonstrated good biocompatibility as indicated by cell viability of 93.0% ± 7.6%, compared with that of the control group. This result is consistent with previous research [
31]. Among the tested Ti-Nb alloys, the Ti-10Nb alloy showed the greatest cell viability at 124.9% ± 16.9%, which was greater than that of cp-Ti. The high cell viability of the Ti-10Nb alloy could be attributed to its excellent corrosion resistance. From electrochemical measurements, corrosion resistance increased by alloying Ti with Nb. Even though the Ti-10Nb had the best corrosion resistance among tested alloys, the differences between corrosion resistance values of Ti-xNb alloys were not significant (
Table 3). With an Nb content of 5 wt %, cell viability was also comparable to that of cp-Ti (
p > 0.05).
Figure 8.
Photographs (×100) of the L929 cell line. (a) PU = polyurethane (positive control); (b) PE = polyethylene (negative control); (c) cp-Ti; (d) pure Nb; (e) Ti-5Nb; (f) Ti-10Nb; (g) Ti-15Nb; and (h) Ti-20Nb in the agar overlay test.
Figure 8.
Photographs (×100) of the L929 cell line. (a) PU = polyurethane (positive control); (b) PE = polyethylene (negative control); (c) cp-Ti; (d) pure Nb; (e) Ti-5Nb; (f) Ti-10Nb; (g) Ti-15Nb; and (h) Ti-20Nb in the agar overlay test.
Figure 9.
Percent cell viability of pure metals and their Ti based alloys versus cp-Ti after cell culture for 24 h (n = 7).
Figure 9.
Percent cell viability of pure metals and their Ti based alloys versus cp-Ti after cell culture for 24 h (n = 7).


