
Effect of Industrial By-Products on Unconfined Compressive Strength of Solidified Organic Marine Clayey Soils

Abstract
:1. Introduction
2. Materials and Methods
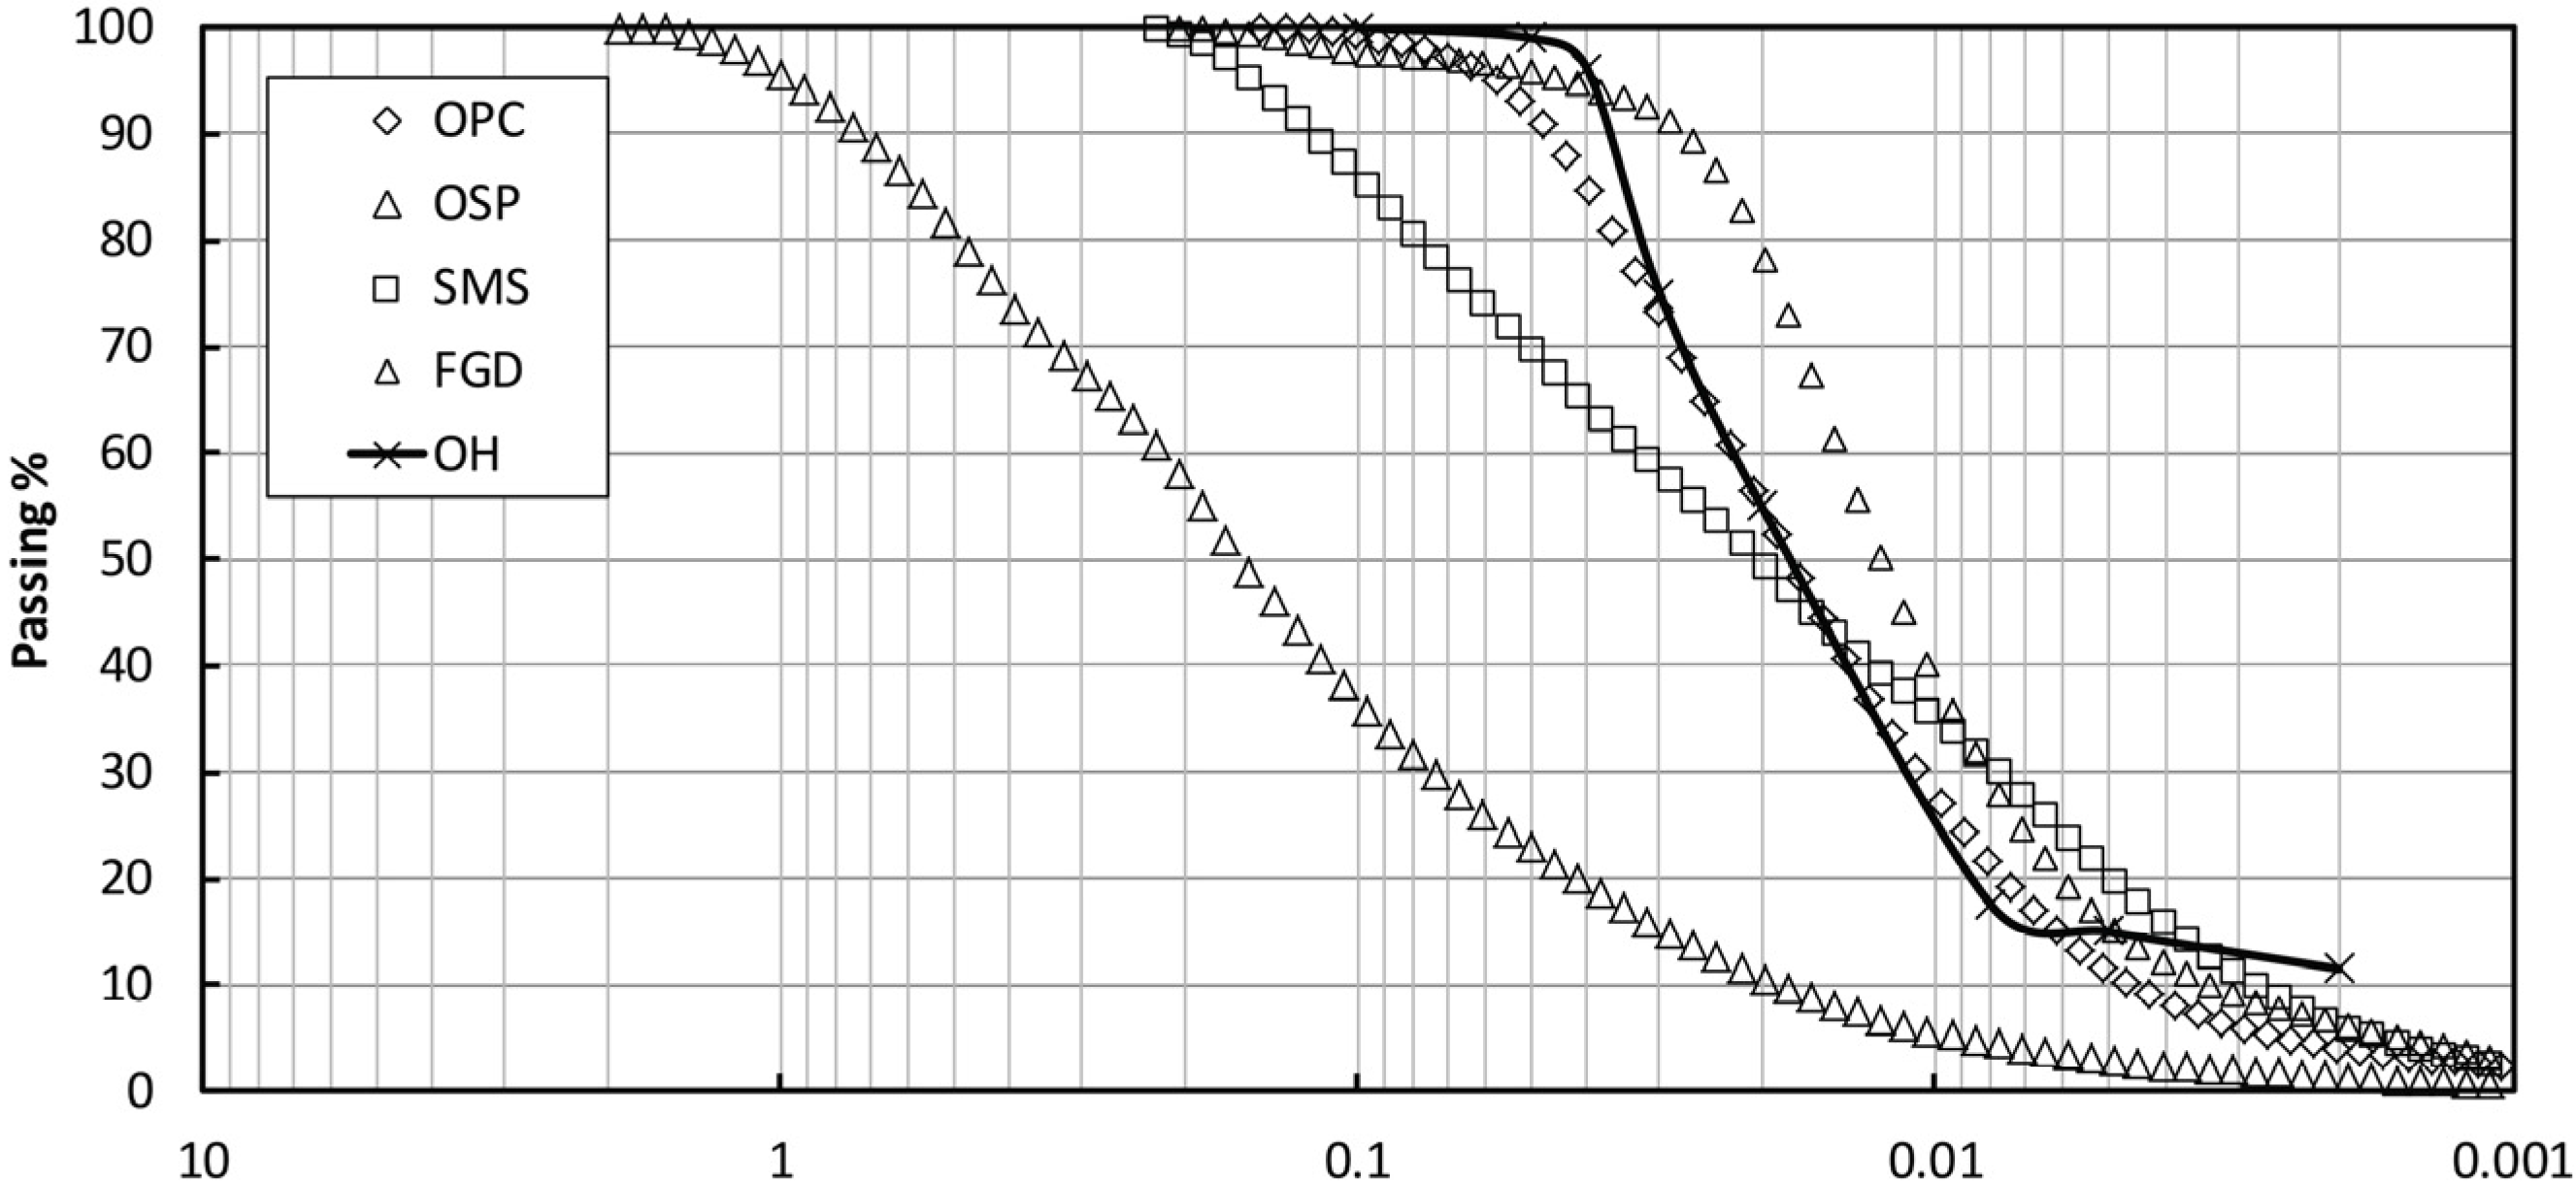
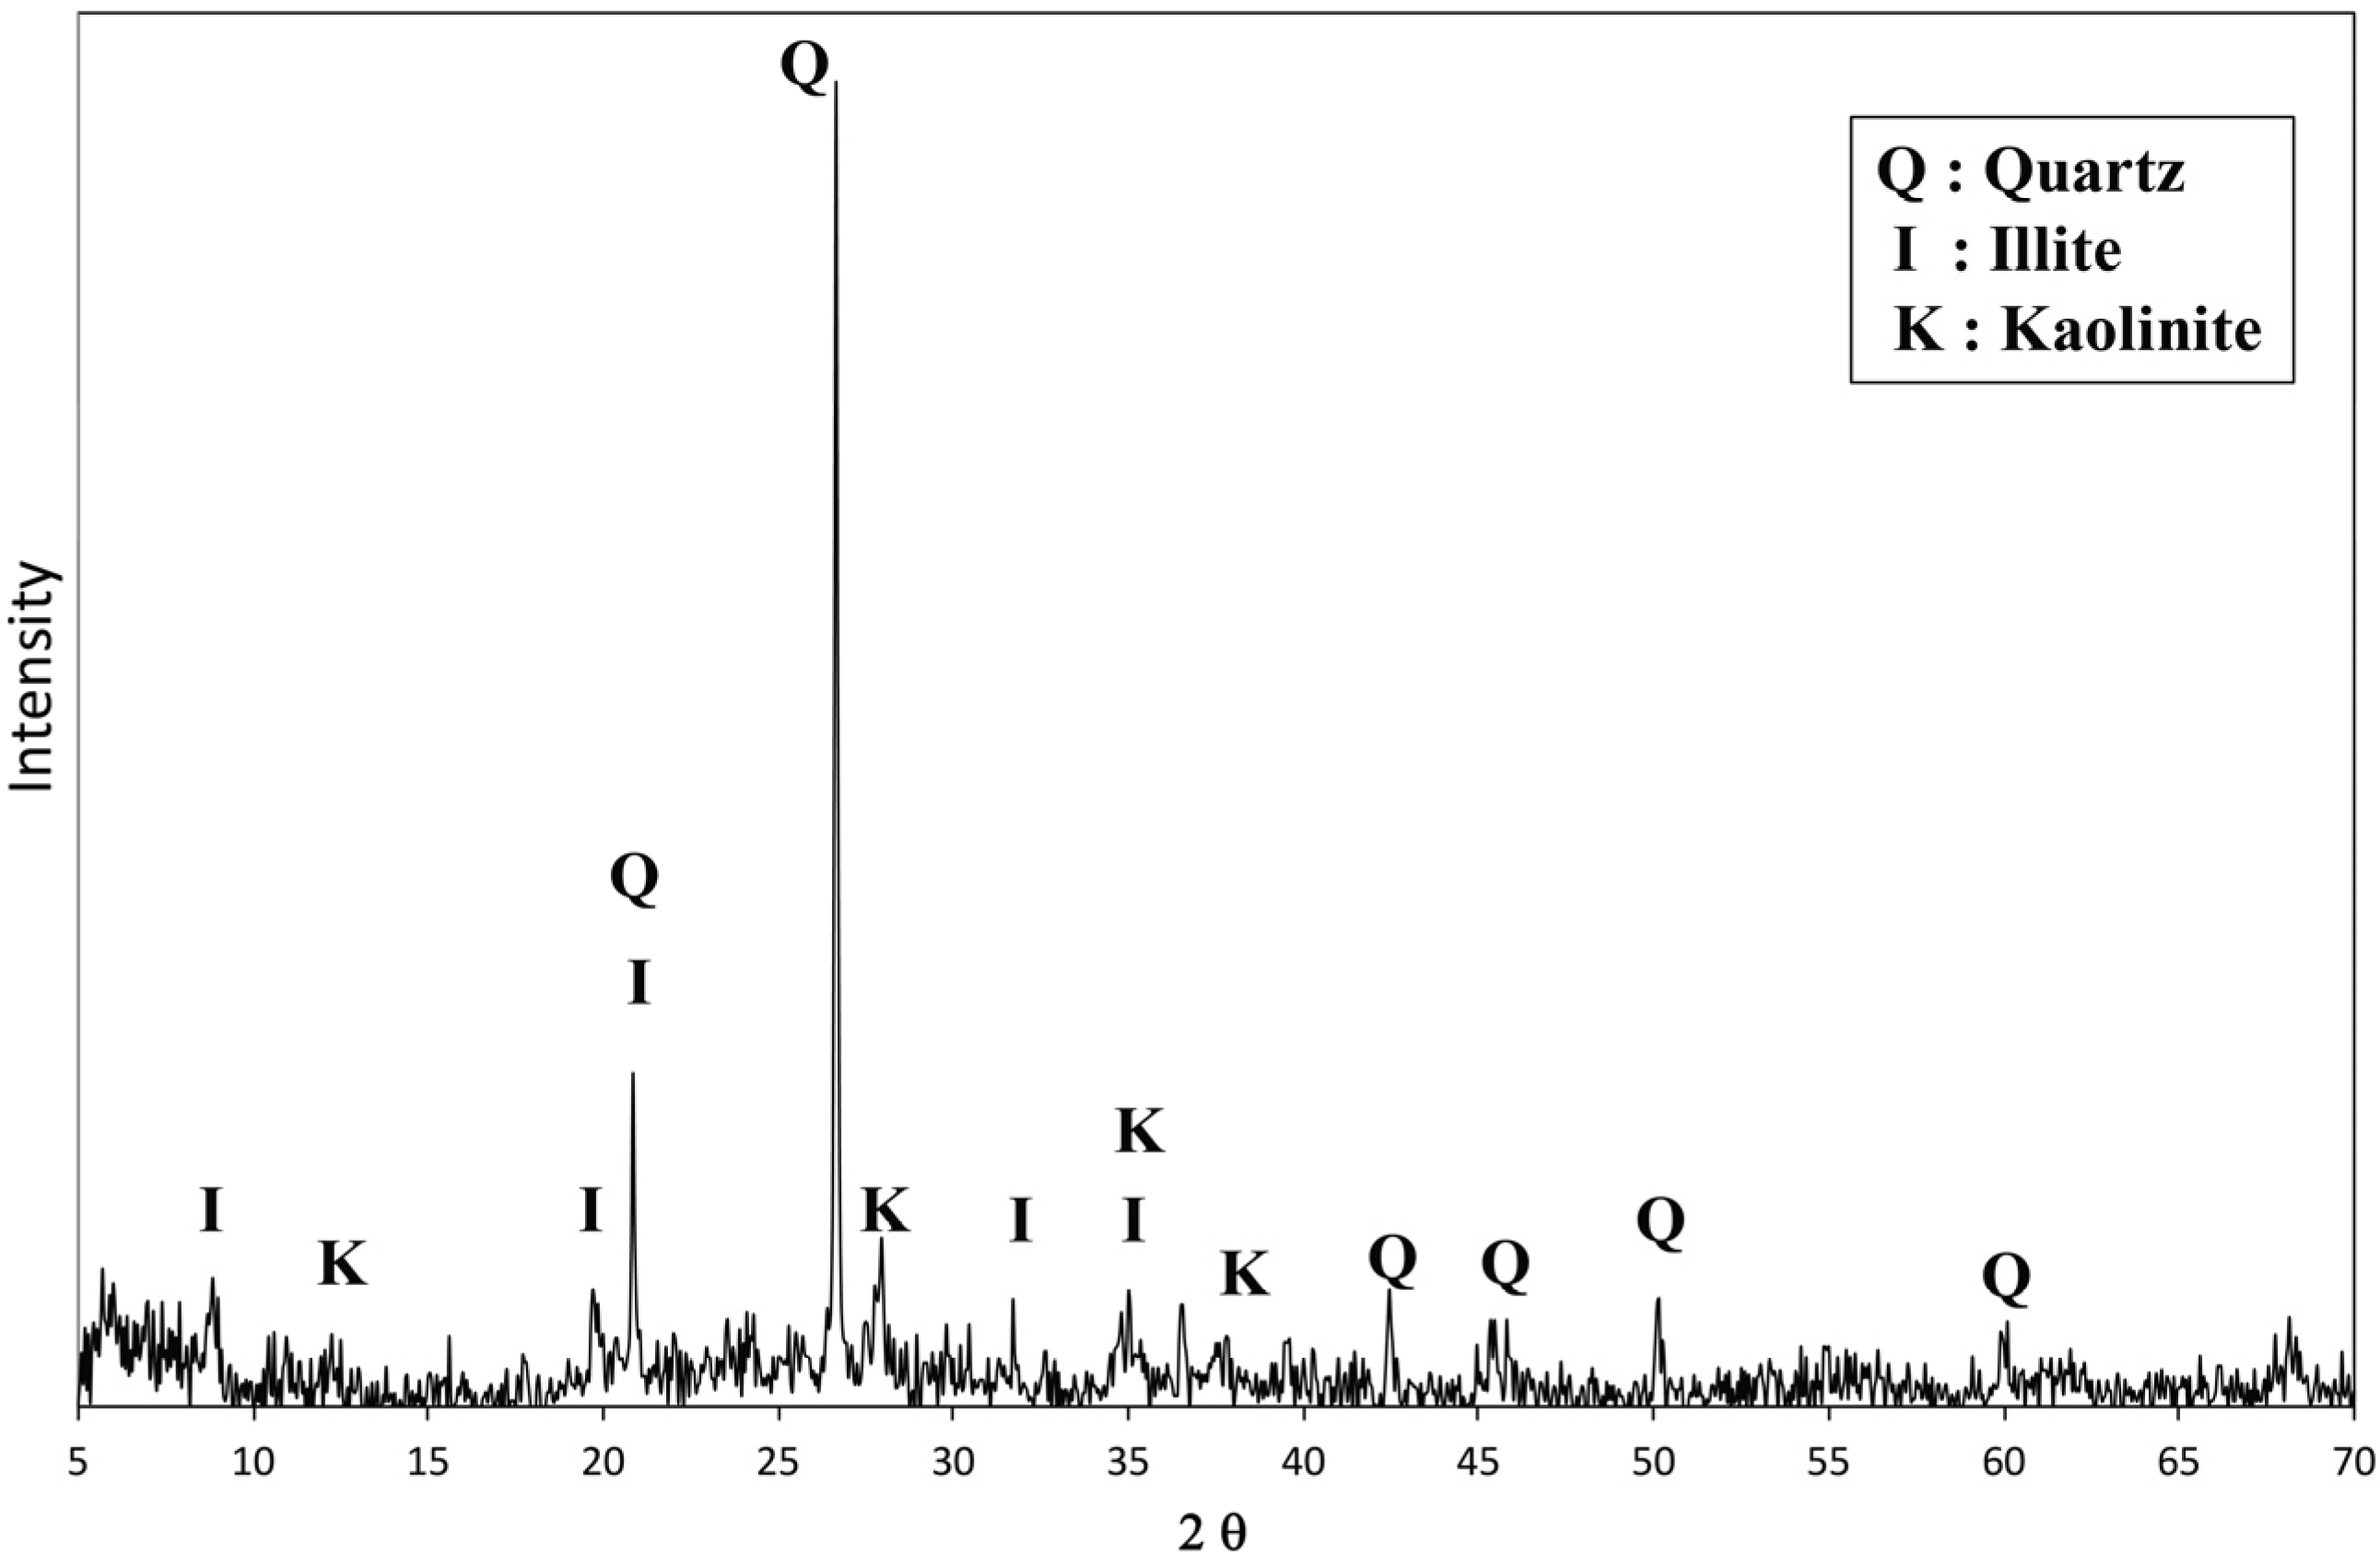
2.1. Materials

| Item | Value | Item | Value |
|---|---|---|---|
| Gs 1 | 2.44 | Plasticity Index 2 (%) | 16.67 |
| Natural moisture content (% by mass) | 60.2 | Organic Content (%) | 5.87 |
| Liquid Limit (%) | 68.89 | pH | 8.3 |
| Plasticity Index (%) | 21.1 | Electric Conductivity (dS/m) | 2.46 |
| Liquid Limit 2 (%) | 51.29 | - | - |
| Materials | pH | EC (dS·m−1) | Blaine Finess (cm2/g) | Main Elements Contents (%) by XRF | ||||||||
|---|---|---|---|---|---|---|---|---|---|---|---|---|
| Ca | O | Si | Fe | Mg | Al | S | Cl | LOI ♯ | ||||
| OPC | 12.1 | 7.50 | 2800 | 44.99 | 35.22 | 10.37 | 2.03 | 2.01 | 1.86 | 1.51 | - | 1.96 |
| OSP | 8.7 | 0.61 | 3843 | 46.43 | 48.08 | 1.77 | 0.31 | - | 0.56 | 0.30 | 0.83 | 2.12 |
| SMS | 12.0 | 4.95 | 4500 | 24.74 | 33.92 | 8.63 | 21.02 | 2.81 | 3.06 | 0.44 | 0.15 | 1.88 |
| FGD | 12.7 | 7.98 | 3800 | 64.84 | - | 1.45 | 1.65 | 1.37 | 0.38 | 16.17 | 11.53 | 2.49 |
| Material | Heavy Metal Concentration (mg/L) | ||||
|---|---|---|---|---|---|
| Cu | Cd | Pb | Cr | As | |
| Standard of Korea | 1.0 | 0.3 | 3.0 | 1.5 | 1.5 |
| OH | 0.031 | N.D. | 0.003 | 0.004 | N.D. |
| OPC | 0.001 | N.D. | N.D. | 0.729 | N.D. |
| OSP | 0.085 | N.D. | 0.004 | 0.004 | 0.007 |
| SMS | 0.004 | N.D. | N.D. | 0.007 | N.D. |
| FGD | N.D. | N.D. | N.D. | 0.013 | N.D. |
2.2. Mixing and Manufacturing of Test Specimens
2.3. Test Methods
2.3.1. Unconfined Compressive Strength
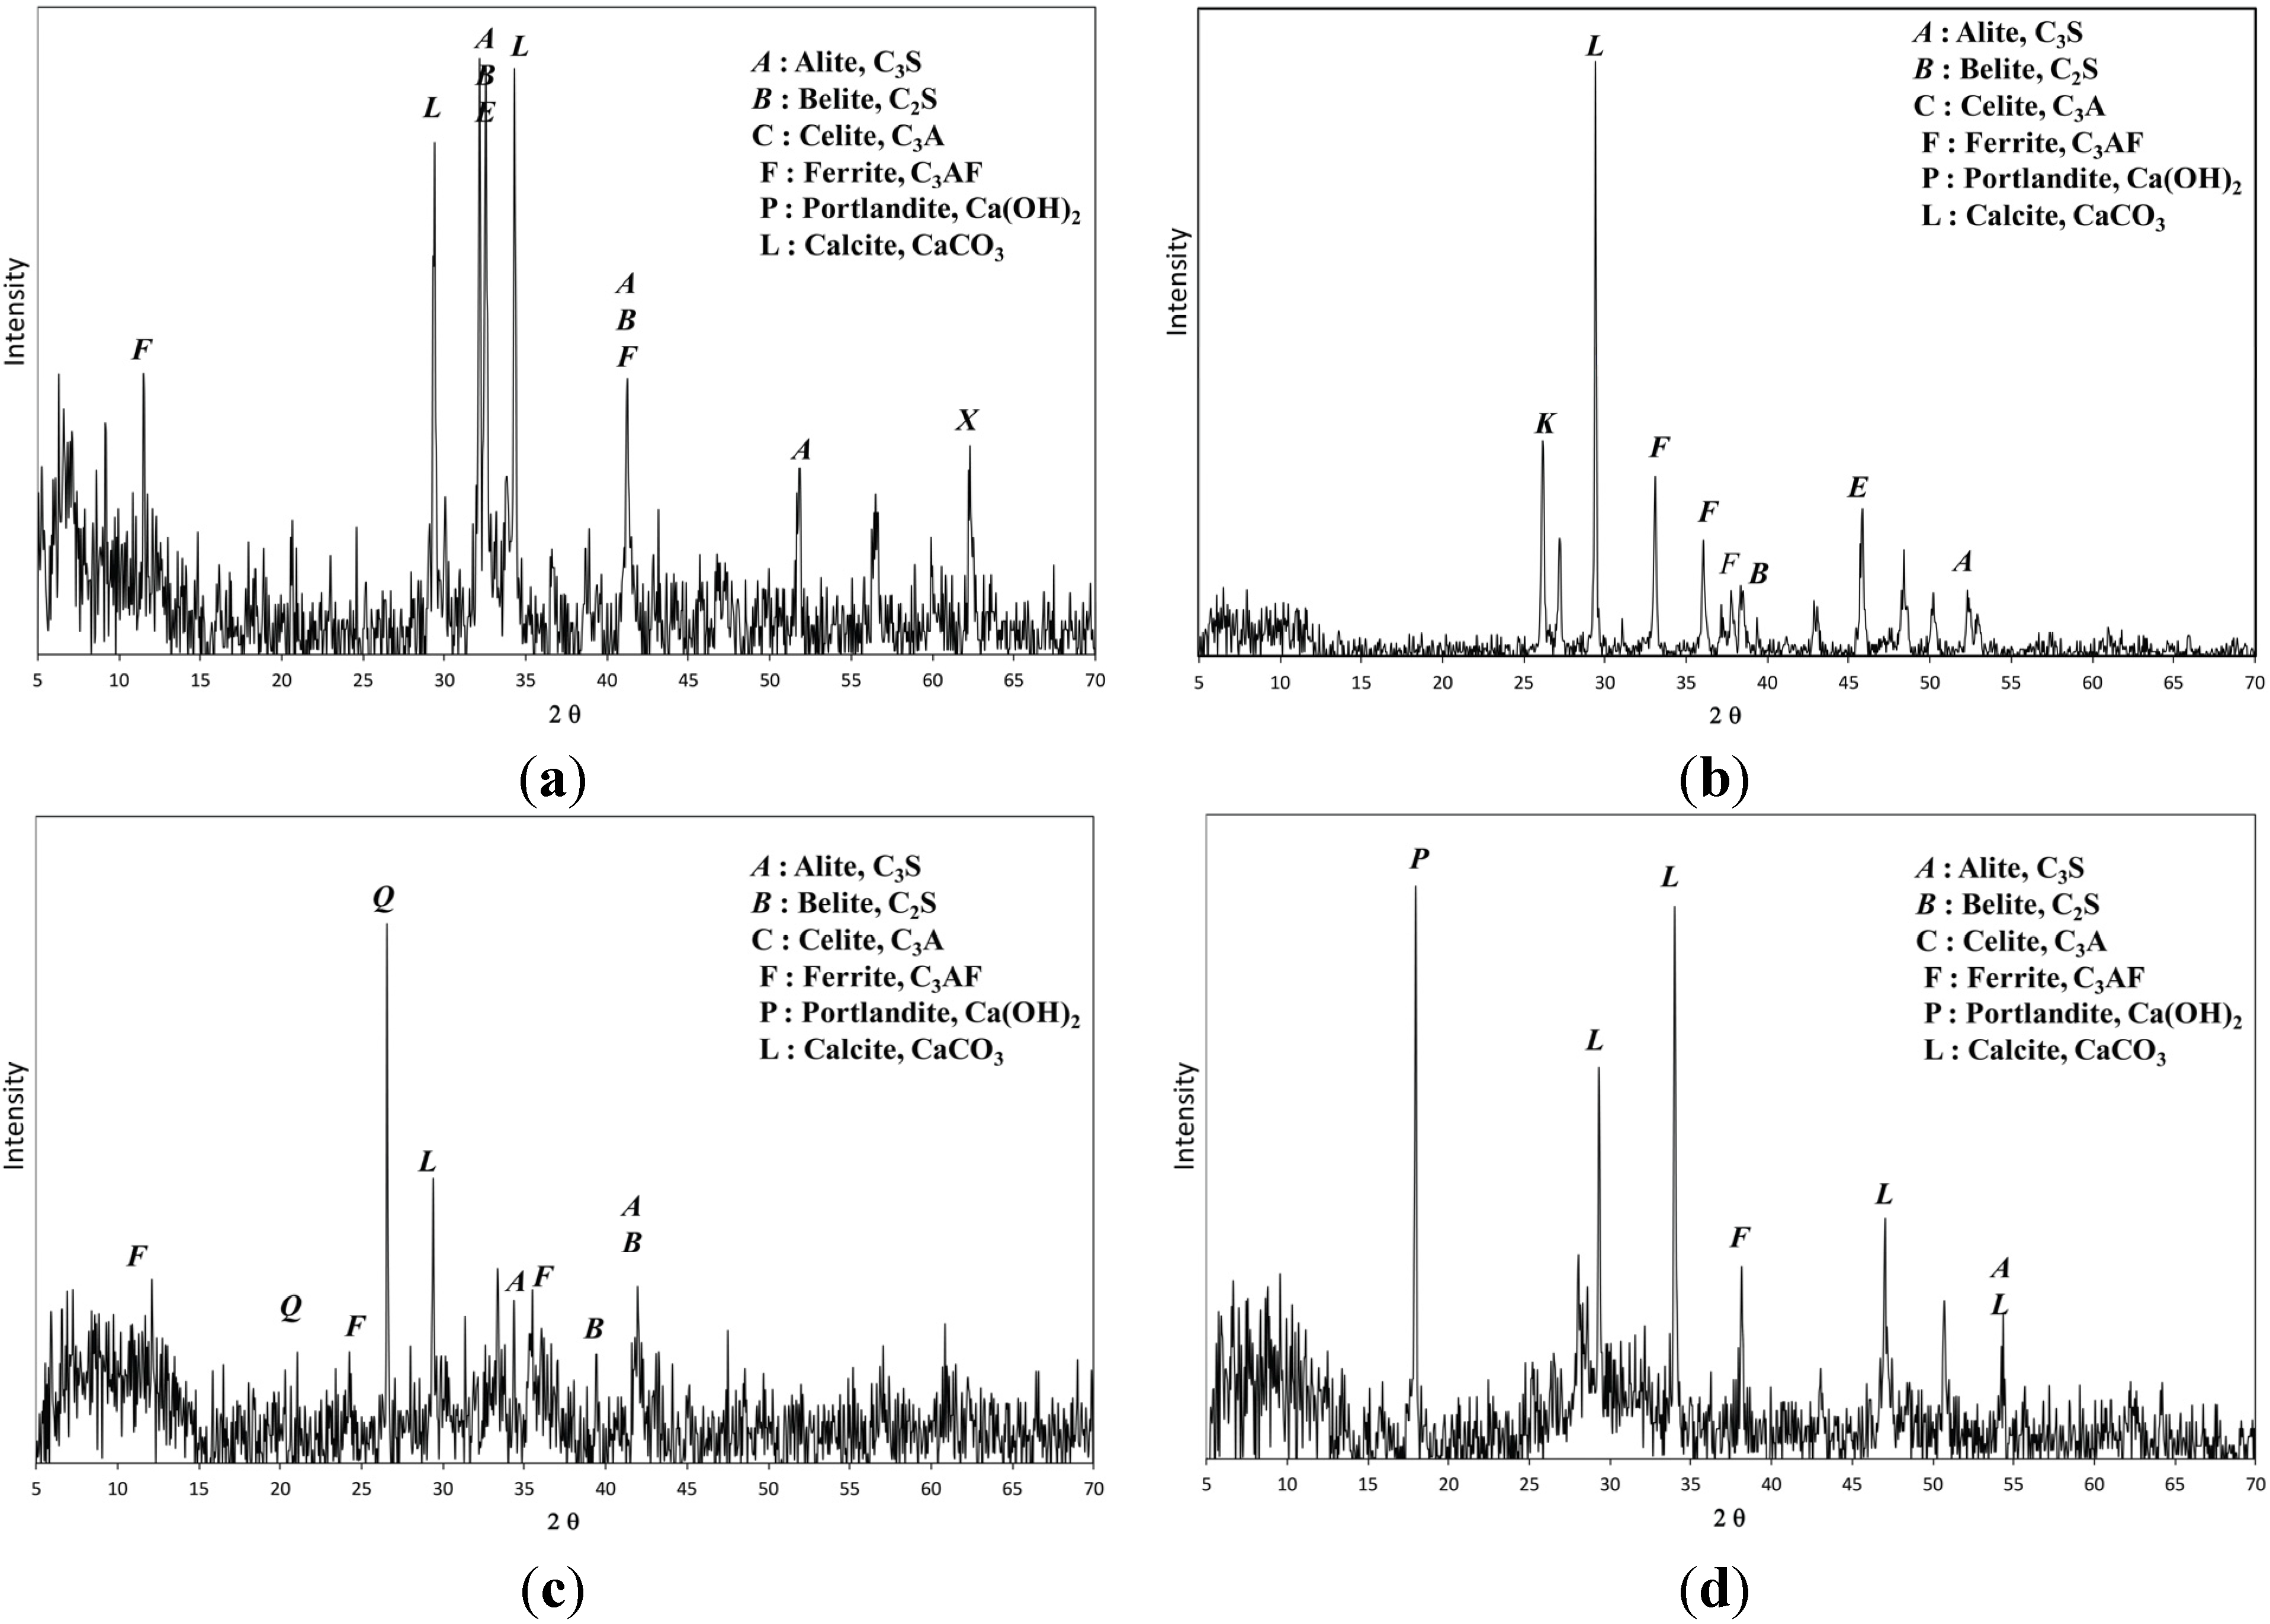
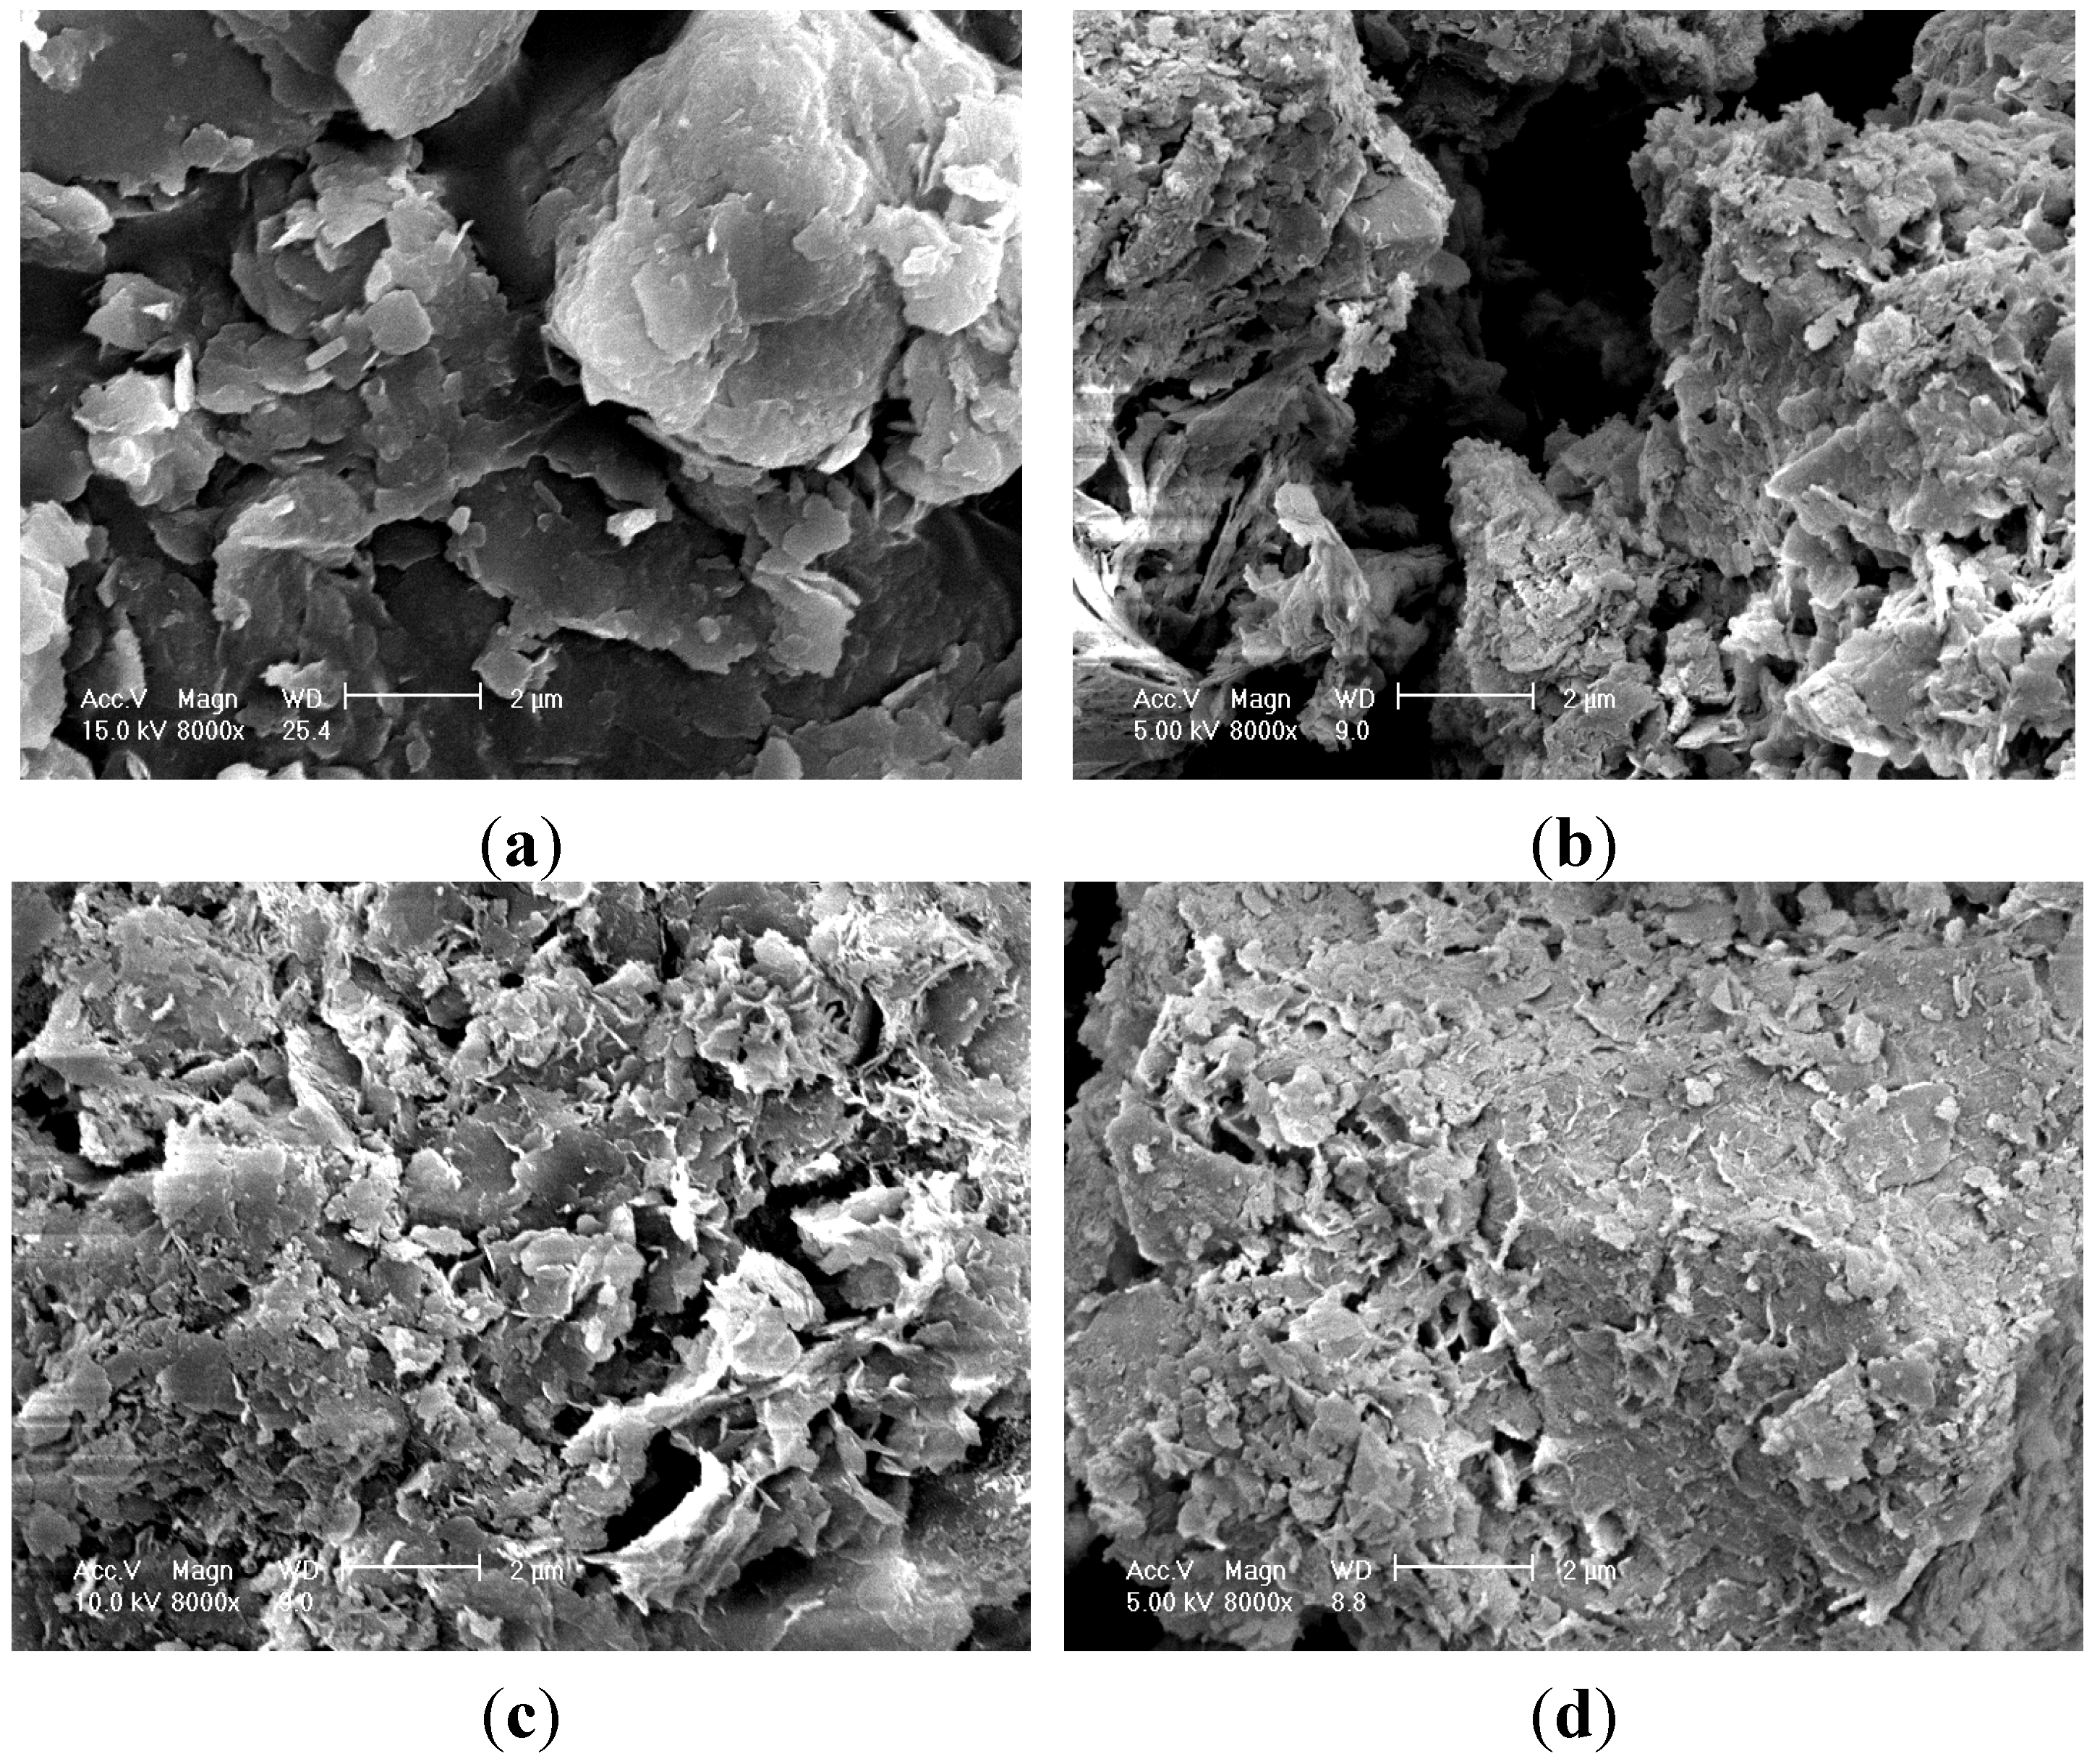
2.3.2. Optical Observations
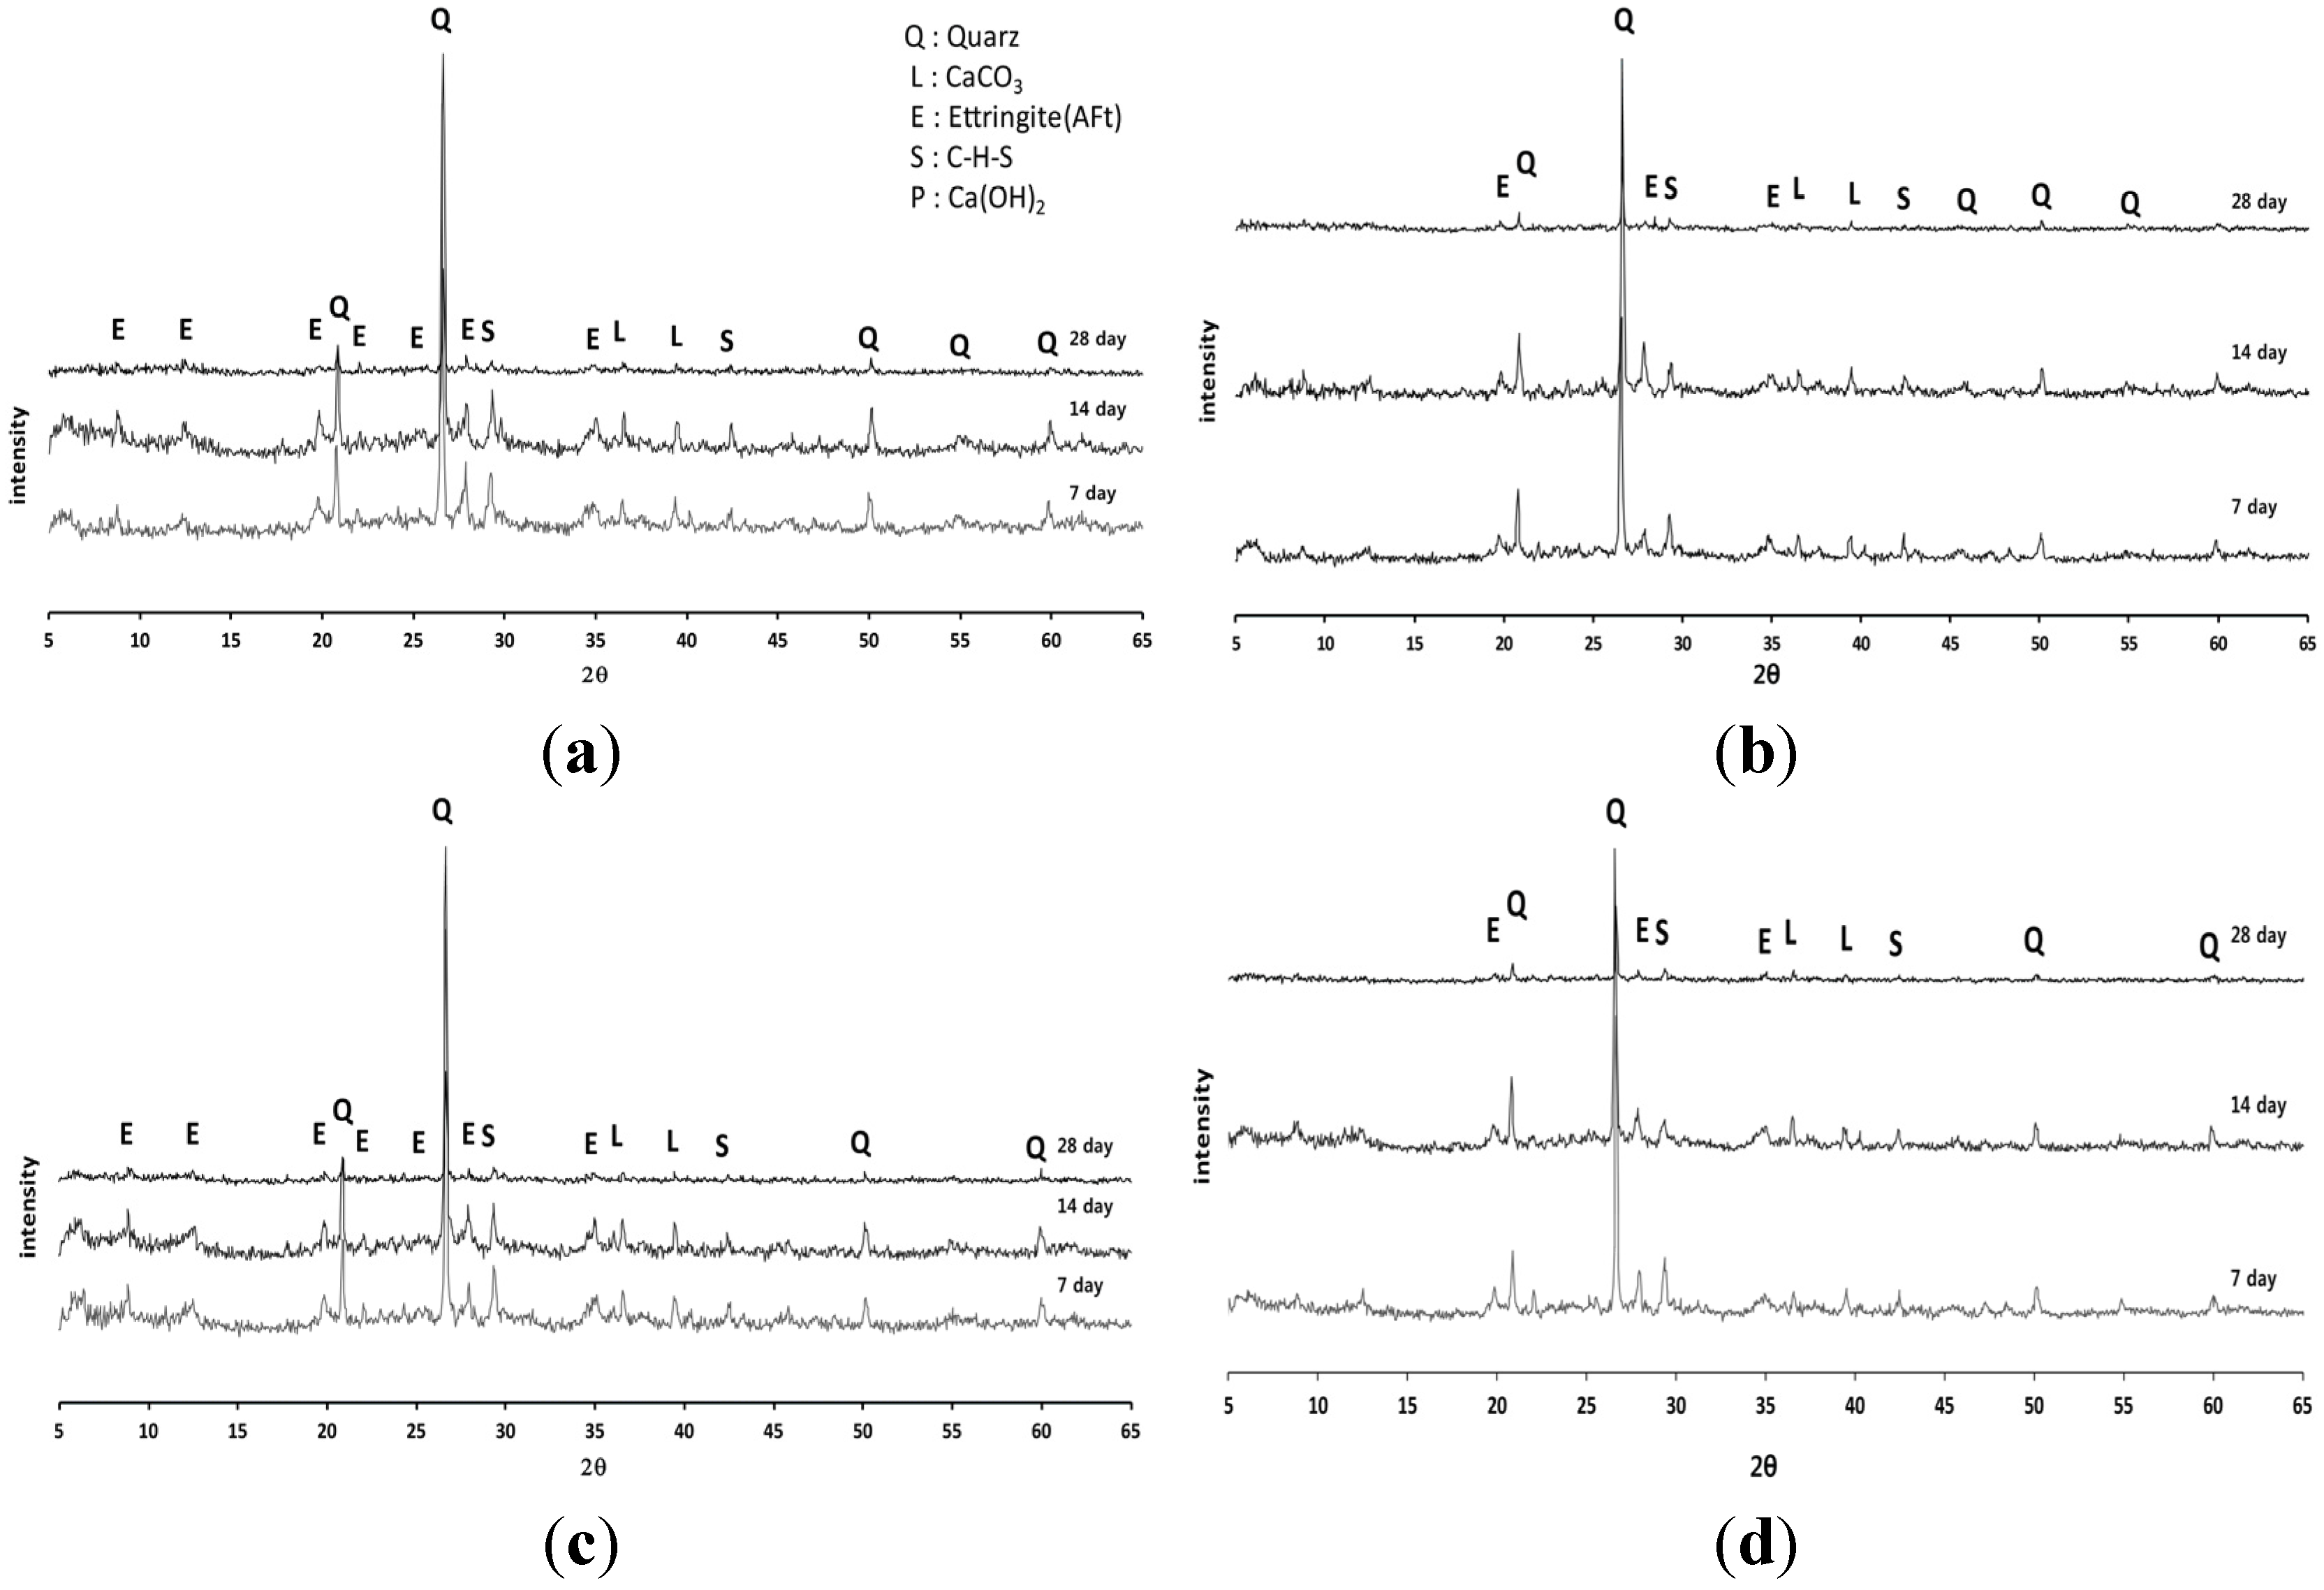
2.3.3. The Content of CaCO3
3. Results and Discussion
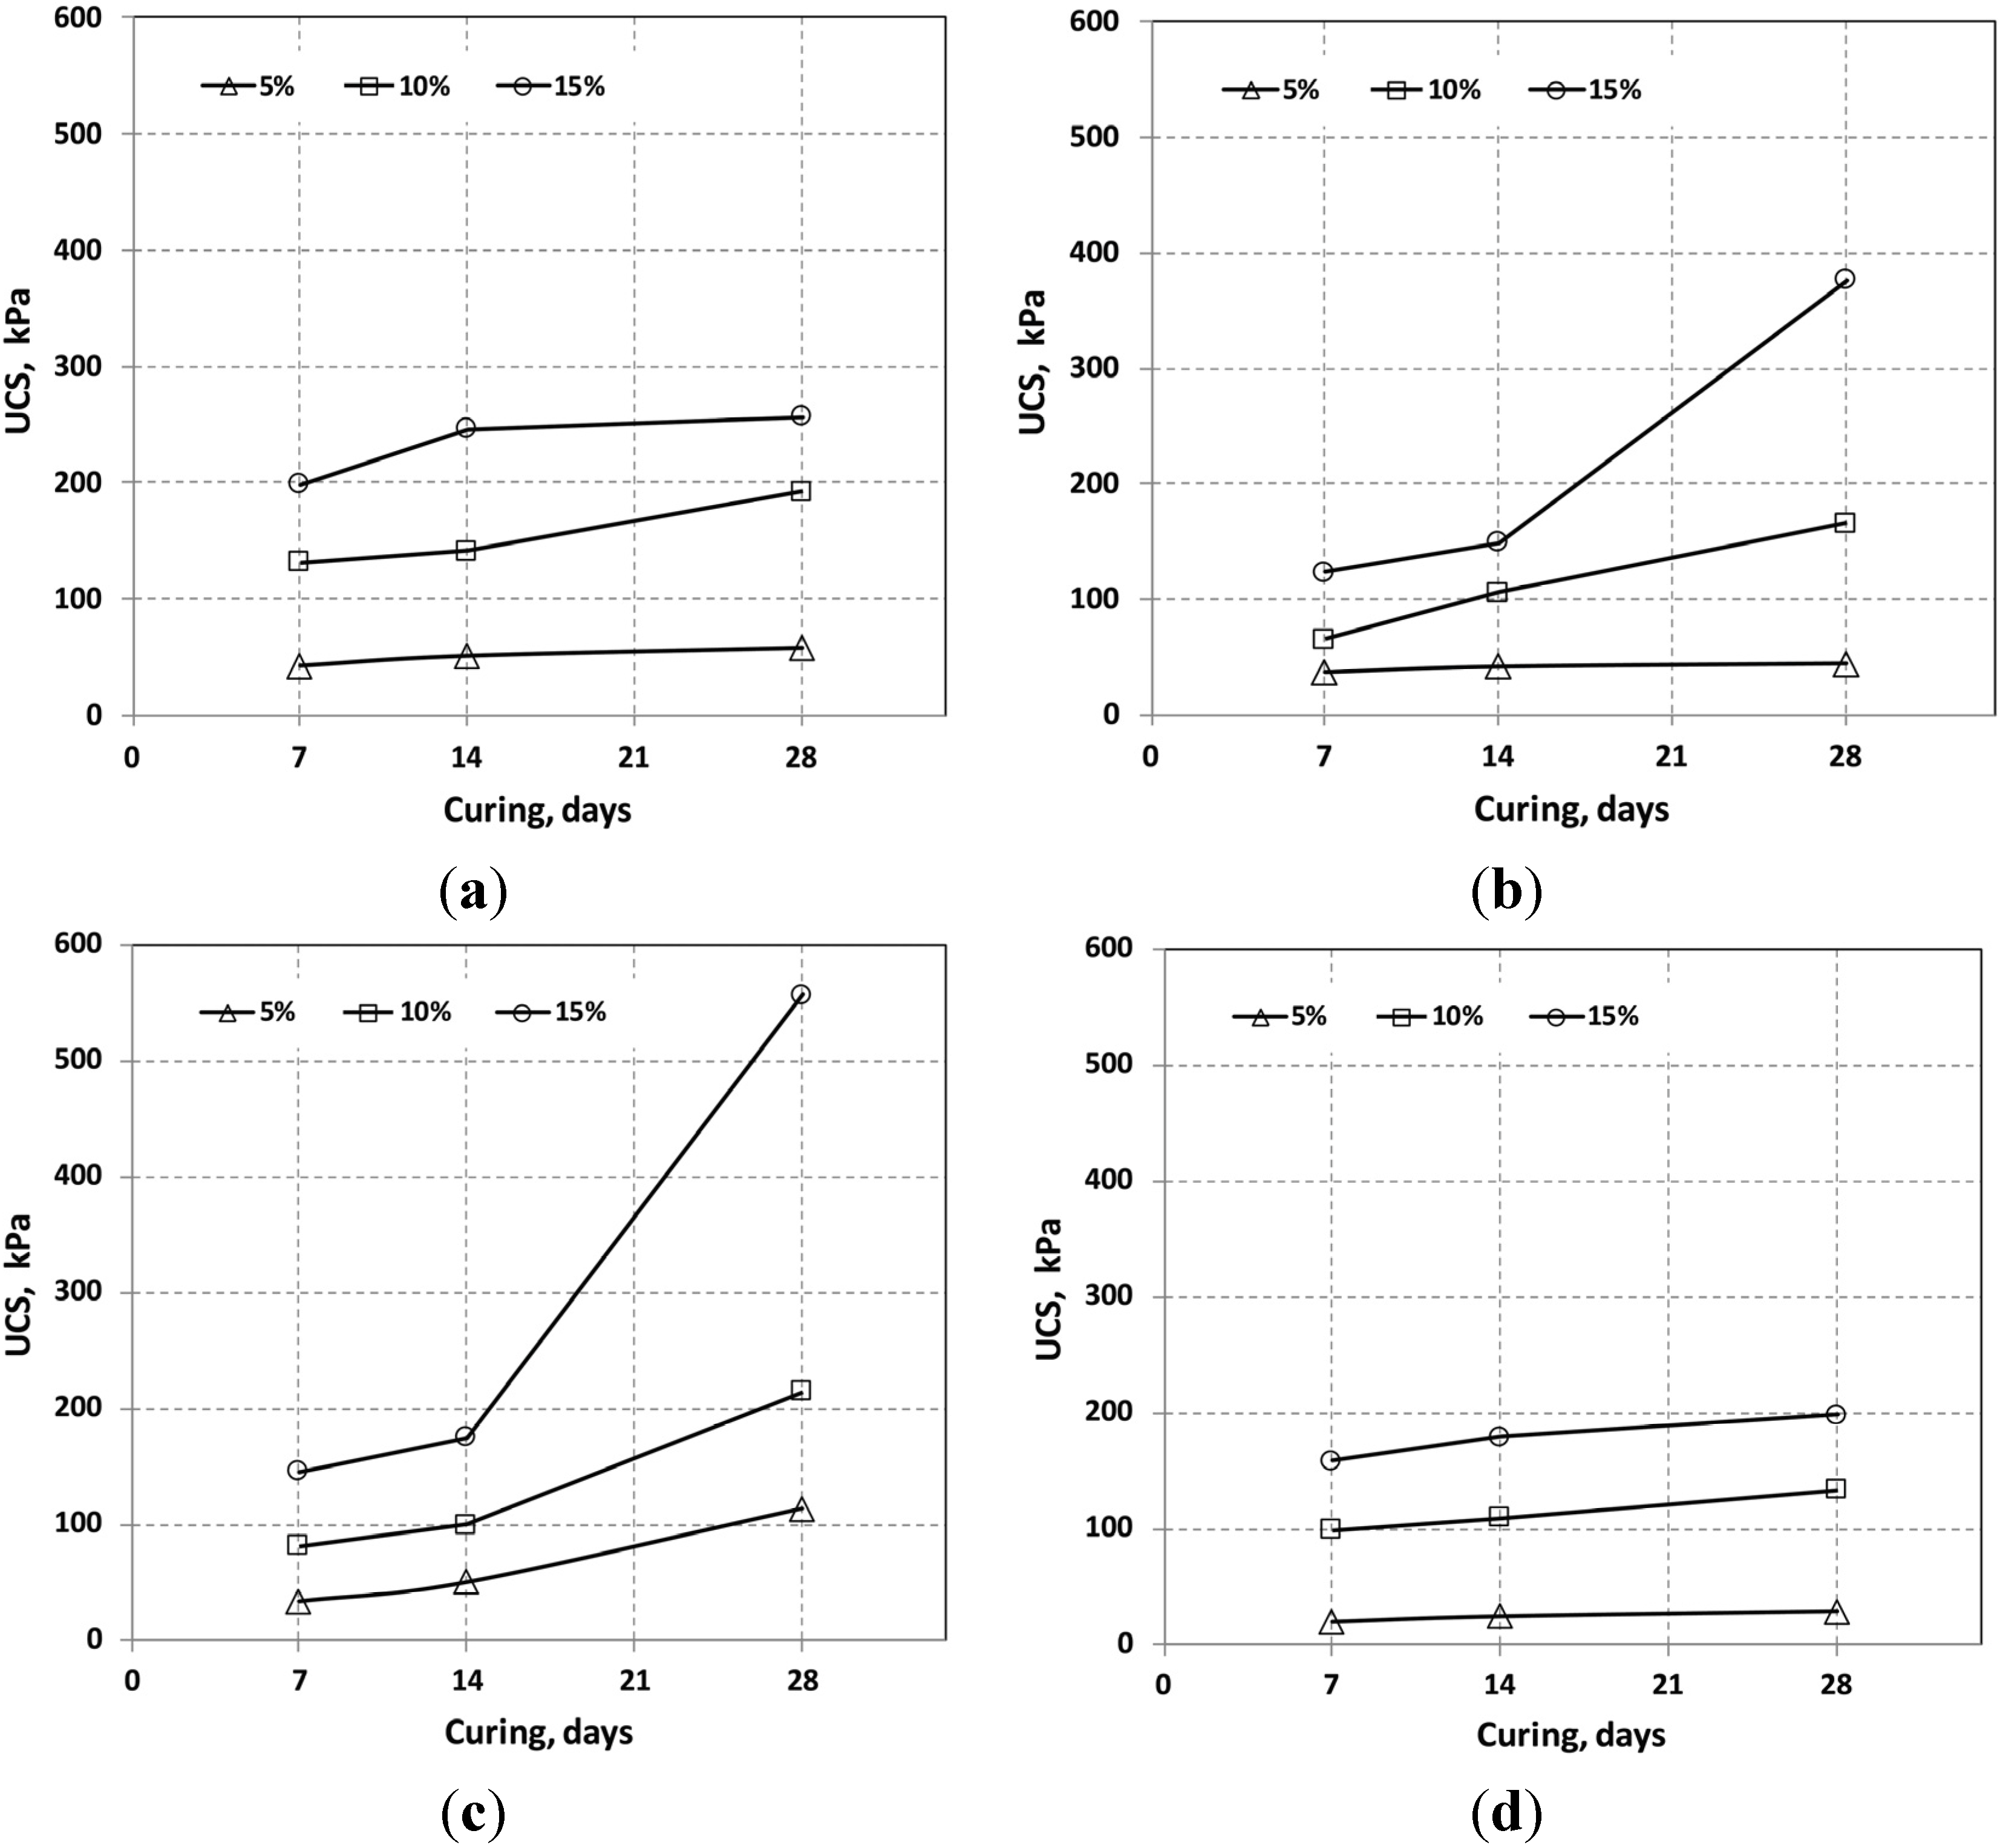
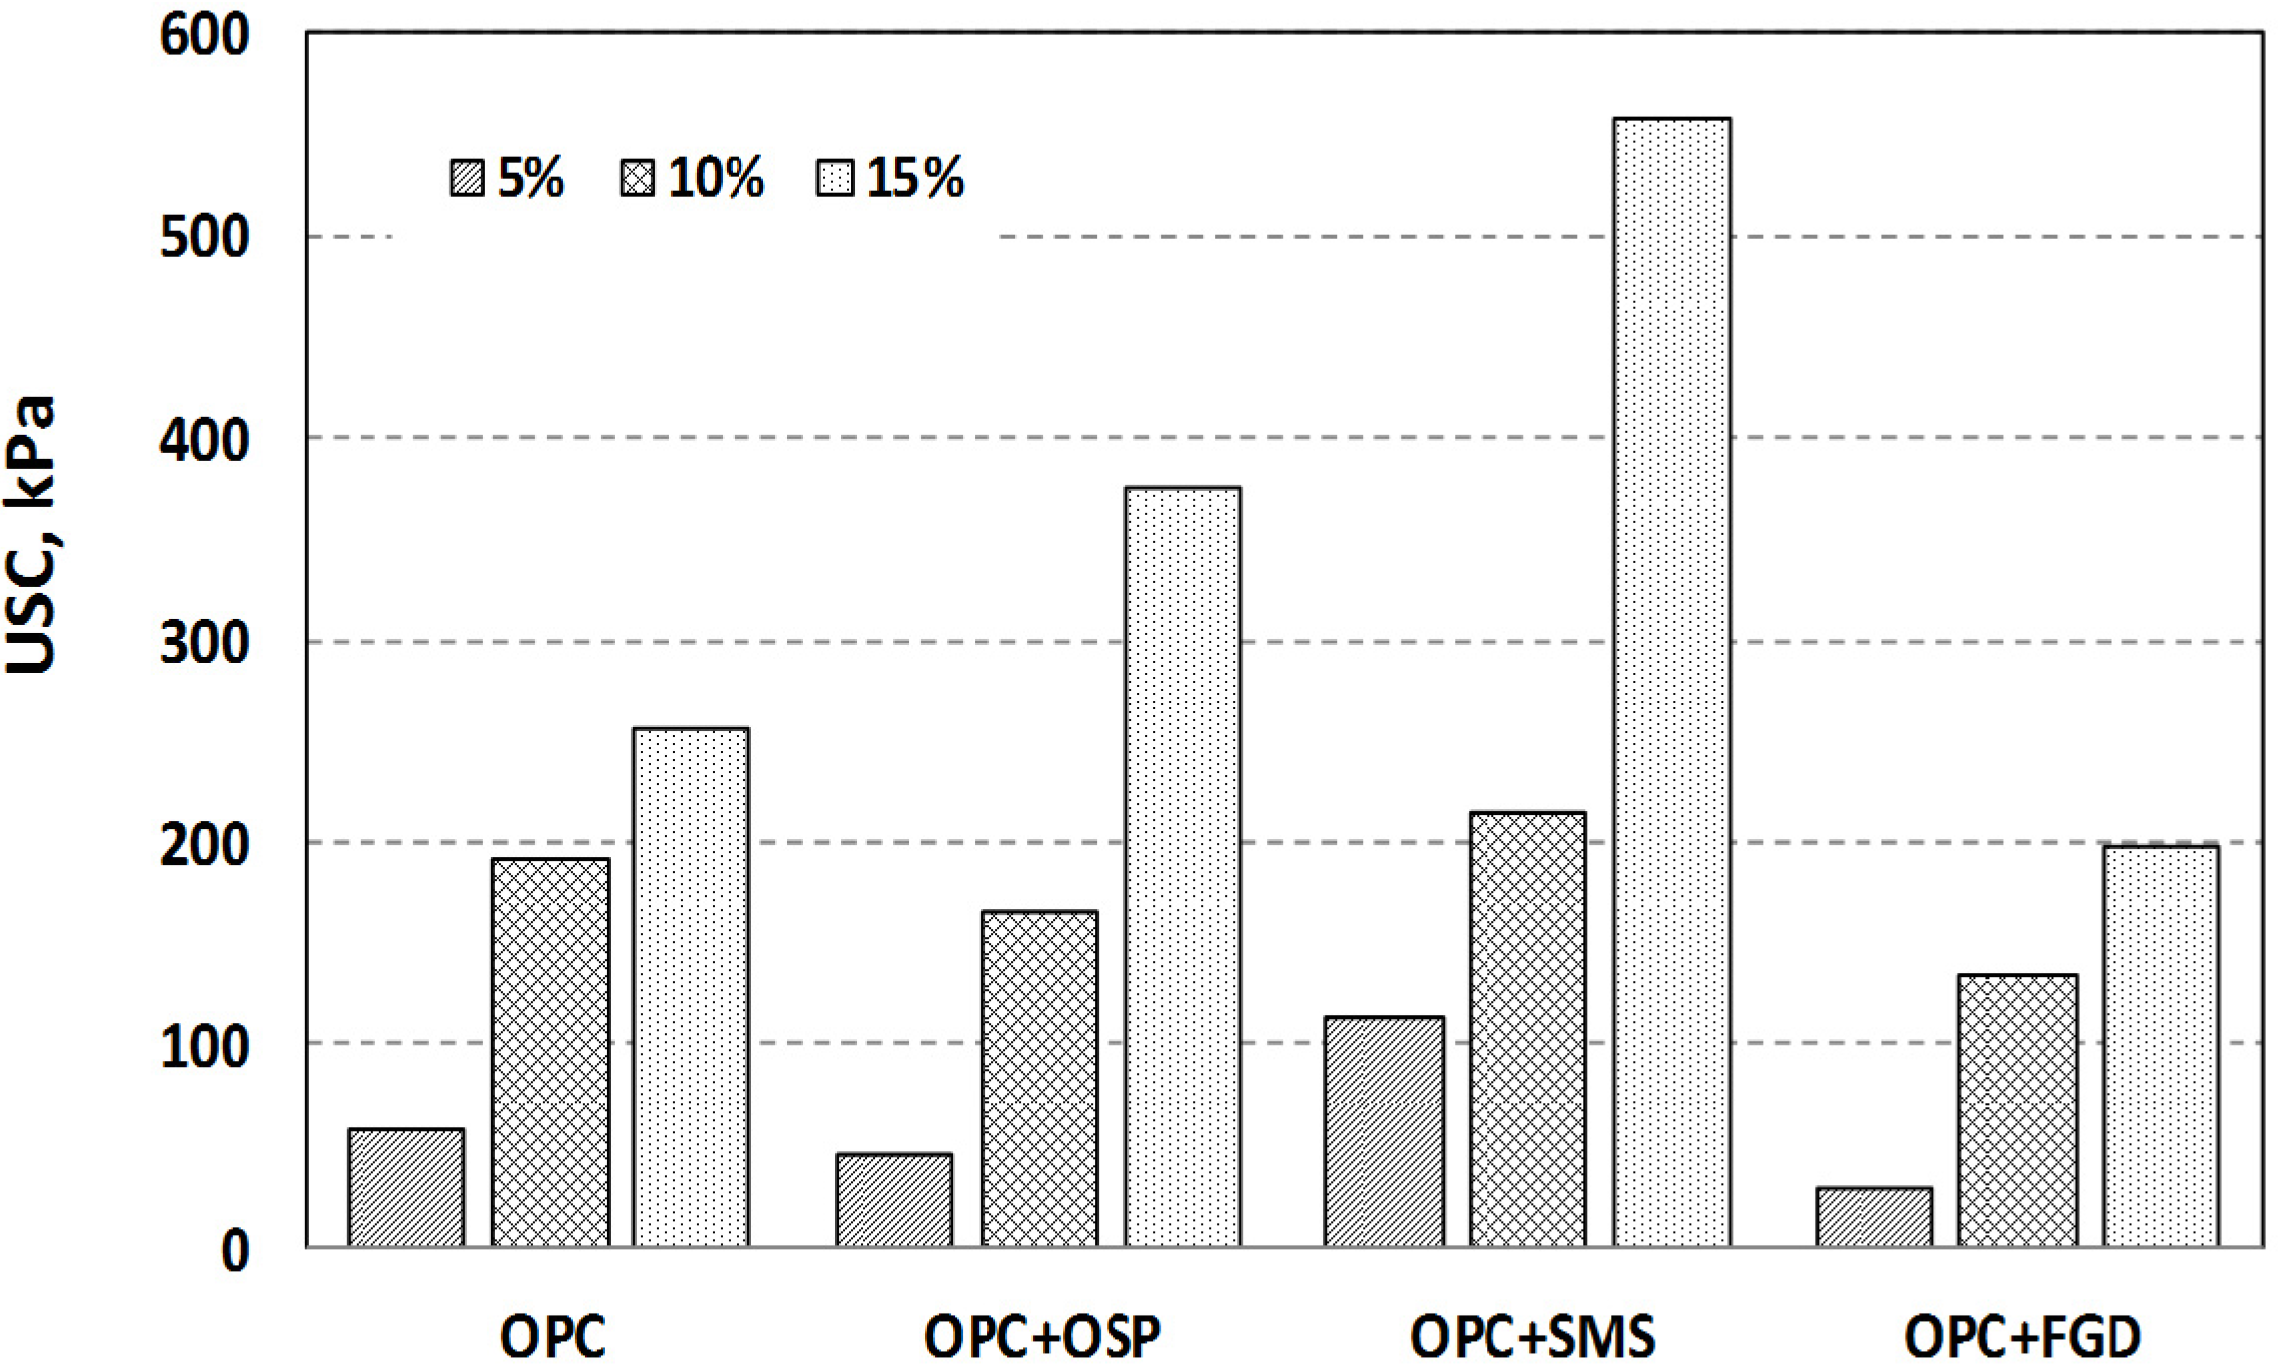
3.1. Unconfined Compressive Strength
| Curing (days) | Additive | Mixing Ratio | pH | Dry Density (g/cm2) | UCS (kPa) |
|---|---|---|---|---|---|
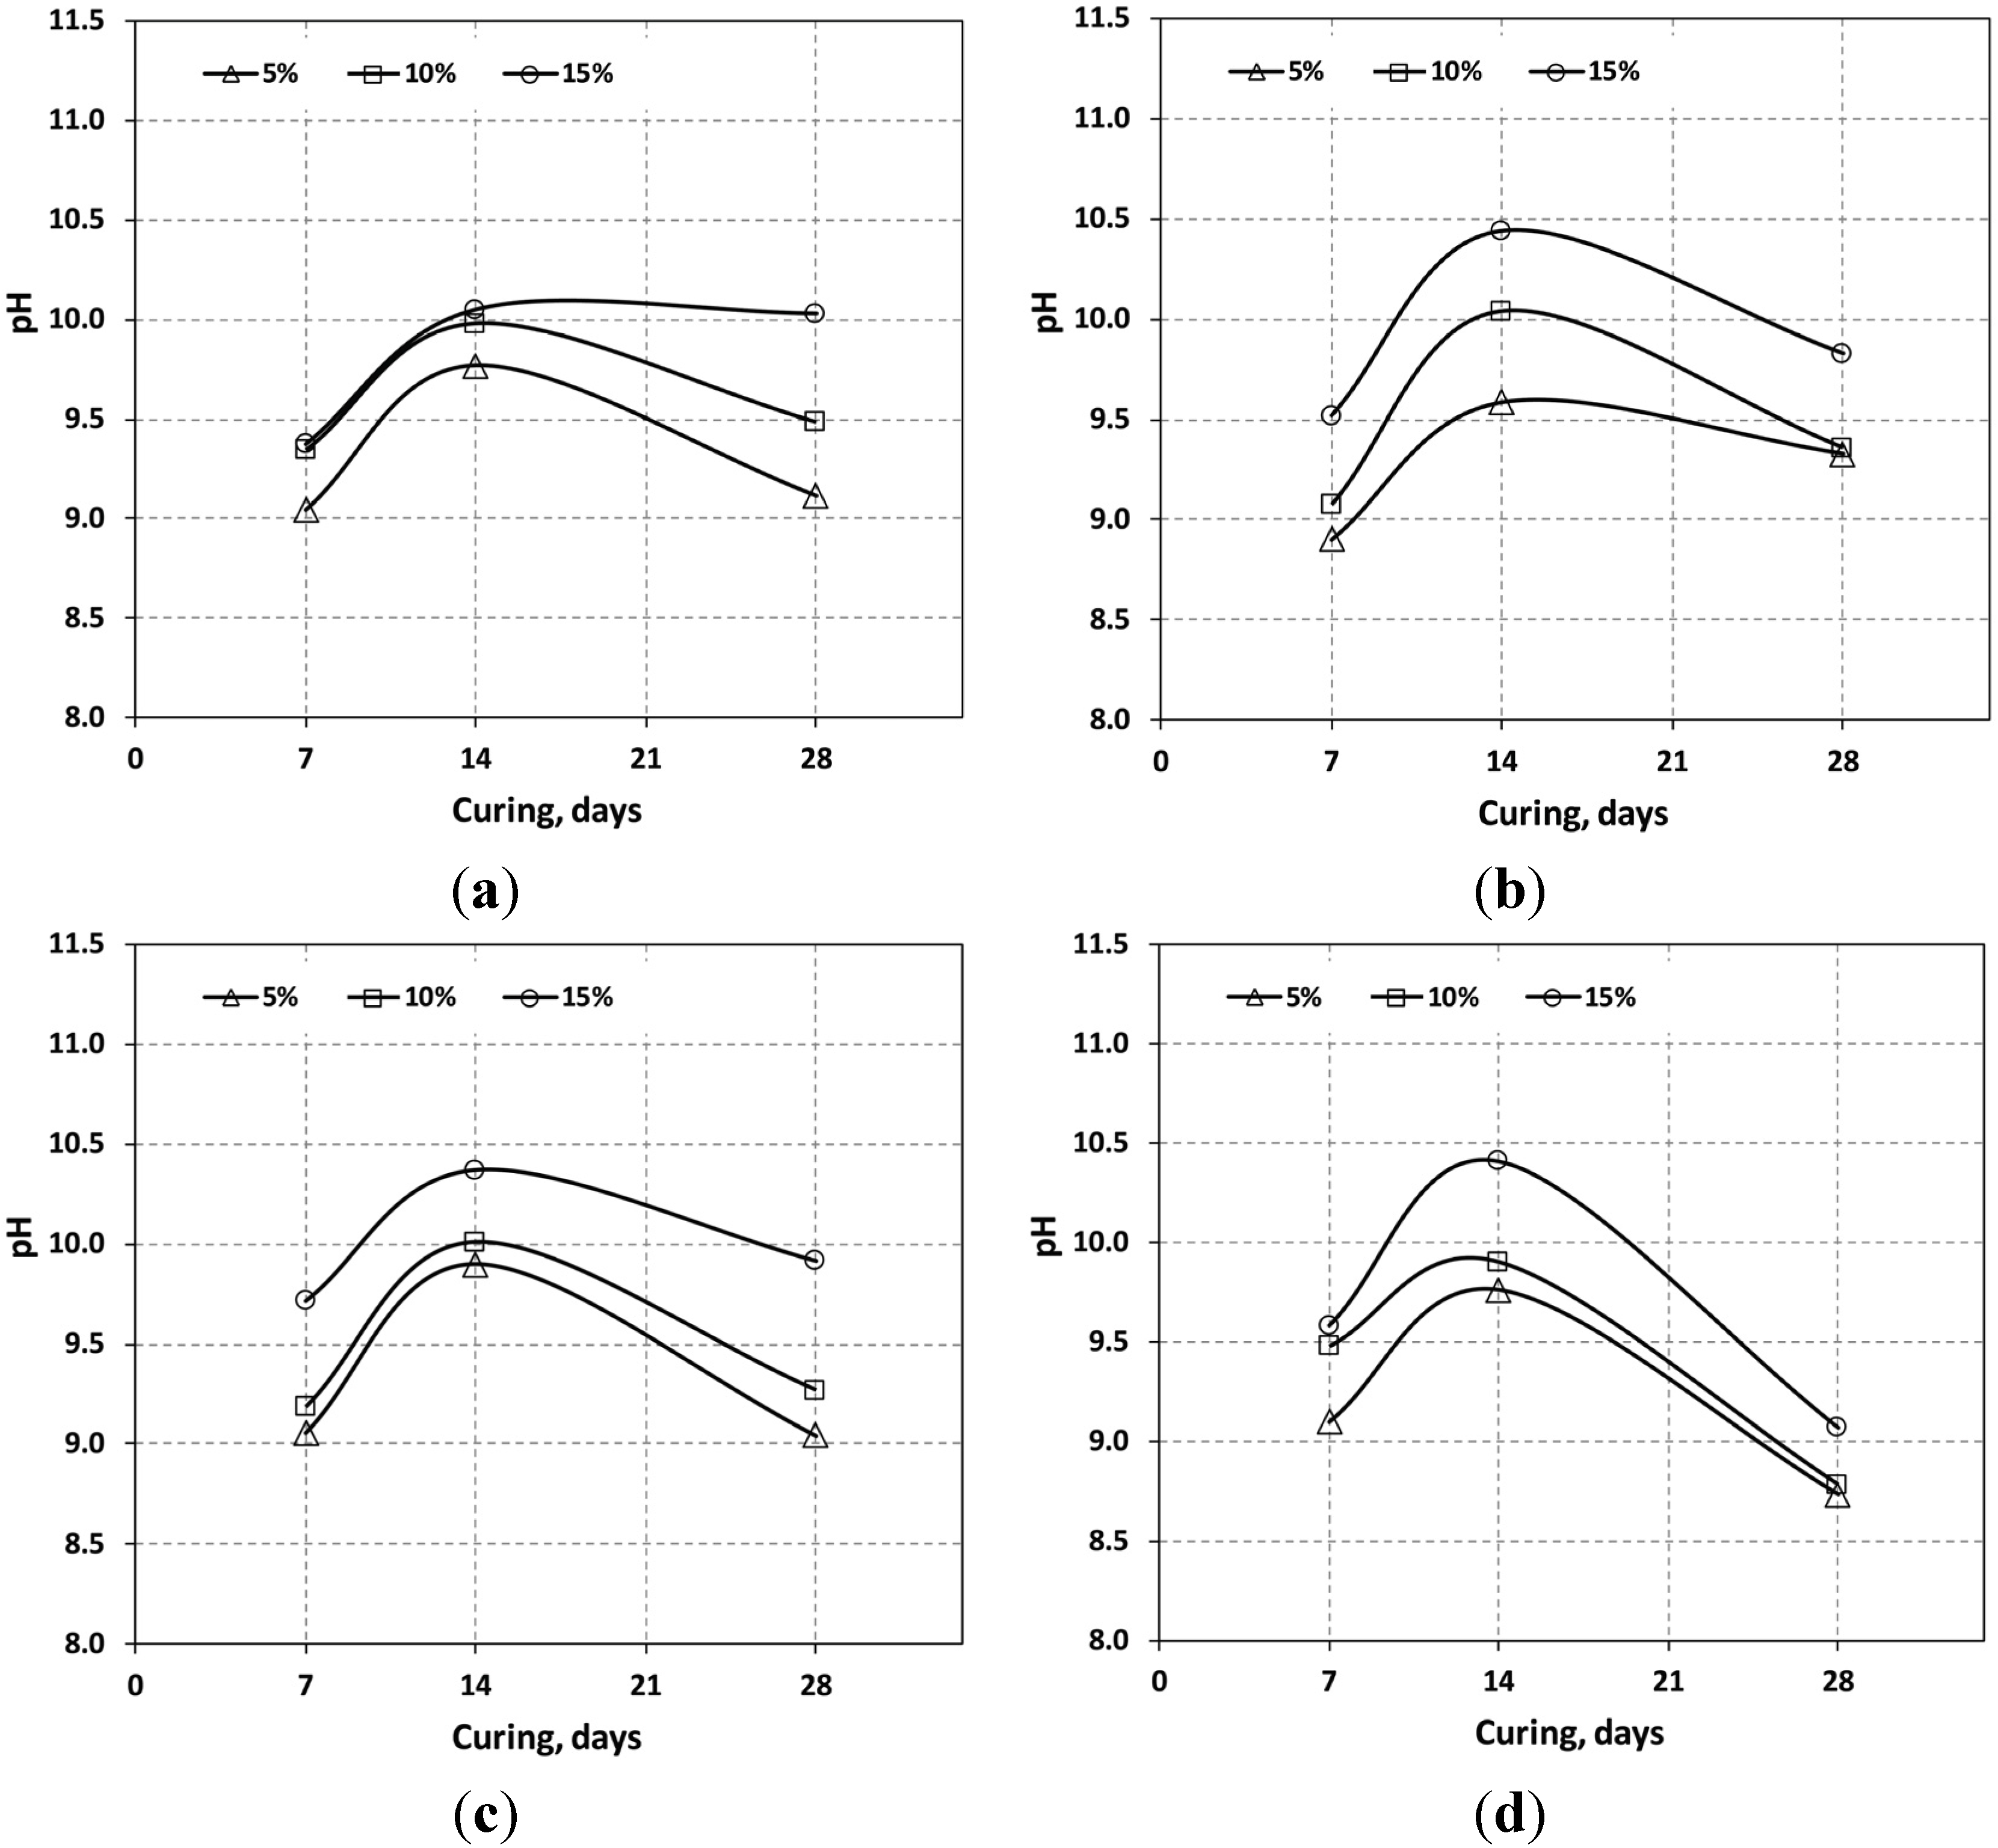
| 7 | OPC | 5% | 9.05 | 1.06 | 42.6 |
| 10% | 9.35 | 1.06 | 131.2 | ||
| 15% | 9.38 | 1.01 | 198.8 | ||
| OPC + OSP | 5% | 8.90 | 1.02 | 36.9 | |
| 10% | 9.08 | 1.01 | 65.1 | ||
| 15% | 9.52 | 0.99 | 123.2 | ||
| OPC + SMS | 5% | 9.06 | 1.02 | 33.9 | |
| 10% | 9.19 | 1.00 | 81.6 | ||
| 15% | 9.72 | 1.03 | 145.6 | ||
| OPC + FGD | 5% | 9.10 | 1.04 | 20.0 | |
| 10% | 9.48 | 1.04 | 98.5 | ||
| 15% | 9.58 | 1.04 | 158.1 | ||
| 14 | OPC | 5% | 9.77 | 1.04 | 51.0 |
| 10% | 9.98 | 1.05 | 140.9 | ||
| 15% | 10.05 | 1.03 | 245.9 | ||
| OPC + OSP | 5% | 9.59 | 1.02 | 41.8 | |
| 10% | 10.04 | 1.02 | 106.2 | ||
| 15% | 10.44 | 1.01 | 148.8 | ||
| OPC + SMS | 5% | 9.90 | 1.02 | 50.6 | |
| 10% | 10.01 | 1.03 | 99.3 | ||
| 15% | 10.37 | 1.05 | 174.4 | ||
| OPC + FGD | 5% | 9.76 | 1.03 | 24.6 | |
| 10% | 9.90 | 1.02 | 109.2 | ||
| 15% | 10.41 | 1.05 | 179.0 | ||
| 28 | OPC | 5% | 9.12 | 1.02 | 57.8 |
| 10% | 9.49 | 1.02 | 191.9 | ||
| 15% | 10.03 | 1.04 | 256.7 | ||
| OPC + OSP | 5% | 9.33 | 1.01 | 44.5 | |
| 10% | 9.36 | 1.04 | 165.8 | ||
| 15% | 9.83 | 1.04 | 376.1 | ||
| OPC + SMS | 5% | 9.04 | 1.02 | 113.5 | |
| 10% | 9.27 | 1.05 | 214.1 | ||
| 15% | 9.92 | 1.02 | 556.7 | ||
| OPC + FGD | 5% | 8.73 | 1.05 | 29.0 | |
| 10% | 8.78 | 1.03 | 133.3 | ||
| 15% | 9.07 | 1.05 | 198.4 |
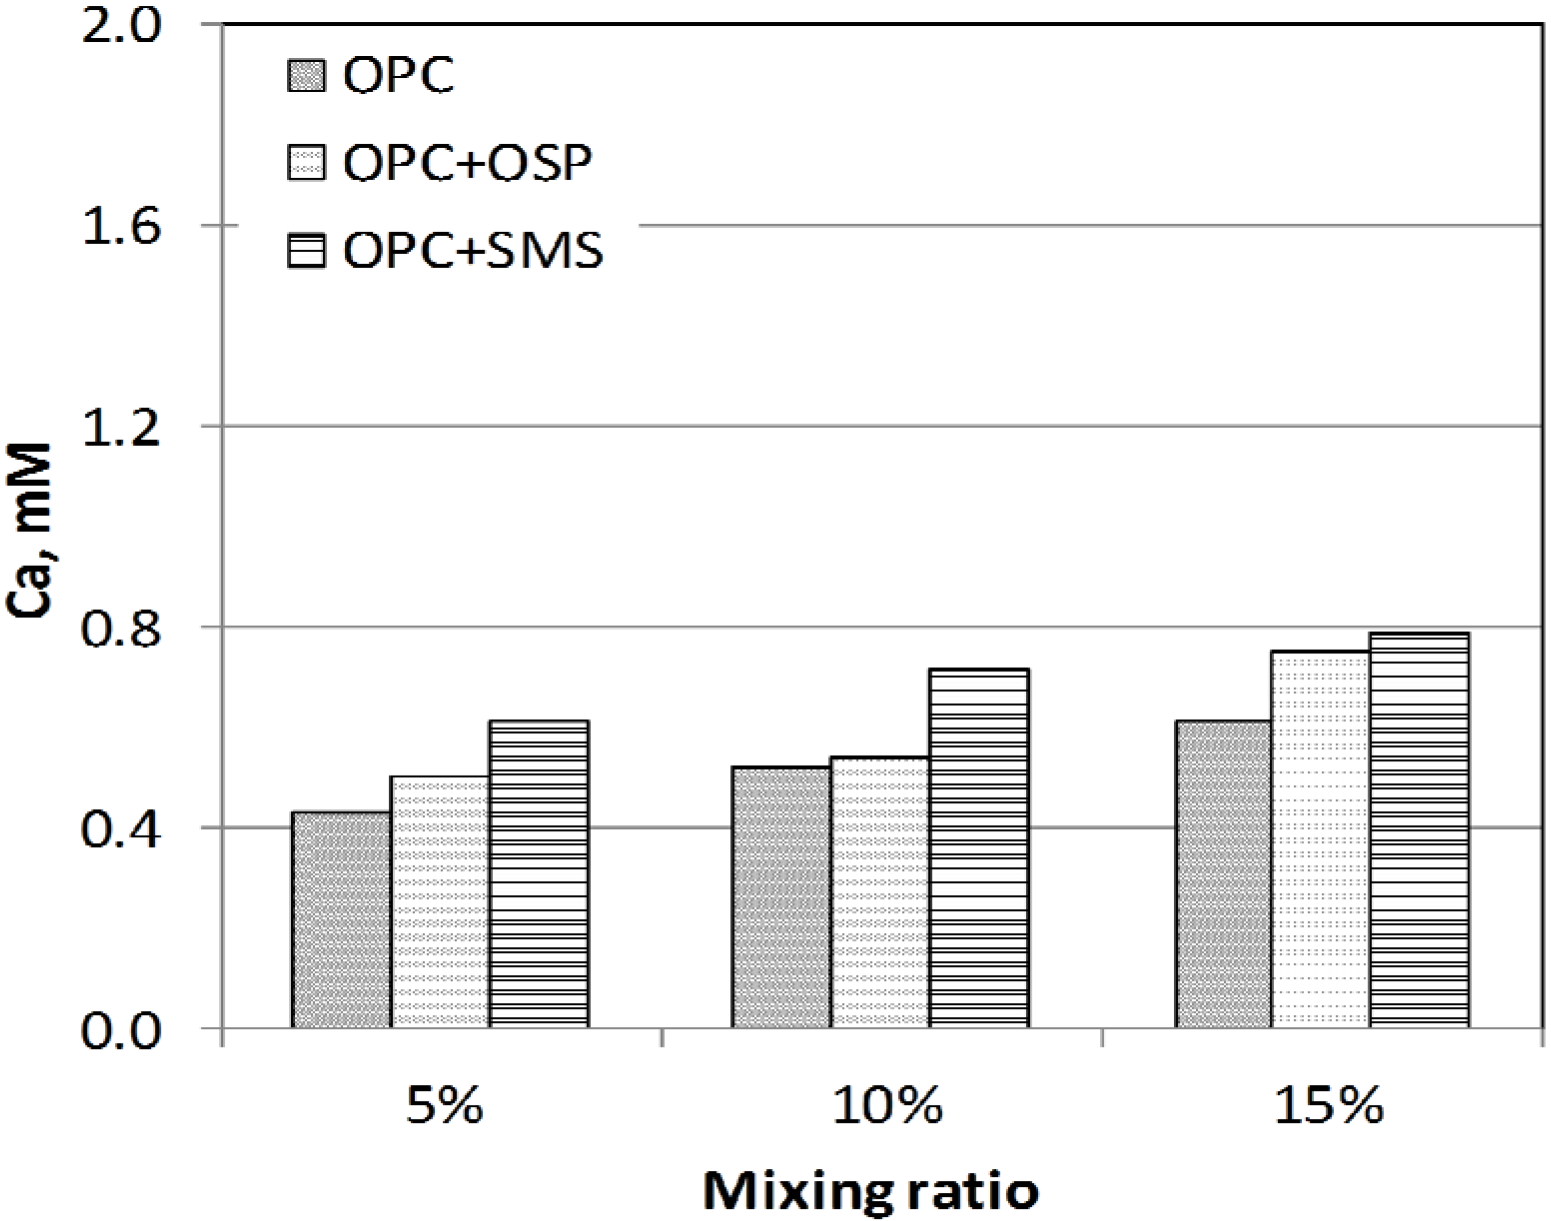
3.2. pH Variation
3.3. Optical Observations
4. Conclusions
Acknowledgments
Author Contributions
Conflicts of Interest
References
- Jauberthie, R.; Rendell, F.; Rangeard, D.; Molez, L. Stabilisation of estuarine silt with lime and/or cement. Appl. Clay Sci. 2010, 50, 395–400. [Google Scholar] [CrossRef]
- Tremblay, H.; Duchesne, J.; Locat, J.; Leroueil, S. Influence of the nature of organic compounds on fine soil stabilization with cement. Can. Geotech. J. 2002, 39, 535–546. [Google Scholar] [CrossRef]
- Paria, S.; Yuet, P.K. Solidification-stabilization of organic and inorganic contaminants using portland cement: A literature review. Environ. Rev. 2006, 14, 217–255. [Google Scholar] [CrossRef]
- Porbaha, A. Recent advances in deep mixing research and development in the USA. Ground Modif. Seism. Mitig. 2006, 152, 45–50. [Google Scholar]
- Masher, A.; Douglas, W.S.; Yang, D.; Jafari, F.; Schaefer, V.R. Cement deep soil mixing (CDSM) for solidification of soft estuarine sediments. Mar. Georesour. Geotechnol. 2007, 25, 221–235. [Google Scholar] [CrossRef]
- Bobet, A.; Hwang, J.; Johnston, C.T.; Santagata, M. One-dimensional consolidation behavior of cement-treated organic soil. Can. Geotech. J. 2011, 48, 1100–1115. [Google Scholar] [CrossRef]
- Oliveira, P.J.V.; Correia, A.A.; Garcia, M.R. Effect of organic matter content and curing conditions on the creep behavior of an artificially stabilized soil. J. Mater. Civ. Eng. 2012, 24, 868–875. [Google Scholar] [CrossRef]
- Al-Tabbaa, A.; Evans, C.W. Medium term performance of stabilised/solidified contaminated soil-grout materials. In Proceedings of the 14th International Conference on Soil Mechanics and Foundation Engineering, Hamburg, Germany, 6–12 September 1997; pp. 1941–1946.
- Al-Tabbaa, A.; Evans, C.W. Pilot in situ auger mixing treatment of a contaminated site. Part 1: Treatability study. Proc. ICE Geotech. Eng. 1998, 131, 52–59. [Google Scholar] [CrossRef]
- Al-Tabbaa, A.; Tabbaa, A.; Evans, C.W.; Wallace, C.J. Pilot in situ auger mixing treatment of a contaminated site. Part 2: Site trial. Proc. ICE Geotech. Eng. 1998, 131, 89–95. [Google Scholar] [CrossRef]
- Gidley, J.S.; Sack, W.A. Environmental aspects of waste utilization in construction. J. Environ. Eng. 1984, 110, 1117–1133. [Google Scholar] [CrossRef]
- Kamon, M.; Nontananandh, S. Combining industrial wastes with lime for soil stabilization. J. Geotech. Eng. 1991, 117, 1–17. [Google Scholar] [CrossRef]
- Chindaprasirt, P.; Jaturapitakkul, C.; Sinsiri, T. Effect of fly ash fineness on microstructure of blended cement paste. Constr. Build. Mater. 2007, 21, 1534–1541. [Google Scholar] [CrossRef]
- Chappex, T.; Scrivener, K. Alkali fixation of C–S–H in blended cement pastes and its relation to alkali silica reaction. Cem. Concr. Res. 2012, 42, 1049–1054. [Google Scholar] [CrossRef]
- Lim, D.I.; Park, Y.A. Late Quaternary stratigraphy and evolution of a Korean tidal flat, Haenam Bay, southeastern Yellow Sea, Korea. Mar. Geol. 2003, 193, 177–194. [Google Scholar] [CrossRef]
- Chung, S.G.; Kim, G.J.; Kim, M.S.; Ryu, C.K. Undrained shear strength from field vane test on Busan clay. Mar. Georesour. Geotechnol. 2007, 25, 167–179. [Google Scholar] [CrossRef]
- Taylor, H.F.W. Cement Chemistry, 2nd ed.; Thomas Telford Publishing Ltd.: White Plains, NY, USA, 1997. [Google Scholar]
- Hewlett, P.C. Lea’s Chemistry of Cement and Concrete, 4th ed.; Butterworth-Heinemann: Burlington, MA, USA, 2004. [Google Scholar]
- Kuo, W.T.; Wang, H.Y.; Shu, C.Y.; Su, D.S. Engineering properties of controlled low-strength materials containing waste oyster shells. Constr. Build. Mater. 2013, 46, 128–133. [Google Scholar] [CrossRef]
- Ministry of Environment of South Korea. Standard Methods for Wastes; Ministry of Environment of South Korea: Seoul, Korea, 2012.
- Japan Cement Association. Manual of Soft Ground Improvement using Solidifying Agents of Cement based System, 2nd ed.; Japan Cement Association: Tokyo, Japan, 1994. [Google Scholar]
- American Society for Testing Materials. Standard Test Method for Compressive Strength of Cylindrical Concrete Specimens; ASTM C 39-96; ASTM International: West Conshohocken, PA, USA, 1998. [Google Scholar]
- Eatone, A.D.; Closceri, L.S.; Greenberg, A.E. Standard Methods for the Examination of Water and Wastewater, 19th ed.; American Public Health Association (APHA): Washington, DC, USA, 1995. [Google Scholar]
- Li, G.; Xu, X.; Chen, E.; Fan, J.; Xiong, G. Properties of cement-based bricks with oyster-shells ash. J. Clean. Prod. 2015, 91, 279–287. [Google Scholar] [CrossRef]
- Ding, Y.; Fang, Y.; Fang, H.; Zhang, Q.; Zhang, F.; Oh, W.C. Study on the retarding mechanism and strength loss of gypsum from hydrolyzed wheat protein retarder. J. Korean Ceram. Soc. 2015, 52, 28–32. [Google Scholar] [CrossRef]
- Peng, J.; Zhang, J.; Chen, M.; Wu, L.; Qu, J. Influence of macromolecule-type retarders on the hydration process of building gypsum and its retarding mechanism. J. Chin. Ceram. Soc. 2008, 36, 896–900. (In Chinese) [Google Scholar]
- Li, X.G.; Xu, R.Q.; Rong, X.N. Assessment of strength development in cement-admixed artificial organic soil with GX07. J. Cent. South Univ. 2012, 19, 2999–3005. [Google Scholar] [CrossRef]
- Park, S.B.; Tia, M. An experimental study on the water-purification properties of porous concrete. Cem. Concr. Res. 2004, 34, 177–184. [Google Scholar] [CrossRef]
© 2015 by the authors; licensee MDPI, Basel, Switzerland. This article is an open access article distributed under the terms and conditions of the Creative Commons Attribution license (http://creativecommons.org/licenses/by/4.0/).
Share and Cite
Park, C.-G.; Yun, S.-W.; Baveye, P.C.; Yu, C. Effect of Industrial By-Products on Unconfined Compressive Strength of Solidified Organic Marine Clayey Soils. Materials 2015, 8, 5098-5111. https://doi.org/10.3390/ma8085098
Park C-G, Yun S-W, Baveye PC, Yu C. Effect of Industrial By-Products on Unconfined Compressive Strength of Solidified Organic Marine Clayey Soils. Materials. 2015; 8(8):5098-5111. https://doi.org/10.3390/ma8085098
Chicago/Turabian StylePark, Chan-Gi, Sung-Wook Yun, Phillippe C. Baveye, and Chan Yu. 2015. "Effect of Industrial By-Products on Unconfined Compressive Strength of Solidified Organic Marine Clayey Soils" Materials 8, no. 8: 5098-5111. https://doi.org/10.3390/ma8085098