
Engineering of Iron-Based Magnetic Activated Carbon Fabrics for Environmental Remediation


Abstract
:
1. Introduction
2. Experimental Part
2.1. Materials
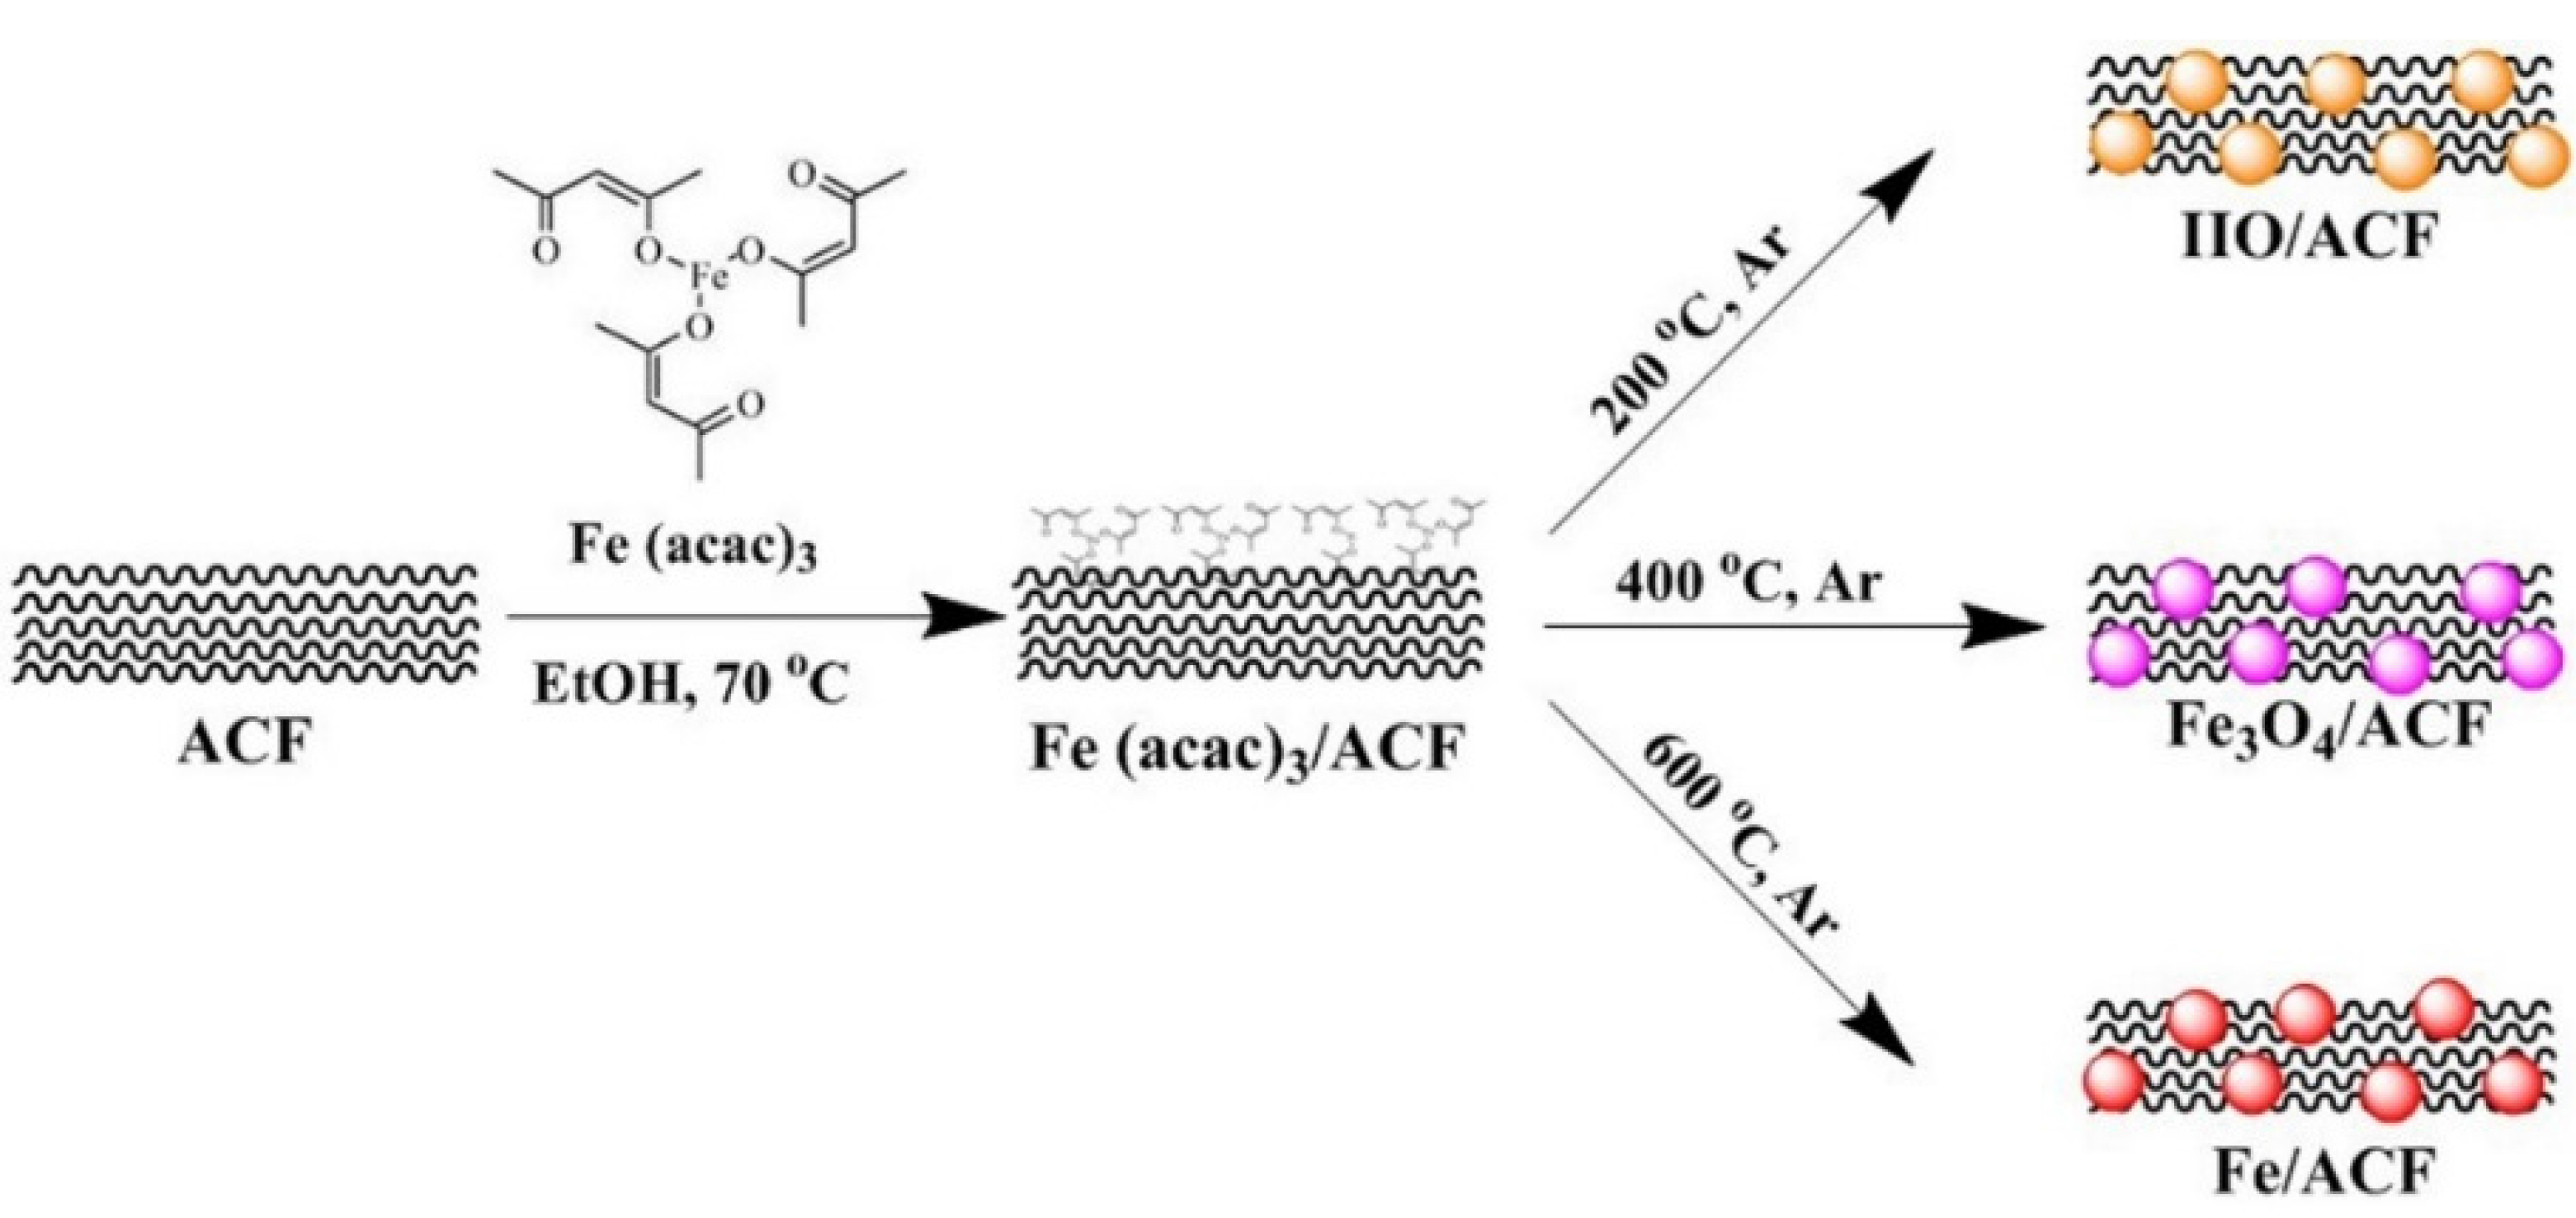
2.2. Synthesis of Iron Oxides and Fe Nanoparticles within the ACF
2.3. Doping Pd Nanoparticles onto the Fe/ACF
2.4. Characterization of the Various ACF
2.5. Environmental Activity
3. Results and Discussion
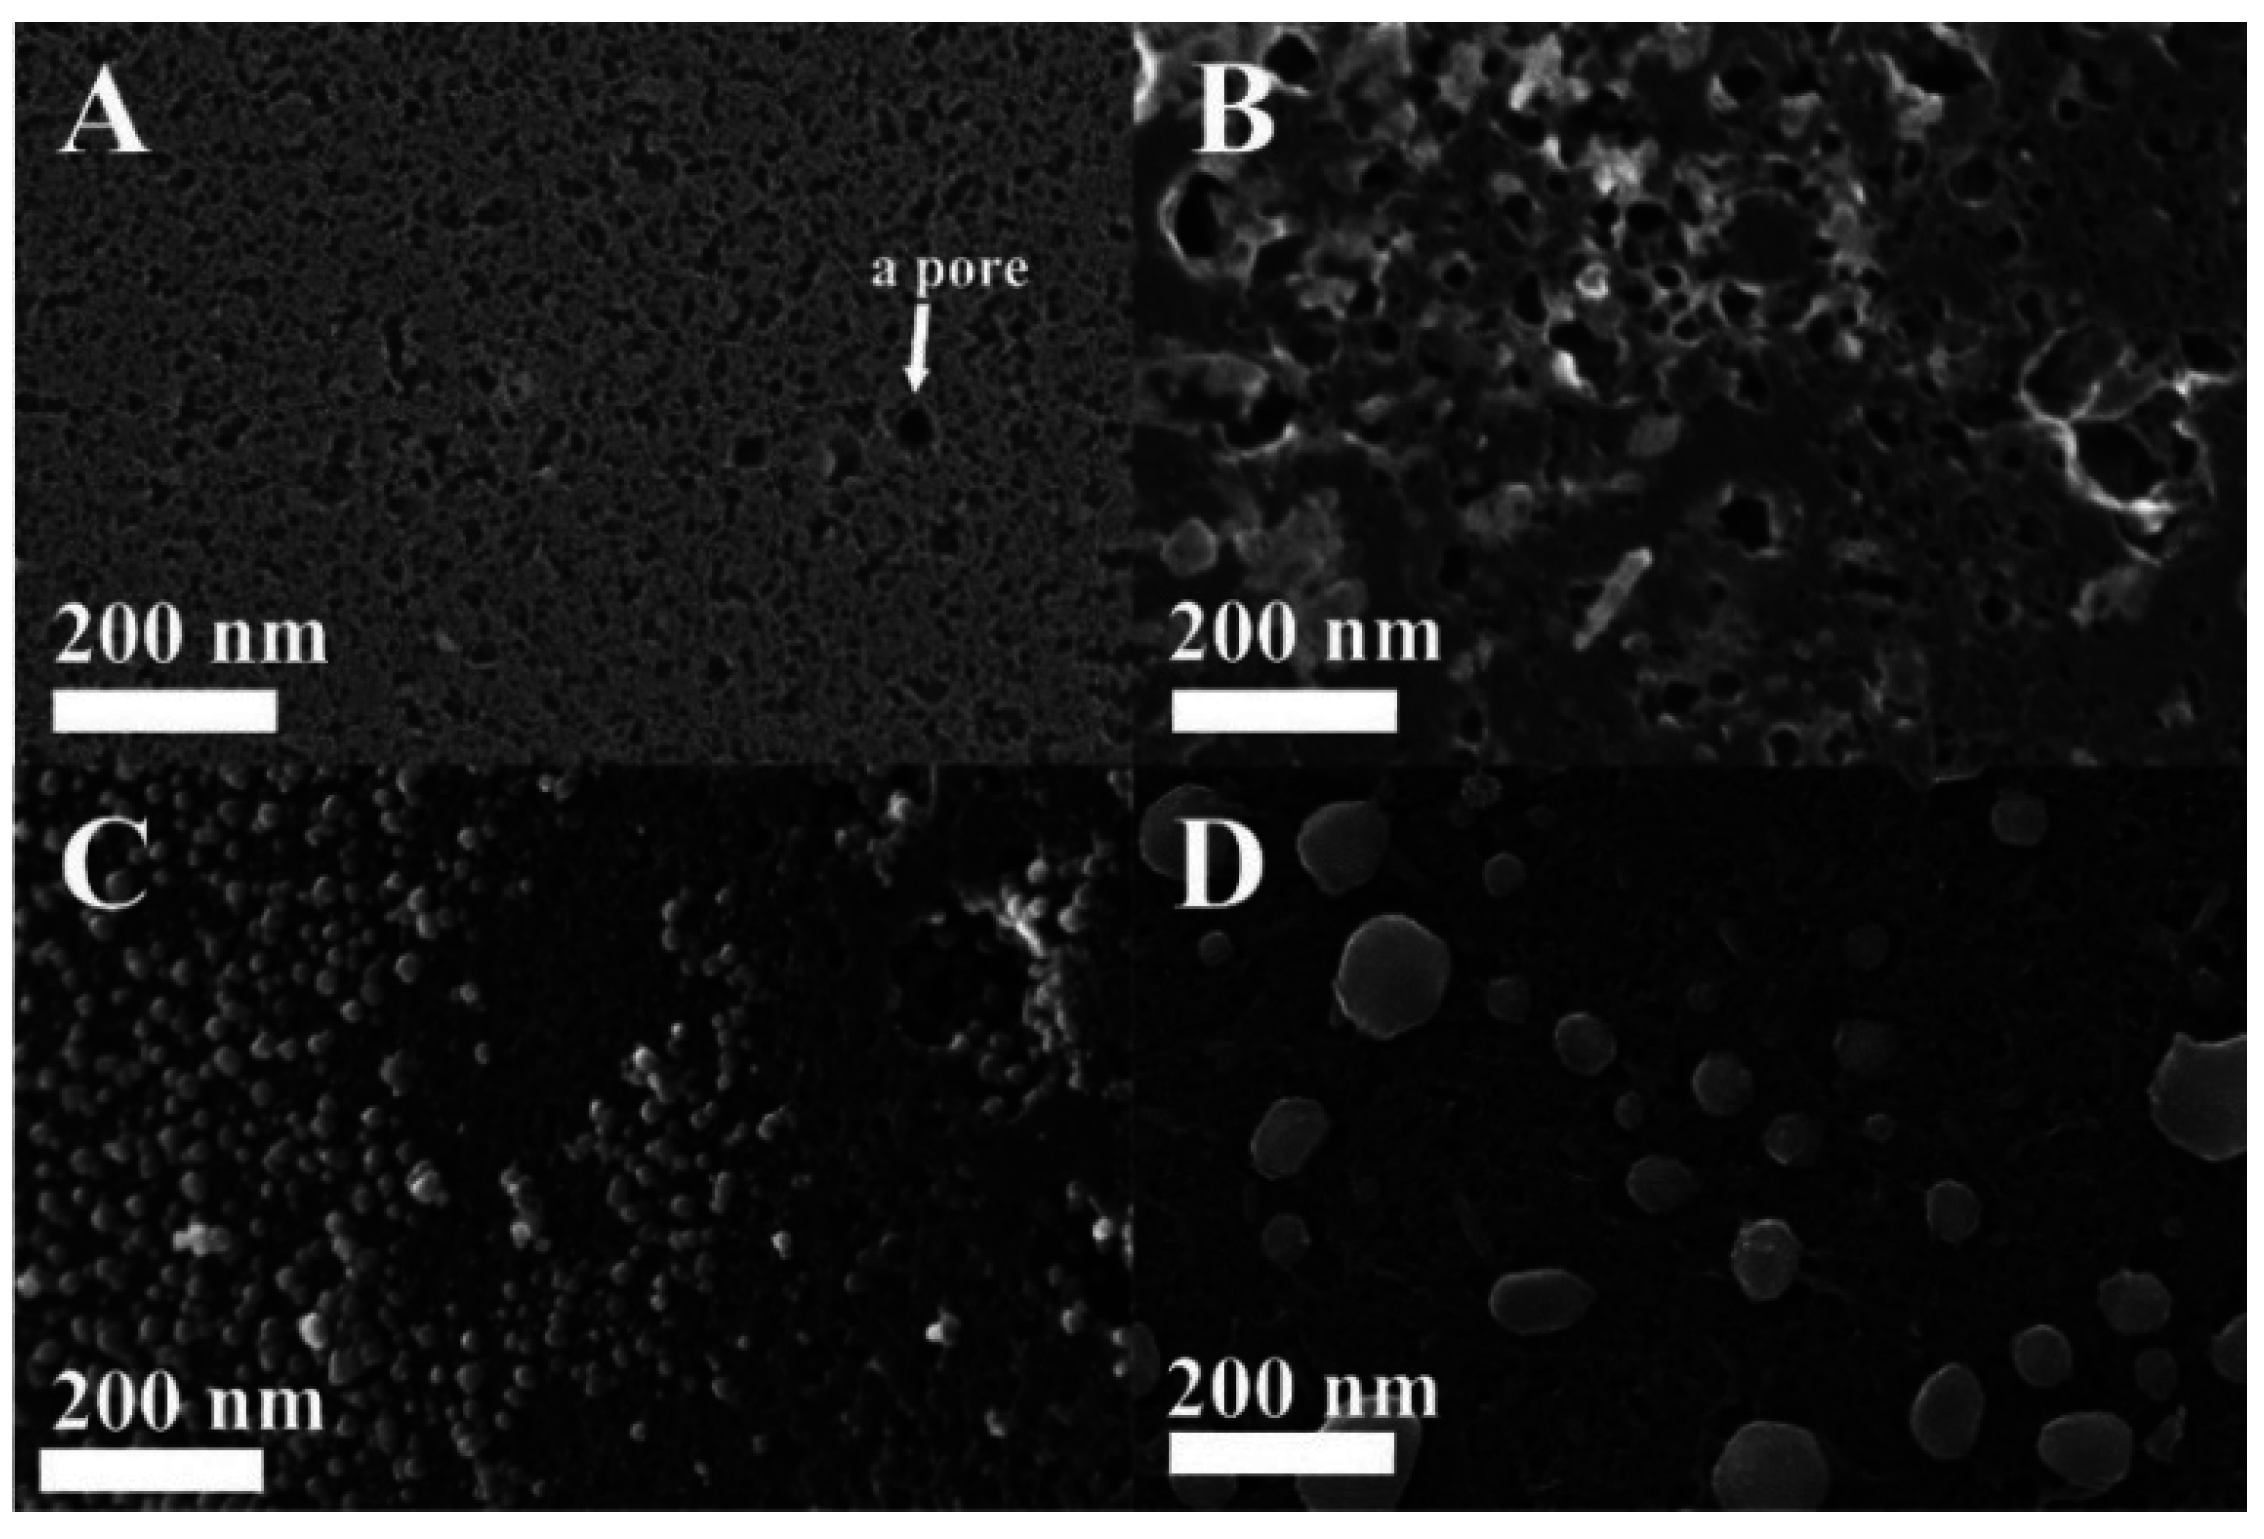
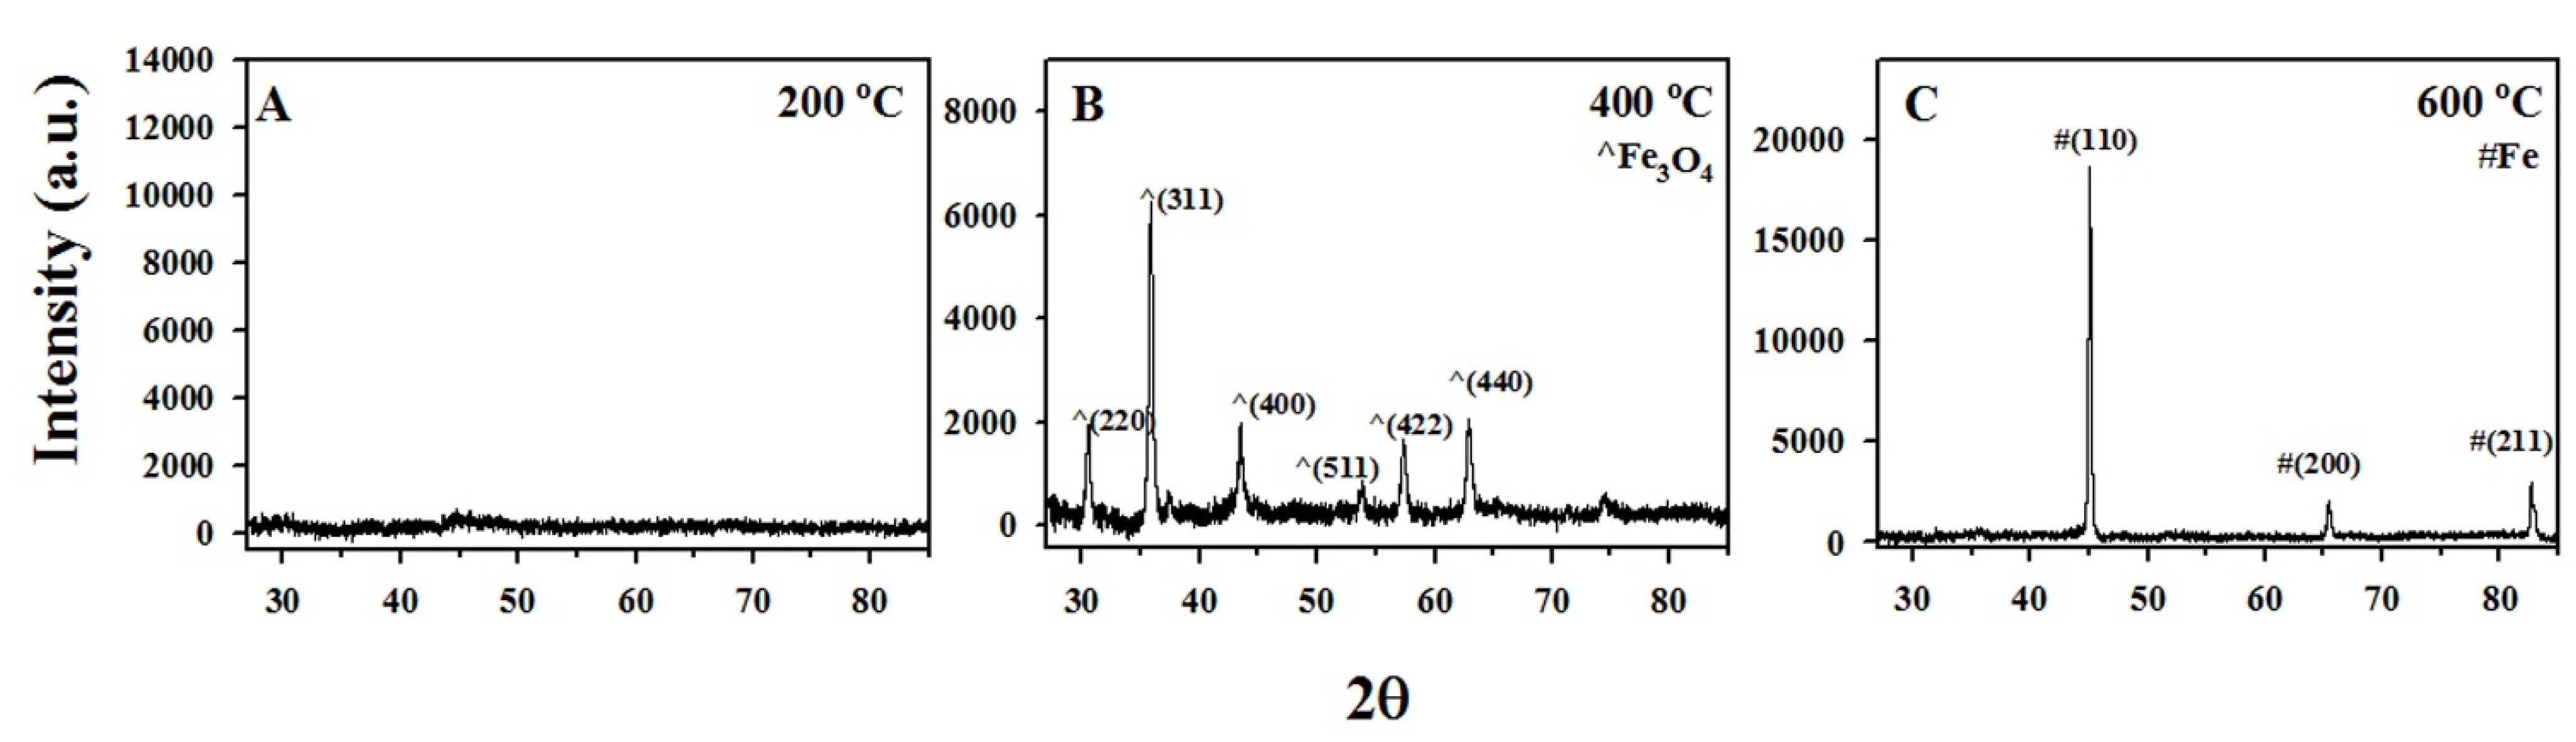
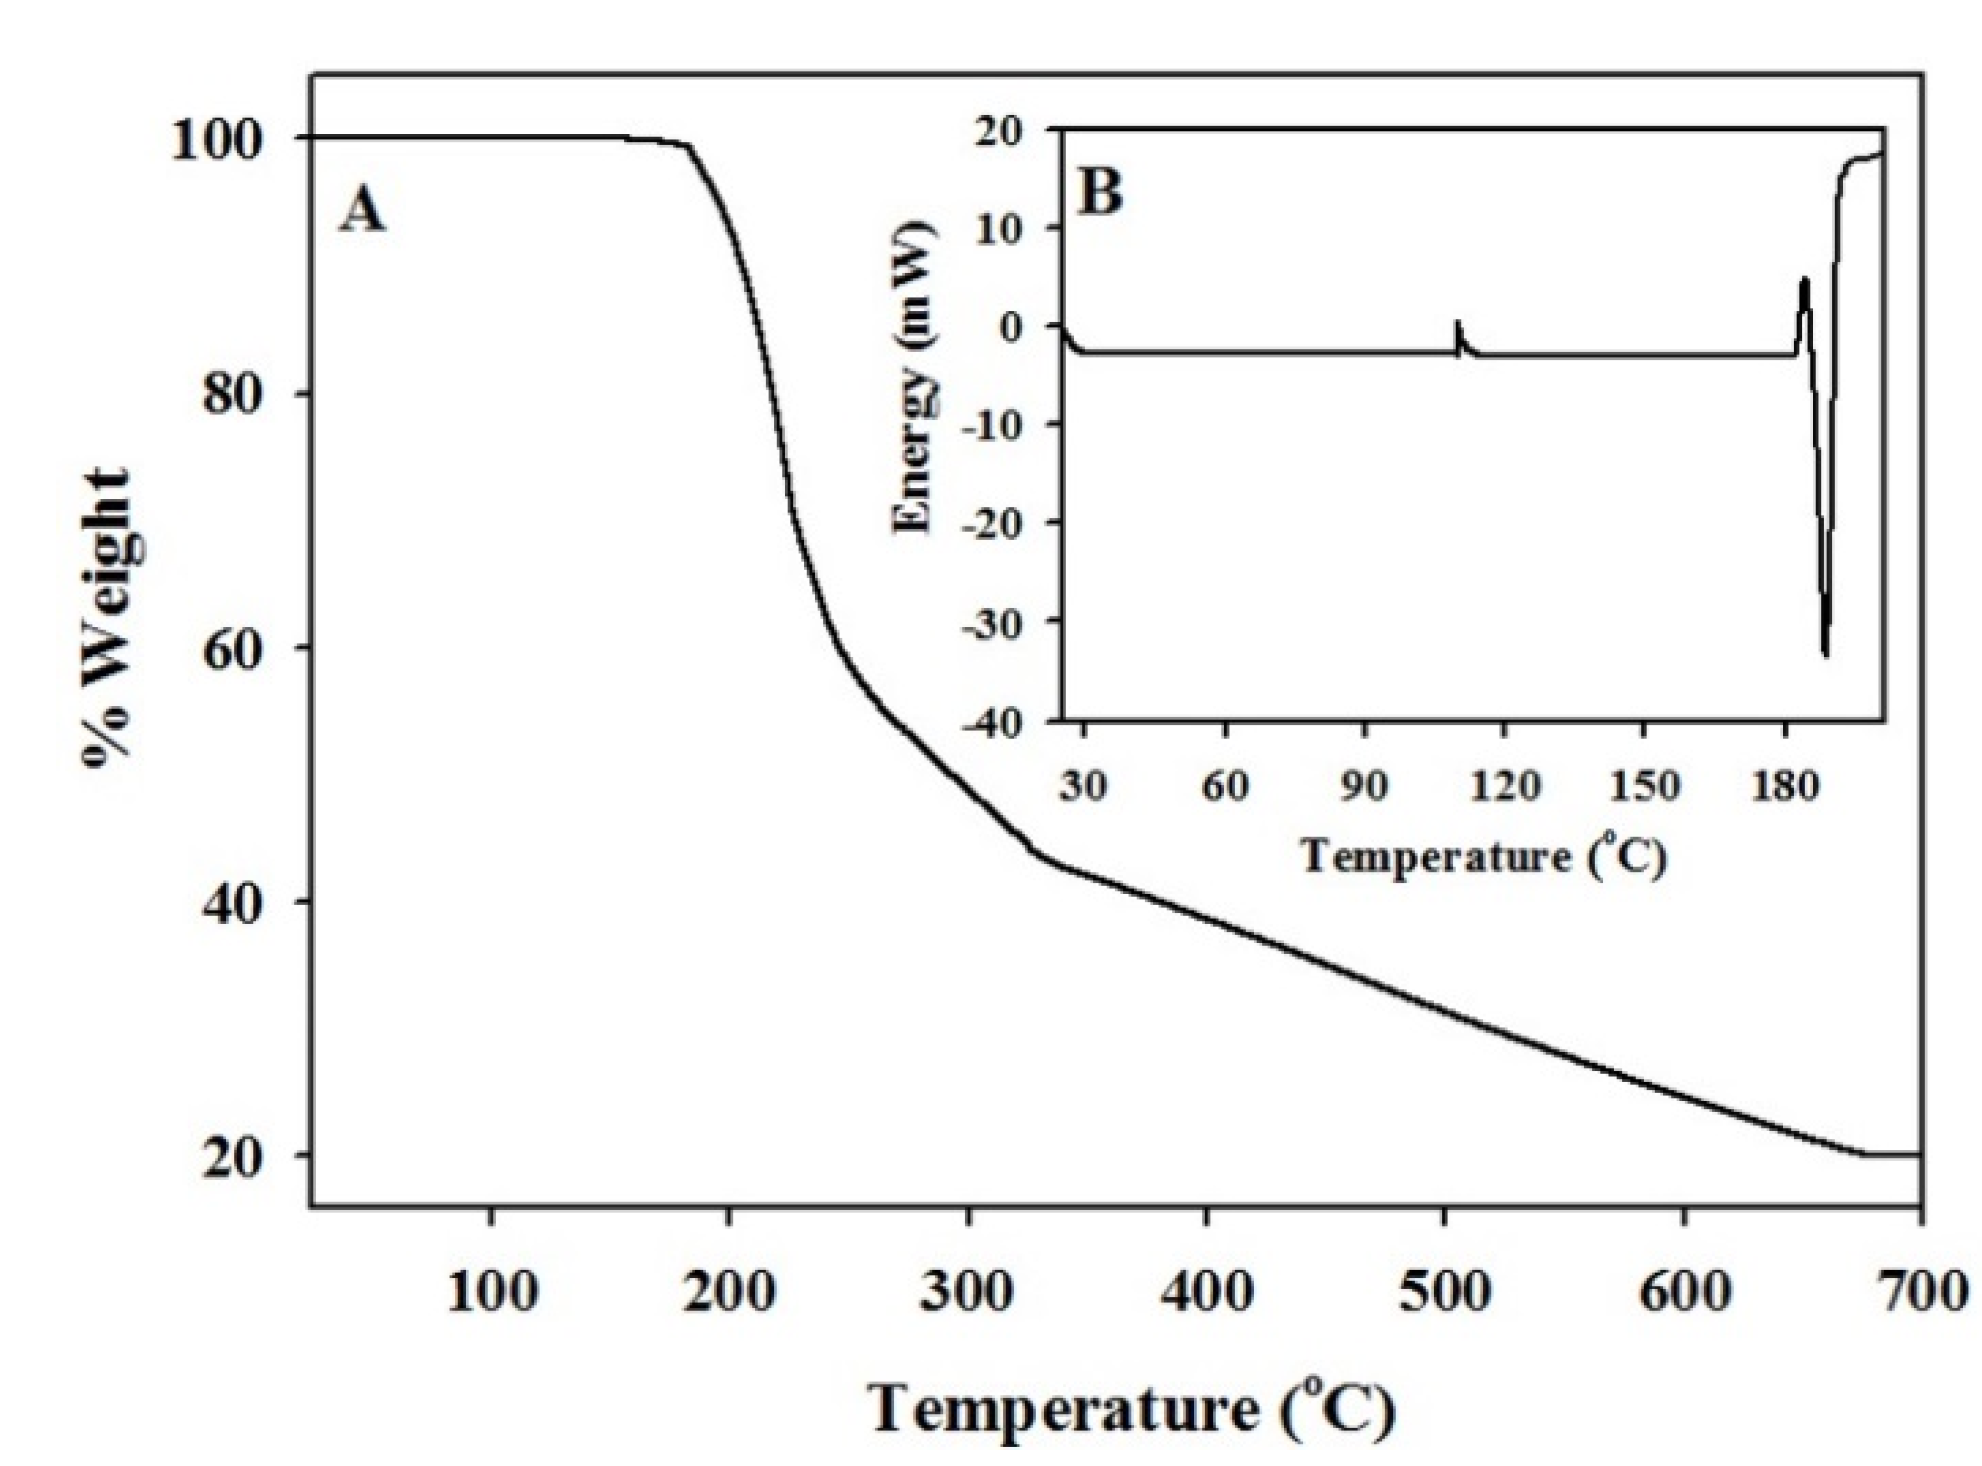
3.1. Characterization of The Functionalized ACF


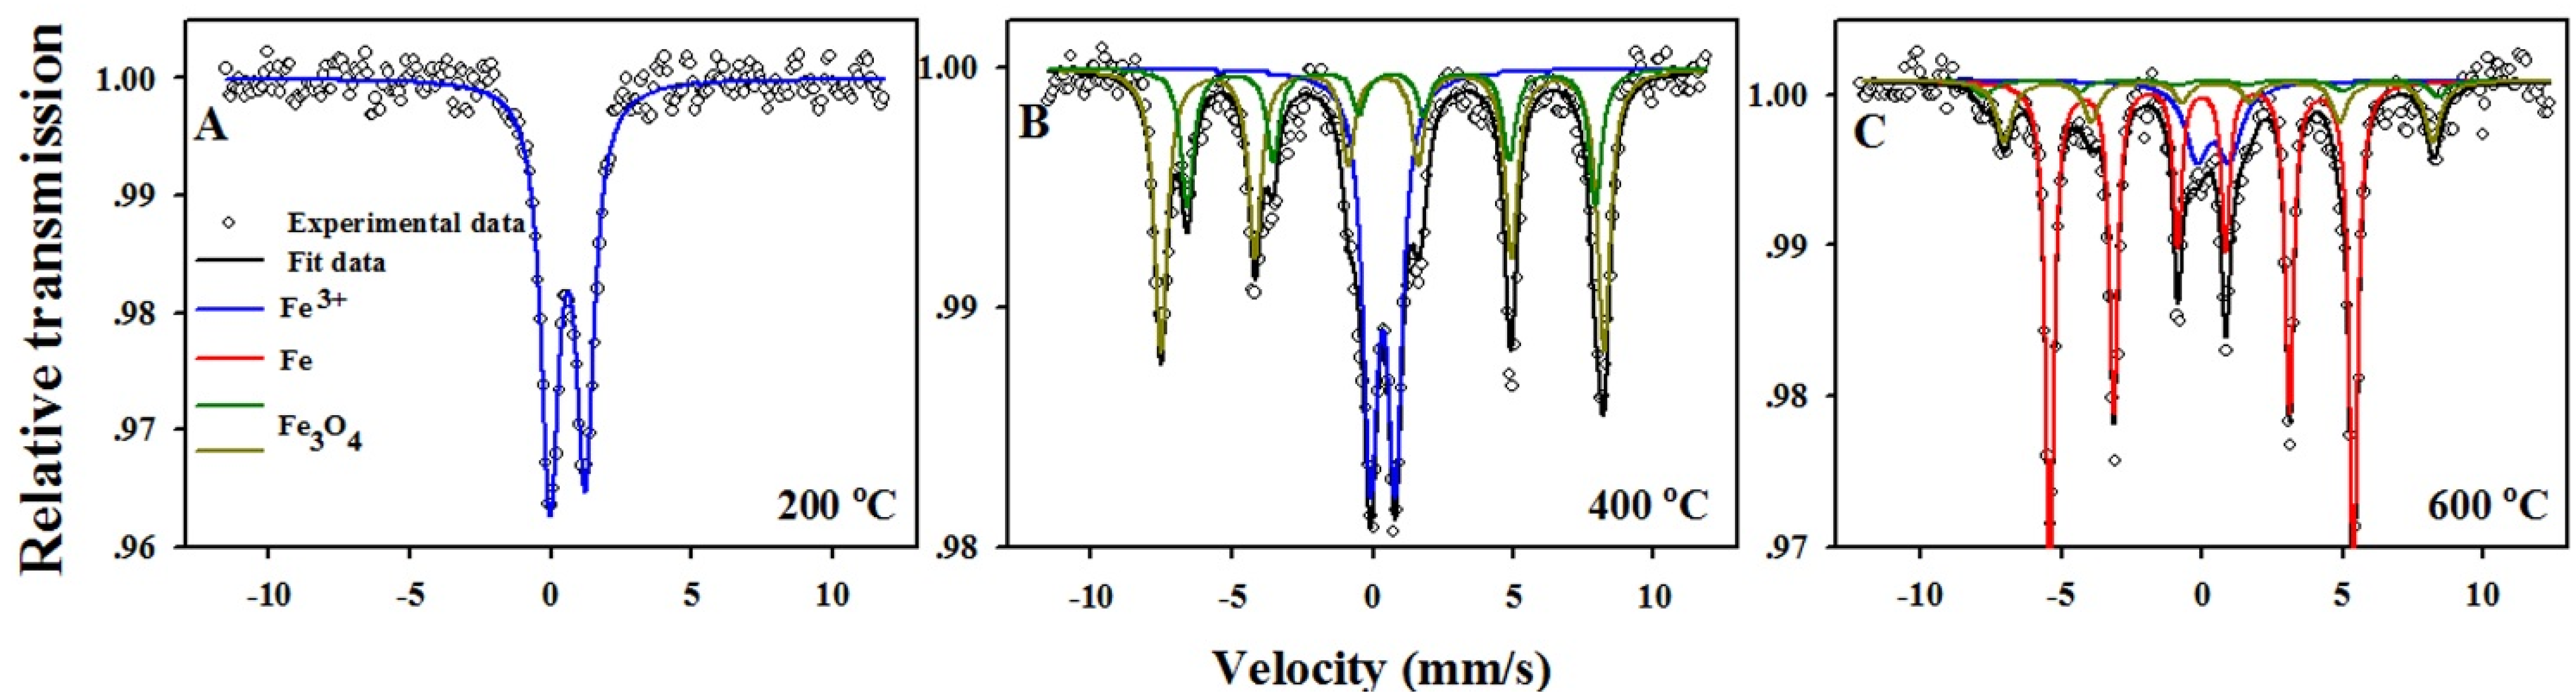
| Temp (°C) | IS (mm·s−1) | QS (mm·s−1) | LW (mm·s−1) | H (kOe) | Composition (wt.%) |
|---|---|---|---|---|---|
| 200 | 0.39 | 0.77 | 0.47 | 0 | 100 IIO |
| 400 | 0.38 | 0 | 0.54 | 489 | 65.2 Fe3O4 |
| 0.67 | 0 | 0.54 | 450 | ||
| 0.38 | 0.88 | 0.62 | 0 | 34.8 IIO | |
| 600 | 0.39 | 1.15 | 1.02 | 0 | 67.1 Fe |
| 0.29 | 0.02 | 0.65 | 501 | 19.2 Fe3O4 | |
| 0.53 | 0.11 | 0.65 | 473 | ||
| 0 | 0 | 0.35 | 335 | 13.8 IIO |

| Sample | Fe (wt.%) | Composition (%) | Ms (emu·g−1) | Coercivity (Oe) | Surface Area (m2·g−1) | Pore Volume (cm3·g−1) | Raman (Id/Ig) |
|---|---|---|---|---|---|---|---|
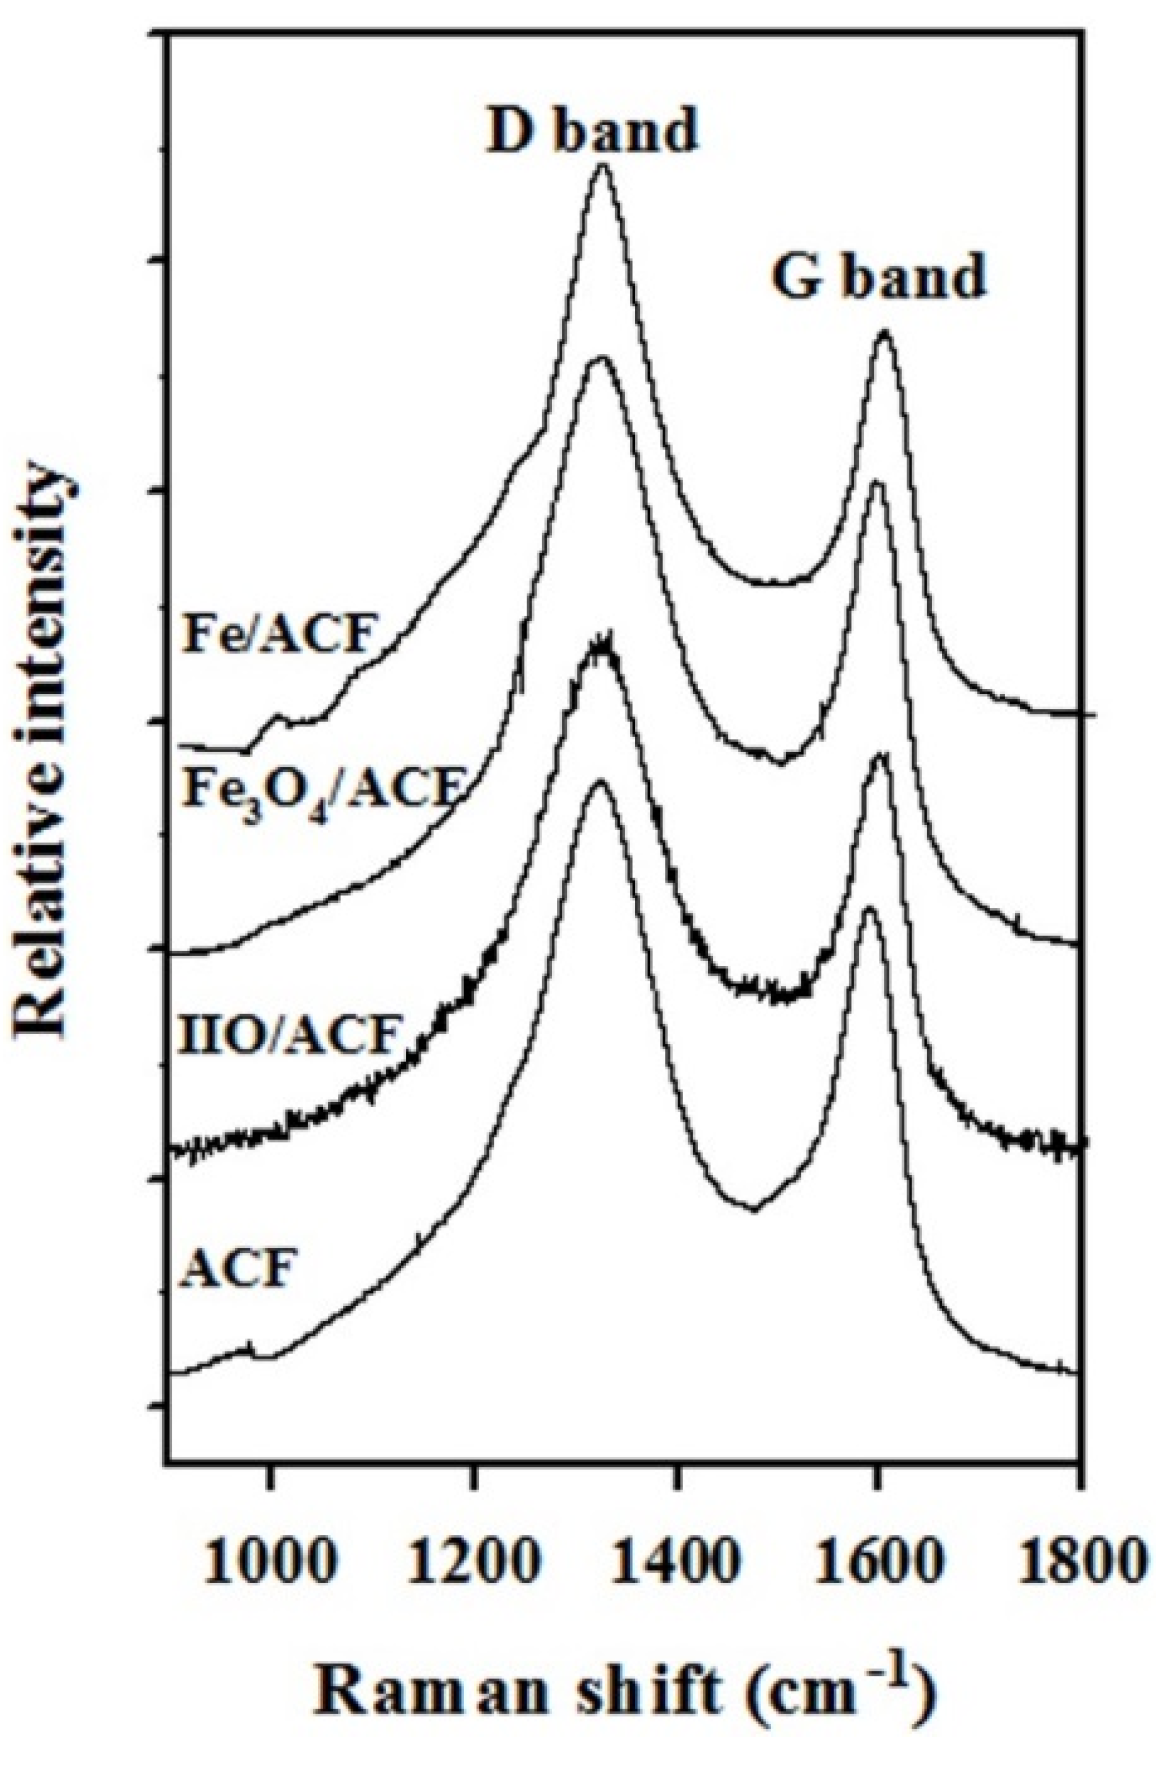
| ACF | – | – | – | – | 1292 | 0.70 | 1.23 |
| IIO/ACF | 11.9 | 100 IIO | – | – | 572 | 0.32 | 1.29 |
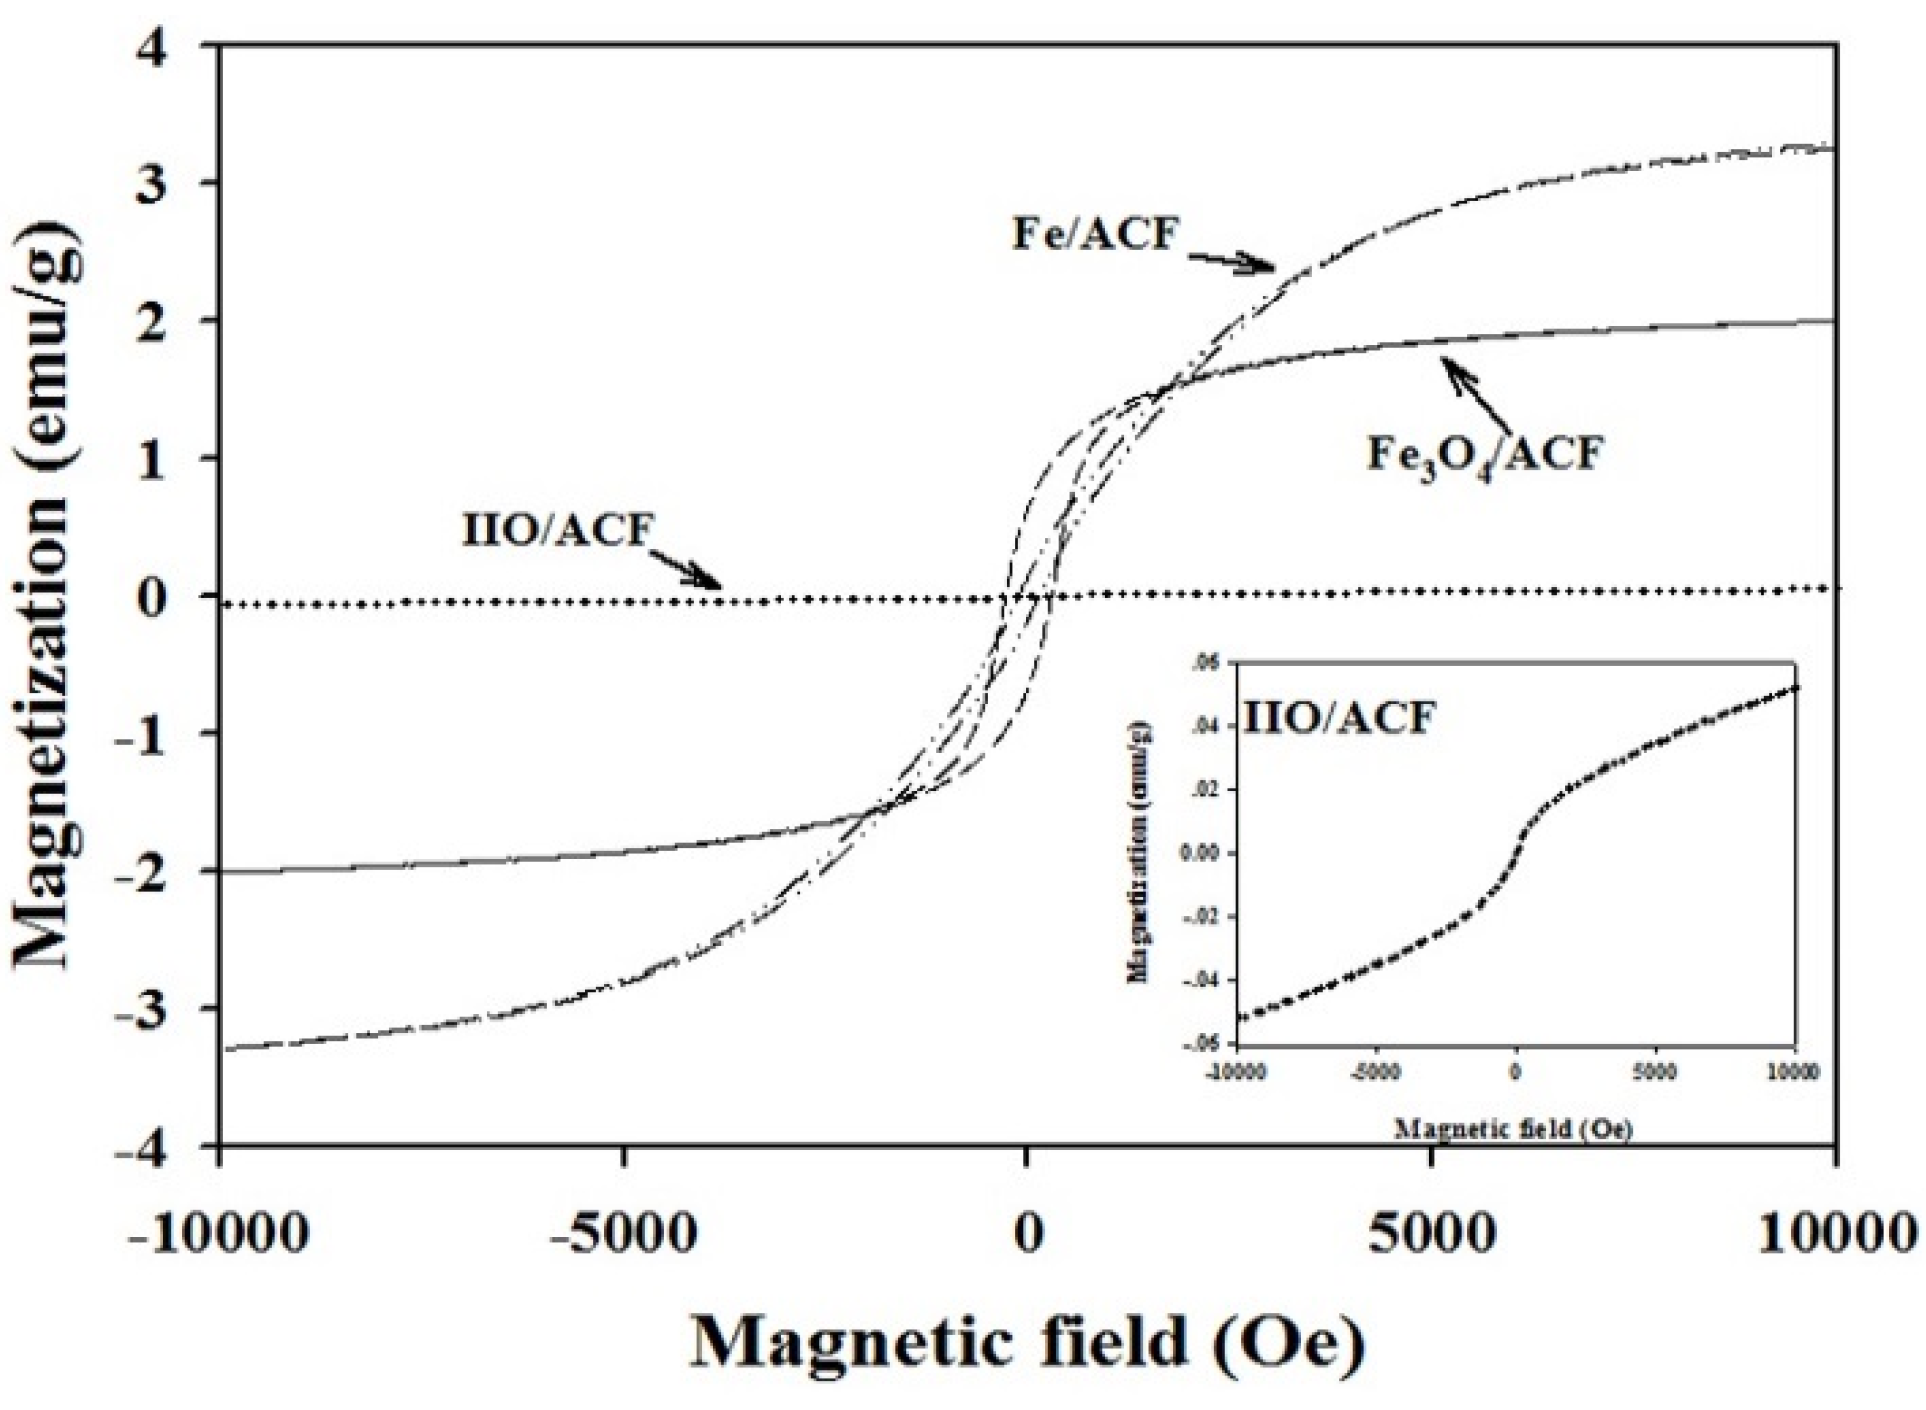
| Fe3O4/ACF | 10.7 | 65.2 Fe3O4 34.8 IIO | 2.00 | 275 | 718 | 0.40 | 1.31 |
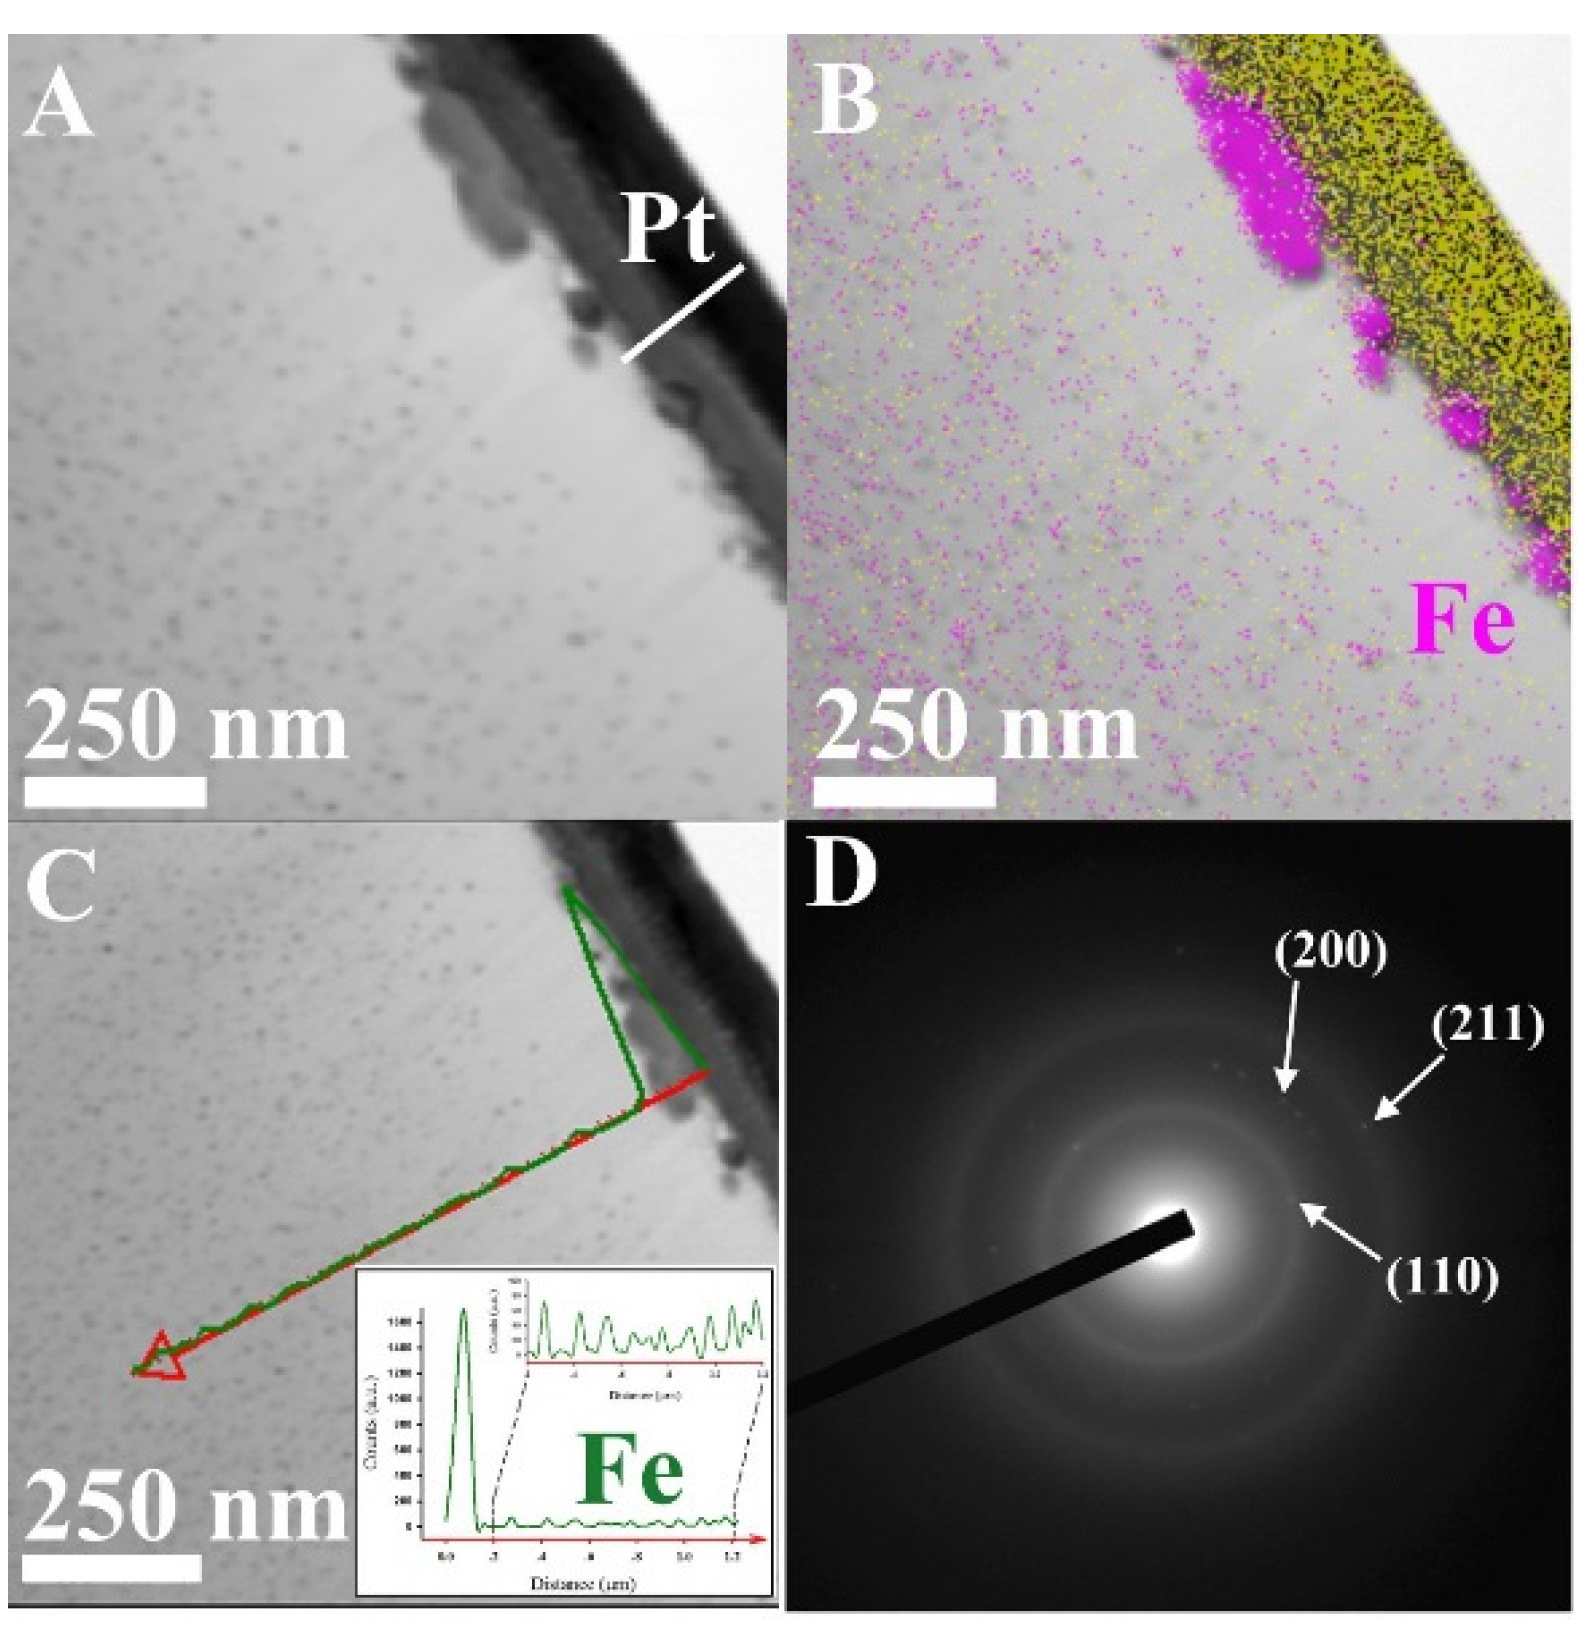
| Fe/ACF | 9.7 | 67.1 Fe 13.8 IIO 19.2 Fe3O4 | 3.25 | 80 | 880 | 0.52 | 1.36 |
3.2. Doping of The Fe/ACF with Tinier Pd Nanoparticles

3.3. Environmental Activity-Proof of Concept
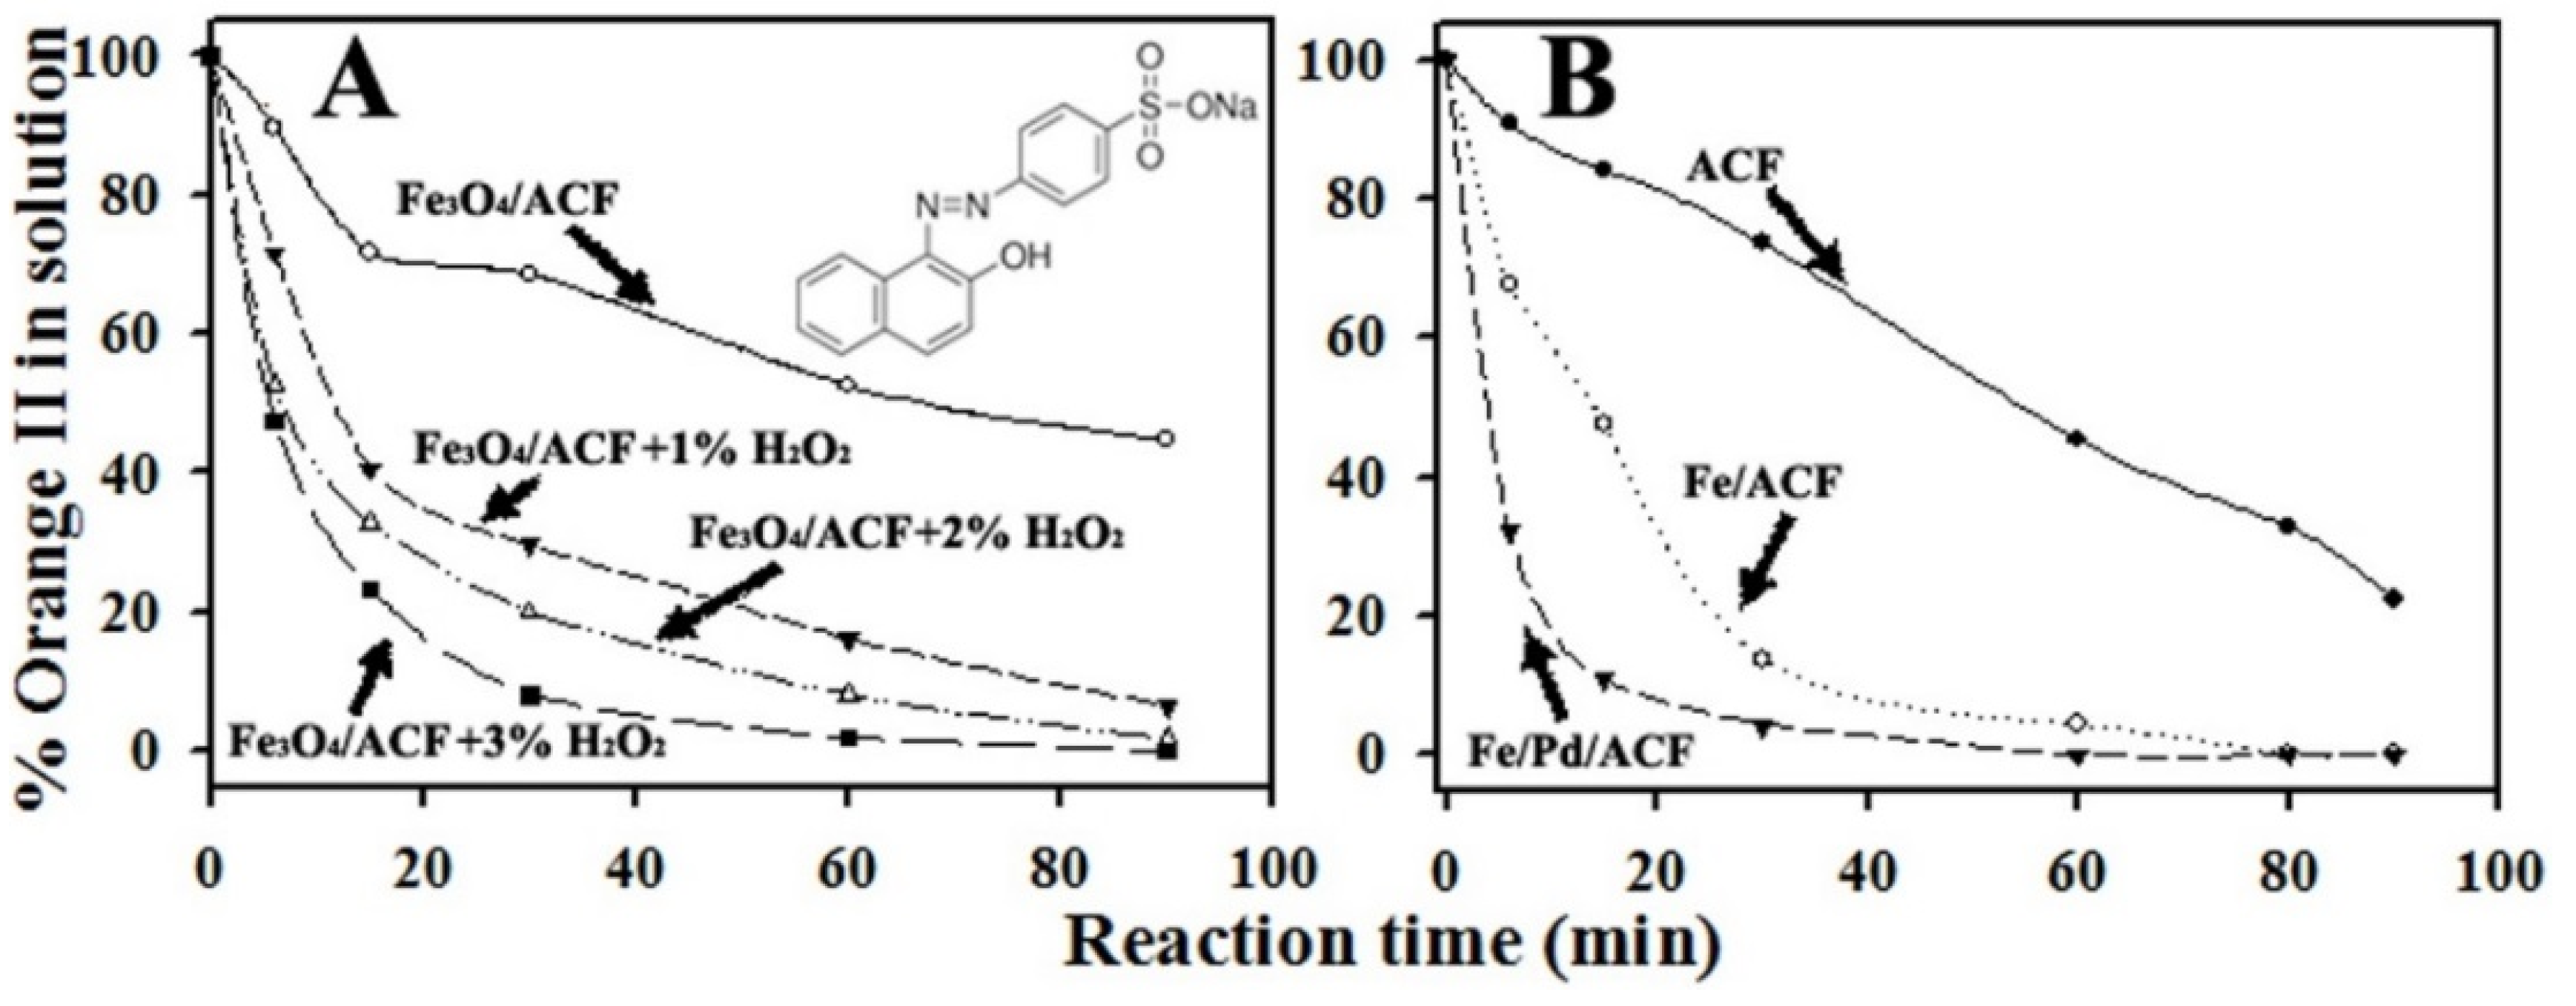
3.3.1. Activity of The Fe3O4/ACF in Absence or Presence of H2O2

3.3.2. Activity of Fe/ACF and Fe/Pd/ACF
4. Conclusions
Acknowledgments
Author Contributions
Conflicts of Interest
References
- Huber, D.L. Synthesis, Properties, and Applications of Iron Nanoparticles. Small 2005, 1, 482–501. [Google Scholar] [CrossRef] [PubMed]
- Rusevova, K.; Kopinke, F.D.; Georgi, A. Nano-sized Magnetic Iron Oxides as Catalysts for Heterogeneous Fenton-like Reactions-influence of Fe(II)/Fe(III) Ratio on Catalytic Performance. J. Hazard. Mater. 2012, 241–242, 433–440. [Google Scholar] [CrossRef] [PubMed]
- Sunkara, B.; Zhan, J.; Kolesnichenko, I.; Wang, Y.; He, J.; Holland, J.E.; McPherson, G.L.; John, V.T. Modifying Metal Nanoparticle Placement on Carbon Supports Using an Aerosol-based Process, with Application to The Environmental Remediation of Chlorinated Hydrocarbons. Langmuir 2011, 27, 7854–7859. [Google Scholar] [CrossRef] [PubMed]
- Shin, S.; Yoon, H.; Jang, J. Polymer-encapsulated Iron Oxide Nanoparticles as Highly Efficient Fenton Catalysts. Catal. Commun. 2008, 10, 178–182. [Google Scholar] [CrossRef]
- Shahwan, T.; Abu Sirriah, S.; Nairat, M.; Boyacı, E.; Eroğlu, A.E.; Scott, T.B.; Hallam, K.R. Green Synthesis of Iron Nanoparticles and Their Application as A Fenton-like Catalyst for The Degradation of Aqueous Cationic and Anionic Dyes. Chem. Eng. J. 2011, 172, 258–266. [Google Scholar] [CrossRef]
- Lien, H.L.; Zhang, W. Nanoscale Iron Particles for Complete Reduction of Chlorinated Ethenes. Colloids Surf. A 2001, 191, 97–105. [Google Scholar] [CrossRef]
- Shih, Y.; Tai, Y. Reaction of Decabrominated Diphenyl Ether by Zerovalent Iron Nanoparticles. Chemosphere 2010, 78, 1200–1206. [Google Scholar] [CrossRef] [PubMed]
- Cheng, R.; Zhou, W.; Wang, J.L.; Qi, D.; Guo, L.; Zhang, W.X.; Qian, Y. Dechlorination of Pentachlorophenol Using Nanoscale Fe/Ni Particles: Role of nano-Ni and Its Size Effect. J. Hazard. Mater. 2010, 180, 79–85. [Google Scholar] [CrossRef] [PubMed]
- Nagpal, V.; Bokare, A.D.; Chikate, R.C.; Rode, C.V.; Paknikar, K.M. Reductive Dechlorination of Gamma-hexachlorocyclohexane Using Fe-Pd Bimetallic Nanoparticles. J. Hazard. Mater. 2010, 175, 680–687. [Google Scholar] [CrossRef] [PubMed]
- Lu, A.H.; Salabas, E.L.; Schüth, F. Magnetic Nanoparticles: Synthesis, Protection, Functionalization, and Application. Angew. Chem. Int. Ed. 2007, 46, 1222–1244. [Google Scholar] [CrossRef] [PubMed]
- Kim, D.K.; Zhang, Y.; Voit, W.; Rao, K.V.; Muhammed, M. Synthesis and Characterization of Surfactant-Coated Superparamagnetic Monodispersed Iron Oxide Nanoparticles. J. Magn. Magn. Mater. 2001, 225, 30–36. [Google Scholar] [CrossRef]
- He, Q.; Yuan, T.; Wei, S.; Haldolaarachchige, N.; Luo, Z.; Young, D.P.; Khasanov, A.; Guo, Z. Morphology- and Phase-controlled Iron Oxide Nanoparticles Stabilized with Maleic Anhydride Grafted Polypropylene. Angew. Chem. Int. Ed. 2012, 51, 8842–8845. [Google Scholar] [CrossRef] [PubMed]
- Amara, D.; Felner, I.; Nowik, I.; Margel, S. Synthesis and Characterization of Fe and Fe3O4 Nanoparticles by Thermal Decomposition of Triiron Dodecacarbonyl. Colloids Surf. A 2009, 339, 106–110. [Google Scholar] [CrossRef]
- Boguslavsky, Y.; Margel, S. Synthesis and Characterization of Poly(divinylbenzene)-coated Magnetic Iron Oxide Nanoparticles as Precursor for The Formation of Air-stable Carbon-coated Iron Crystalline Nanoparticles. J. Colloid Interface Sci. 2008, 317, 101–114. [Google Scholar] [CrossRef] [PubMed]
- Zhang, X.; Alloul, O.; Zhu, J.; He, Q.; Luo, Z.; Colorado, H.A.; Haldolaarachchige, N.; Young, D.P.; Shen, T.D.; Wei, S.; et al. Iron-core Carbon-shell Nanoparticles Reinforced Electrically Conductive Magnetic Epoxy Resin Nanocomposites with Reduced Flammability. RSC Adv. 2013, 3, 9453. [Google Scholar] [CrossRef]
- Jay, F.; Gauthier, V.; Dubois, S. Iron Particles Coated with Alumina: Synthesis by A Mechanofusion Process and Study of the High-temperature Oxidation Resistance. J. Am. Ceram. Soc. 2006, 89, 3522–3528. [Google Scholar] [CrossRef]
- Gupta, V.K.; Agarwal, S.; Saleh, T.A. Chromium Removal by Combining the Magnetic Properties of Iron Oxide with Adsorption Properties of Carbon Nanotubes. Water Res. 2011, 45, 2207–2212. [Google Scholar] [CrossRef] [PubMed]
- Zhang, D.; Wei, S.; Kaila, C.; Su, X.; Wu, J.; Karki, A.B.; Young, D.P.; Guo, Z. Carbon-stabilized Iron Nanoparticles for Environmental Remediation. Nanoscale 2010, 2, 917–919. [Google Scholar] [CrossRef] [PubMed]
- Qiu, B.; Wang, Y.; Sun, D.; Wang, Q.; Zhang, X.; Weeks, B.L.; O’Connor, R.; Huang, X.; Wei, S.; Guo, Z. Cr(Vi) Removal by Magnetic Carbon Nanocomposites Derived from Cellulose at Different Carbonization Temperatures. J. Mater. Chem. A 2015, 3, 9817–9825. [Google Scholar] [CrossRef]
- Zhu, J.; Wei, S.; Gu, H.; Rapole, S.B.; Wang, Q.; Luo, Z.; Haldolaarachchige, N.; Young, D.P.; Guo, Z. One-pot Synthesis of Magnetic Graphene Nanocomposites Decorated with Core@double-shell Nanoparticles for Fast Chromium Removal. Environ. Sci. Technol. 2012, 46, 977–985. [Google Scholar] [CrossRef] [PubMed]
- Zhu, J.; Chen, M.; Qu, H.; Wei, H.; Guo, J.; Luo, Z. Positive and Negative Magnetoresistance Phenomena Observed in Magnetic Electrospun Polyacrylonitrile-based Carbon Nanocomposite. RSC Adv. 2014, 2, 715–722. [Google Scholar] [CrossRef]
- Chen, L.; Wang, H.; Wei, H.; Guo, Z.; Khan, M.A.; Young, D.P.; Zhu, J. Carbon Monolith with Embedded Mesopores and Nanoparticles as A Novel Adsorbent for Water Treatment. RSC Adv. 2015, 5, 42540–42547. [Google Scholar] [CrossRef]
- Wang, Y.; Wei, H.; Lu, Y.; Wei, S.; Wujcik, E.; Guo, Z. Multifunctional Carbon Nanostructures for Advanced Energy Storage Applications. Nanomaterials 2015, 5, 755–777. [Google Scholar] [CrossRef]
- Mezohegyi, G.; van der Zee, F.P.; Font, J.; Fortuny, A.; Fabregat, A. Towards Advanced Aqueous Dye Removal Processes: A Short Review on the Versatile Role of Activated Carbon. J. Environ. Manag. 2012, 102, 148–164. [Google Scholar] [CrossRef] [PubMed]
- Mall, I.D.; Srivastava, V.C.; Agarwal, N.K.; Mishra, I.M. Adsorptive Removal of Malachite Green Dye from Aqueous Solution by Bagasse Fly Ash and Activated Carbon-kinetic Study and Equilibrium Isotherm Analyses. Colloids Surf. A 2005, 264, 17–28. [Google Scholar] [CrossRef]
- Zhu, J.; Pallavkar, S.; Chen, M.; Yerra, N.; Luo, Z.; Colorado, H.A.; Lin, H.; Haldolaarachchige, N.; Khasanov, A.; Ho, T.C.; et al. Magnetic Carbon Nanostructures: Microwave Energy-assisted Pyrolysis vs. Conventional Pyrolysis. Chem. Commun. 2013, 49, 258–260. [Google Scholar] [CrossRef] [PubMed]
- Yagub, M.T.; Sen, T.K.; Afroze, S.; Ang, H.M. Dye and Its Removal from Aqueous Solution by Adsorption: Review. Adv. Colloid Interface Sci. 2014, 209, 172–184. [Google Scholar] [CrossRef] [PubMed]
- Janoš, P. Sorption of Basic Dyes onto Iron Humate. Environ. Sci. Technol. 2003, 37, 5792–5798. [Google Scholar] [CrossRef] [PubMed]
- Liu, F.; Chung, S.; Oh, G.; Seo, T.S. Three-Dimensional Graphene Oxide Nanostructure for Fast and Efficient Water-Soluble Dye Removal. ACS Appl. Mater. Inter. 2011, 4, 922–927. [Google Scholar] [CrossRef] [PubMed]
- Wang, S.; Boyjoo, Y.; Choueib, A.; Zhu, Z.H. Removal of Dyes from Aqueous Solution Using Fly Ash and Red Mud. Water Res. 2005, 39, 129–138. [Google Scholar] [CrossRef] [PubMed]
- Gong, J.L.; Wang, B.; Zeng, G.M.; Yang, C.P.; Niu, C.G.; Niu, Q.Y.; Zhou, W.J.; Liang, Y. Removal of Cationic Dyes from Aqueous Solution Using Magnetic Multi-wall Carbon Nanotube Nanocomposite as Adsorbent. J. Hazard. Mater. 2009, 164, 1517–1522. [Google Scholar] [CrossRef] [PubMed]
- Huang, Q.; Liu, W.; Peng, P.; Huang, W. Reductive Dechlorination of Tetrachlorobisphenol A by Pd/Fe Bimetallic Catalysts. J. Hazard. Mater. 2013, 262, 634–641. [Google Scholar] [CrossRef] [PubMed]
- Brunauer, S.; Emmett, P.; Teller, E. Adsorption of Gases in Multimolecular Layers. J. Am. Chem. Soc. 1936, 407, 309–319. [Google Scholar] [CrossRef]
- Barrett, E.P.; Joyner, L.G.; Halenda, P.P. The Determination of Pore Volume and Area Distributions in Porous Substance: I. Computations from Nitrogen Isotherms. J. Am. Chem. Soc. 1951, 1896, 373–380. [Google Scholar] [CrossRef]
- Song, Q.; Ding, Y.; Wang, Z.L.; Zhang, Z.J. Tuning The Thermal Stability of Molecular Precursors for The Nonhydrolytic Synthesis of Magnetic MnFe2O4 Spinel Nanocrystals. Chem. Mater. 2007, 19, 4633–4638. [Google Scholar] [CrossRef]
- Mero, O.; Sougrati, M.T.; Jumas, J.C.; Margel, S. Engineered Magnetic Core–shell SiO2/Fe Microspheres and “medusa-like” Microspheres of SiO2/iron Oxide/carbon Nanofibers or Nanotubes. Langmuir 2014, 30, 9850–9858. [Google Scholar] [CrossRef] [PubMed]
- Menil, F. Systematic Trends of The 57Fe Mössbauer Isomer Shifts in (FeOn) and (FeFn) Polyhedra. Evidance of A New Correlation Between The Isomer Shift and The Inductive Effect of The Competing bondT-X (Fe ). J. Phys. Chem. Solids 1985, 46, 763–789. [Google Scholar] [CrossRef]
- Tuček, J.; Tuček, P.; Čuda, J.; Filip, J.; Pechoušek, J.; Machala, L.; Zbořil, R. Iron(III) Oxide Polymorphs and Their Manifestations in In-field 57Fe Mössbauer Spectra. In Mossbauer Spectroscopy in Materials Science-2012, Proceedings of The International Conference MSMS-12, Olomouc, Czech Republic, 11–15 June 2012; Tuček, J., Machala, L., Eds.; American Institute of Physics: Melville, NY, USA, 2012; pp. 56–74. [Google Scholar]
- Gu, H.; Ding, D.; Sameer, P.; Guo, J.; Yerra, N.; Huang, Y.; Luo, Z.; Ho, T.C.; Haldolaarachchige, N.; Young, D.P. Microwave Assisted Formation of Magnetic Core-Shell Carbon Nanostructure. ECS Solid State Lett. 2013, 2, M65–M68. [Google Scholar] [CrossRef]
- Tuinstra, F. Raman Spectrum of Graphite. J. Chem. Phys. 1970, 53, 1126–1130. [Google Scholar] [CrossRef]
- Reich, S.; Thomsen, C. Raman Spectroscopy of Graphite. Philos. Trans. A Math. Phys. Eng. Sci. 2004, 362, 2271–2288. [Google Scholar] [CrossRef] [PubMed]
- Lu, Y.; Zhu, Z.; Liu, Z. Carbon-encapsulated Fe Nanoparticles from Detonation-induced Pyrolysis of Ferrocene. Carbon 2005, 43, 369–374. [Google Scholar] [CrossRef]
- Feng, J.; Hu, X.; Yue, P.L. Degradation of Azo-dye Orange II by a Photoassisted Fenton Reaction Using A Novel Composite of Iron Oxide and Silicate Nanoparticles as A Catalyst. Ind. Eng. Chem. Res. 2003, 42, 2058–2066. [Google Scholar] [CrossRef]
- Fan, J.; Guo, Y.; Wang, J.; Fan, M. Rapid Decolorization of Azo Dye Methyl Orange in Aqueous Solution by Nanoscale Zerovalent Iron Particles. J. Hazard. Mater. 2009, 166, 904–910. [Google Scholar] [CrossRef] [PubMed]
- Bokare, A.D.; Chikate, R.C.; Rode, C.V.; Paknikar, K.M. Iron-nickel Bimetallic Nanoparticles for Reductive Degradation of Azo Dye Orange G in Aqueous Solution. Appl. Catal. B 2008, 79, 270–278. [Google Scholar] [CrossRef]
© 2015 by the authors; licensee MDPI, Basel, Switzerland. This article is an open access article distributed under the terms and conditions of the Creative Commons Attribution license (http://creativecommons.org/licenses/by/4.0/).
Share and Cite
Haham, H.; Grinblat, J.; Sougrati, M.-T.; Stievano, L.; Margel, S. Engineering of Iron-Based Magnetic Activated Carbon Fabrics for Environmental Remediation. Materials 2015, 8, 4593-4607. https://doi.org/10.3390/ma8074593
Haham H, Grinblat J, Sougrati M-T, Stievano L, Margel S. Engineering of Iron-Based Magnetic Activated Carbon Fabrics for Environmental Remediation. Materials. 2015; 8(7):4593-4607. https://doi.org/10.3390/ma8074593
Chicago/Turabian StyleHaham, Hai, Judith Grinblat, Moulay-Tahar Sougrati, Lorenzo Stievano, and Shlomo Margel. 2015. "Engineering of Iron-Based Magnetic Activated Carbon Fabrics for Environmental Remediation" Materials 8, no. 7: 4593-4607. https://doi.org/10.3390/ma8074593