
Damage Evolution and Life Prediction of Cross-Ply C/SiC Ceramic-Matrix Composite under Cyclic Fatigue Loading at Room Temperature and 800 °C in Air


Abstract
:1. Introduction

2. Material and Experimental Procedures
3. Experimental Results
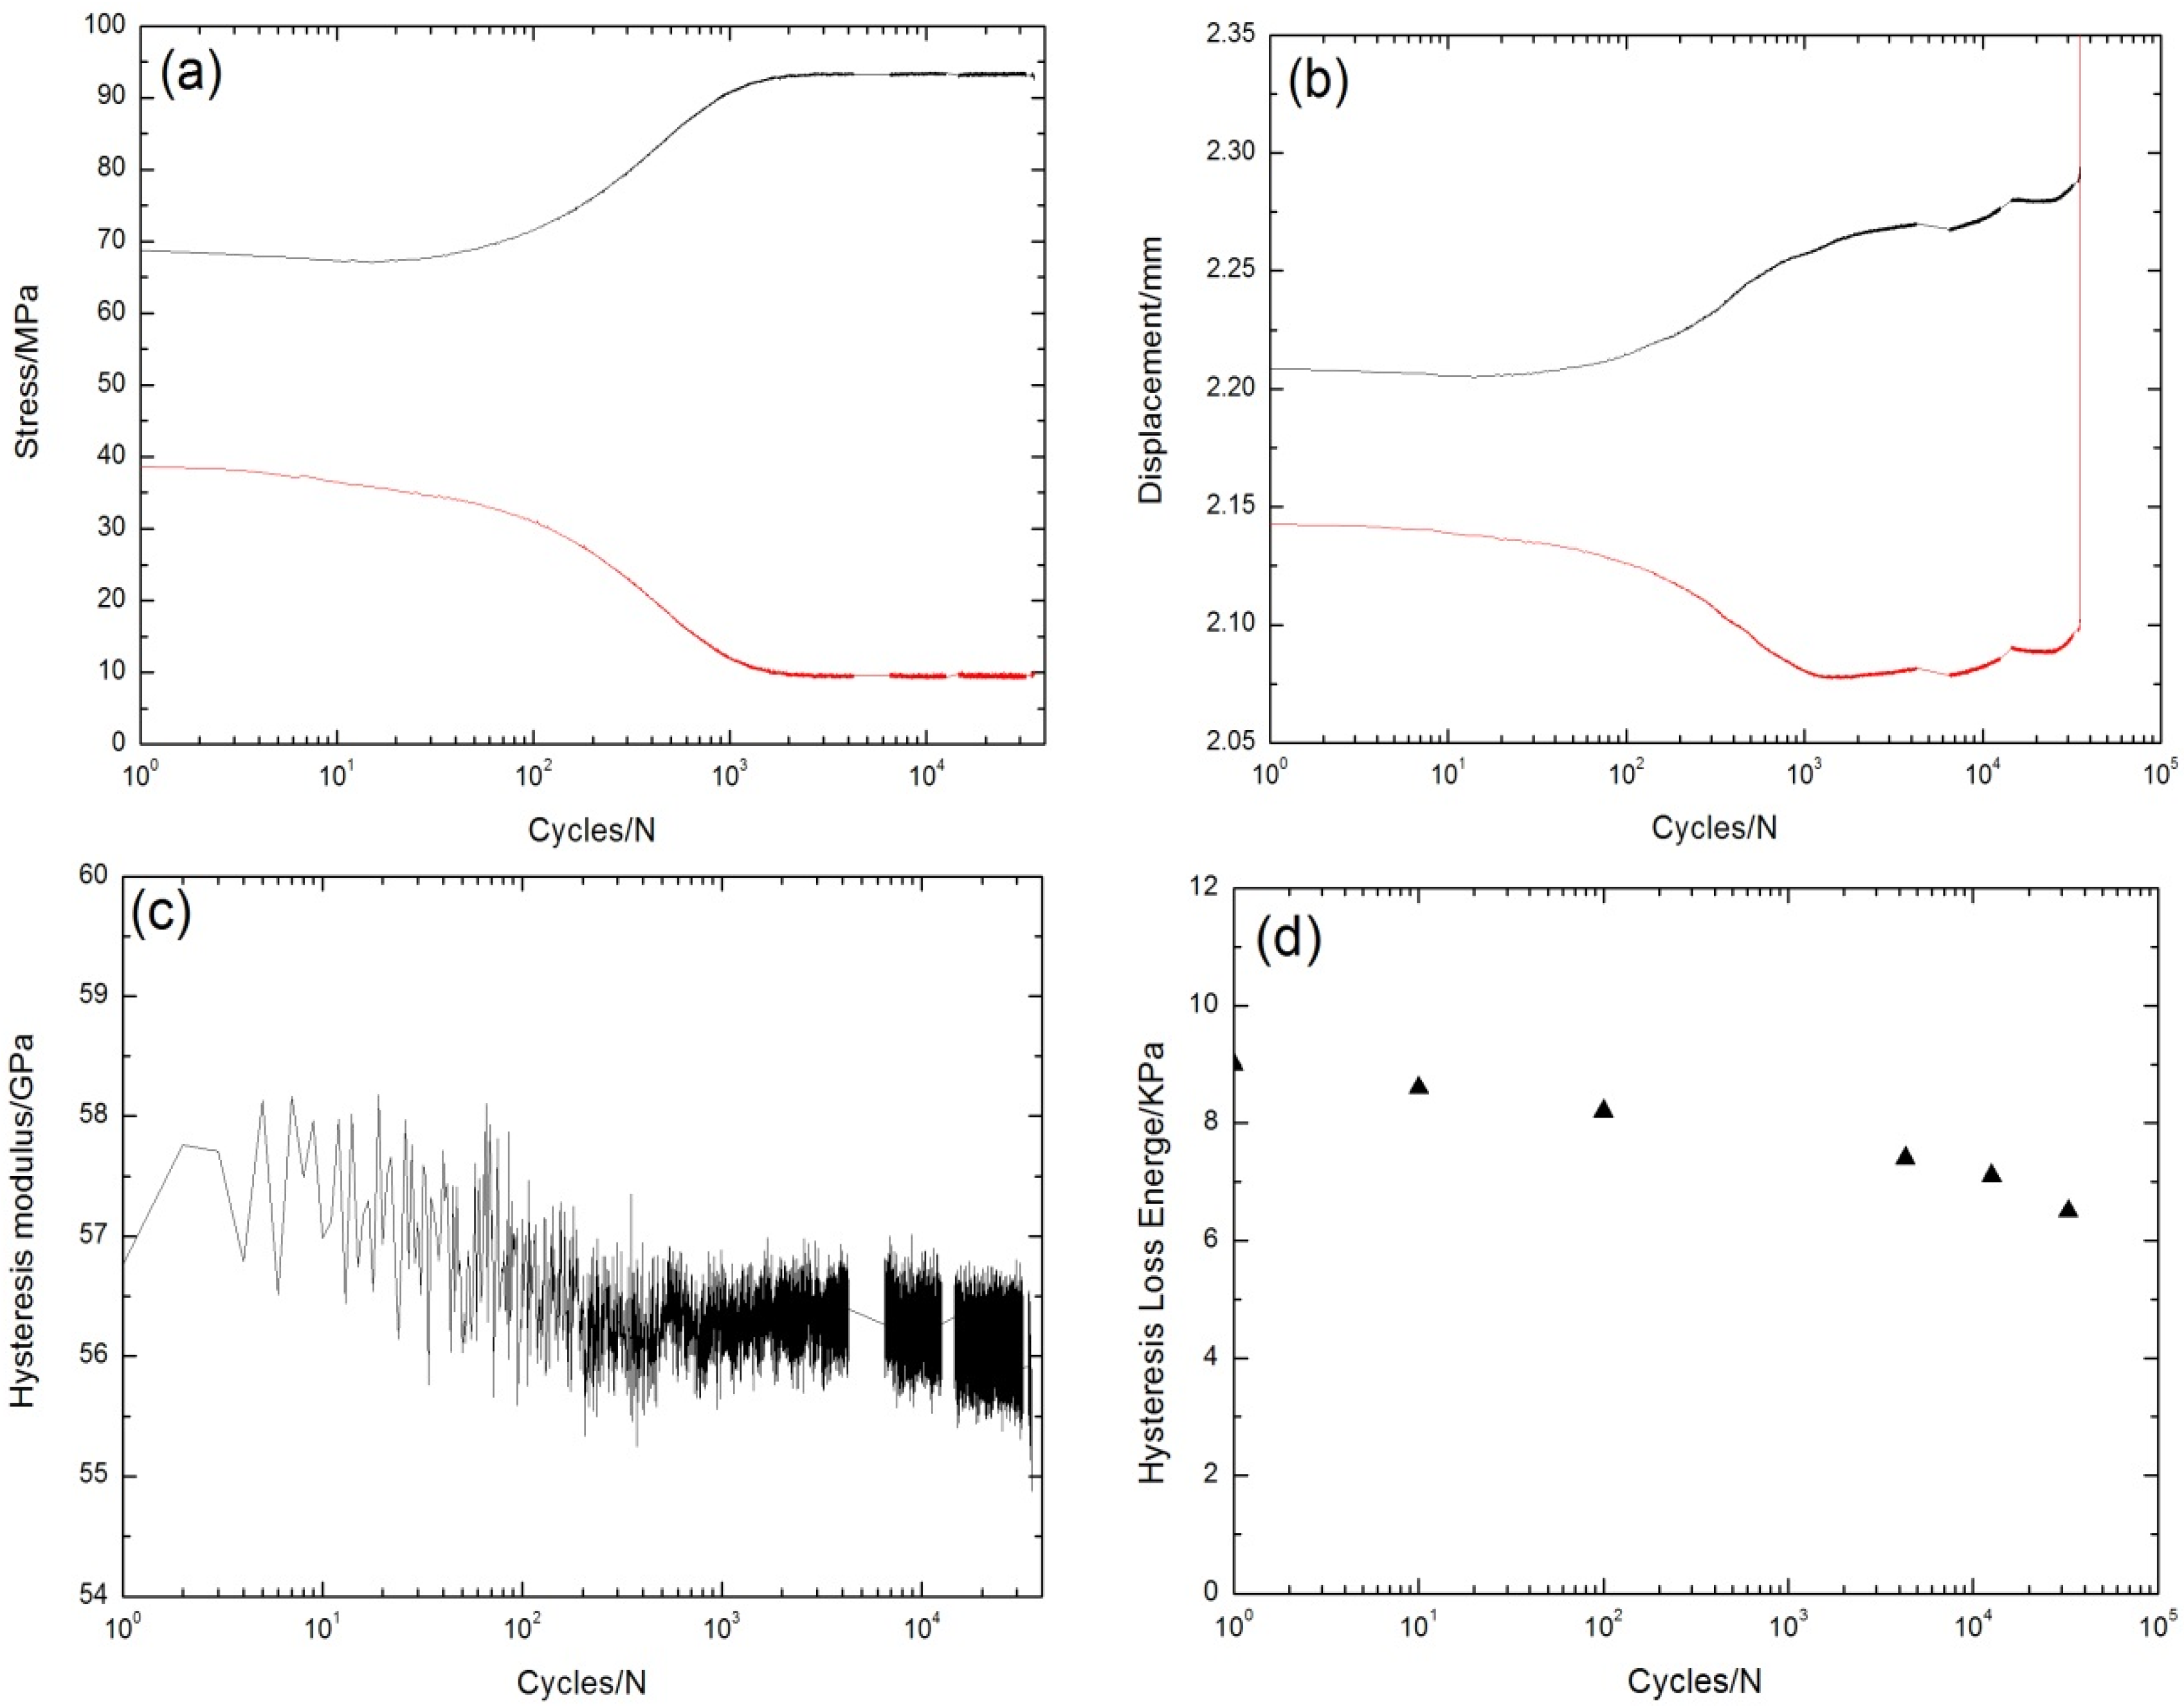
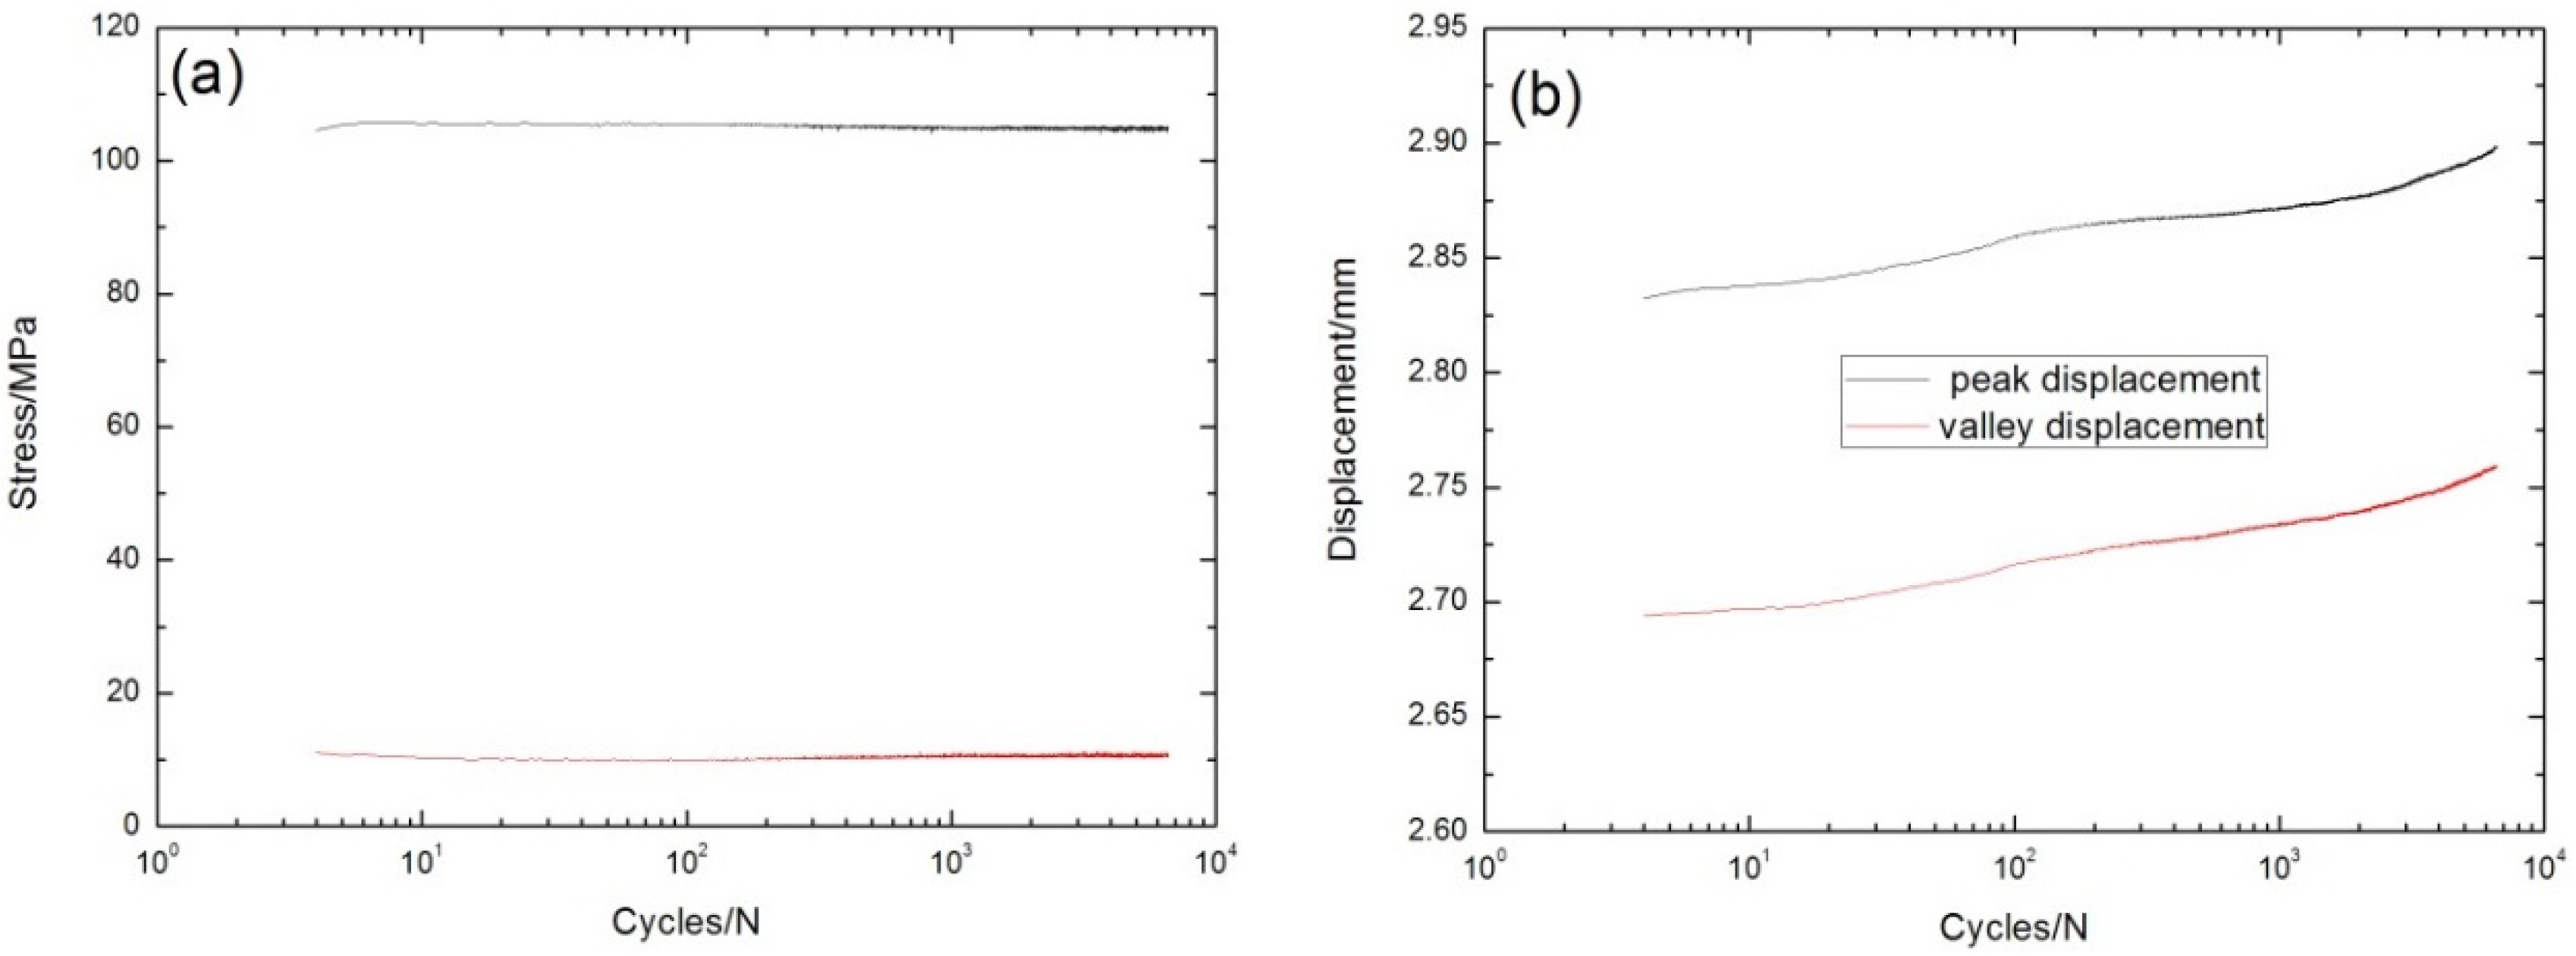
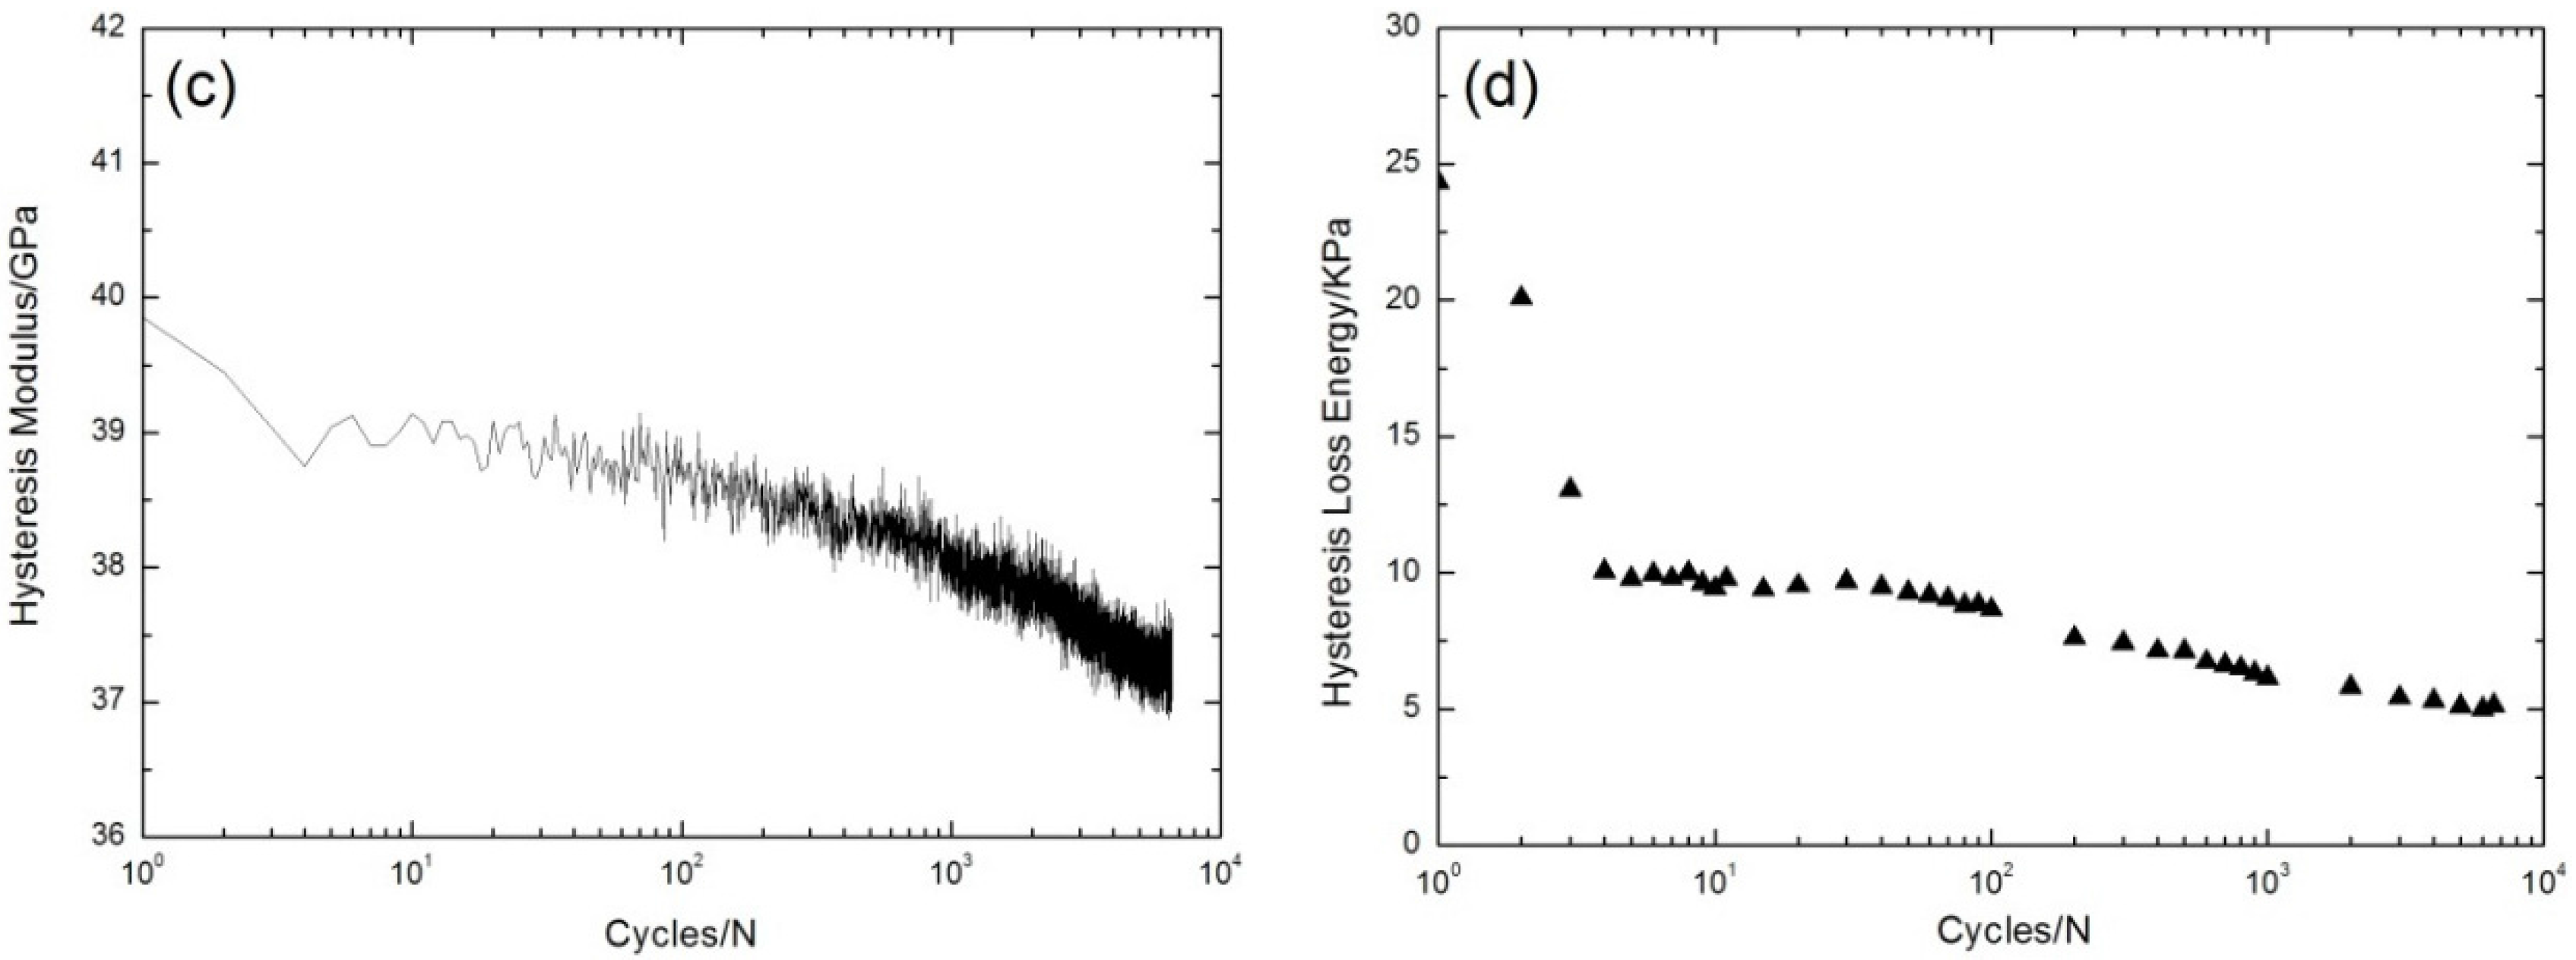
3.1. Room Temperature


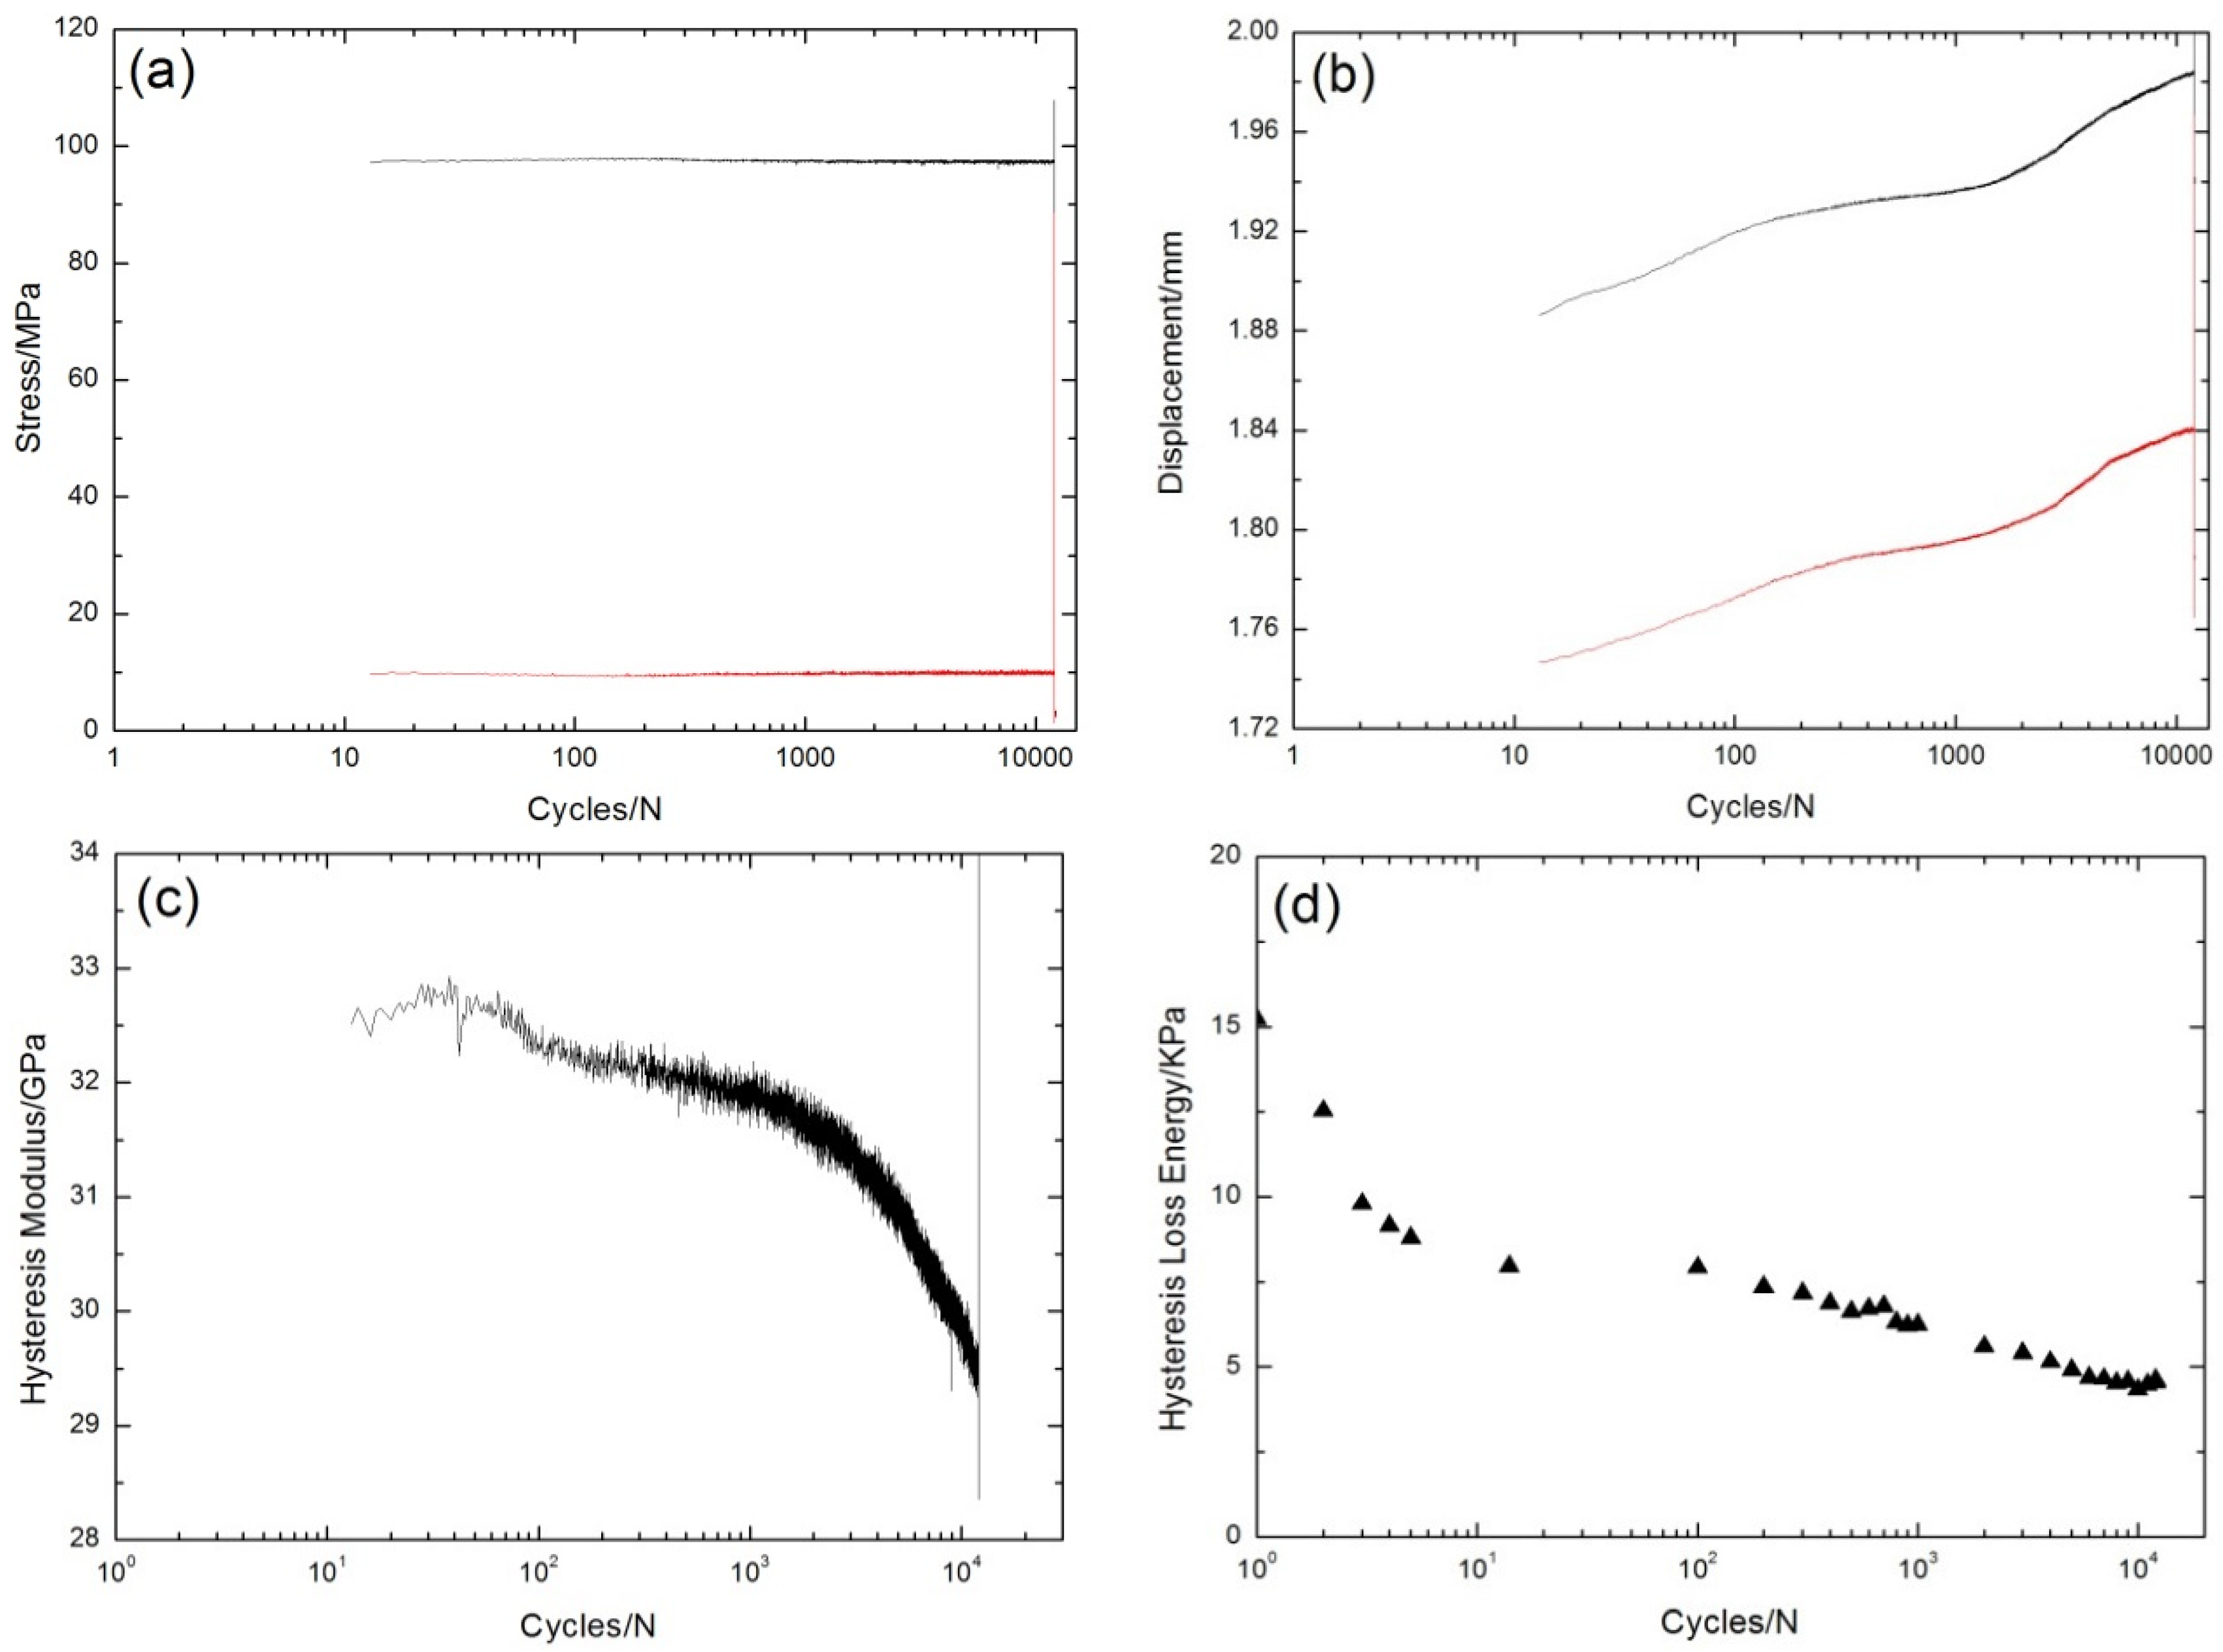
3.2. Elevated Temperature


4. Theoretical Analysis
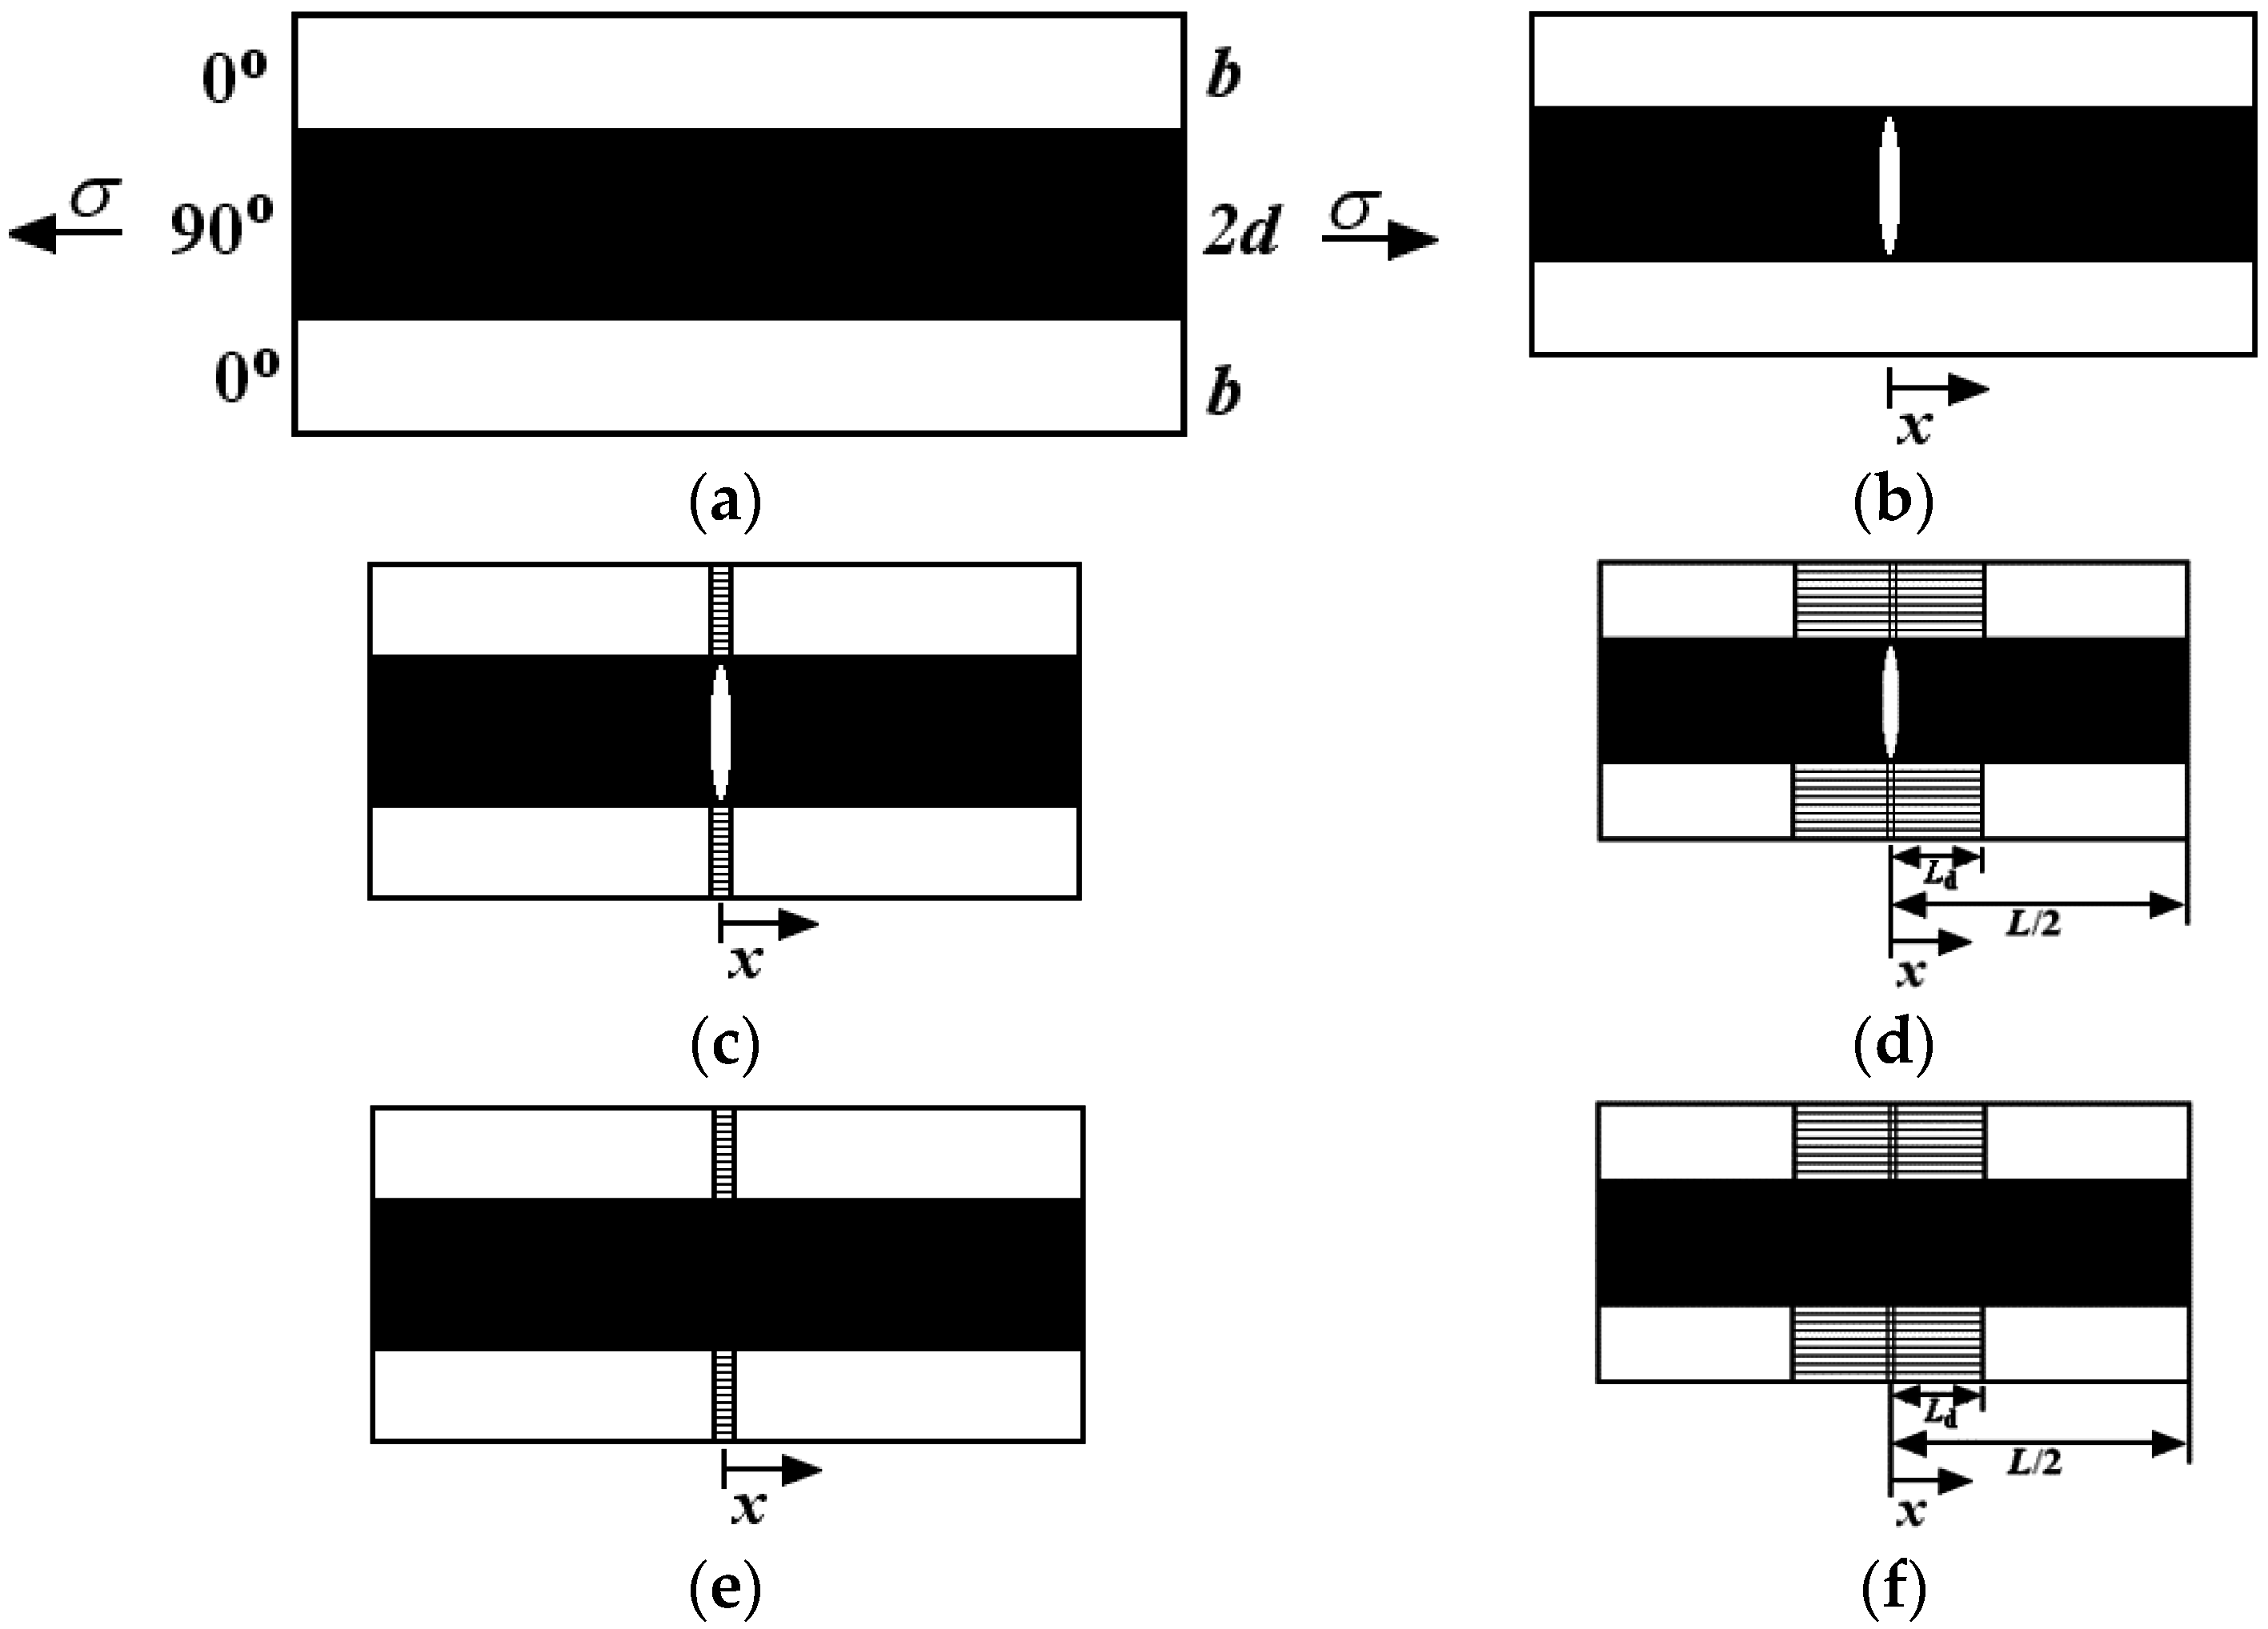
4.1. Hysteresis Loops Model
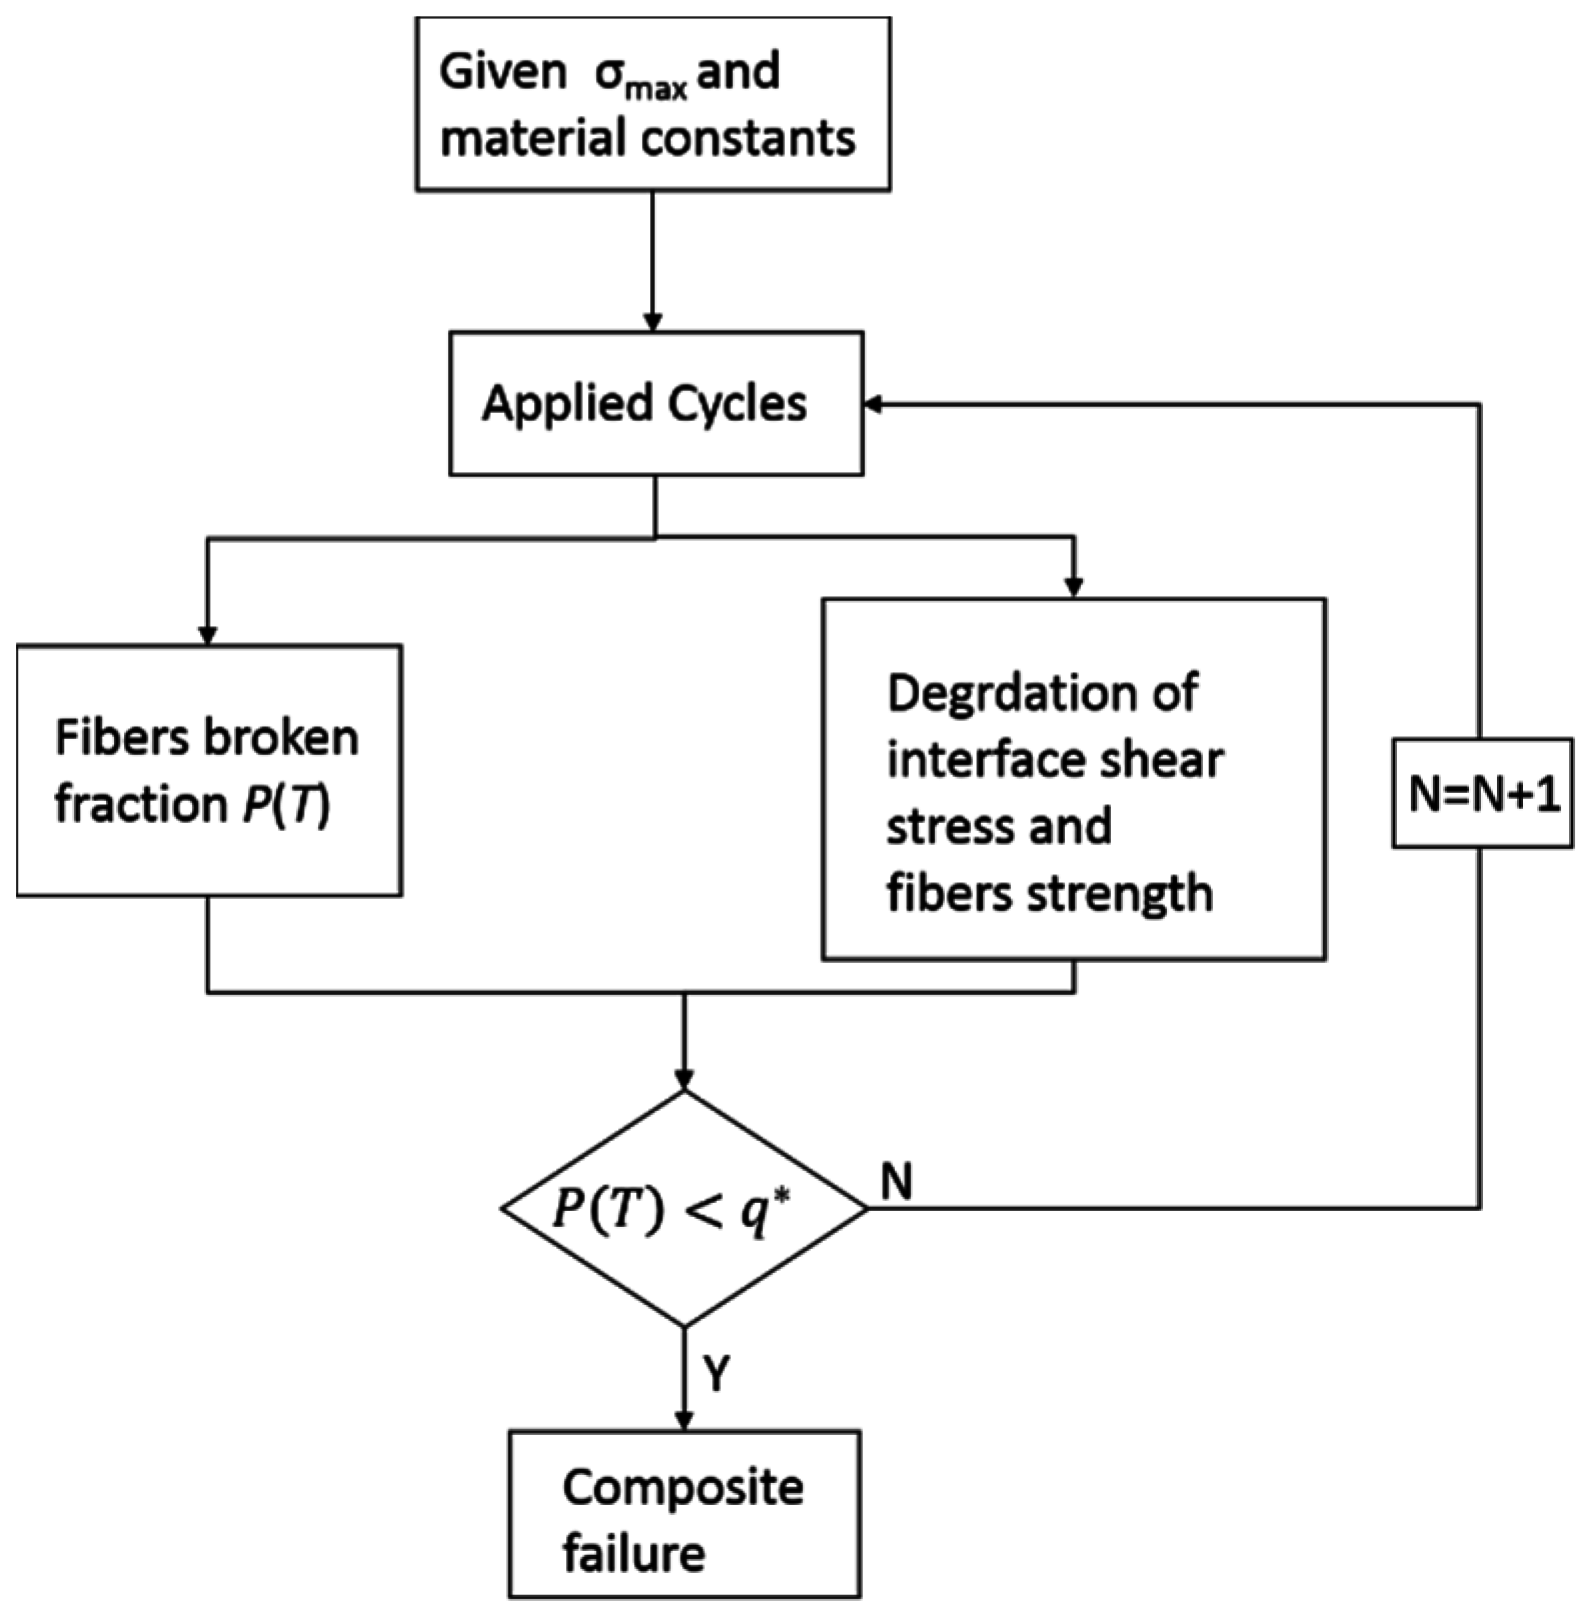
4.2. Life Prediction Model
5. Experimental Comparisons
5.1. Room Temperature


| Loading Cycles | Experimental Fatigue Hysteresis Loss Energy/kPa | Interface Shear Stress/MPa |
|---|---|---|
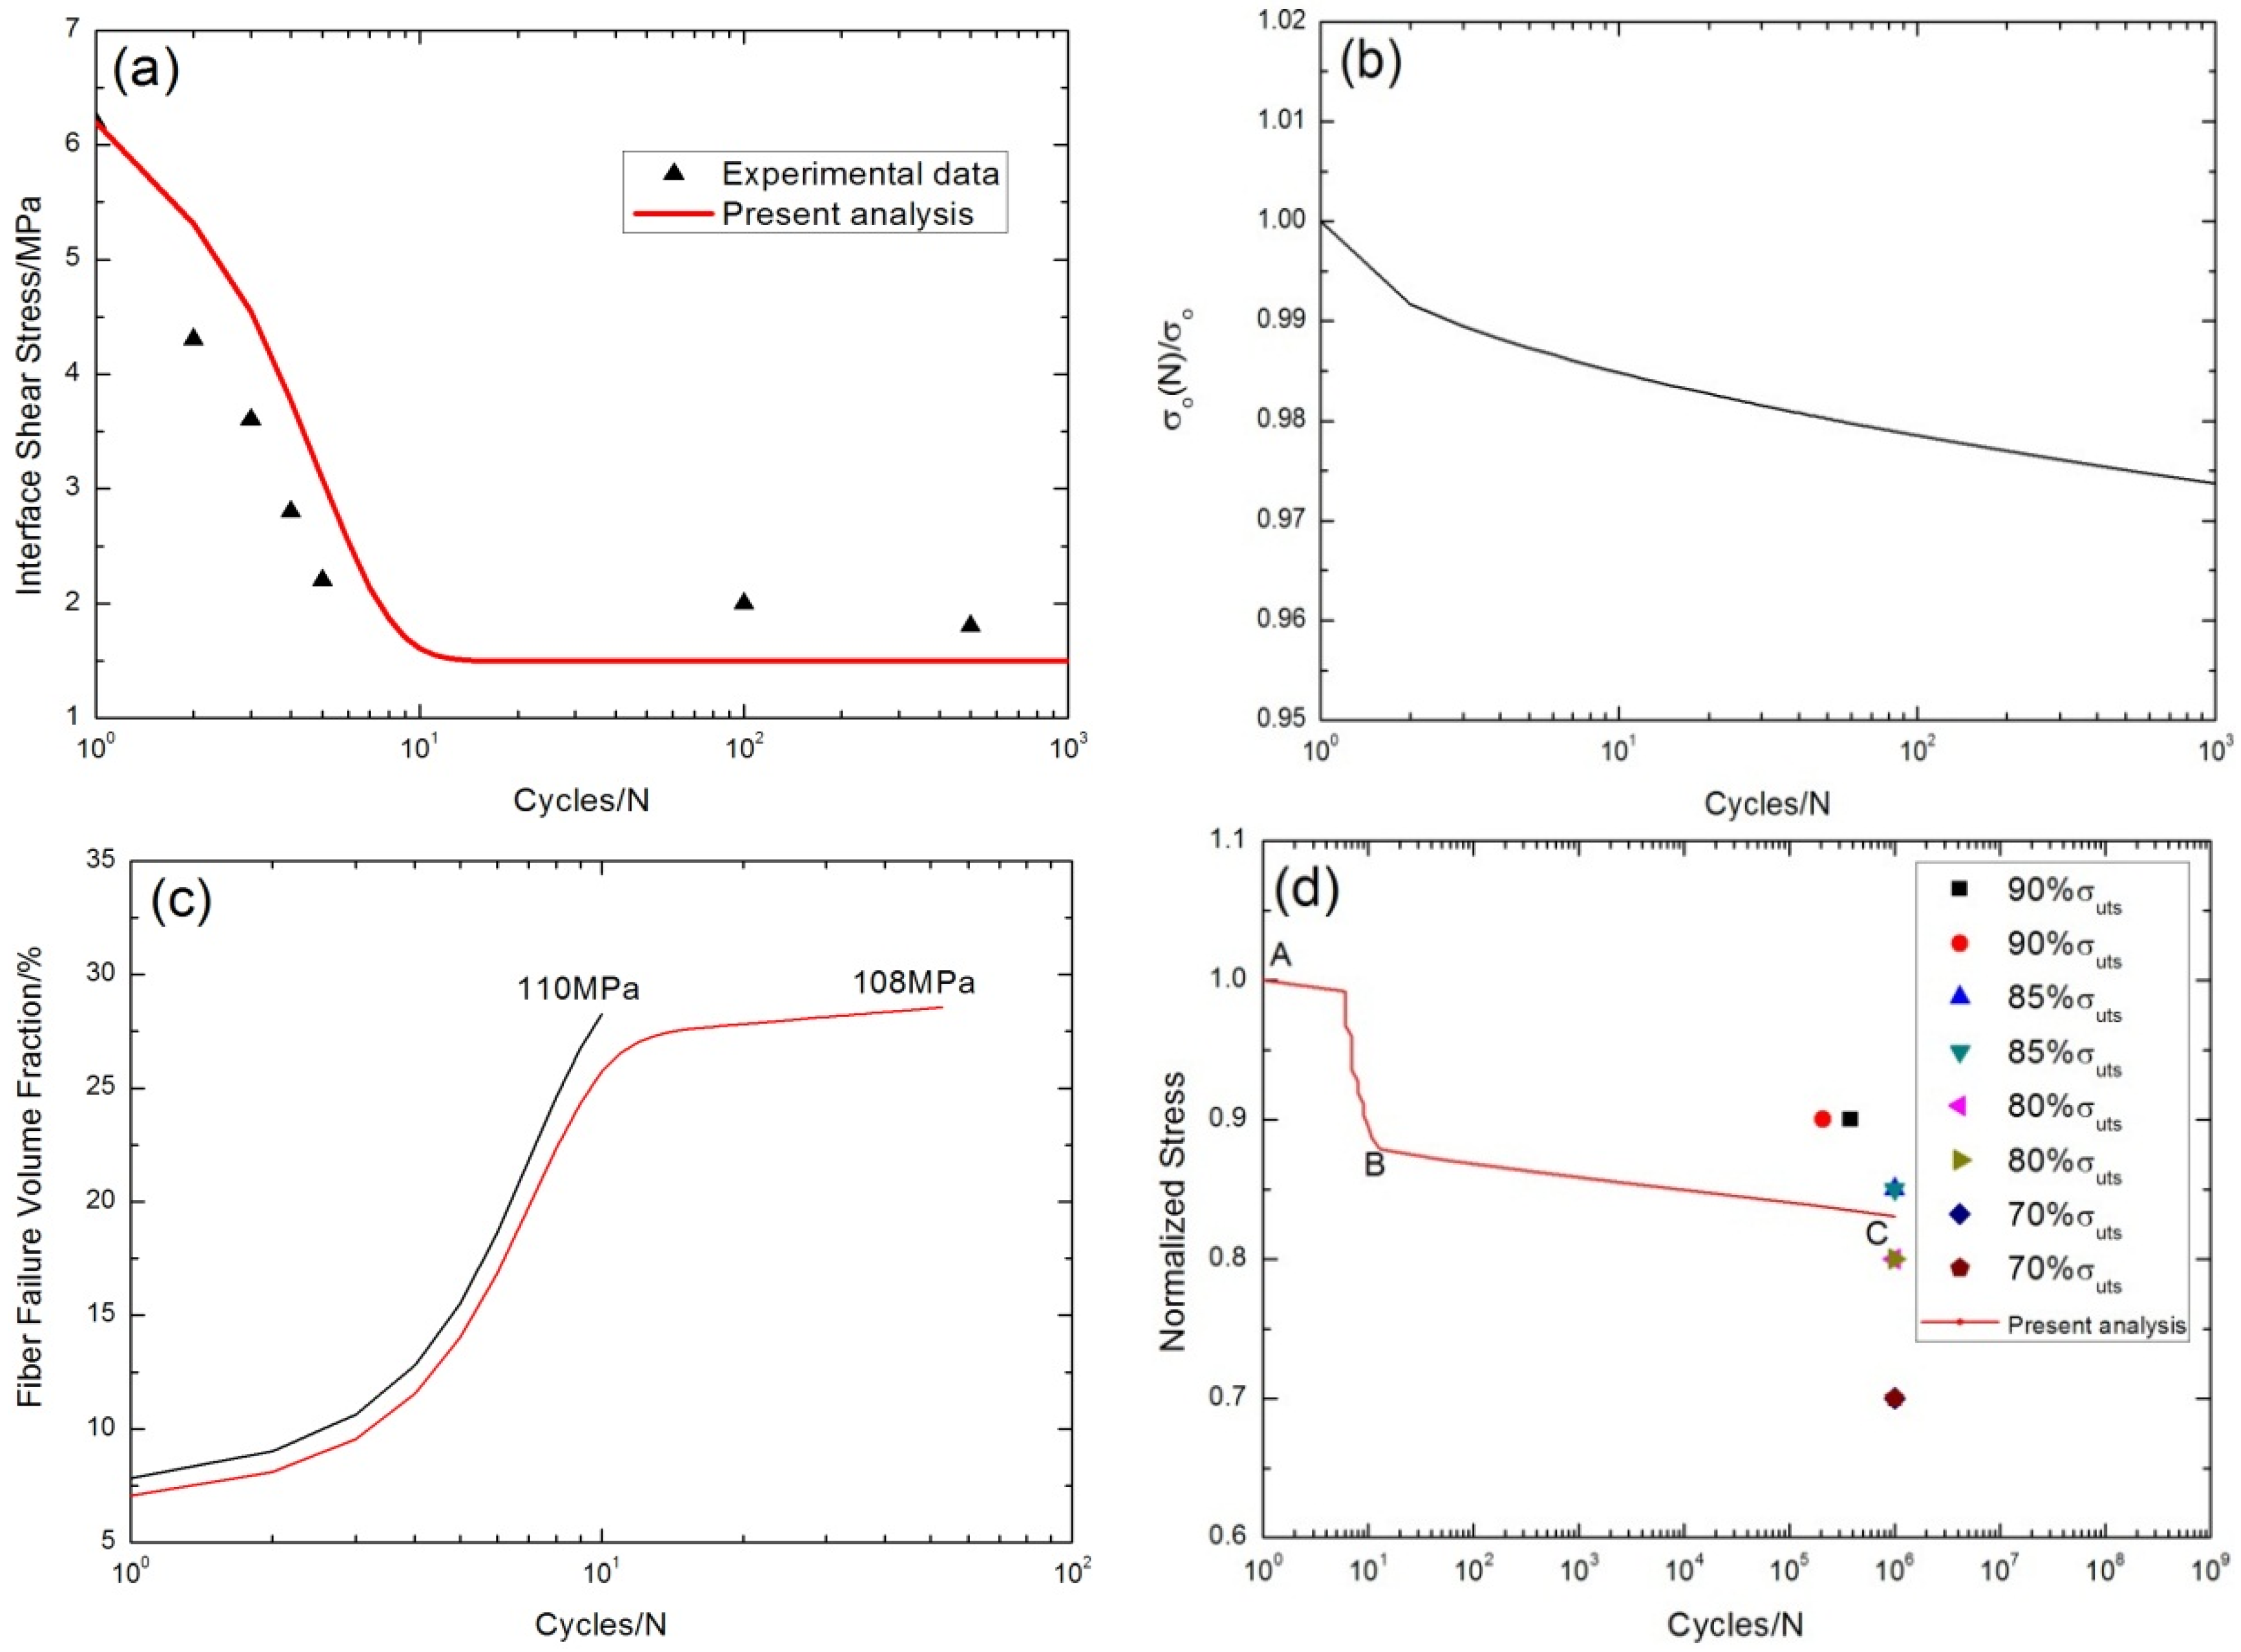
| 1 | 31.2 | 6.2 |
| 2 | 29.3 | 4.3 |
| 3 | 26.8 | 3.6 |
| 4 | 23.3 | 2.8 |
| 5 | 19.4 | 2.2 |
| 100 | 18.1 | 2 |
| 500 | 17 | 1.8 |
| 2015 | 16 | 1.7 |
| 7026 | 15 | 1.5 |
| 25,098 | 14 | 1.4 |
| 139,744 | 10.8 | 1 |
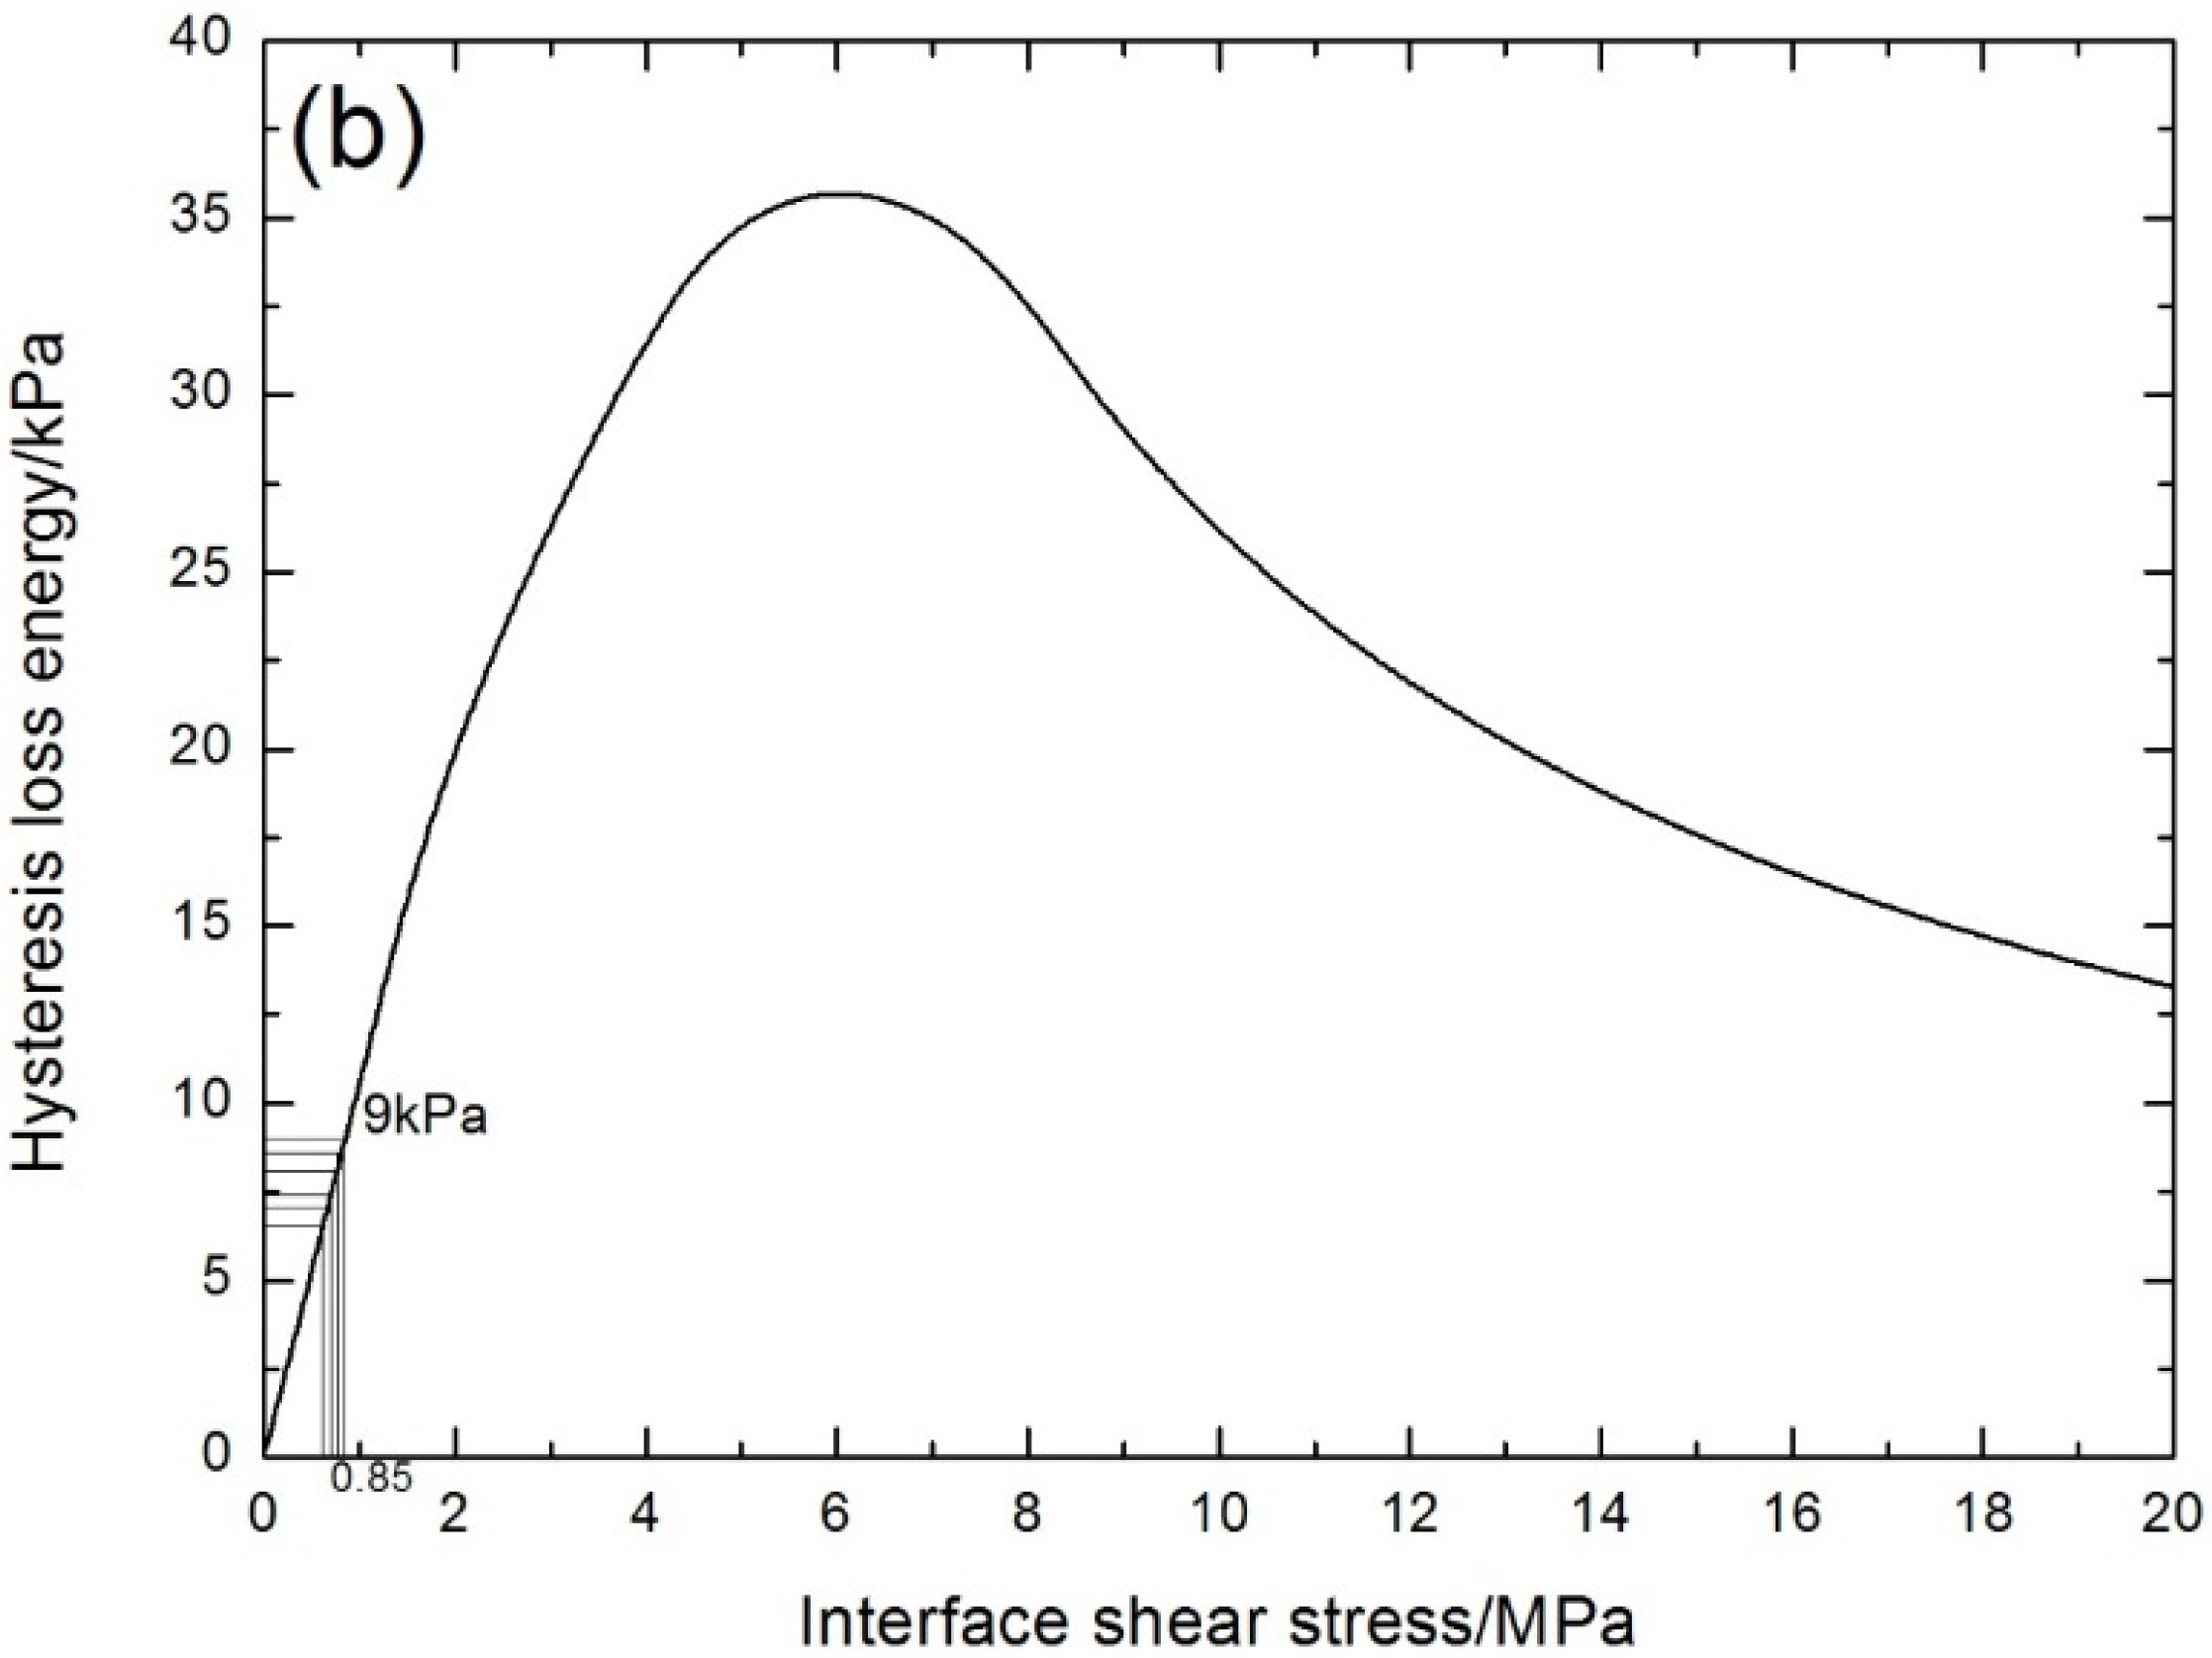
| 996,403 | 8.5 | 0.85 |

| Loading Cycles | Experimental Fatigue Hysteresis Loss Energy/kPa | Interface Shear Stress/MPa |
|---|---|---|
| 1 | 9 | 0.85 |
| 10 | 8.6 | 0.82 |
| 100 | 8.2 | 0.78 |
| 4300 | 7.4 | 0.7 |
| 12,601 | 7.1 | 0.68 |
| 32,079 | 6.5 | 0.62 |
5.2. Elevated Temperature
| Loading Cycles | Experimental Fatigue Hysteresis Loss Energy/kPa | Interface Shear Stress/MPa |
|---|---|---|
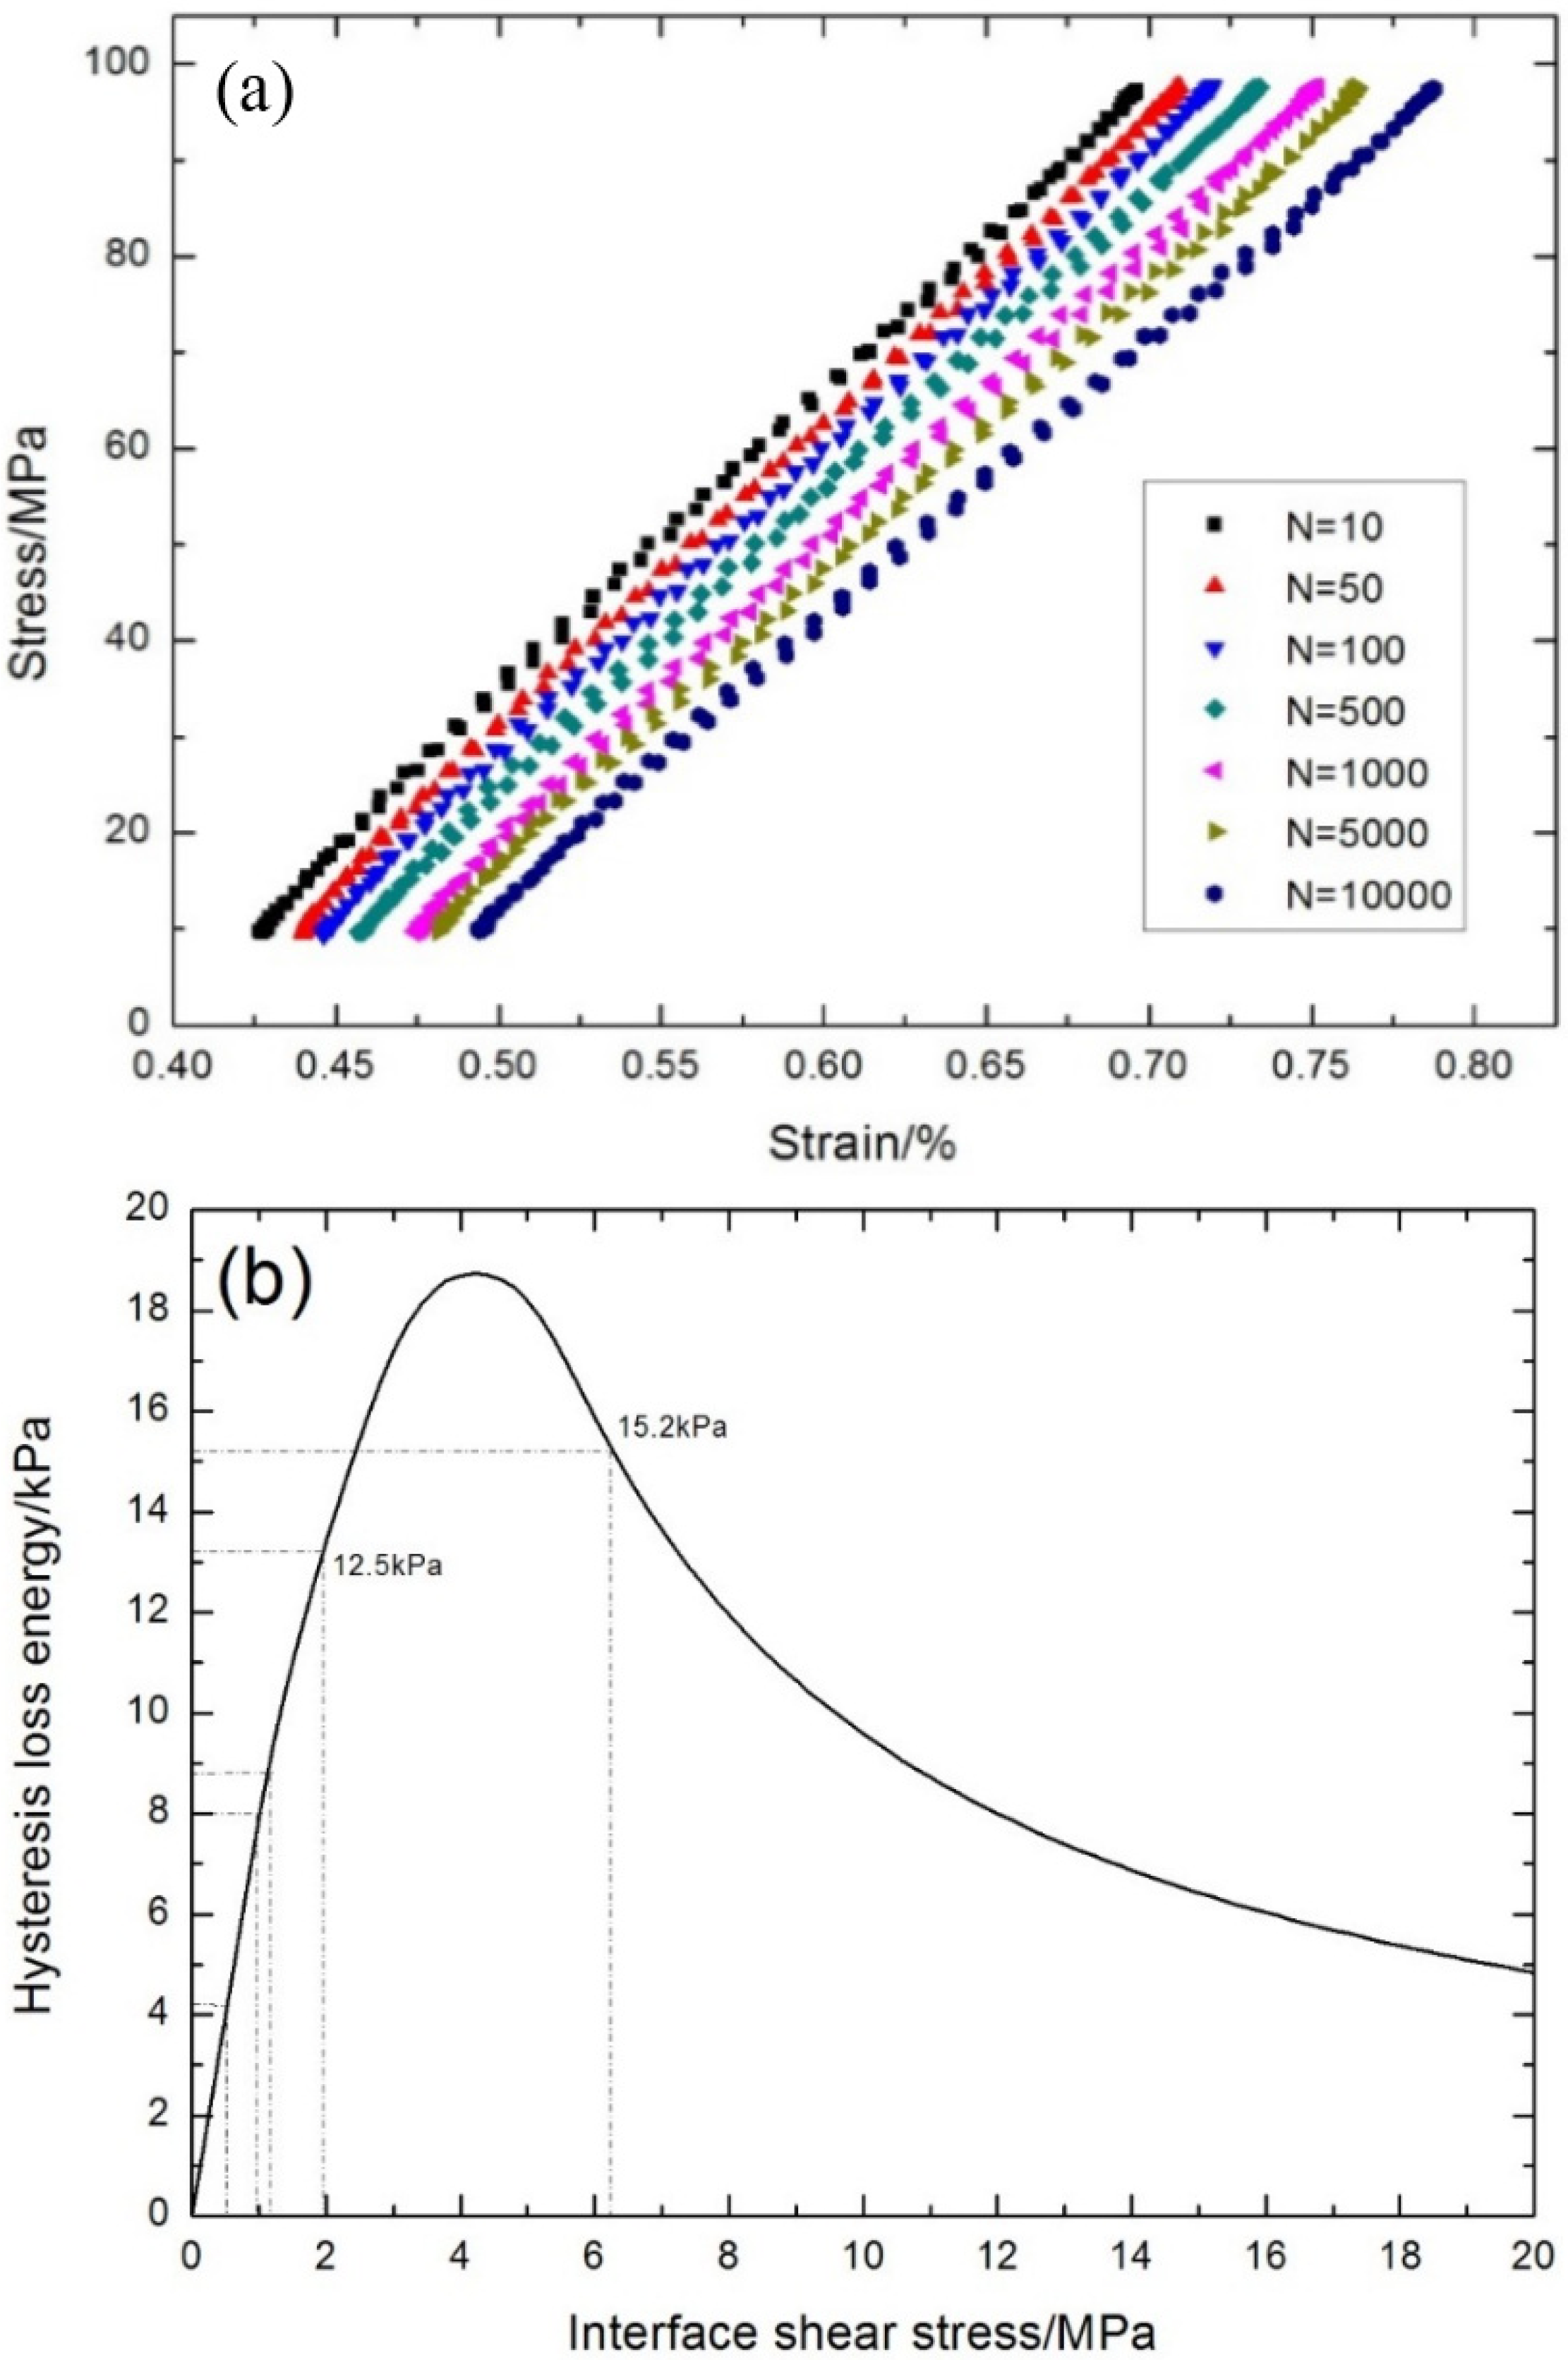
| 1 | 15.2 | 6.2 |
| 2 | 12.5 | 2.0 |
| 5 | 8.8 | 1.1 |
| 15 | 8 | 1 |
| 500 | 6.6 | 0.85 |
| 1000 | 6.2 | 0.78 |
| 3000 | 5.3 | 0.72 |
| 5000 | 4.8 | 0.6 |
| 10,000 | 4.3 | 0.53 |
| 12,000 | 4.2 | 0.5 |

| Loading Cycles | Experimental Fatigue Hysteresis Loss Energy/kPa | Interface Shear Stress/MPa |
|---|---|---|
| 1 | 24.3 | 5.5 |
| 2 | 20 | 2.3 |
| 3 | 13 | 1.3 |
| 10 | 9.7 | 0.9 |
| 100 | 8.6 | 0.8 |
| 500 | 7.1 | 0.6 |
| 1000 | 6.1 | 0.5 |
| 3000 | 5.4 | 0.45 |
| 6600 | 5.1 | 0.4 |

6. Conclusions
Acknowledgments
Conflicts of Interest
Nomenclature
| V | volume fraction |
| α | thermal expansion coefficient |
| E | Young’s modulus |
| ΔT | temperature change from “stress-free” temperature |
| lc | matrix crack spacing |
| σ | stress |
| ε | strain |
| y | interface counter-slip length |
| z | interface new-slip length |
| P | broken fibers fraction |
| m | Weibull modulus |
| rf | fiber radius |
| ld | interface debonded length |
| τi | fiber/matrix interface shear stress |
| τio | initial interface shear stress |
| τimin | steady-state interface shear stress |
| T | load carried by intact fibers at the matrix crack plane |
| <Tb> | load carried by broken fibers |
| εc_unload | unloading composite strain |
| εc_reload | reloading composite strain |
| U | hysteresis loss energy |
| η | composite damage parameter |
| p1, p2 | empirical parameter of fiber strength degradation model |
| ω, λ | empirical parameter of interface shear stress degradation model |
| Superscript and Subscript | |
| f | fiber |
| m | matrix |
| c | composite |
References
- Naslain, R. Design, preparation and properties of non-oxide CMCs for application in engines and nuclear reactors: An overview. Compos. Sci. Technol. 2004, 64, 155–170. [Google Scholar] [CrossRef]
- Schmidt, S.; Beyer, S.; Knabe, H.; Immich, H.; Meistring, R.; Gessler, A. Advanced ceramic matrix composite materials for current and future propulsion system applications. Acta Astronaut. 2004, 55, 409–420. [Google Scholar] [CrossRef]
- DiCarlo, J.A.; Roode, M. Ceramic composite development for gas turbine hot section components. In Proceedings of the GT2006 ASME Turbo Expo 2006: Power for Land, Sea and Air, Barcelona, Spain, 8–11 May 2006.
- Stephen, T. General Electric Primes CMC for Turbine Blades. Flight International 2010. Available online: http://www.flightglobal.com/news/articles/general-electric-primes-cmc-for-turbine-blades-349834/ (accessed on 17 November 2010).
- Zhang, L.T.; Cheng, L.F.; Luan, X.G.; Mei, H.; Xu, Y.D. Environmental performance testing system for thermostructure materials appleid in aeroengines. Key Eng. Mater. 2006, 313, 183–190. [Google Scholar] [CrossRef]
- Evans, A.G.; Zok, F.W.; McMeeking, R.M. Fatigue of ceramic matrix composites. Acta Metall. Mater. 1995, 43, 859–875. [Google Scholar] [CrossRef]
- Zhu, S.; Mizuno, M.; Kagawa, Y.; Mutoh, Y. Monotonic tension, fatigue and creep behavior of SiC-fiber-reinforced SiC-matrix composites: A review. Compos. Sci. Technol. 1999, 59, 833–851. [Google Scholar] [CrossRef]
- Mall, S.; Engesser, J.M. Effects of frequency on fatigue behavior of CVI C/SiC at elevated temperature. Compos. Sci. Technol. 2006, 66, 863–874. [Google Scholar] [CrossRef]
- Ruggles-Wrenn, M.B.; Christensen, D.T.; Chamberlain, A.L.; Lane, J.E.; Cook, T.S. Effect of frequency and environment on fatigue behavior of a CVI SiC/SiC ceramic matrix composite at 1200 °C. Compos. Sci. Technol. 2011, 71, 190–196. [Google Scholar] [CrossRef]
- Rouby, D.; Reynaud, P. Fatigue behavior related to interface modification during load cycling in ceramic-matrix fiber composites. Compos. Sci. Technol. 1993, 48, 109–118. [Google Scholar] [CrossRef]
- Reynaud, P. Cyclic fatigue of ceramic-matrix composites at ambient and elevated temperatures. Compos. Sci. Technol. 1996, 56, 809–814. [Google Scholar] [CrossRef]
- Fantozzi, G.; Reynaud, P. Mechanical hysteresis in ceramic matrix composites. Mater. Sci. Eng. A 2009, 521–522, 18–23. [Google Scholar] [CrossRef]
- Kuo, W.S.; Chou, T.W. Multiple cracking of unidirectional and cross-ply ceramic matrix composites. J. Am. Ceram. Soc. 1995, 78, 745–755. [Google Scholar] [CrossRef]
- Li, L.B.; Song, Y.D.; Sun, Y.C. Effect of matrix cracking on hysteresis behavior of cross-ply ceramic matrix composites. J. Compos. Mater. 2014, 48, 1505–1530. [Google Scholar] [CrossRef]
- Li, L.B. Modeling hysteresis behavior of cross-ply C/SiC ceramic matrix composites. Compos. B 2013, 53, 36–45. [Google Scholar]
- Saleem, M.; Zitoune, R.; Sawi, I.E.; Bougherara, H. Role of the surface quality on the mechanical behavior of CFRP bolted composite joints. Int. J. Fatigue 2015, 80, 246–256. [Google Scholar] [CrossRef]
- Saleem, M.; Toubai, L.; Zitoune, R.; Bougherara, H. Investigating the effect of machining processes on the mechanical behavior of composite plates with circular holes. Compos. A 2013, 55, 169–177. [Google Scholar] [CrossRef]
- Zheng, G.W. The application of PID parameters dynamic tuning method for servo fatigue testmachine. Non-Ferr. Min. Metall. 2009, 25, 39–42. [Google Scholar]
- Yasmin, A.; Bowen, P. Fatigue behavior of cross-ply Nicalon/CAS II glass-ceramic matrix composite at room and elevated temperatures. Compos. A 2004, 35, 83–94. [Google Scholar] [CrossRef]
- Zhu, S.J.; Kaneko, Y.; Ochi, Y.; Ogasawara, T.; Ishikawa, T. Low cycle fatigue behavior in an orthogonal three-dimensional woven Tyranno fiber reinforced Si–Ti–C–O matrix composite. Int. J. Fatigue 2004, 26, 1069–1074. [Google Scholar] [CrossRef]
- Curtin, W.A. Stress-Strain Behavior of Brittle Matrix Composites. In Comprehensive Composite Materials; Elsevier Science Ltd.: Amsterdam, The Netherlands, 2000; Volume 4, pp. 47–76. [Google Scholar]
- Phoenix, S.L.; Raj, R. Scalings in fracture probabilities for a brittle matrix fiber composite. Acta Metall. Mater. 1992, 40, 2813–2828. [Google Scholar] [CrossRef]
- Lee, S.S.; Stinchcomb, W.W. Damage mechanisms of cross-ply Nicalon/CAS-II laminate under cyclic tension. Ceram. Eng. Sci. Proc. 1994, 15, 40–48. [Google Scholar]
© 2015 by the author; licensee MDPI, Basel, Switzerland. This article is an open access article distributed under the terms and conditions of the Creative Commons by Attribution (CC-BY) license (http://creativecommons.org/licenses/by/4.0/).
Share and Cite
Li, L. Damage Evolution and Life Prediction of Cross-Ply C/SiC Ceramic-Matrix Composite under Cyclic Fatigue Loading at Room Temperature and 800 °C in Air. Materials 2015, 8, 8539-8560. https://doi.org/10.3390/ma8125474
Li L. Damage Evolution and Life Prediction of Cross-Ply C/SiC Ceramic-Matrix Composite under Cyclic Fatigue Loading at Room Temperature and 800 °C in Air. Materials. 2015; 8(12):8539-8560. https://doi.org/10.3390/ma8125474
Chicago/Turabian StyleLi, Longbiao. 2015. "Damage Evolution and Life Prediction of Cross-Ply C/SiC Ceramic-Matrix Composite under Cyclic Fatigue Loading at Room Temperature and 800 °C in Air" Materials 8, no. 12: 8539-8560. https://doi.org/10.3390/ma8125474