2.1. Characterization of Ca-α-SiAlON Powders
The XRD patterns of different samples are shown in
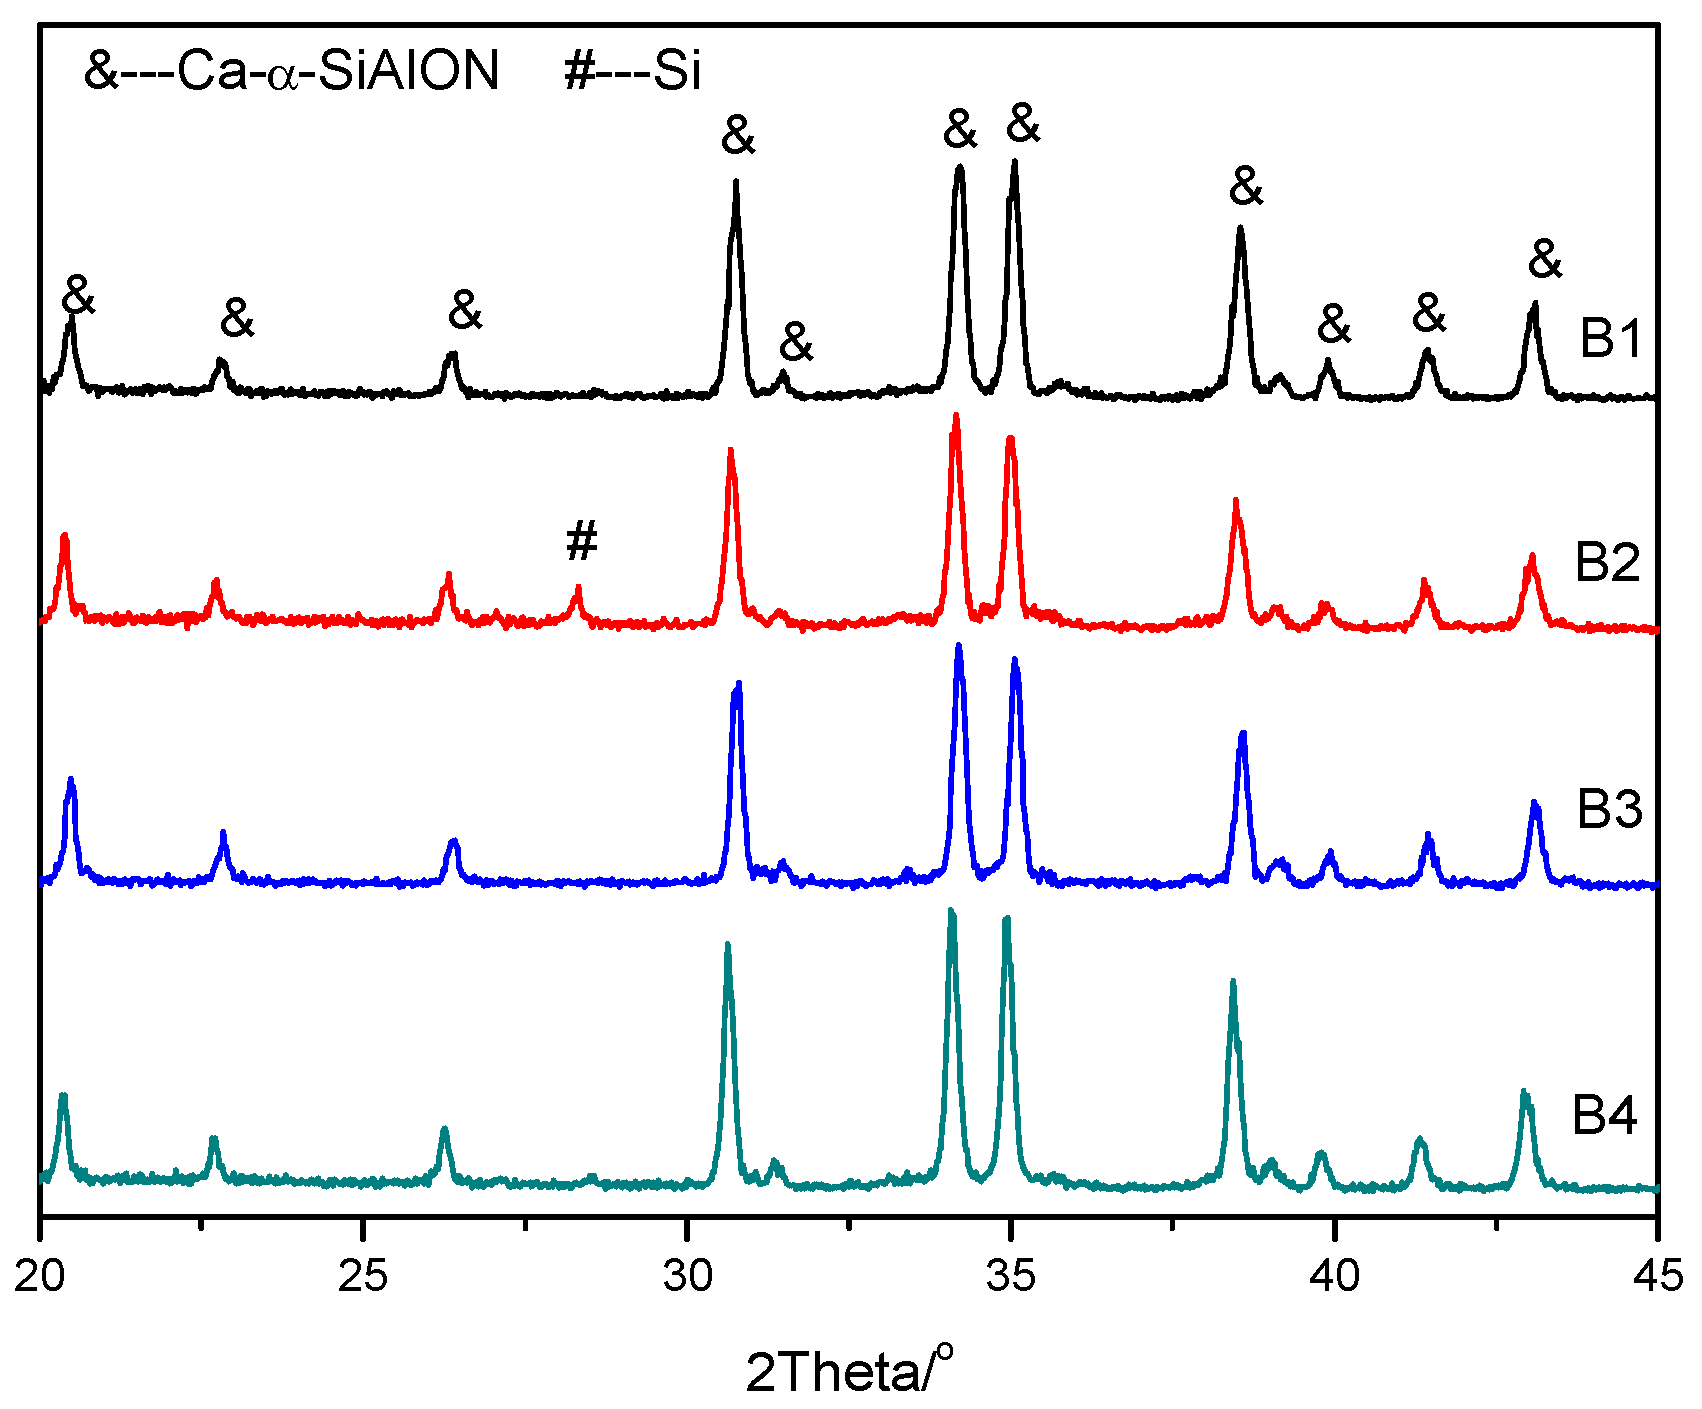
Figure 1, and it can be seen that pure phase Ca-α-SiAlON was produced, except for sample B2, which contained a small amount of residual Si, estimated to be around 2%. This is consistent with previous results showing that the addition of a small amount of Ca
2+ results in higher stability in α-Sialon [
12].
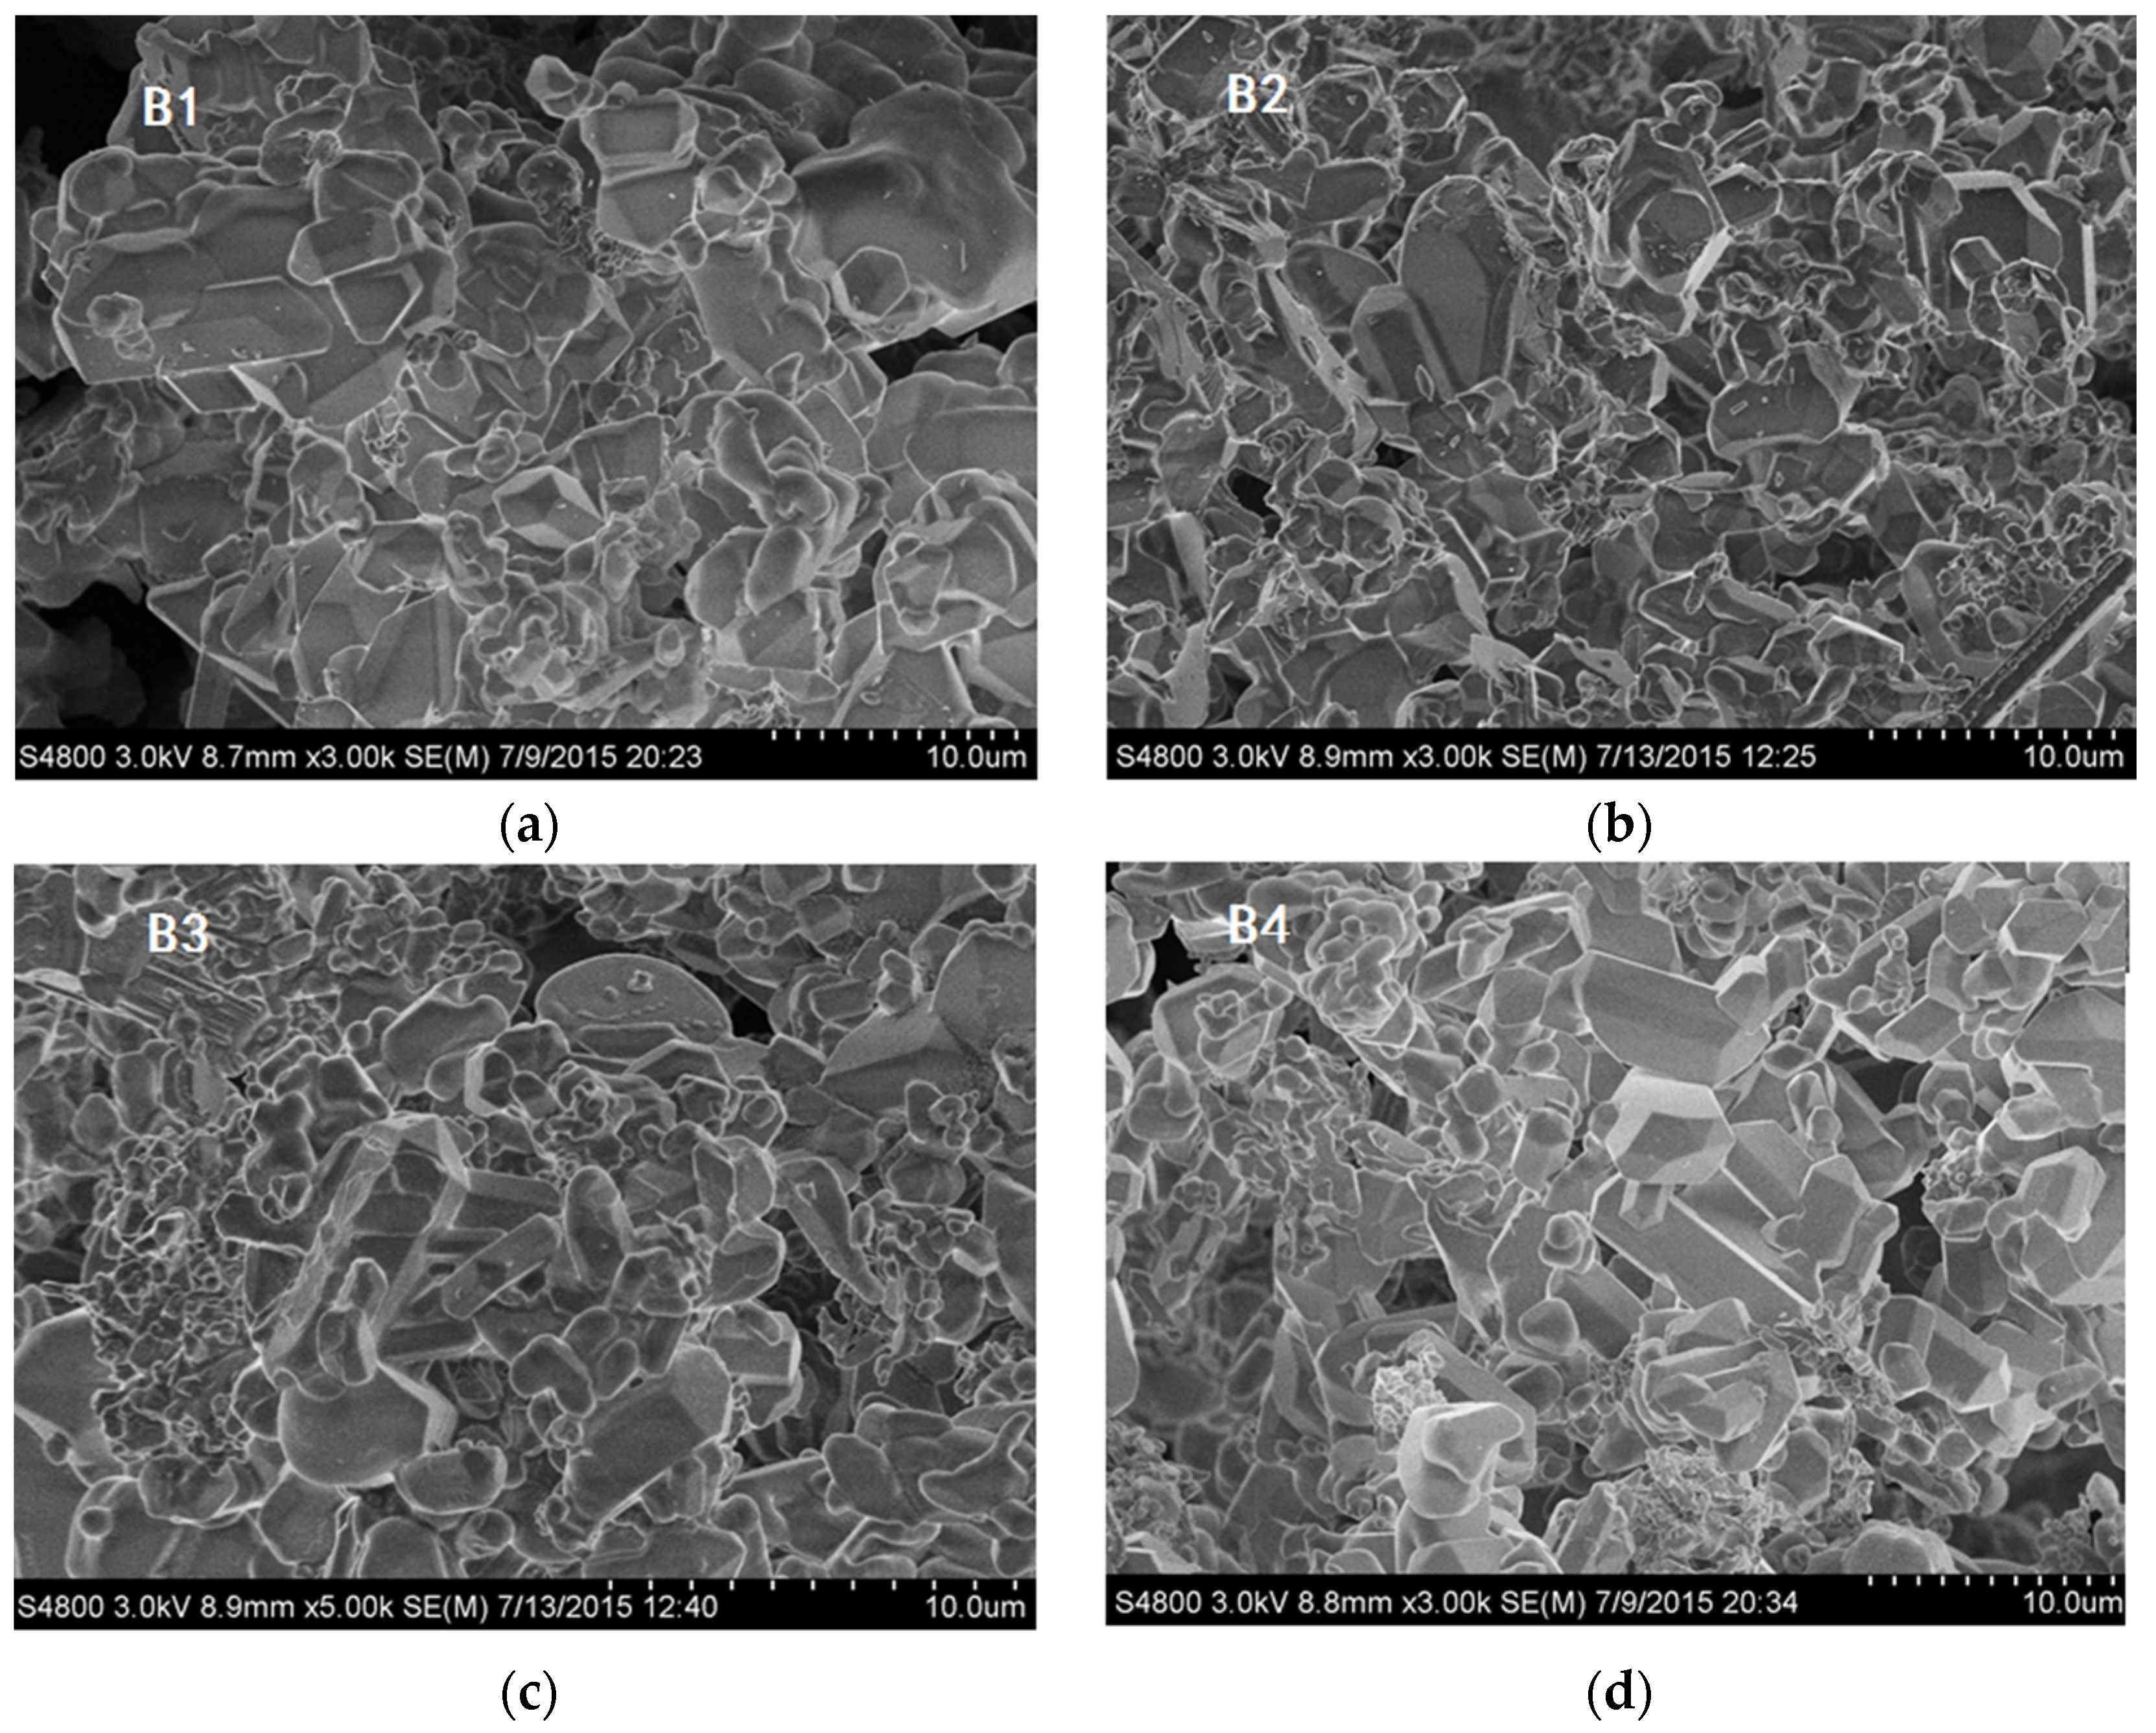
Figure 2 shows SEM images of as-synthesized Ca-α-SiAlON powders, consisting of isotropic grains. It can be seen that grain size and morphology in different samples were not at all similar. Fine isotropic grains with a small amount of hexagonal column-shaped crystals were obtained in samples B3 and B4, while much larger isotropic grains were obtained in sample B1. The existence of hexagonal column-shaped crystals is due to the presence of Ca
2+ as the modifying cation, which has been proven to promote the formation of hexagonal column-shaped microcrystals [
12]. This has been shown by the distribution of particles determined by laser interferometer (SEISHIN LMS-30).
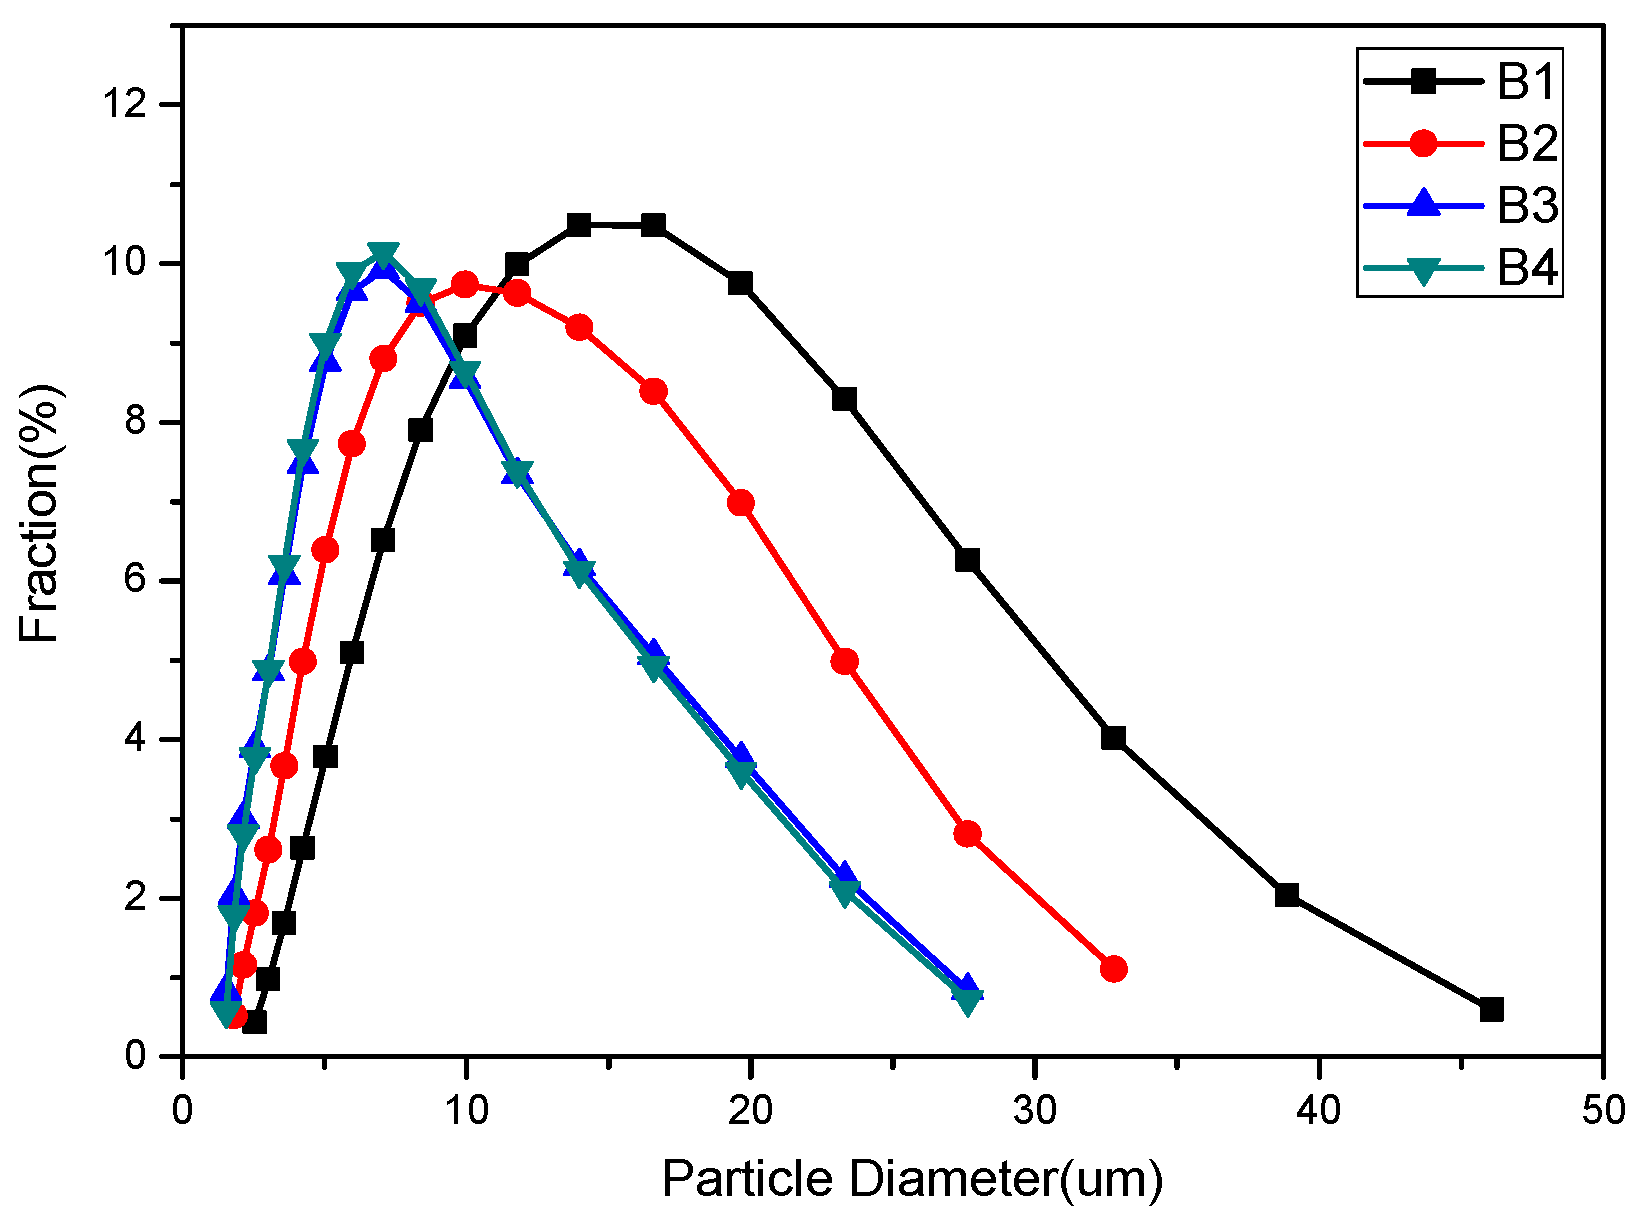
Figure 3 shows the density function of particle size for different samples; it can be seen that the particle size of samples B3 and B4 are identical from 2 μm to 28 μm, while sample B1 shows a much larger particle size distribution from 3 μm to 46 μm.
Figure 1.
XRD patterns of combustion synthesized Ca-α-SiAlON with different additives.
Figure 1.
XRD patterns of combustion synthesized Ca-α-SiAlON with different additives.
Figure 2.
SEM images of combustion synthesized Ca-α-SiAlON with different additives: (a) sample B1; (b) sample B2; (c) sample B3 and (d) sample B4.
Figure 2.
SEM images of combustion synthesized Ca-α-SiAlON with different additives: (a) sample B1; (b) sample B2; (c) sample B3 and (d) sample B4.
Figure 3.
Distribution of particle diameter of combustion synthesized Ca-α-SiAlON with different additives.
Figure 3.
Distribution of particle diameter of combustion synthesized Ca-α-SiAlON with different additives.
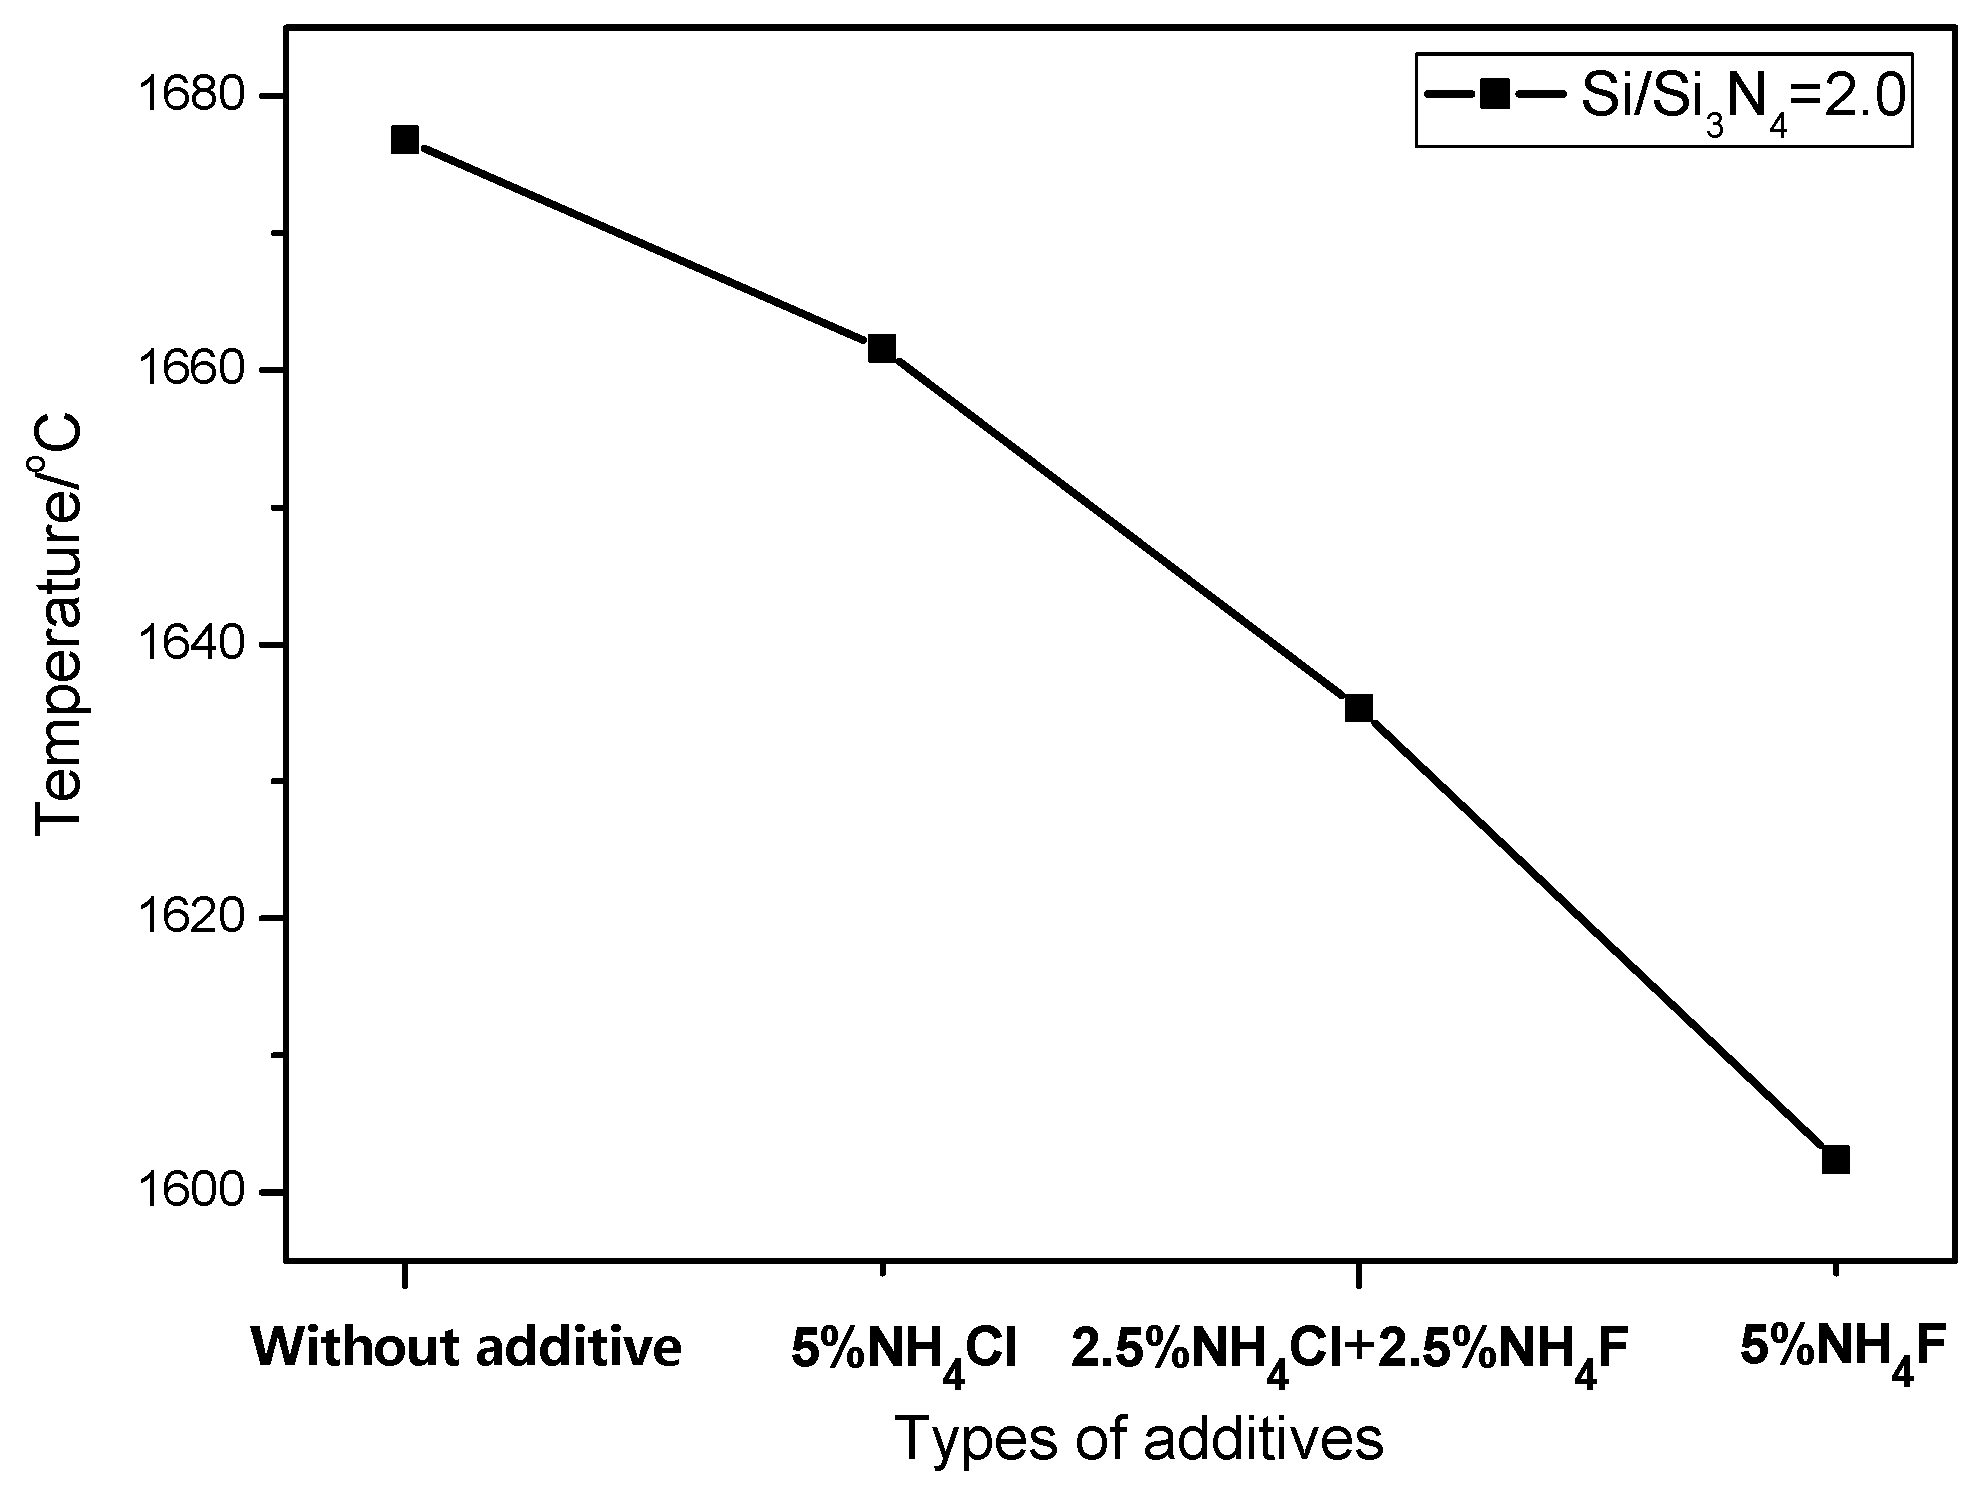
During the combustion synthesis process, the reaction temperature was drastically increased to above 1600 °C (
Figure 4), which is beneficial as it accelerates reaction rate and avoids the formation of an intermediate phase. In order to control the synthesis process, ammonium salts, such as NH
4F or NH
4Cl, were usually added in order to control material morphology in different aspects. It is well known that the decomposition of NH
4F or NH
4Cl is an endothermic process, resulting in a decreased combustion temperature. It is also noted that the enthalpy of NH
4F decomposition is higher than that of NH
4Cl, resulting in a lower combustion temperature than that of NH
4Cl (
i.e., the combustion temperature for sample B4 was lower than that for sample B2). Due to the low combustion temperature for sample B2, the small amount of Si could not be completely nitridated and were therefore detected in the XRD pattern (
Figure 1). Furthermore, NH
4F or NH
4Cl also acted as a catalyst [
24]; the decomposed nitrogen promoted the nitridation reaction of Si and led to enhanced Si
3N
4 formation.
Figure 4.
Temperature of combustion synthesis with different additives.
Figure 4.
Temperature of combustion synthesis with different additives.
It is also noteworthy that nucleation is closely related to temperature. With the lowest combustion temperature in sample B2, more crystal nuclei of Ca-α-SiAlON could precipitate from the liquid phase. Meanwhile, due to the space restrictions for the growth of Ca-α-SiAlON, the morphology of the crystal changed into grains and the Ca-α-SiAlON particle size decreased. Compared to Sample B2, higher combustion temperature caused a longer reaction time for Sample B3, which benefited the growth of the crystal in the [0001] direction and promoted the formation of hexagonal column-shaped α-SiAlON. With the addition of mixed additives, enhanced formation of Si3N4 provided more nucleation sites and caused the enhancement of granular particles. On the other hand, hexagonal column-shaped crystals were formed due to the addition of NH4Cl.
2.2. Oxidation Behavior
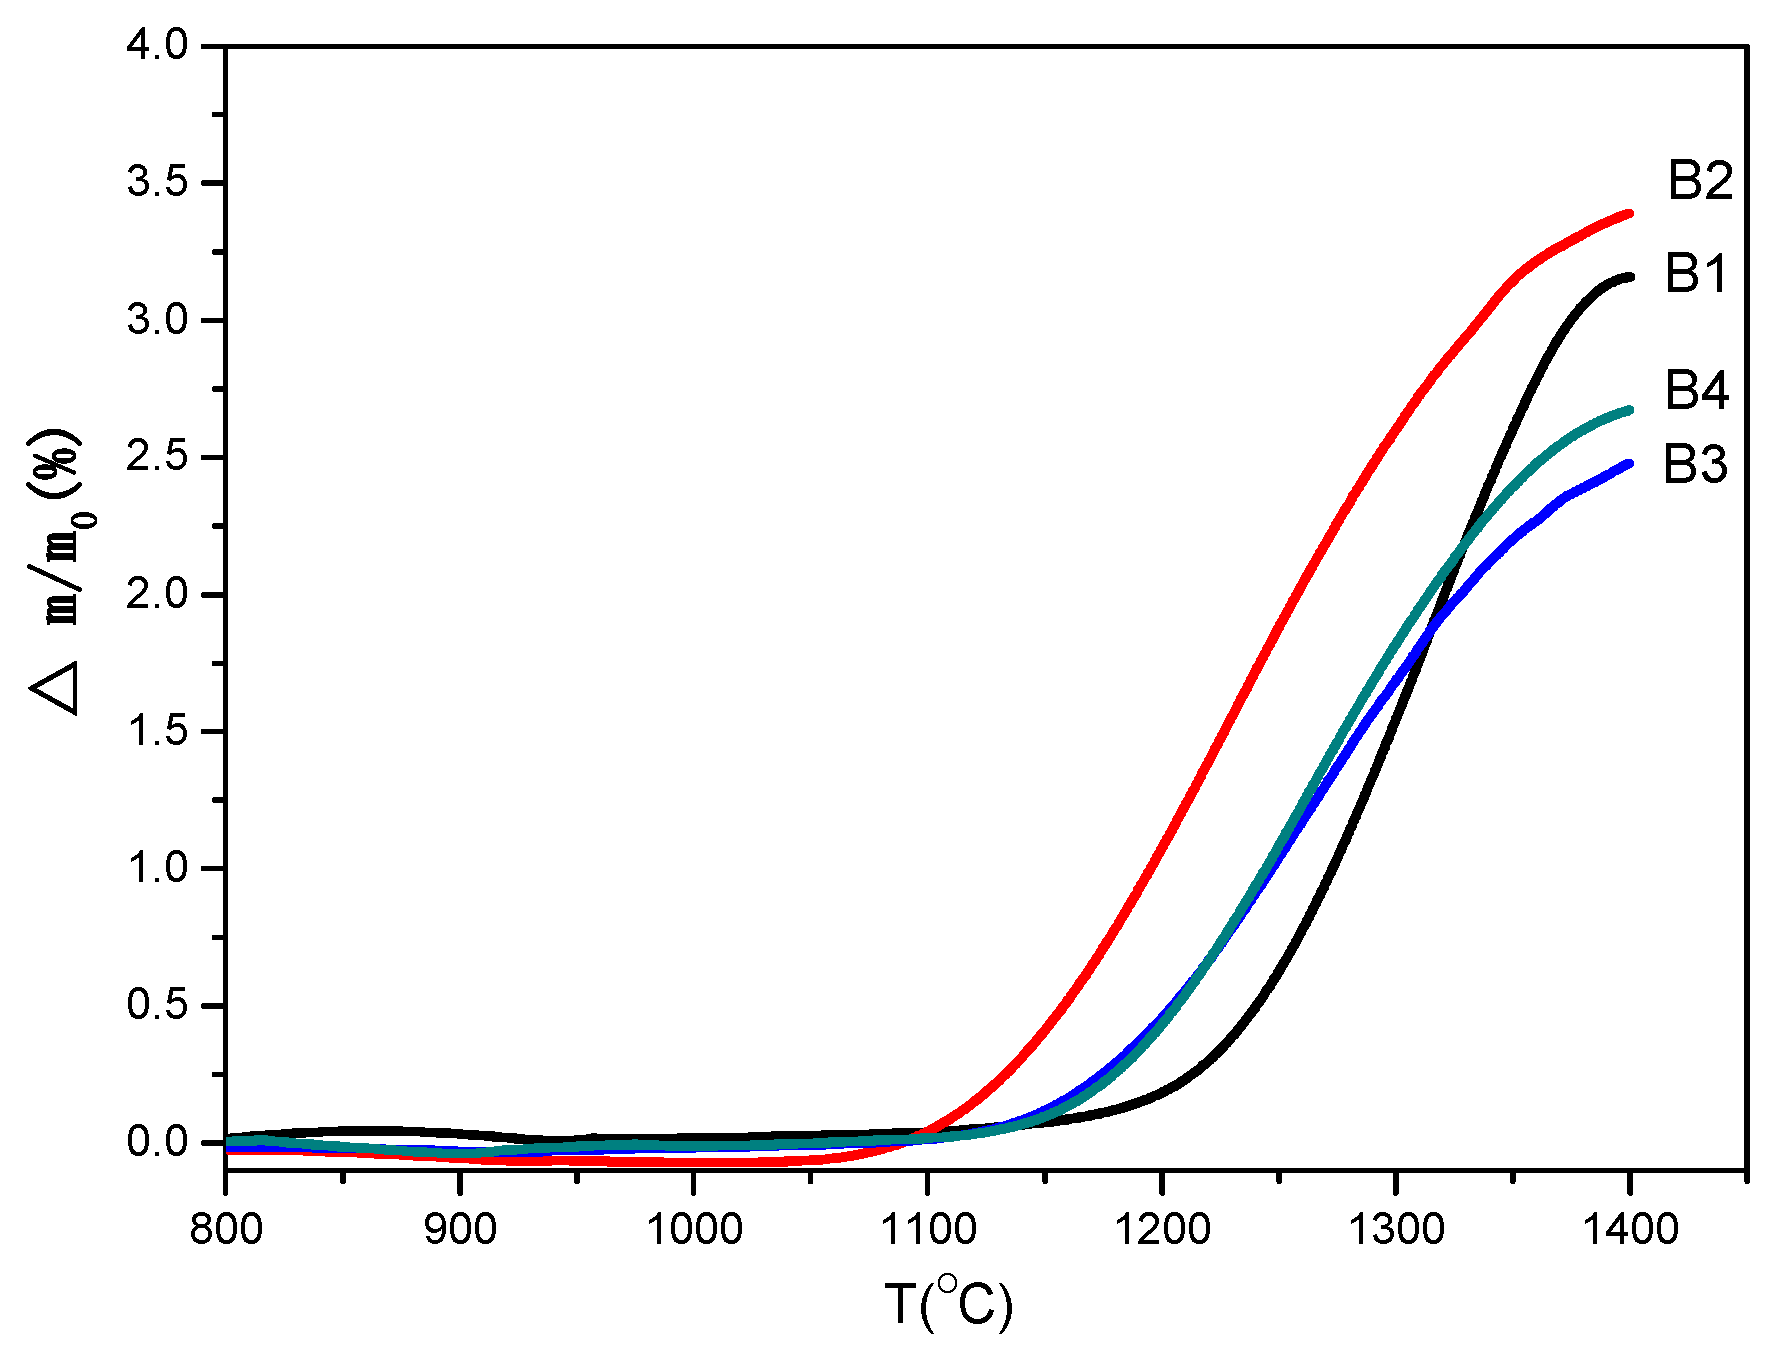
In order to determine oxidation characteristics and choose the oxidation temperature range, the non-isothermal experiments were conducted under air atmosphere, and the results are shown in
Figure 5. It can be seen that oxidation occurs at 1150 °C for samples B1, B3, and B4, while the mass gain starts at 1050 °C for sample B2, below which Ca-α-SiAlON is stable in air atmosphere. It is also noted that the percentage of mass gain at 1400 °C varies: 3.2%, 3.5%, 2.2%, and 2.5% for samples B1, B2, B3, and B4, respectively. The smaller percentage mass gain value indicated a better oxidation resistance of Ca-α-SiAlON. Generally speaking, the particle size has a significant effect on the oxidation of materials, and a smaller particle size may cause worse oxidation resistance [
25]. Considering that the powder size distribution is exactly the same for samples B3 and B4 (
Figure 3), the resistance of oxidation of sample B3 is better than that of sample B4. Comparing the oxidation behavior of samples B1, B2, B3, and B4, it can be seen that the resistance to oxidation of samples B1 and B2 is less than that of samples B3 and B4. This behavior can, in fact, be explained by many factors, which will be discussed in the following sections. According to the non-isothermal experimental results, a series of oxidation temperatures were chosen to carry out the isothermal experiments.
Figure 5.
Non-isothermal oxidation curves for different samples.
Figure 5.
Non-isothermal oxidation curves for different samples.
Isothermal mass gain curves as a function of time for a series of oxidation temperatures in the range of 1150–1350 °C are shown in
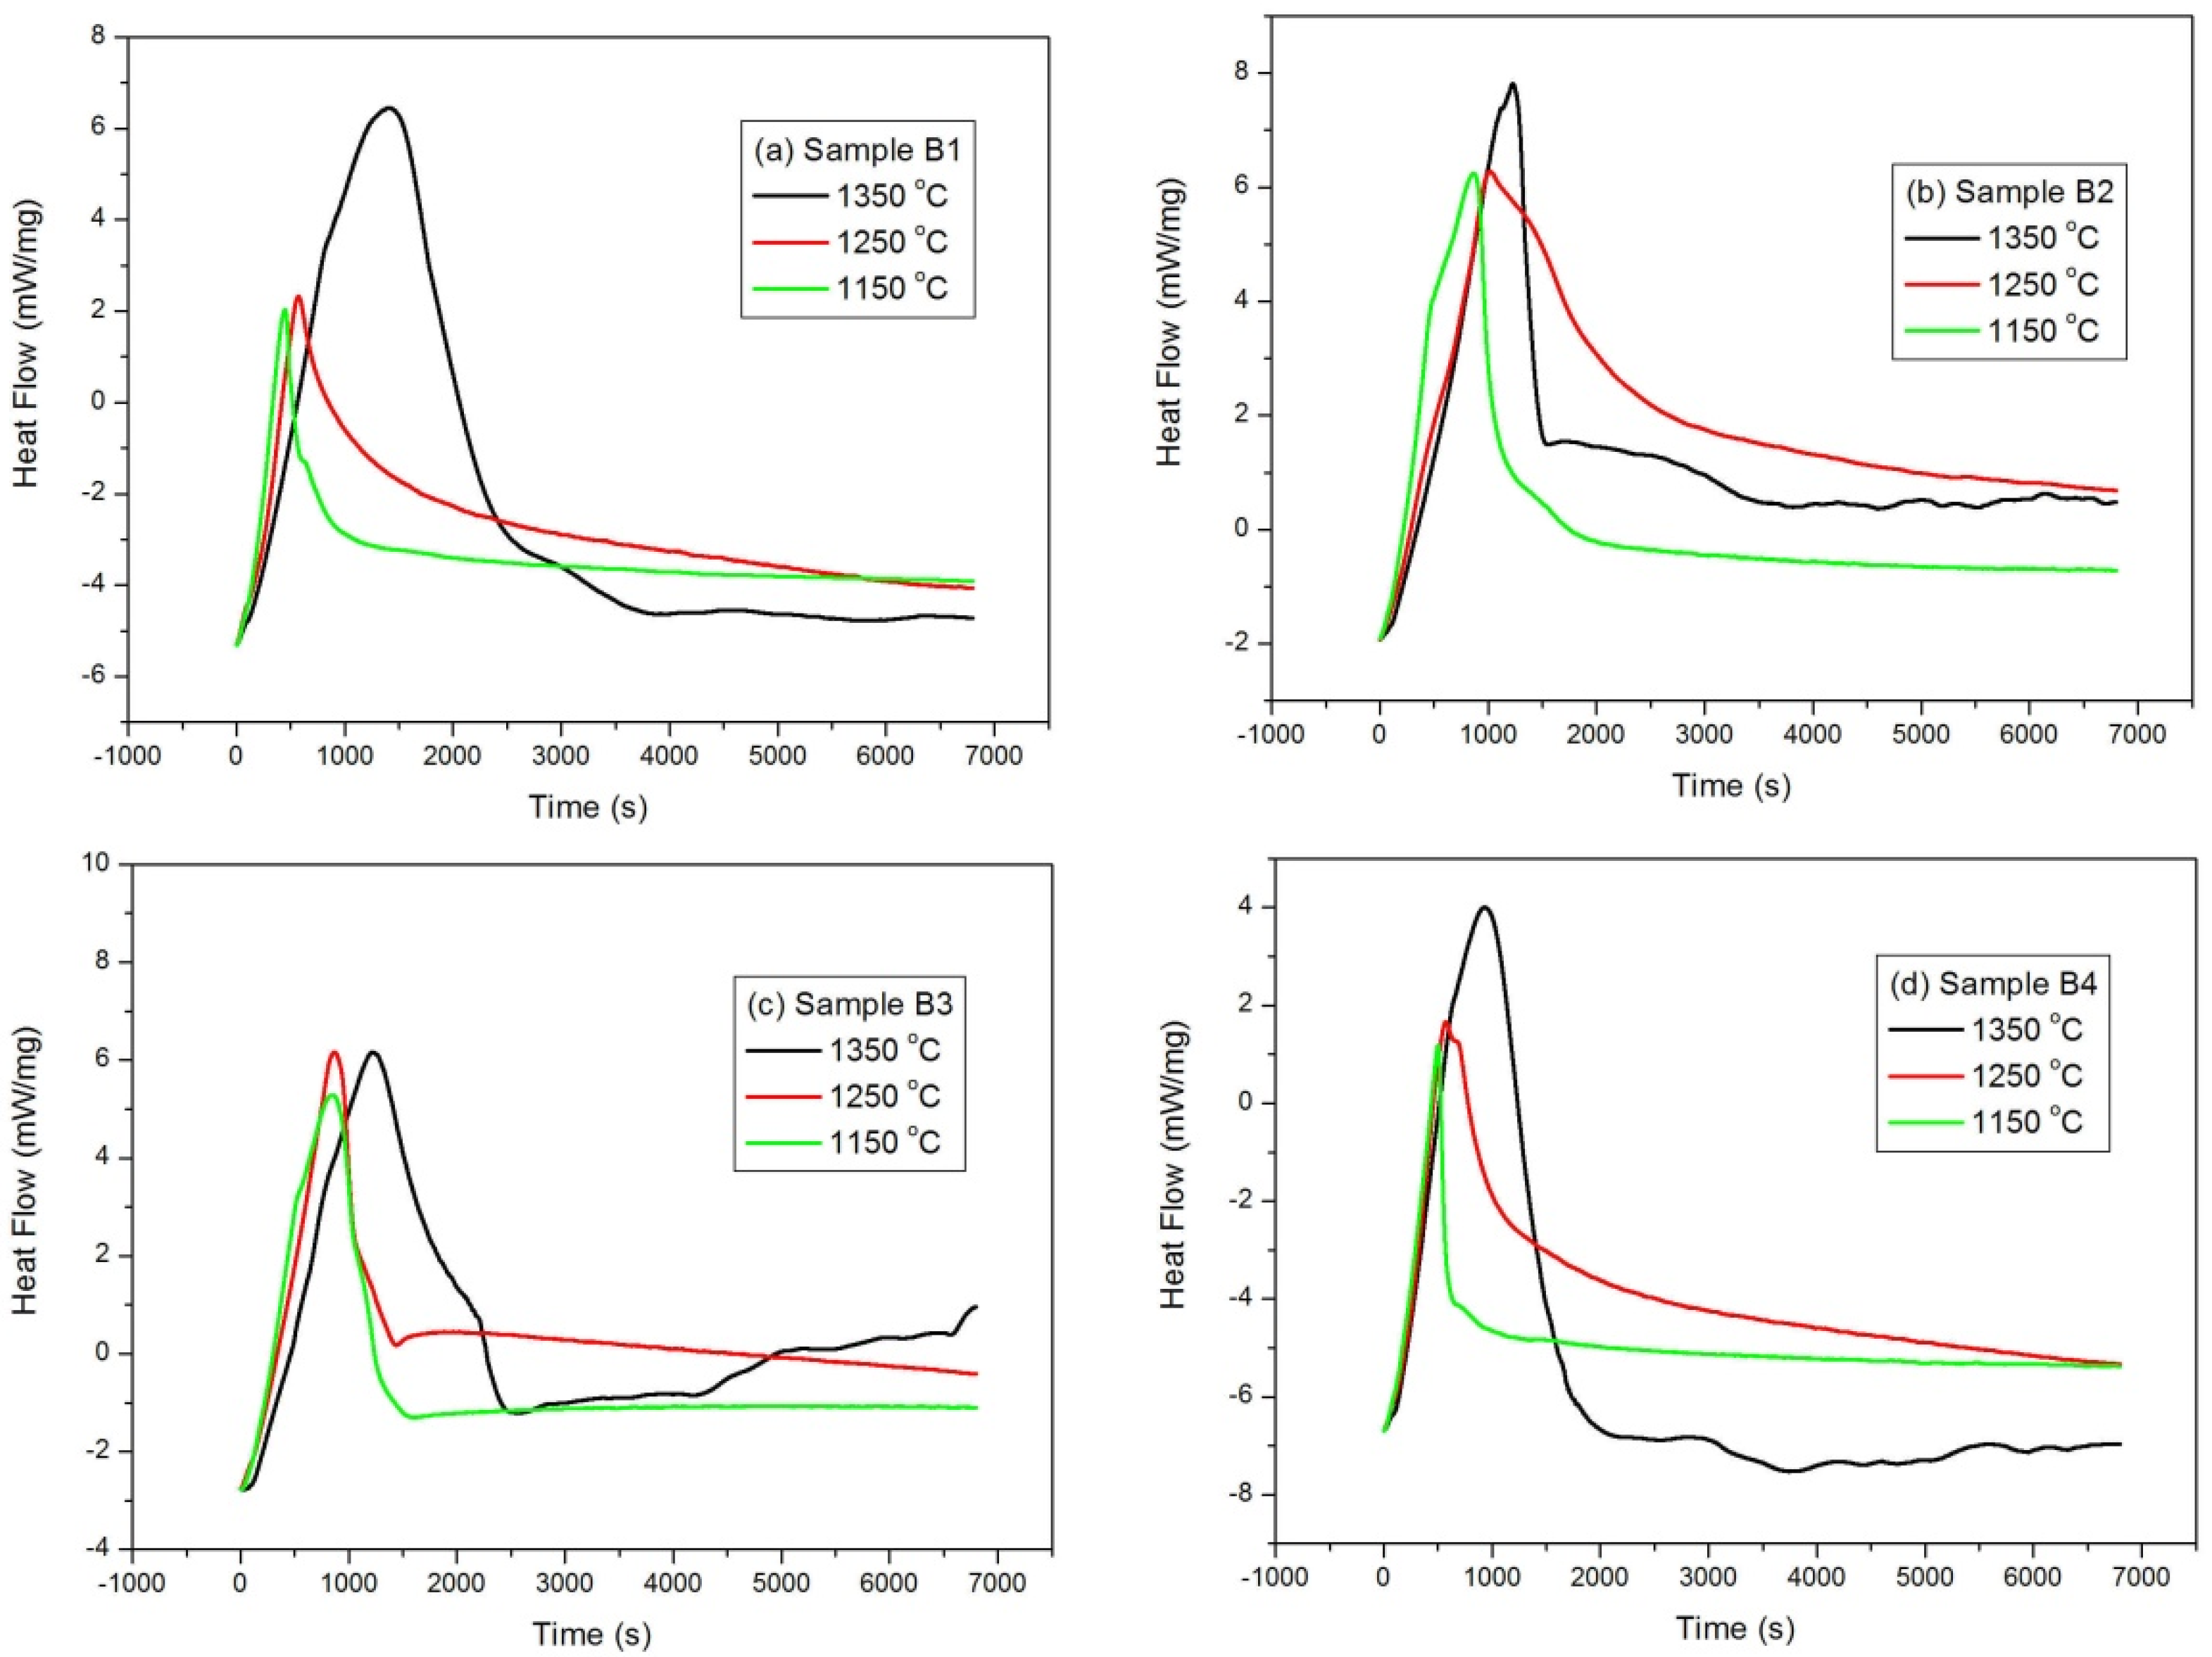
Figure 6, and it can be seen from the figures that all samples showed similar oxidation behavior, that is, a parabolic curve was observed. The oxidation rate shows an increase at the initial stage and a decrease at longer time intervals. This indicates that diffusion may be the controlling step due to the formation of a protective oxidation layer formed at the surface of the studied samples. It is also worth note that the relative mass gains are also variable. The thermal behaviors of different samples were also examined, and the differential scanning calorimetric (DSC) curves are illustrated in
Figure 7. A sharp exothermal peak was observed for samples at different isothermal temperatures. It is also worth note that the exothermal peak at the initial stage is very sharp, suggesting that the oxidation rate is very drastic, initially. As the oxidation time proceeded for around 2500 s, the DSC curves became very mild, indicating that the oxidation rate is slow at longer time intervals.
Figure 6.
Isothermal oxidation curves for (a) sample B1; (b) sample B2; (c) sample B and (d) sample B4.
Figure 6.
Isothermal oxidation curves for (a) sample B1; (b) sample B2; (c) sample B and (d) sample B4.
Figure 7.
Differential Scanning Calorimetric (DSC) curves for (a) sample B1; (b) sample B2; (c) sample B3 and (d) sample B4, respectively.
Figure 7.
Differential Scanning Calorimetric (DSC) curves for (a) sample B1; (b) sample B2; (c) sample B3 and (d) sample B4, respectively.
2.3. Characterization of Oxidation Products
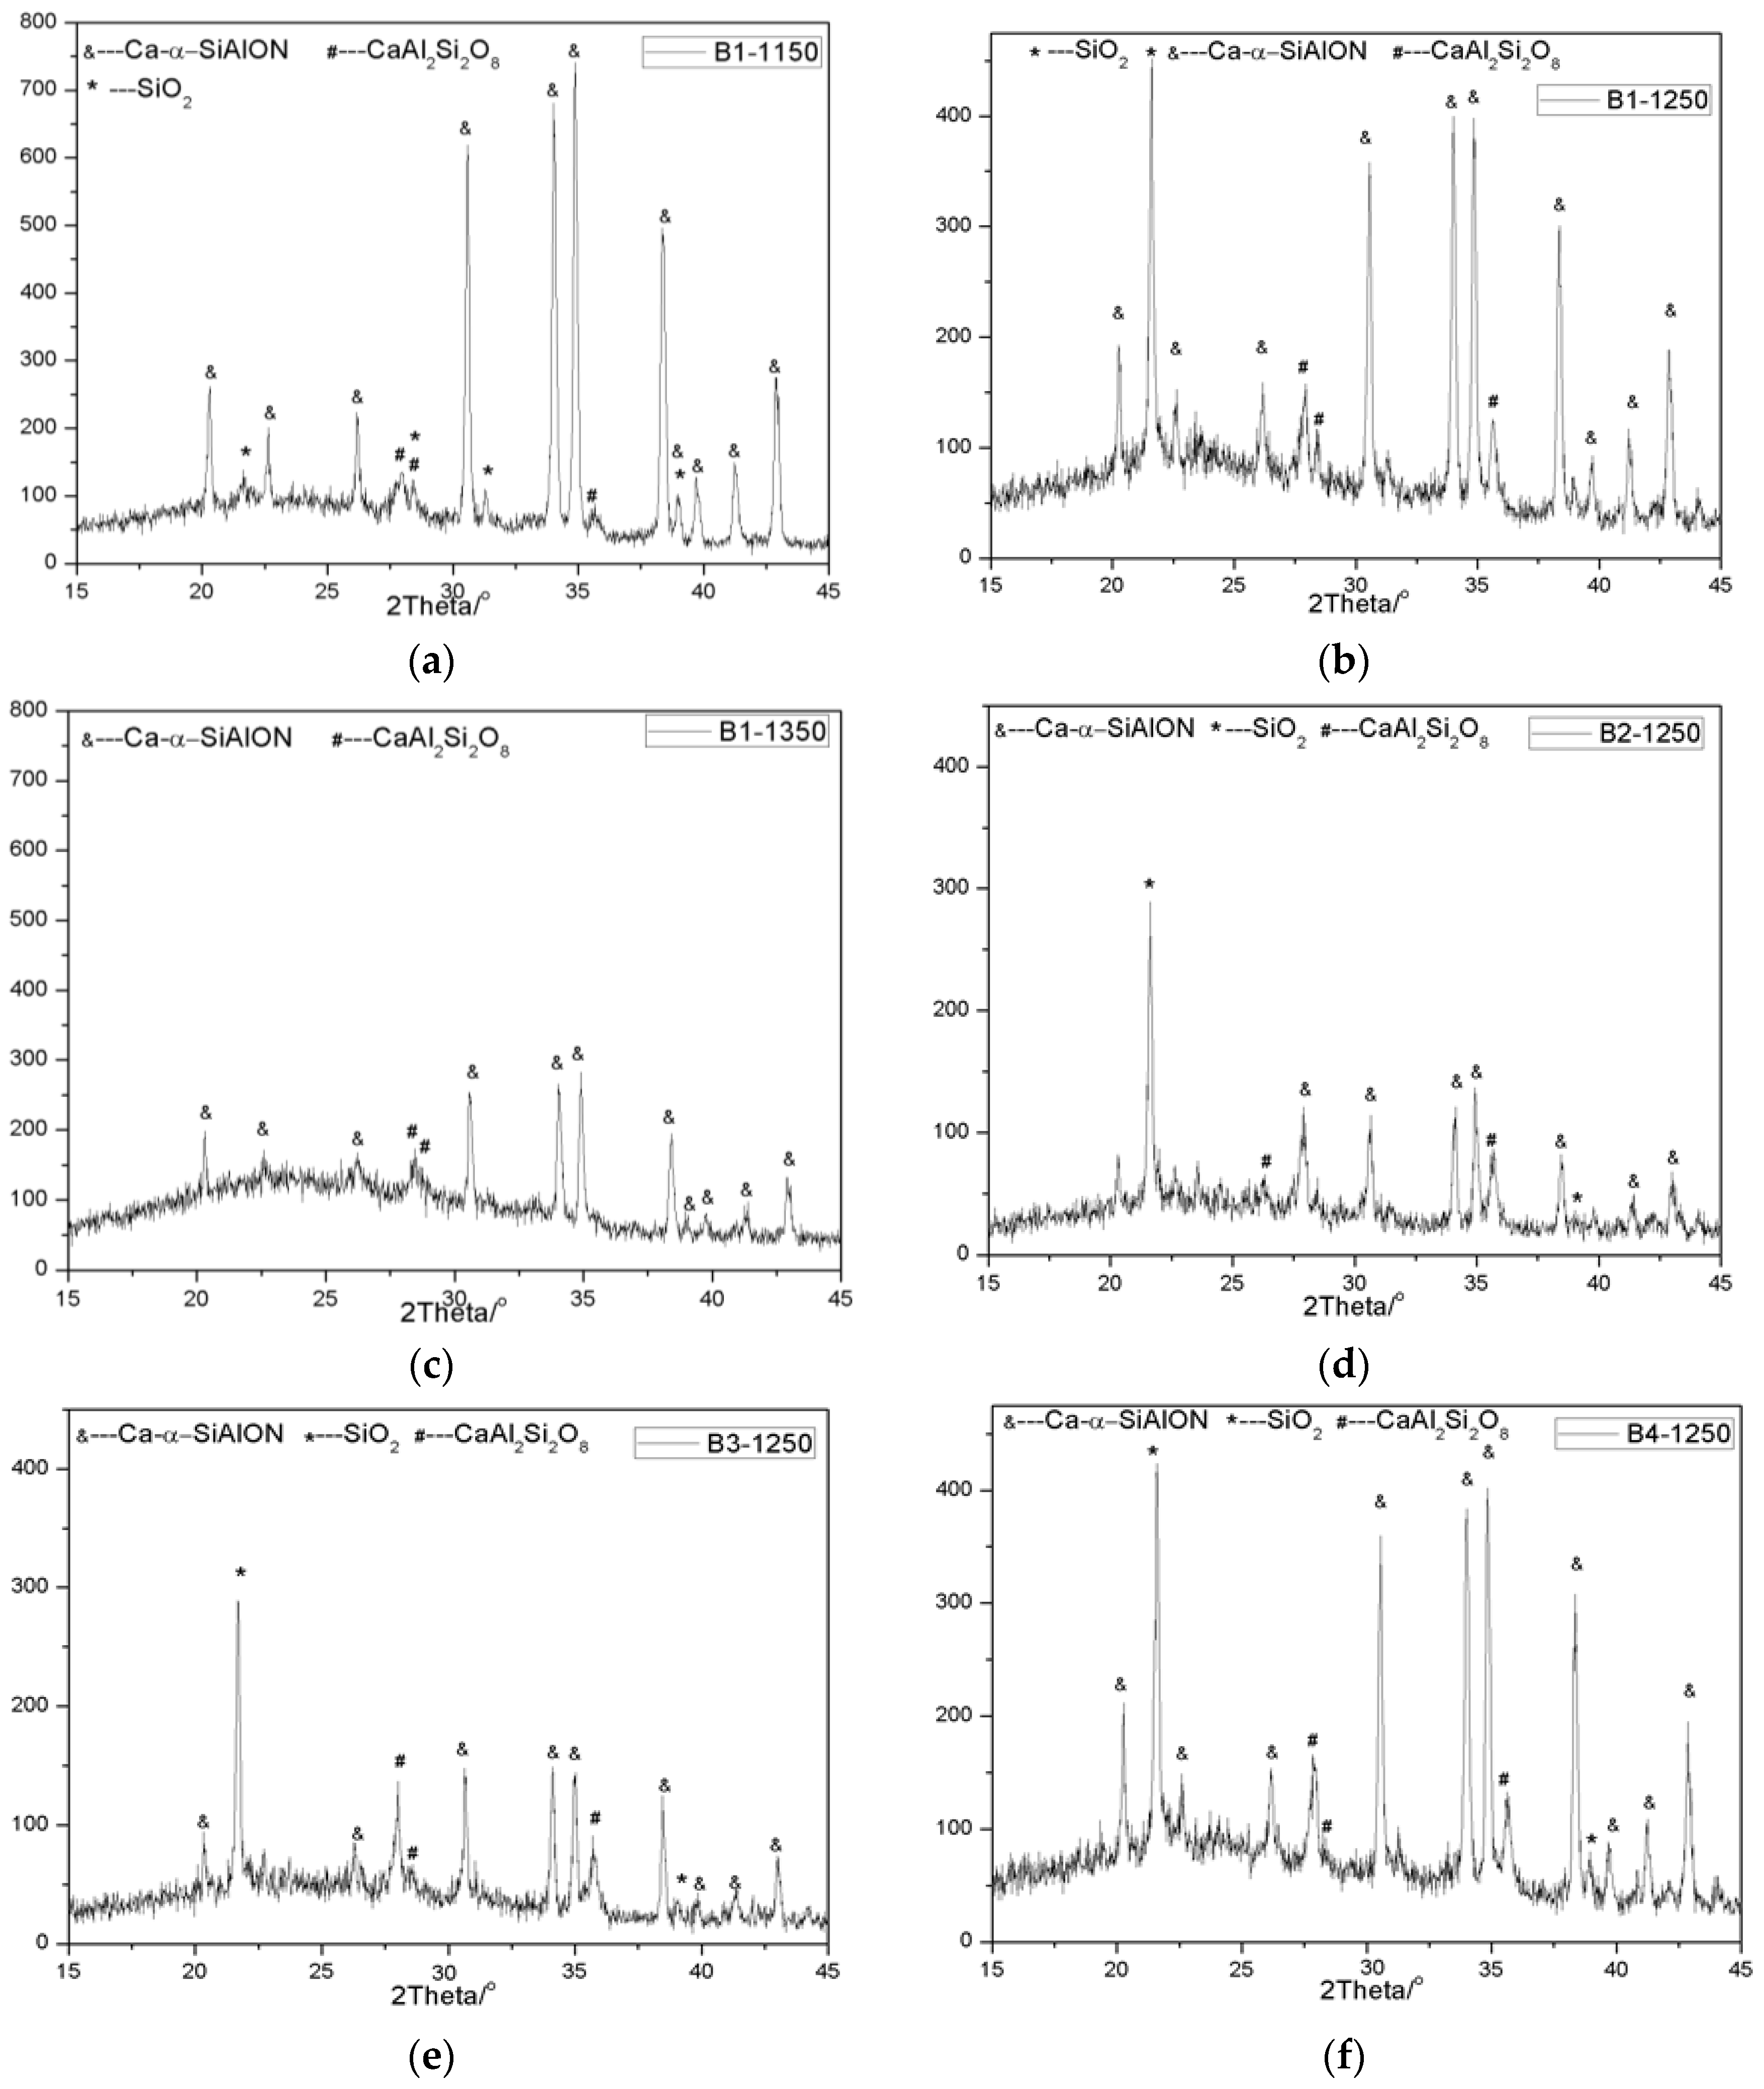
In order to determine the product of oxidation, the samples after oxidation at different temperatures were taken out and examined by X-ray diffraction (XRD) and scanning electron microscopy (SEM). The results are shown in
Figure 8 and
Figure 9, respectively. It can be seen that the oxidation products are dependent on oxidation temperature and sample, according to XRD patterns. At lower oxidation temperatures, such as 1150 °C, after oxidation for 2 h, XRD results showed that the oxidation products of Ca-α-SiAlON were composed of SiO
2 and CaAl
2Si
2O
8. Upon increasing oxidation temperature to 1250 °C, the relative intensity of SiO
2 and CaAl
2Si
2O
8 are obviously increased, and the relative intensity of Ca-α-SiAlON correspondingly decreased, suggesting that the oxidation rate accelerated. At a temperature of 1350 °C, it is interesting to note that the XRD peaks of SiO
2 disappeared, instead of the appearance of an obvious boultin peak, suggesting that glassy phases were formed. This is consistent with the previous results showing that a glassy phase with a low melting point is easy to form in the SiO
2-Al
2O
3-CaO ternary system [
20,
21,
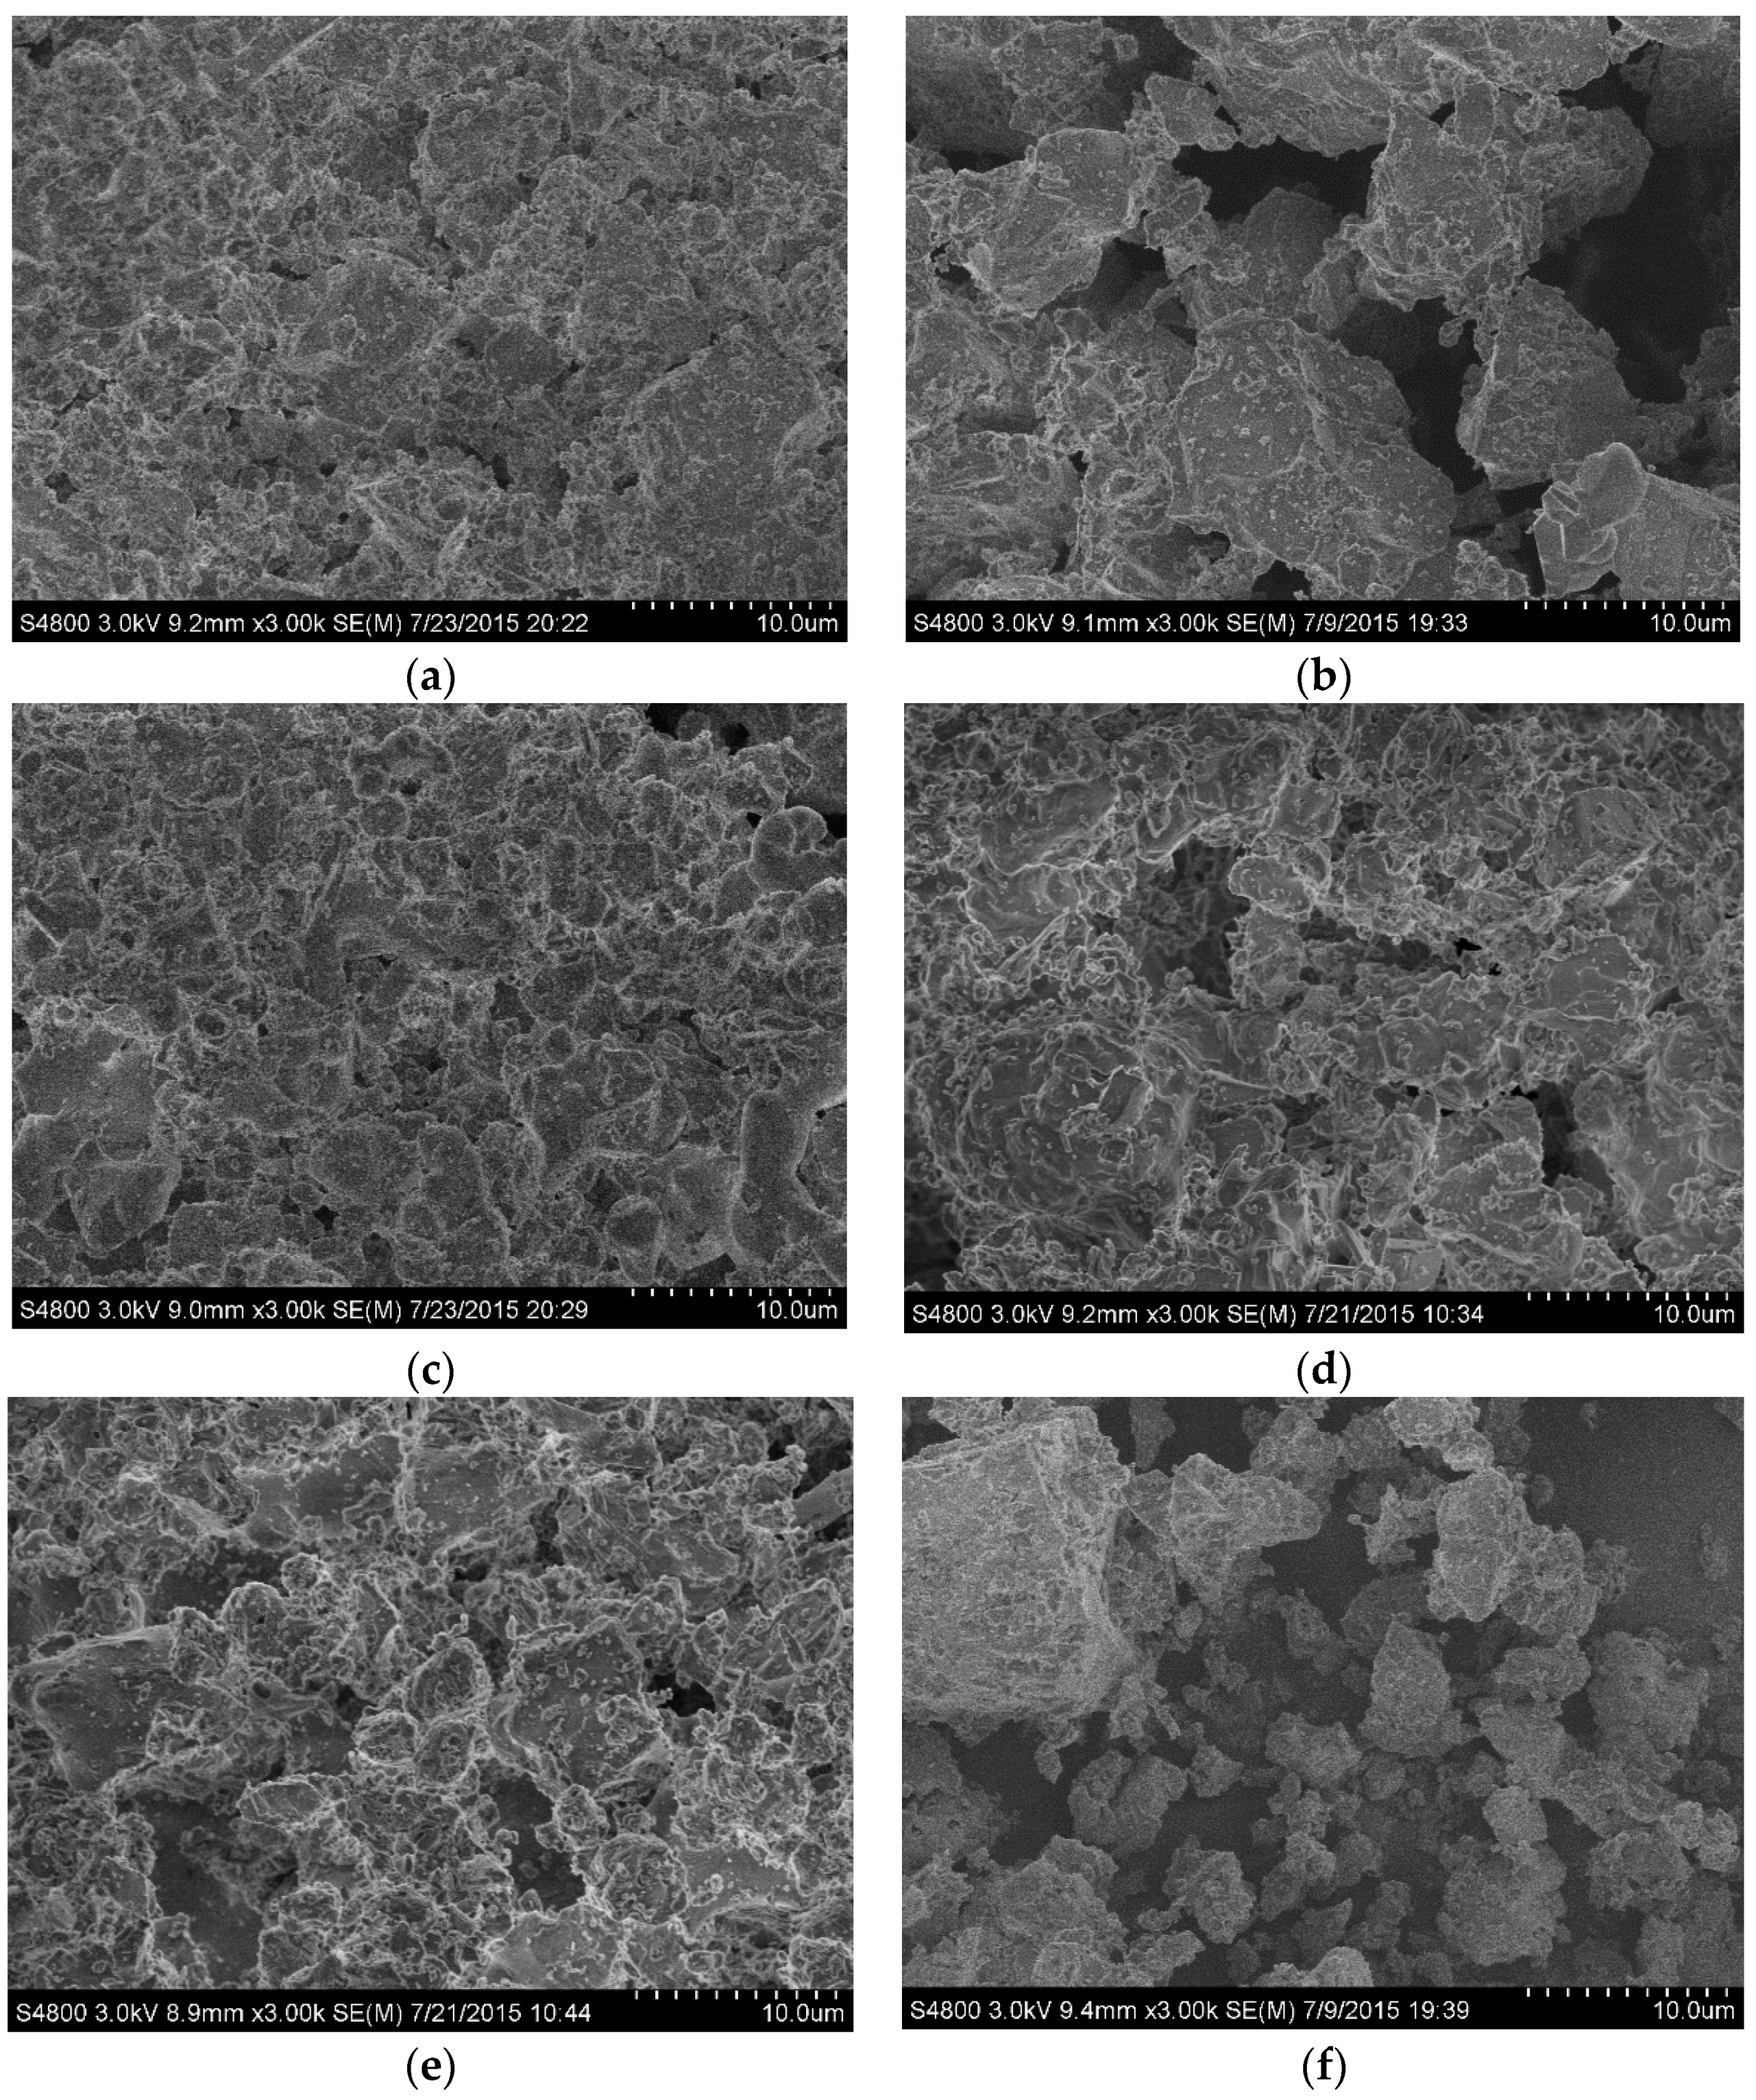
26]. The glassy phase with a low melting point may result in different oxidation behavior at high oxidation temperatures. After oxidation, the oxidized powders were taken out and examined by SEM.
Figure 9 shows the morphological development of Ca-α-SiAlON powders under different conditions. It can be seen, compared with the raw materials, that the rod-shape structure of Ca-α-SiAlON was completely destroyed and the sample surface became very rough.
Figure 8.
XRD patterns of the samples oxidized under different conditions: (a) B1-1150; (b) B1-1250; (c) B1-1350; (d) B2-1250; (e) B3-1250; (f) B4-1250.
Figure 8.
XRD patterns of the samples oxidized under different conditions: (a) B1-1150; (b) B1-1250; (c) B1-1350; (d) B2-1250; (e) B3-1250; (f) B4-1250.
Figure 9.
SEM images of the samples after 2 h oxidation under different conditions: (a) B1-1150; (b) B1-1250; (c) B1-1350; (d) B2-1250; (e) B3-1250; (f) B4-1250.
Figure 9.
SEM images of the samples after 2 h oxidation under different conditions: (a) B1-1150; (b) B1-1250; (c) B1-1350; (d) B2-1250; (e) B3-1250; (f) B4-1250.
2.4. Kinetic Models
Generally speaking, the oxidation of Ca-α-SiAlON is a complicated process. The complete oxidation products are composed of CaO, SiO
2, and Al
2O
3, and these phases can react with each other to form gehlenite (CaAl
2Si
2O
8)—the reaction can be expressed as follows.
As the oxidation temperature increases, CaO, SiO
2 and Al
2O
3 oxides may form a glassy phase at the eutectic point in the ternary CaO-SiO
2-Al
2O
3 phase diagram [
26], resulting in the disappearance of SiO
2 in the oxidation products.
As in the aforementioned analysis (
Figure 6), the oxidation of Ca-α-SiAlON powders is a typical gas-solid reaction. The thermogravimetric (TG) curves show a parabolic shape, indicating that the oxidation process may be controlled by mixed chemical reaction and diffusion. Hence, beyond the initial period, the oxidation reaction can be considered to consist of the following steps [
24]:
- (1)
Oxygen transfer from bulk gas flow through the gas–solid boundary layer to the sample surface,
- (2)
Oxygen diffusion from the surface to the interface through the product layer,
- (3)
Chemical reactions between the sample and oxygen at the interface,
- (4)
Nitrogen diffusion through the interface to the sample surface,
- (5)
Nitrogen transfer from the sample surface to bulk gas flow through the gas-solid boundary layer.
Based on the explicit derivation of gas-solid reactions according to these steps, Chou
et al. [14–18] have proposed a model (RPP model) that can deal with the gas-solid reaction under the conditions where all kinds of possible controlling steps exist, based on physical principles and mathematical calculation. The present study attempted to use this model to investigate the oxidation behavior of Ca-α-SiAlON powders synthesized under different conditions. Therefore, the reacted fraction
, for the case of describing the chemical reactions as the controlling step can be expressed as
where
and
represent the apparent activation energy describing the chemical reaction and the reacted fraction, respectively.
and
are the oxygen partial pressure in the bulk gas phase and the oxygen partial pressure in equilibrium at the reaction interface, respectively.
is the temperature-independent constant.
is the density of the sample,
R0 is the initial radius of the particle, and
t is the reaction time.
R and
T are the gas constant and temperature, respectively.
In the case of diffusion controlling the oxidation process, the reacted fraction
can be expressed as a function of time, temperature, oxygen partial pressure, and particle size. The relation can be described as
where
is the apparent activation energy describing diffusion.
and
are the constants independent of temperature but related to the materials investigated.
In order to simplify Equations (2) and (3), a new concept of the characteristic reaction time for the chemical and diffusion controlling steps can be introduced and expressed by the following equations, respectively:
According to Equations (4) and (5), it can be seen that the “characteristic reaction time”
and
are dependent on such factors as the radius of the powder, the reaction intensity of the environment, the character of the medium where gas passes through, as well as the property of reactant and product materials. It has no relation with the oxidation time, however. Therefore, the characteristic reaction time can be selected to characterize the property of oxidation resistance of Ca-α-SiAlON powders. In general, the “characteristic reaction time” can also be extracted from a set of experimental data. Substituting Equations (4) and (5) into Equations (2) and (3), respectively, yields:
When
,
= 1. That is,
is the time required for the whole powder to undergo complete oxidation.
and
can also be calculated from the value of
and
, according to the following equations:
Based on the above illustration, the isothermal oxidation kinetics of Ca-α-SiAlON is given as:
Note that the y-axis in the experimental plots (
Figure 6) is the mass gain percent ∆
w(∆
m/
m0) instead of the reacted fraction
. A transformation is required according to the following equation:
Where
is the theoretical maximum increment after complete oxidation. By the regression method, characteristic oxidation time (
and
) and apparent activation energy of
and
under the three temperatures are summarized and illustrated in
Table 1. The curves obtained from the above equations are also shown in
Figure 6 as red lines, which fits the experimental data fairly well.
Table 1.
The characteristic time and apparent activation energy of sample oxidation calculated by RPP model in air at 1150–1350 °C.
Table 1.
The characteristic time and apparent activation energy of sample oxidation calculated by RPP model in air at 1150–1350 °C.
| Sample | Temperature (°C) | Characteristic Time (s) | Apparent Activation Energy (kJ/mol) |
|---|
| tcc | tcd | | |
|---|
| B1 | 1150 | 9846 | 18,050 | 80.95 | 51.98 |
| 1250 | 7409 | 16,055 |
| 1350 | 4206 | 10,429 |
| B2 | 1150 | 8586 | 15,790 | 28.94 | 49.25 |
| 1250 | 7090 | 14,055 |
| 1350 | 6360 | 9392 |
| B3 | 1150 | 13,197 | 23,619 | 85.83 | 56.99 |
| 1250 | 8548 | 17,046 |
| 1350 | 4378 | 12,820 |
| B4 | 1150 | 10,603 | 20,488 | 105.29 | 58.70 |
| 1250 | 7918 | 16,893 |
| 1350 | 4301 | 11,259 |
Theoretically, when analyzing
Table 1, it can be seen that the value of characteristic oxidation time gradually decreases with increasing temperature for each sample, indicating the oxidation resistance of the sample decreases with increasing temperature. On the other hand, the characteristic oxidation time increases in the sequence of samples B2, B1, B4, and B3 at the same temperature. Theoretically speaking, a shorter characteristic oxidation time usually indicates inferior oxidation resistance properties and the results agree well with that as shown in
Figure 5. It should be also noted, however, that particle size is also closely related to its oxidation resistance property, and a decreasing particle size is thought to be detrimental to material oxidation resistance [
25]. According to the particle size distribution (
Figure 3), the particle size of samples B1 and B2 is larger than that of samples B3 and B4. If the theory fits in our experiment, sample B1 should have the longest characteristic oxidation time, followed by sample B2. In addition, the characteristic oxidation time for samples B3 and B4 should be similar to each other and shorter than that of sample B2. This speculation contradicts with our experimental results, however—the other factors may also have a significant effect on its oxidation resistance properties. Based on the SEM images of Ca-α-SiAlON (
Figure 2), it is concluded that crystal morphology may also determine oxidation resistance. From
Figure 2, it is found that hexagonal column-shaped crystals exist in all samples apart from sample B2, which has the worst oxidation resistance, validating the theory that hexagonal column-shaped crystals are beneficial to enhanced material oxidation resistance.
Based on these findings, it can be concluded that the addition of additives could cause a change in crystal morphology and further affect oxidation properties. To be more specific, the addition of 5 wt.% NH4F leads to the formation of irregular grain-shaped Ca-α-SiAlON crystals with a smaller particle size than sample B1. These two factors result in the worst oxidation resistance property for sample B2, confirming that NH4F addition has a negative effect on material oxidation resistance. When compared to the other three samples, it is found that sample B1 has the least amount of hexagonal column-shaped crystals. As a result, samples B3 and B4 have better oxidation resistance than sample B1. Regarding samples B3 and B4, the addition of 5% NH4Cl in B3 could better promote the formation of hexagonal column-shaped Ca-α-SiAlON crystals than the addition of mixed additives (2.5 wt.% NH4F and 2.5 wt.% NH4Cl). Therefore, the oxidation resistance of sample B3 is better than that of B4.


