2.3. Microstructure
The grain characteristics and morphology of developed Mg materials are shown in
Figure 1 and listed in
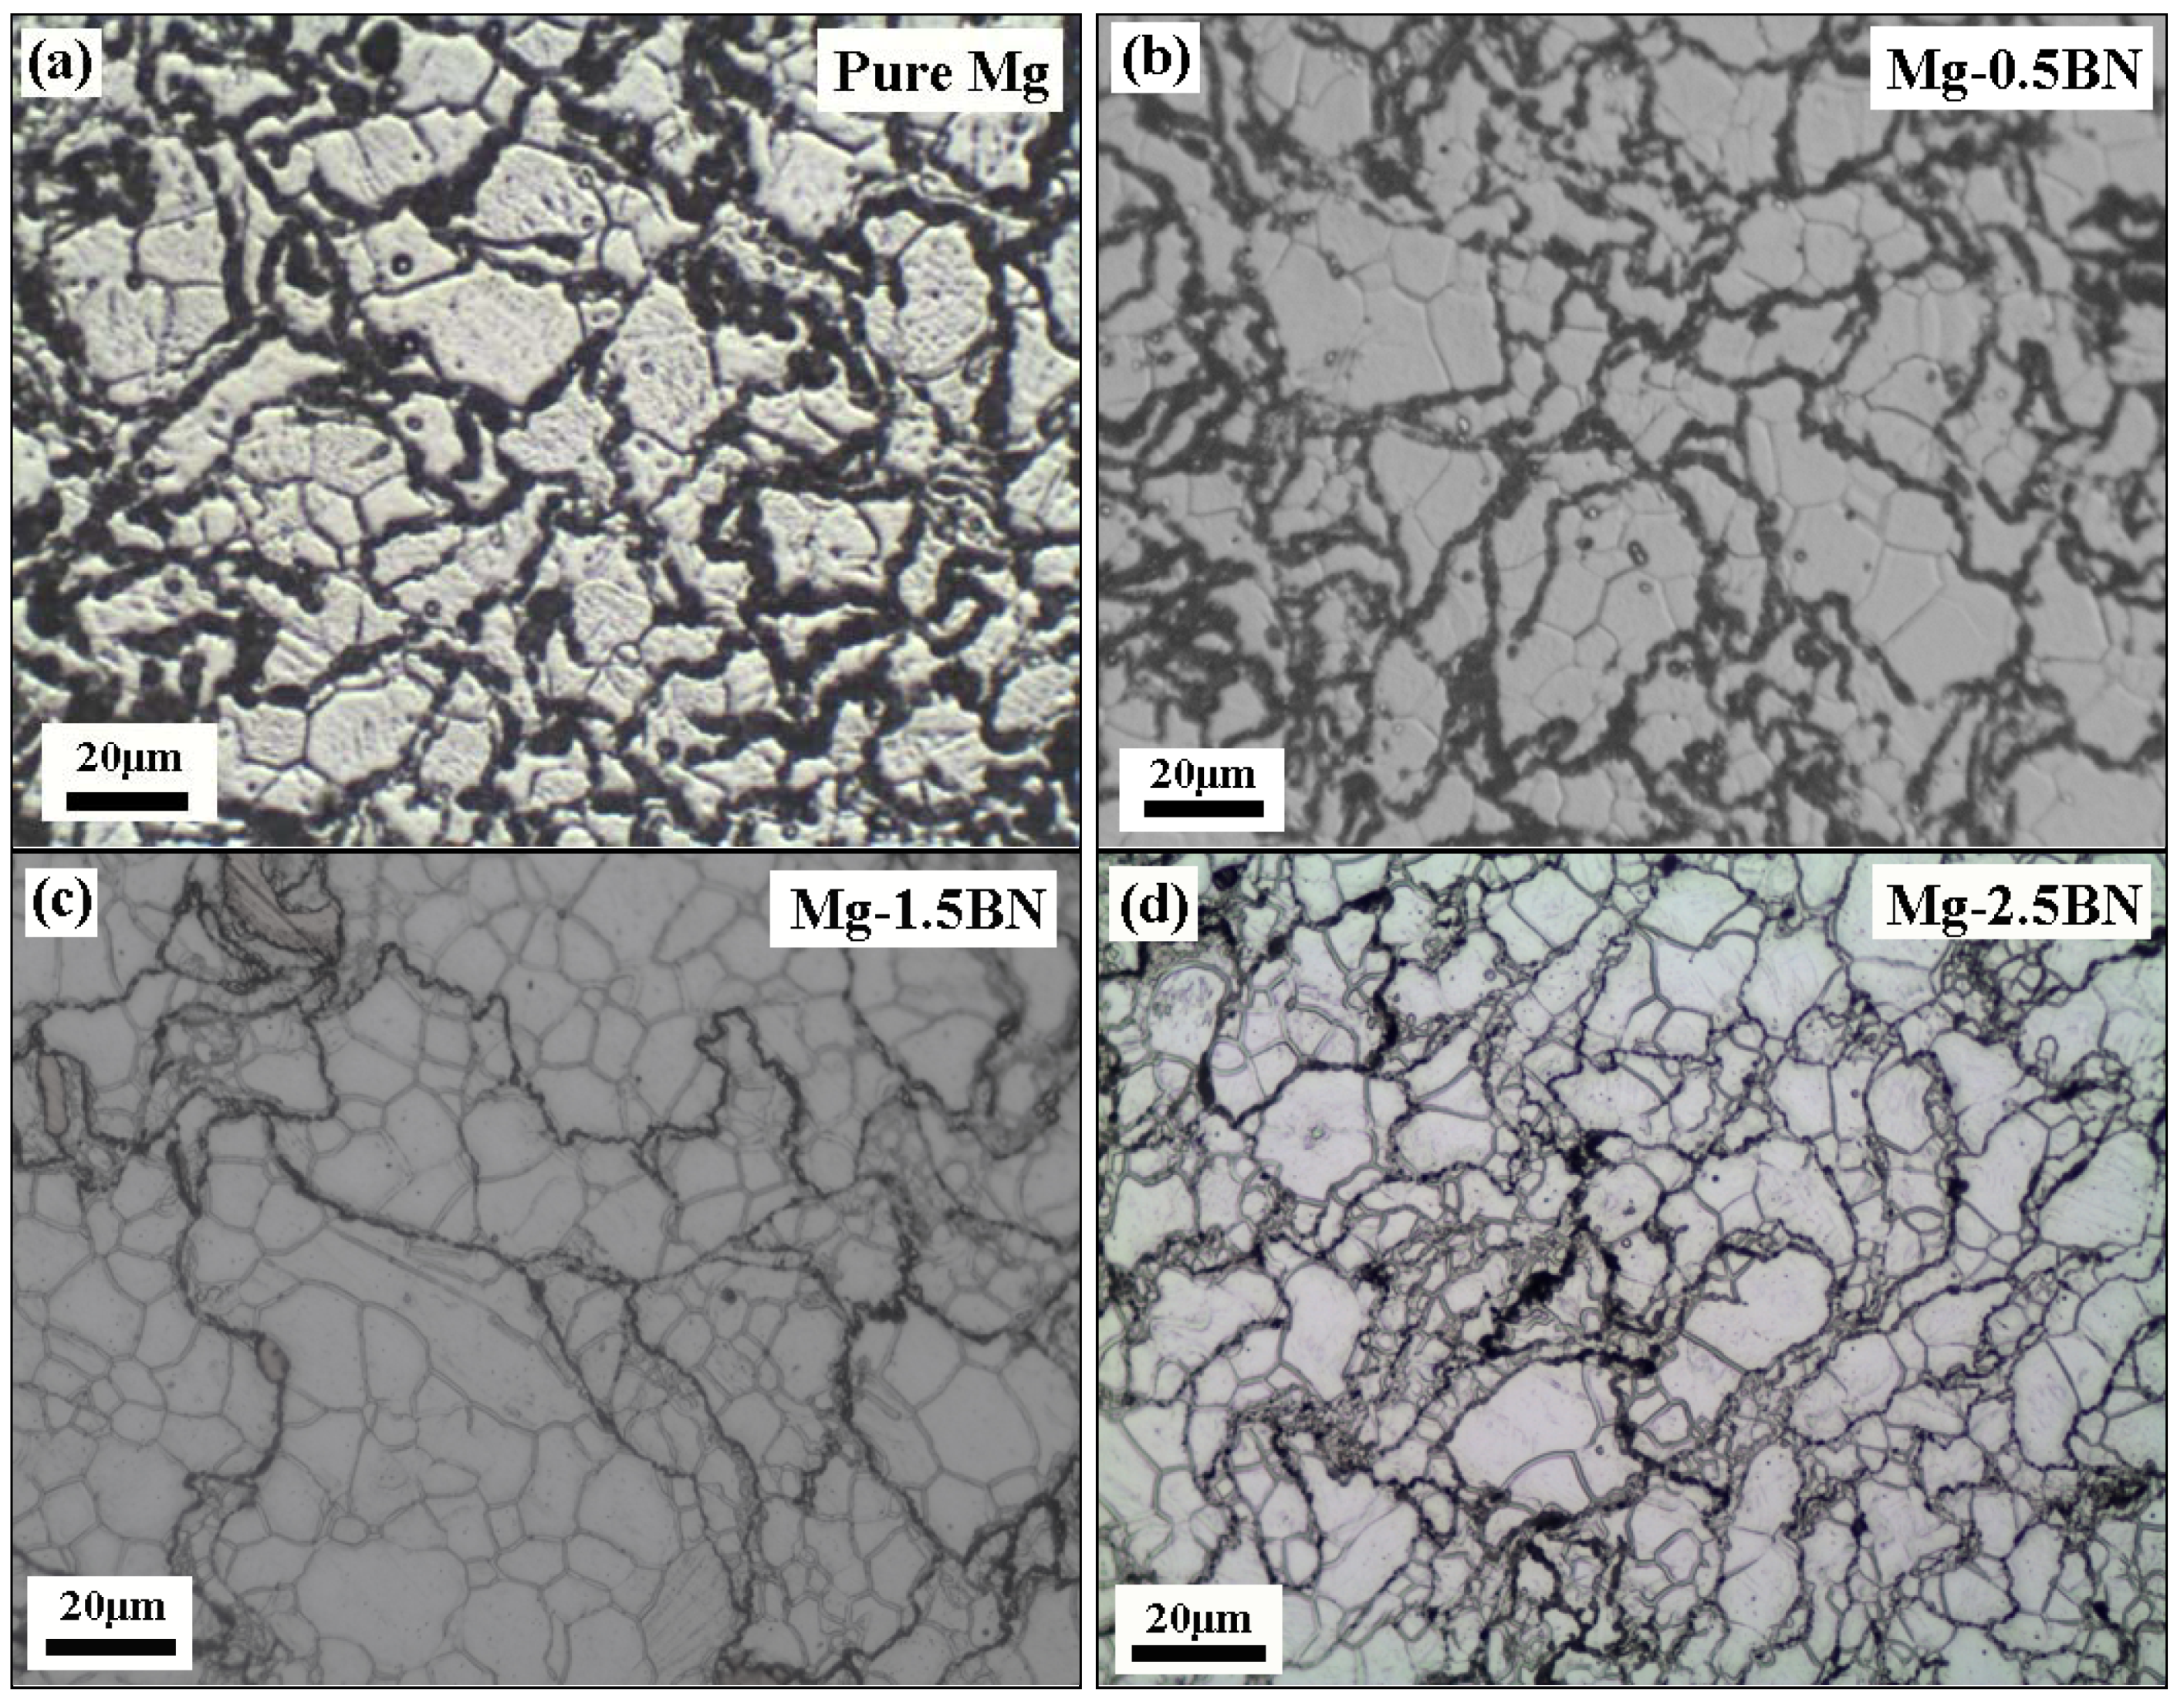
Table 2. The microstructural characteristics (average grain size and aspect ratio) of pure Mg and Mg/BN composites based on grain size measurements conducted on the optical micrographs (
Figure 1) are presented in
Table 2. It revealed the unimodal distribution of grain size, which indicates one maxima for the grain size distribution,
i.e., maximum grains of the same size. This shows the complete recrystallization of Mg-matrix during extrusion [
17]. Further, the addition of nanosized BN particulates resulted in marginal reduction of average matrix grain size from 28µ to 19µ (
Table 2). However, considering the standard deviation, it was observed to be minimal and independent of the reinforcement volume fraction.
Figure 1.
Optical micrographs showing the grain characteristics of: (a) pure Mg; (b) Mg-0.5BN; (c) Mg-1.5BN; and (d) Mg-2.5BN.
Figure 1.
Optical micrographs showing the grain characteristics of: (a) pure Mg; (b) Mg-0.5BN; (c) Mg-1.5BN; and (d) Mg-2.5BN.
Table 2.
Results of grain size measurements.
Table 2.
Results of grain size measurements.
| S. No. | Material | Grain size (µm) | Aspect ratio |
|---|
| 1 | Pure Mg | 28.94 ± 5.86 | 1.61 ± 0.55 |
| 2 | Mg-0.5BN | 21.42 ± 2.67 | 1.54 ± 0.44 |
| 3 | Mg-1.5BN | 22.15 ± 1.92 | 1.67 ± 0.39 |
| 4 | Mg-2.5BN | 19.43 ± 3.43 | 1.56 ± 0.42 |
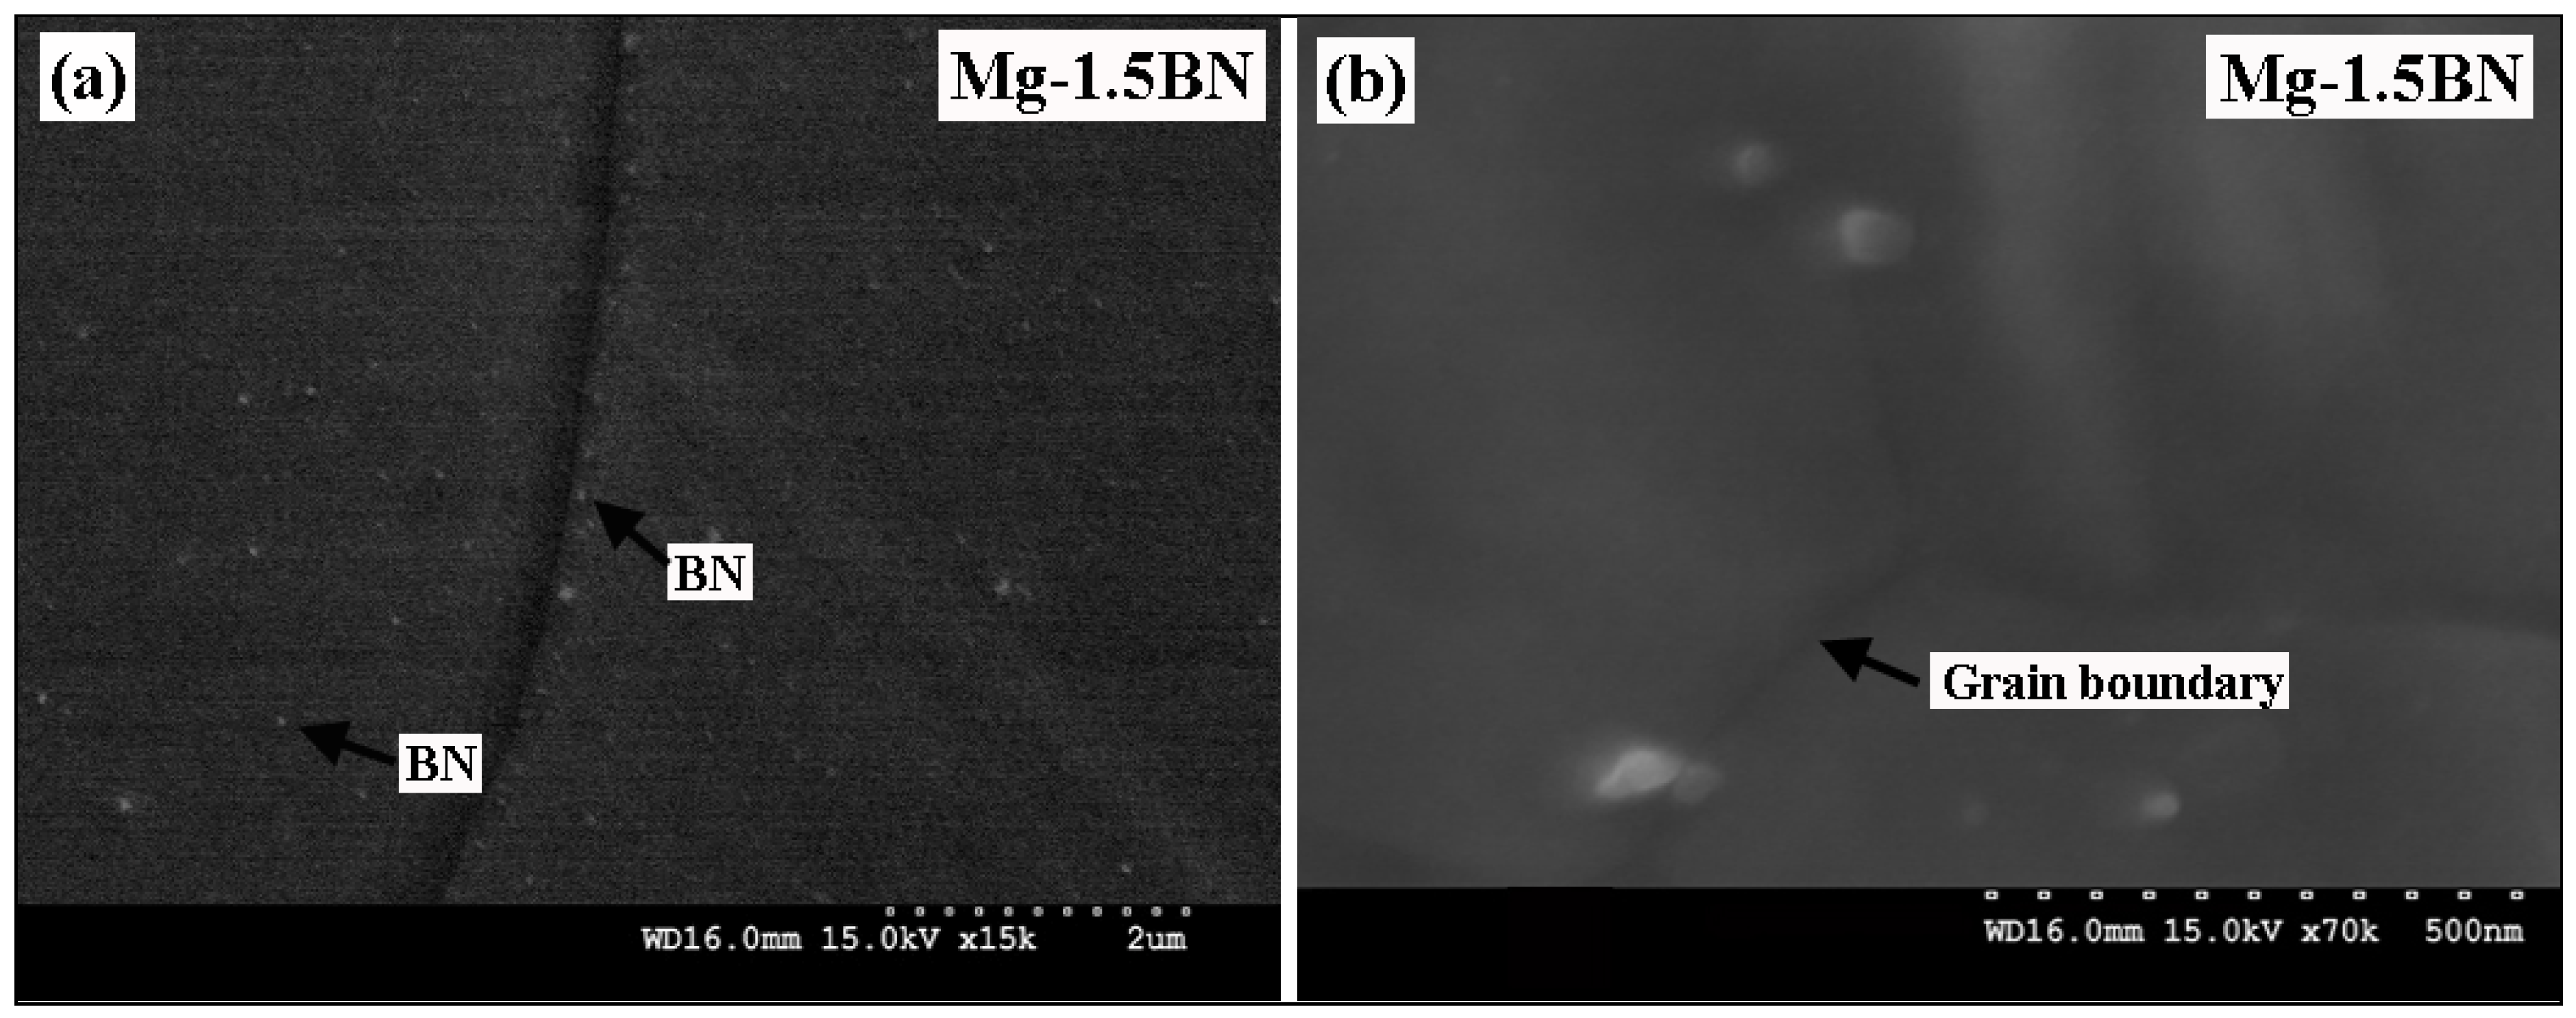
The results of microstructural characterization studies conducted on the different Mg/BN composite formulations indicate a fairly uniform distribution of nano-BN particulates inside the Mg matrix, as well as near to the grain boundaries, as seen in
Figure 2a. The observed uniform distribution of nano-BN particulates in the Mg matrix, as seen
Figure 2, could be attributed to the following reasons: (i) closer density values between the Mg matrix (1.7 g/cc) and BN reinforcements (2.98 g/cc), resulting in lesser gravity assisted segregation problems during the blending, compaction and sintering process; (ii) suitable blending parameters used; and (iii) the efficient extrusion process capable of breaking down the agglomerates (if present) [
8,
17,
18]. Literature study reveals that such homogeneous distribution of reinforcements can be achieved in the case of extruded materials with large deformation strain (Extrusion ratio–22.5:1), regardless of the size difference between the matrix and reinforcements [
17,
18].
Figure 2.
Representative SEM micrographs showing (a) the distribution of nano-boron nitride (BN) particulates; and (b) the interface between Mg-matrix and the nano-BN particulates in Mg-1.5BN composite.
Figure 2.
Representative SEM micrographs showing (a) the distribution of nano-boron nitride (BN) particulates; and (b) the interface between Mg-matrix and the nano-BN particulates in Mg-1.5BN composite.
Microstructural characterization further revealed good interfacial integrity between Mg-matrix and nano-BN reinforcement (
Figure 2b) assessed in terms of interfacial debonding at the particulate-matrix interface. During processing, the oxidation of BN particulates cannot be completely ruled out, as the billet temperature reaches the near melting temperature of Mg and the formation enthalpy of B
2O
3 (−1262 kJ/mol) is more negative than MgO (−600 kJ/mol) [
19]. The B
2O
3 phase (if present) will exist in the liquid state because of its low melting point (~500 °C). Further, the reaction of B
2O
3 with molten Mg could result in the formation of intermetallic phases, such as MgO and MgB
2O
5 [
19,
20]. The good interfacial integrity (absence of debonding and voids) at the particulate-matrix interface observed in the present case (
Figure 2b) could attribute to the possible presence of oxide layer at the particle-matrix interface [
21,
22]. Such a good particle-matrix interface with coherent interfacial reaction products is expected to improve the strength of composite by interfacial strengthening [
22]. However, the degree of interface strengthening will be greatly affected by the inherent properties of interfacial reaction products and the distribution of second phases in the matrix.
2.4. Coefficient of Thermal Expansion
The thermal expansion coefficients of monolithic Mg and Mg/BN composites measured in the temperature range 50 °C to 400 °C are presented in
Table 3. It indicates an improvement in dimensional stability (reduction in the coefficient of thermal expansion (CTE) values) through the addition of nanoscale BN particulates. The experimental CTE values were then compared to that of the theoretical values calculated based on the rule of mixtures Equation (1) and the turner model Equation (2).
where α, V and K represent the coefficient of thermal expansion, volume fraction and bulk modulus of the phase; while the subscripts, m and r, refer to matrix and reinforcement, respectively [
23]. Using the values of α
m ~ 28.4 × 10
−6/C, K
m ~ 35.6 GPa, α
r ~ 1.2 × 10
−6/C and Kr ~ 145 GPa, the coefficient of thermal expansion of the composites were computed [
24]. The comparison, as shown in
Table 3, indicates that the experimental values were lower than both the theoretical values, as in these models, the effects of particle size on the thermal expansion coefficient has not been considered. Xu
et al. [
25] has studied the effects of varying the particle sizes and has reported that the degree of constraints posed by the particles on the matrix varies with respect to the particles sizes and, hence, affects the coefficient of thermal expansion.
Table 3.
Results of coefficient of thermal expansion (CTE) measurements. ROM, rule of mixtures.
Table 3.
Results of coefficient of thermal expansion (CTE) measurements. ROM, rule of mixtures.
| S. No. | Material | Thermal expansion coefficient (CTE) (× 10−6/K) |
|---|
| Theoretical | Experimental |
|---|
| ROM | Turner model |
|---|
| 1 | Pure Mg | 28.40 | 28.40 | 28.52 |
| 2 | Mg-0.5BN | 28.32 | 28.08 | 27.19 |
| 3 | Mg-1.5BN | 28.17 | 27.47 | 26.82 |
| 4 | Mg-2.5BN | 28.01 | 26.87 | 24.63 |
2.5. X-ray Diffraction Studies
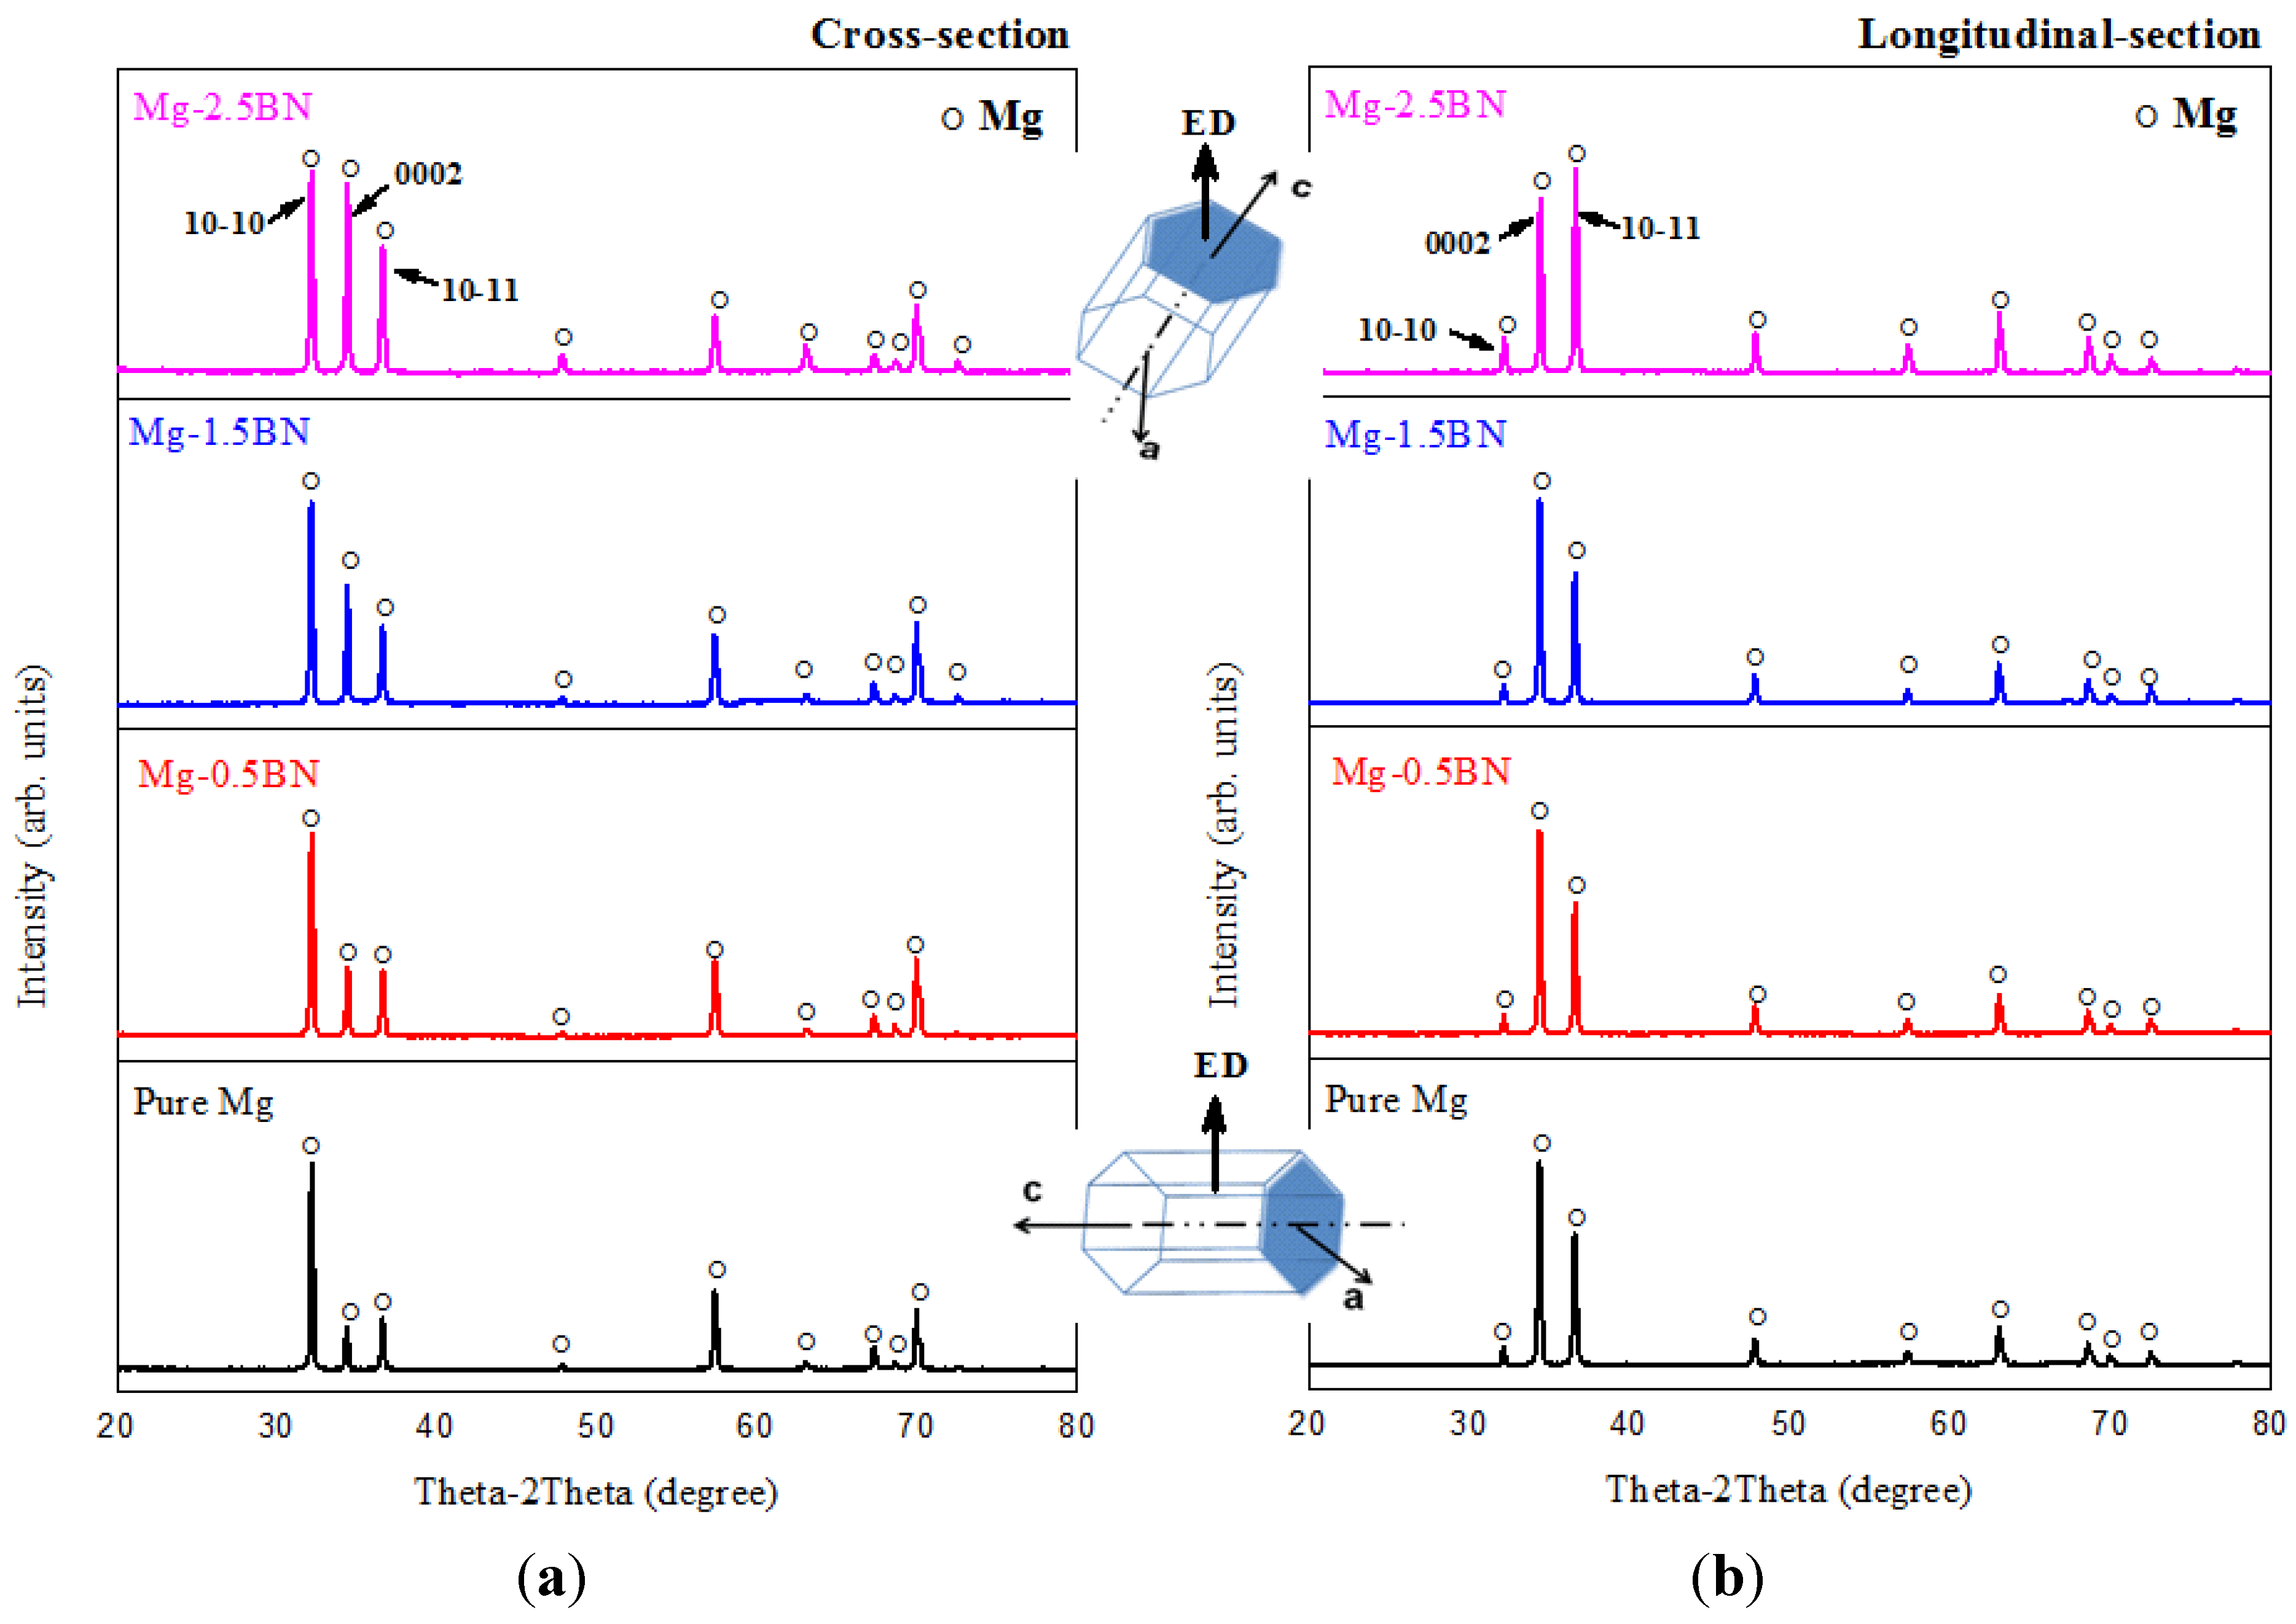
The results of X-ray diffraction studies conducted along the cross section and longitudinal sections of developed Mg/BN nanocomposites are shown in
Figure 3. The high intensity peaks corresponding to Mg were prominently seen, and the peaks corresponding to the BN reinforcement particulates and other related peaks were not prominent. This could be due to their relatively low volume fraction (<2.5 vol.%) in the Mg matrix, which would remain undetected by the technique of XRD [
12]. However, the presence of these reinforcements can be confirmed from the microstructural investigation, in
Figure 2.
The results of X-ray analysis were used to interpret the effect of nano-BN addition on the crystallographic orientation (specifically, the basal plane orientation) of Mg-matrix, as it is known, that the reinforcing phases could contribute to the change in basal orientation (texture) of the Mg-crystal [
26]. The peaks observed at 2θ = 32°, 34° and 36° diffraction pattern of developed as-extruded Mg materials correspond to the (1 0−1 0) prism, (0 0 0 2) basal and (1 0−1 1) pyramidal planes of HCP Mg-crystal [
27]. Along the cross-section, the prismatic plane intensity (2θ = 32°) is maximum in all the cases, which indicates that any of the prismatic planes is aligned in a direction, which is perpendicular to the extrusion direction. Also, the basal plane intensity (2θ = 34°) is found increasing with respect to the nano-BN addition, and in the case of Mg-2.5BN, the basal plane intensity is equally dominant, similar to the prismatic plane. Similarly, along the longitudinal section, the intensity of basal plane is found to be maximum in the case of pure Mg and the composites with a lower BN volume fraction (
i.e., < 2.5 wt.%). This shows that most of the basal planes are aligned parallel to the extrusion direction, indicating a strong basal texture, which is commonly observed in the wrought Mg materials [
27]. However, in case of Mg-2.5BN, a change in the intensity of the peaks is clearly observed along the longitudinal section in which the intensity of the pyramidal plane (2θ = 36°) is found to be maximum. This indicates that the basal planes remain tilted and are not parallel to the extrusion direction, suggesting randomization of the extrusion texture [
27]. Similar texture randomization is reported by Garces
et al. [
28] and Wang
et al. [
29], wherein it was shown that the presence of micron-sized ceramic particulates contribute to texture weakening, as seen by the reduction in the intensity of basal texture in the X-ray pole figure. Similarly, the presence of nano-BN particle reinforcements appeared to have the ability to reduce the basal intensity in the current study.
Figure 3.
Results of X-ray characterization studies conducted along the (a) cross section; and (b) longitudinal sections on the extruded rods of developed Mg based materials.
Figure 3.
Results of X-ray characterization studies conducted along the (a) cross section; and (b) longitudinal sections on the extruded rods of developed Mg based materials.
2.6. Mechanical Behavior
The microhardness (H
v) values of pure Mg and its composites reinforced with nano-BN particulates are listed in
Table 4. It indicates that the nanoscale addition of BN to Mg resulted in the improvement in microhardness values. The increase in microhardness values could be primarily attributed to the relatively uniform distribution of nanoscale BN particulates and its higher constraint to the localized matrix deformation during indentation [
2,
3]. The microhardness values of Mg/BN composites were found to be proportional to the reinforcement volume fraction and observed to be consistent with dispersion strengthened metallic materials reported in the literature [
8].
The results of a room temperature tensile test conducted on the developed Mg/BN composites are listed in
Table 5. From the results, significant improvement in ultimate tensile strength was observed when compared to Mg. However, considering the standard deviation, the 0.2% yield strength values were found to be similar between the monolithic Mg and its composites. In similar studies wherein the nanoscale reinforcement addition resulted in superior strength properties, the yield strength improvement is attributed to the Hall-Petch grain boundary strengthening effect offered by the increased grain boundary area by grain refinement and the presence of uniformly distributed dispersed phases, which impedes the dislocations movement [
3,
8,
12]. While the uniform distribution of nanoscale BN reinforcements in the current study is expected to significantly improve the yield strength by effectively obstructing the dislocation movement, the minimal grain refinement would contribute less towards the grain boundary strengthening.
Table 4.
Results of microhardness measurements.
Table 4.
Results of microhardness measurements.
| S. NO. | Material | Microhardness Hv |
|---|
| 1 | Pure Mg | 48 ± 1 |
| 2 | Mg-0.5BN | 51 ± 3 |
| 3 | Mg-1.5BN | 55 ± 3 |
| 4 | Mg-2.5BN | 57 ± 2 |
Table 5.
Results of room temperature tensile test.
Table 5.
Results of room temperature tensile test.
| S. No. | Material | 0.2 YS [MPa] | UTS [MPa] | Fracture Strain [%] |
|---|
| 1 | Pure Mg | 136 ± 8 | 170 ± 7 | 6.1 ± 1.2 |
| 2 | Mg-0.5BN | 127 ± 6 | 192 ± 8 | 7.8 ± 0.9 |
| 3 | Mg-1.5BN | 142 ± 4 | 200 ± 5 | 8.6 ± 0.5 |
| 4 | Mg-2.5BN | 145 ± 3 | 217 ± 5 | 7.2 ± 0.8 |
Further, the literature study reveals the effect of crystallographic texture modification on the yield strength properties of magnesium materials [
4,
7,
28,
29,
30,
31,
32]. In the present study, the basal texture of composite samples was observed to be weak when compared to pure Mg,
i.e., the minimal basal planes intensity seen on XRD results (
Figure 3) along the longitudinal sections of composite samples compared to pure Mg. In composites/nanocomposites, the addition of reinforcements usually improves the yield strength [
8]. In the present case, an increase in yield strength is expected because of BN addition. However, due to the observed change in Mg-crystal orientation, the increase in yield strength is not significant. This is due to the fact that the texture weakening usually would result in the activation of basal slip at relatively lower stress levels. Such competing factors result in the yield strength values of composites being similar to pure Mg (
Table 5) [
31,
32]. However, the presence of nano-BN particles in Mg-matrix was useful in improving the ultimate tensile strength in composites by the dispersion strengthening effect attributing to the modulus mismatch and the thermal residual stress due to the mismatch in thermal expansion coefficients between the matrix and reinforcing phases [
2,
3,
8].
In general, extruded magnesium materials exhibit poor tensile ductility, which is attributed to the strong basal fiber texture of Mg, wherein the basal planes are aligned preferentially parallel to the extrusion direction [
27]. In similar studies, the enhancement in tensile ductility was achieved by the combination of (i) grain refinement; (ii) possible activation of non-basal slip systems by the uniform distribution of nanoscale reinforcements; and (iii) texture modification [
2,
3,
8,
11,
12]. In the current study, the uniform distribution of nano-BN particles in magnesium matrix as evident from the microstructural characterization (
Figure 2b) would result in the activation of non-basal and cross-slip and, thereby, increase the failure strain in the developed Mg-composites [
8,
12,
33,
34,
35]. Another important factor, which can be considered for the ductility improvement, is the change in crystallographic texture observed from the XRD pattern (
Figure 3). It shows that most of the basal planes in the composites were titled at an angle, which is neither parallel nor perpendicular to the extrusion direction. The basal slip can be easily activated in such a case due to the slight misalignment of the basal plane as the critical resolved shear stress is very low for the basal slip to activate [
12,
34,
35].
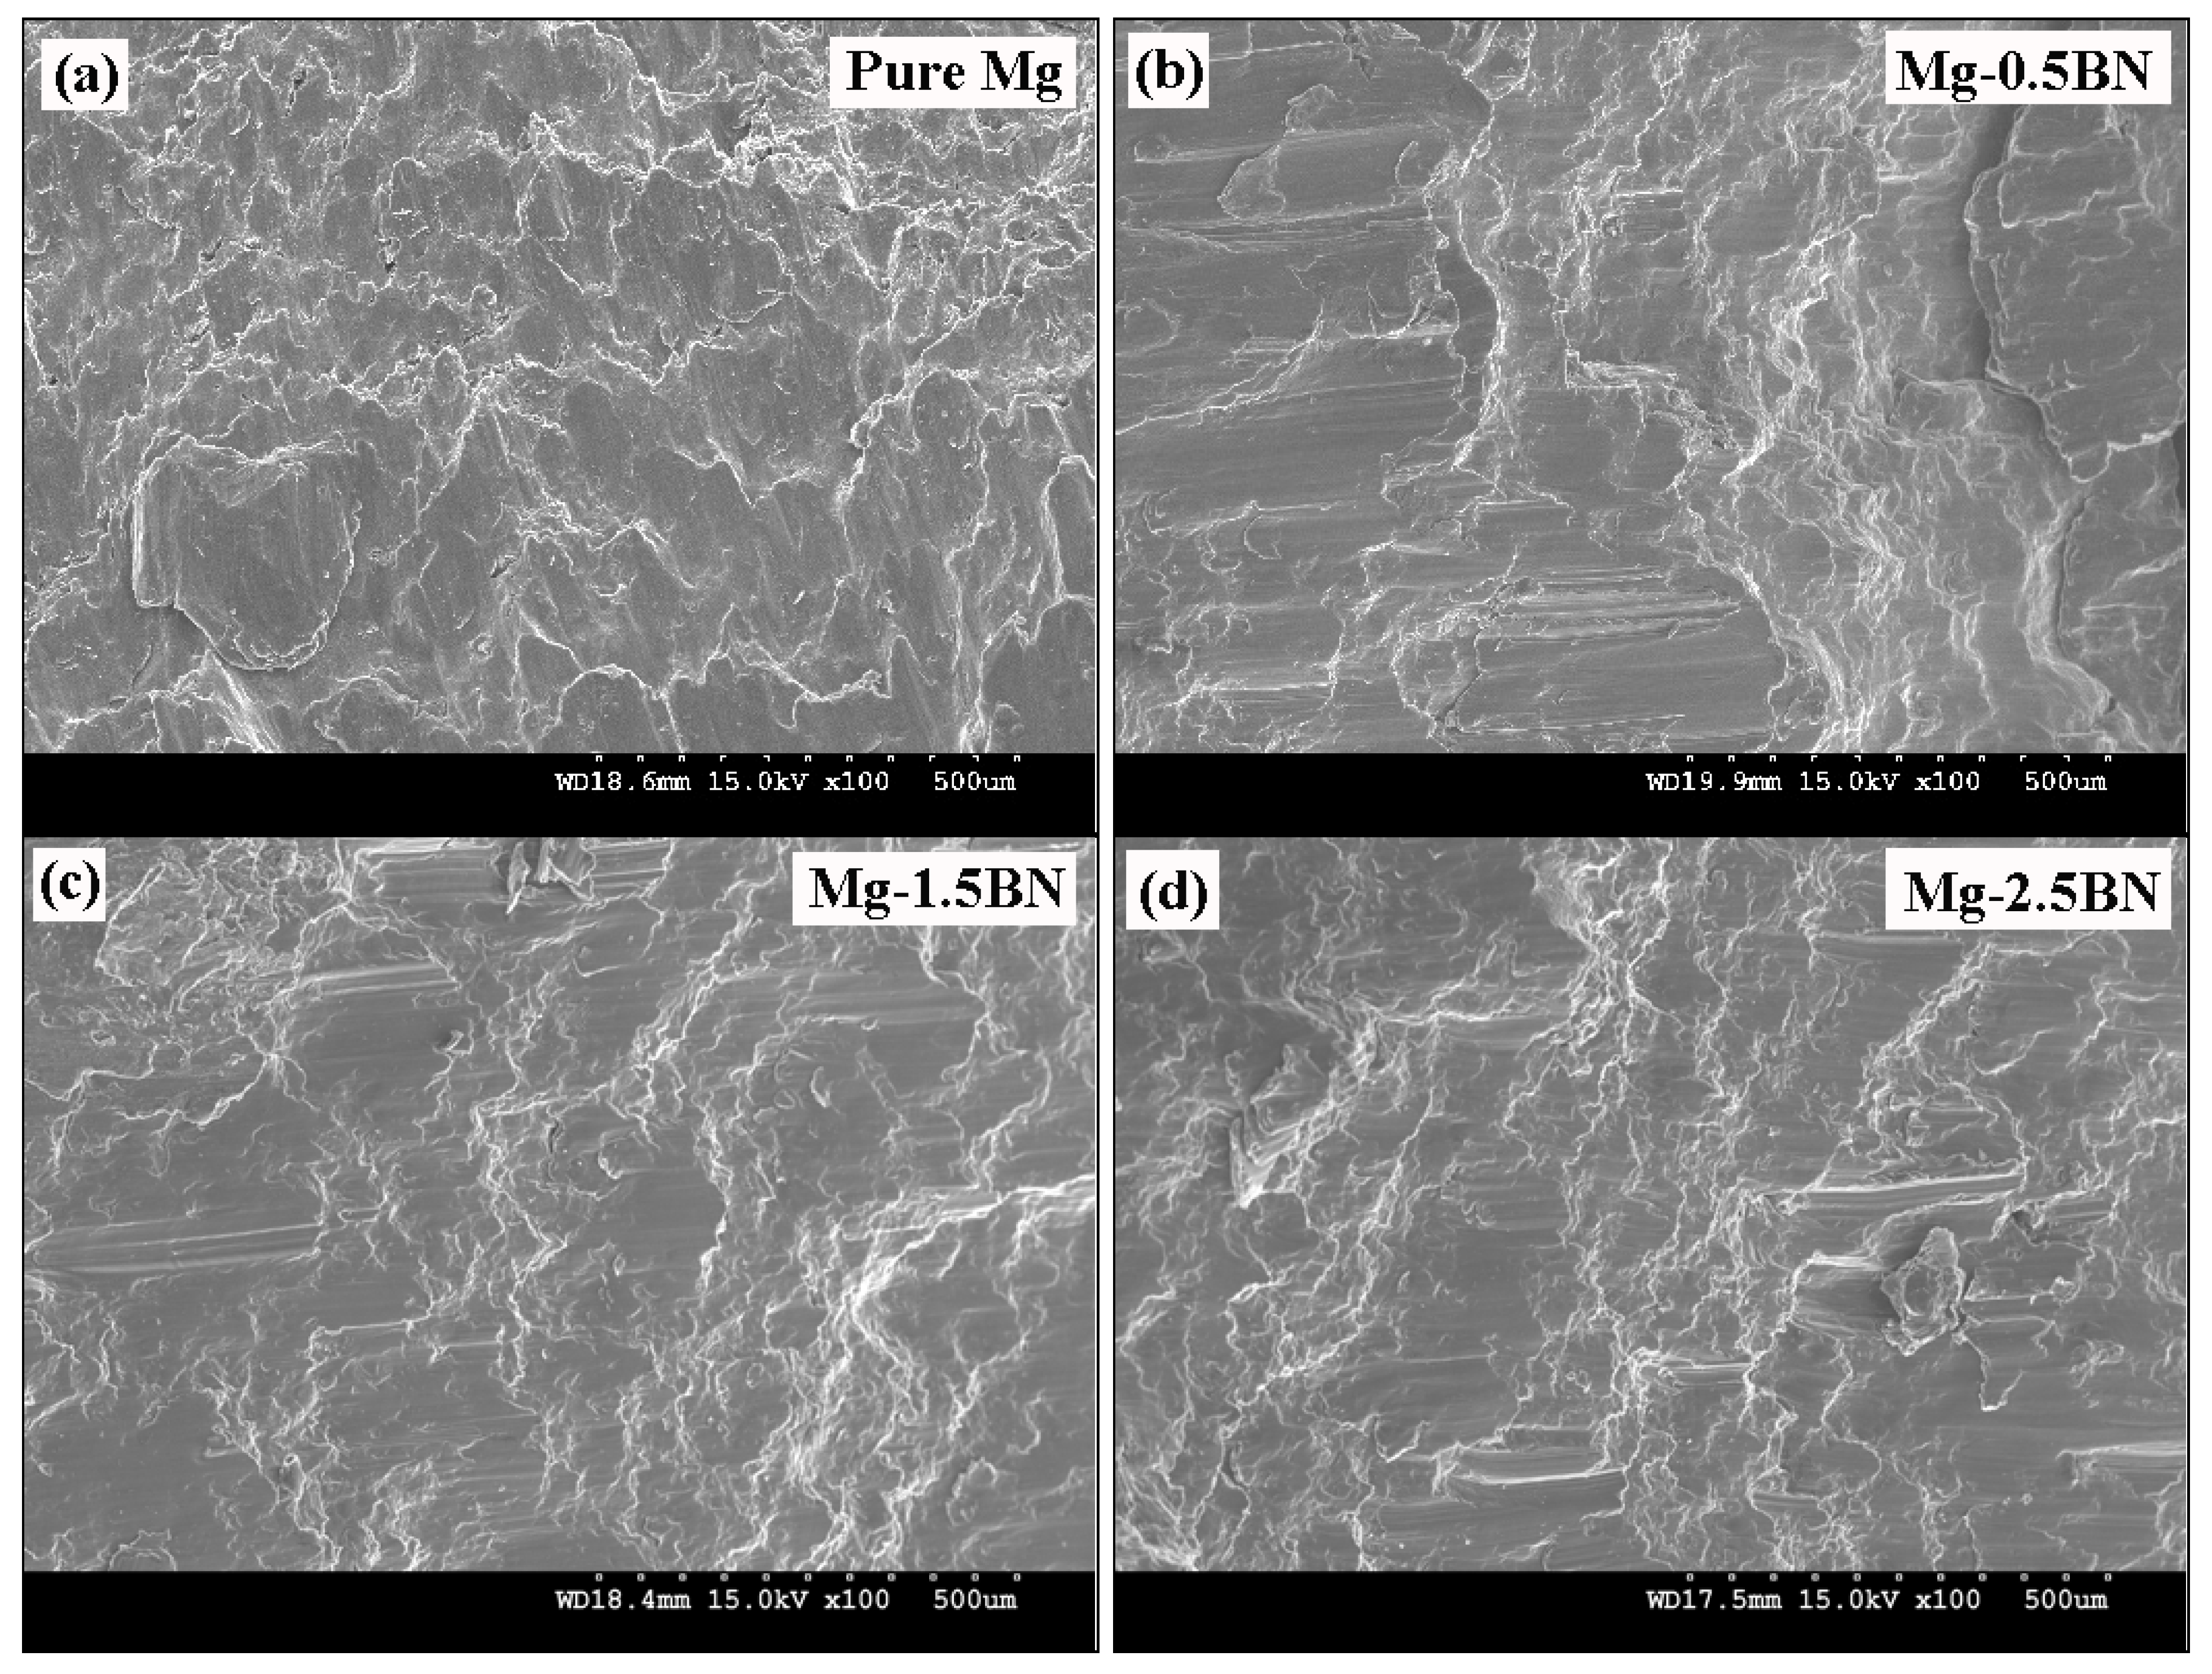
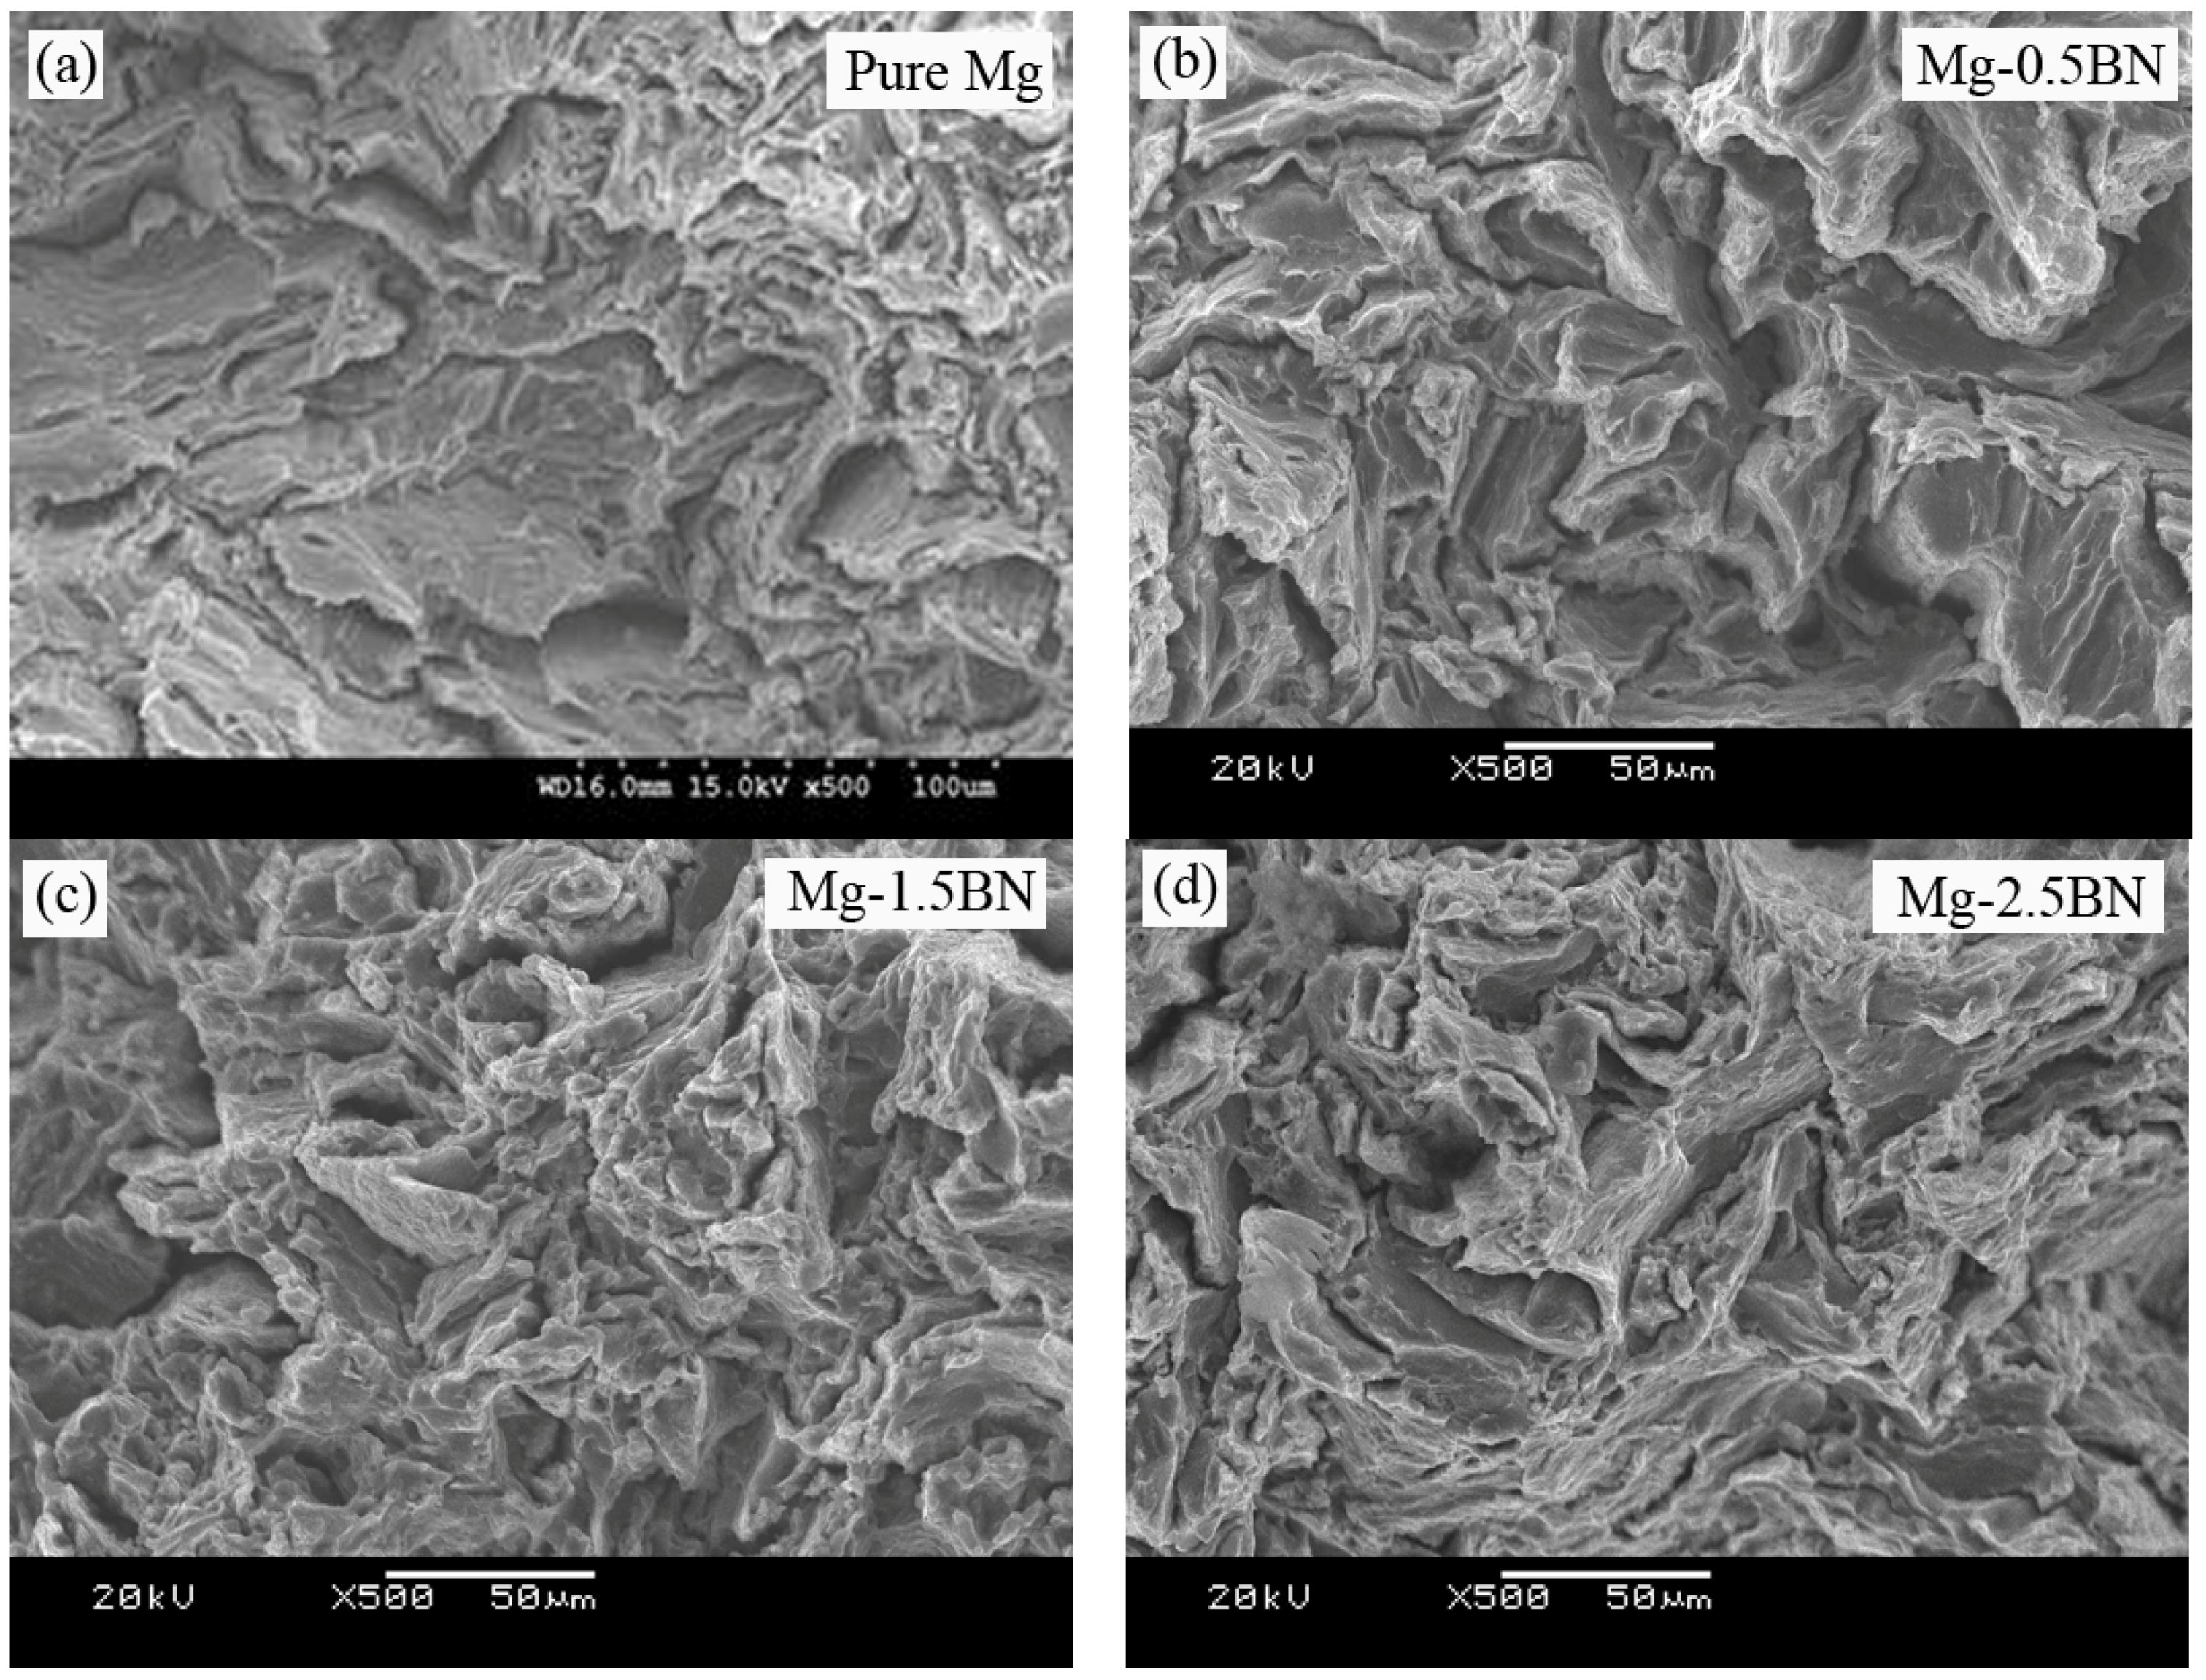
The fractographic evidence of the developed Mg materials under tensile loading showing the fracture mechanism is shown in
Figure 4. It reveals similar fracture features, indicating the cleavage mode of fracture in pure Mg and its composites under tensile loading. From the similar fracture features observed in the fractographs, it could be understood that the fracture behavior of developed Mg/BN composites was largely controlled by the matrix deformation characteristics. However, a high magnification image (
Figure 4e) shows relatively increased slip activity in Mg-2.5BN. Usually, owing to the HCP crystal structure, the plastic deformation in magnesium is limited, due to the lack of sufficient slip activity, and the cleavage steps seen in the tensile fractographs (
Figure 4) are the indications of the inability of uniform deformation in Mg [
5,
8].
Figure 4.
Tensile fracture surfaces of (a) pure Mg; (b) Mg-0.5BN; (c) Mg-1.5BN; and (d) Mg-2.5BN composites; (e) a high magnification image showing increased slip activity in Mg-2.5BN.
Figure 4.
Tensile fracture surfaces of (a) pure Mg; (b) Mg-0.5BN; (c) Mg-1.5BN; and (d) Mg-2.5BN composites; (e) a high magnification image showing increased slip activity in Mg-2.5BN.
The room temperature compressive properties of developed Mg-nanocomposites are listed in
Table 6. Unlike under tensile loading, where the improvement in ultimate tensile strengths due to nano-BN addition occurred with similar yield strengths (
Table 5), the improvement in compressive strength properties were accompanied by a significant improvement in compressive yield strength (
Table 6). In the case of extruded Mg materials with strong basal texture (with basal planes parallel to the extrusion direction), higher yield strength under tensile loading and lower yield strength under compressive is commonly observed [
28,
29]. This is attributed to the difference in deformation mode and the initial crystallographic orientation.
Table 6.
Results of room temperature compression test.
Table 6.
Results of room temperature compression test.
| S. No. | Material | 0.2 CYS (Mpa) | UCS (Mpa) | Fracture Strain (%) |
|---|
| 1 | Pure Mg | 70 ± 2 | 250 ± 7 | 24.5 ± 2.7 |
| 2 | Mg-0.5BN | 88 ± 6 | 290 ± 9 | 20.9 ± 1.8 |
| 3 | Mg-1.5BN | 108 ± 2 | 312 ± 8 | 19.9 ± 1.2 |
| 4 | Mg-2.5BN | 115 ± 4 | 319 ± 4 | 19.7 ± 1.4 |
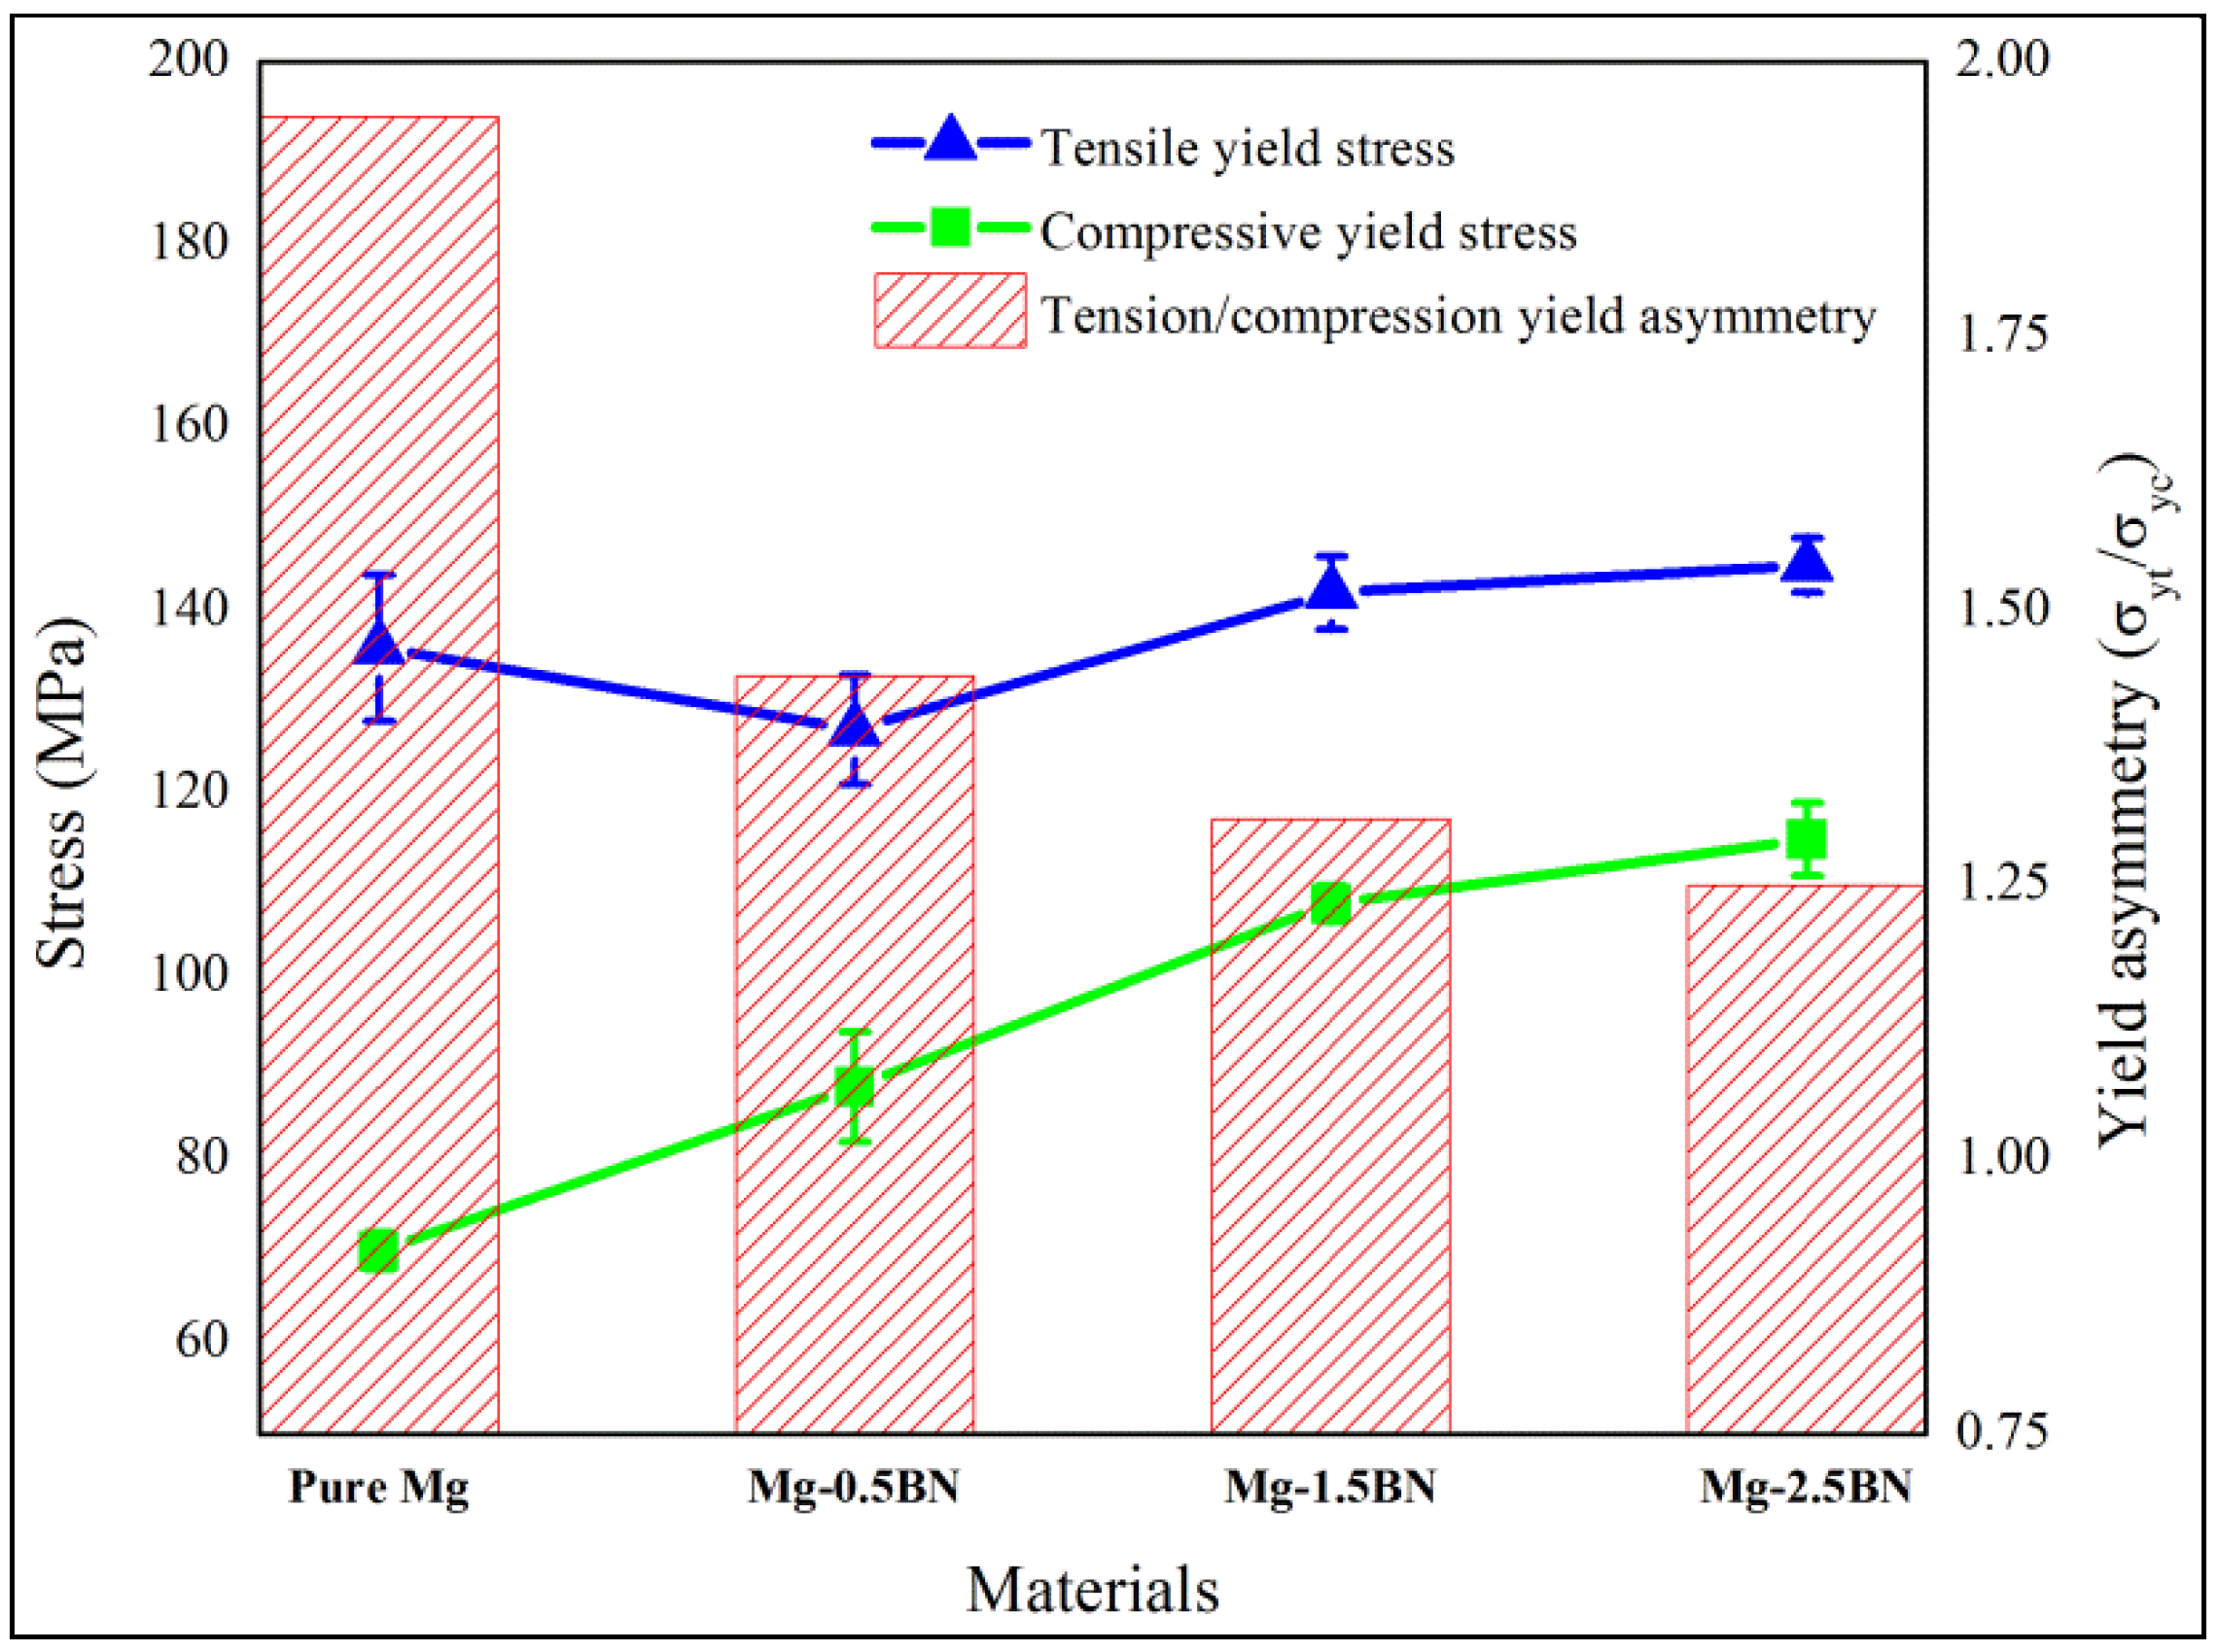
A comparison of yield strength under tension and compression is shown in
Figure 5; in which the tension/compression yield asymmetric ratio is also provided. It indicates a minimal difference in yield asymmetry (
) for Mg/2.5BN composite in which the c-axis is misaligned in comparison to pure Mg, where the c-axis is parallel to the loading/extrusion axis (basal planes oriented perpendicular to the extrusion direction). The higher tensile yield strength under tensile loading often results from the difficulty in basal slip activation and the inability of twinning [
7,
28,
29] in the case of strong fiber texture, as seen in pure Mg. Further; the formation and propagation of tensile twins were favored at relatively lower strength levels, which results in higher fracture strain, while the presence of dispersed phases in the case of composites obstructs the twin nucleation and propagation. Hence; the restricted twinning process in the case of composites delays the yield process, which contributes to the higher strength properties and the poor failure strain. The fracture surface analysis of monolithic Mg and its composites under compressive loading conditions reveals the presence of shear bands as shown in
Figure 6. The presence of such shear bands indicates the twinning mode of plastic deformation, which is common in Mg alloys and composites [
4,
36].
Figure 5.
Comparison of tensile and compressive yield strengths in pure Mg and its Mg/BN composites.
Figure 5.
Comparison of tensile and compressive yield strengths in pure Mg and its Mg/BN composites.
Figure 6.
Representative compressive fracture surfaces showing shear bands in (a) pure Mg; (b) Mg-0.5BN; (c) Mg-1.5BN; and (d) Mg-2.5BN composites.
Figure 6.
Representative compressive fracture surfaces showing shear bands in (a) pure Mg; (b) Mg-0.5BN; (c) Mg-1.5BN; and (d) Mg-2.5BN composites.


 and
and 
