1. Introduction
The fast growing number of applications of engineered nanoparticles in drug delivery systems, medical devices, food products, consumer products and the subsequent disposal of engineered nanoparticles in the environment implies that human exposure to engineered nanoparticles is expected to increase greatly. The specific physico-chemical properties at the nanoscale are expected also to result in increased reactivity with biological systems. So, in addition to their beneficial effects, engineered nanoparticles of different types may represent a potential hazard to human health.
Kinetic properties are considered to be an important descriptor for potential human toxicity and thus for human health risk. It is important to know the amount of the total external exposure that will be absorbed by the body and result in an internal exposure. In addition, the distribution of absorbed nanoparticles in the body over the various organ systems and within the organs needs to be determined. We previously performed a kinetic study to determine the influence of particle size on the
in vivo tissue distribution of spherical-shaped gold nanoparticles in the rat [
1]. Gold nanoparticles were chosen as model substances as they are used in several medical applications. In addition, the detection of the presence of gold is feasible, with no background levels in the body in the normal situation. Rats were intravenously injected in the tail vein with gold nanoparticles with a diameter of 10, 50, 100 or 250 nm. After 24 h, the rats were sacrificed and blood and various organs were collected for gold determination. The presence of gold was measured quantitatively with inductively coupled plasma mass spectrometry (ICP-MS).
For all gold nanoparticle sizes the majority of the gold was demonstrated to be present in blood, liver and spleen after 24 h [
1]. A clear difference was observed between the distribution of the 10 nm particles and the larger particles. The 10 nm particles were present in various organ systems including blood, liver, spleen, kidney, testis, thymus, heart, lung and brain, whereas the larger particles were only detected in the blood, liver and spleen. The results demonstrate that tissue distribution of gold nanoparticles is size-dependent, with the smallest (10 nm) nanoparticles showing the most widespread organ distribution.
For the determination of the gold distribution, the presence of gold was determined by ICP-MS. This gives reliable information on the distribution of the material in the various organ systems, assuming that gold is not naturally present in these organs. However, there is no information on the presence of gold in the form of the actual nanoparticles or their exact location in the organs. One of the methods to identify the actual presence of metal nanoparticles is by transmission electron microscopy (TEM). With this method, local accumulation in cells and the localization of the nanoparticles in cellular organelles can also be investigated. For interpretation of possible toxic effects of nanoparticles, it is important to identify in what type of cells nanoparticles are present, and what the cellular localization of the nanoparticles is. This short communication describes the results of the evaluation of tissue samples with transmission electron microscopy (TEM) for the presence of gold nanoparticles after intravenous administration in rats.
3. Discussion and Conclusions
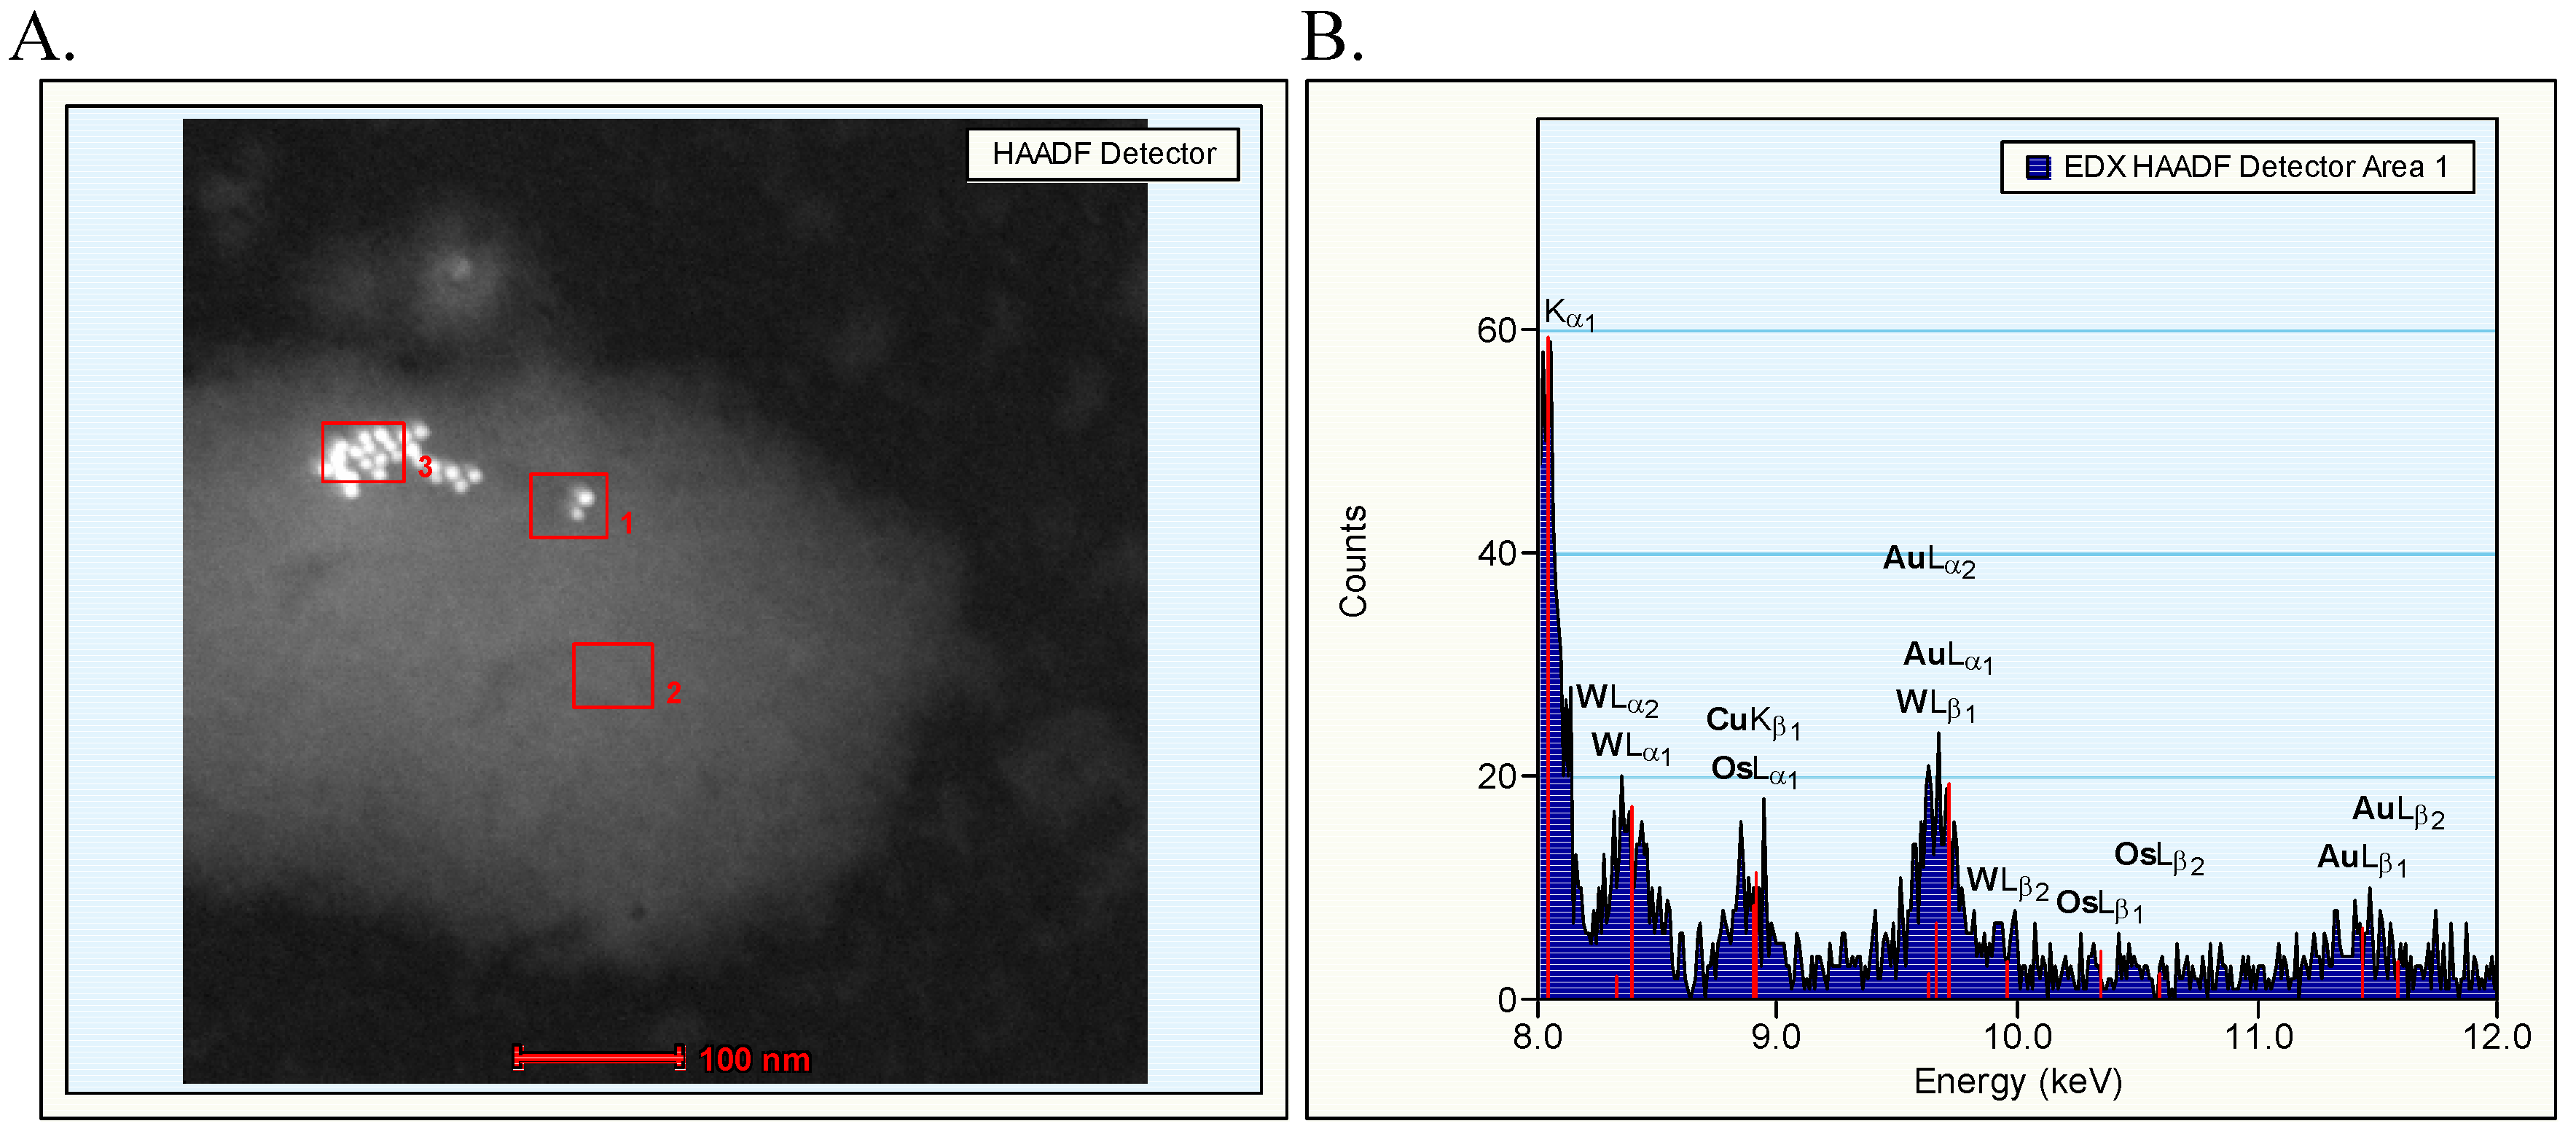
The TEM evaluation of the dispersion of gold nanoparticles that were administered revealed the presence of clusters of nanoparticles mainly in the dispersion of 10 nm gold nanoparticles. The arrangement of the nanoparticles in the dispersion indicated that the clusters were most likely agglomerates with weak binding forces. The identity of the gold nanoparticles could be confirmed by EDX evaluation. After intravenous administration, the gold nanoparticles may be covered with various proteins as present in blood such as serum albumin and apolipoproteins as demonstrated for polymeric nanoparticles [
2]. These proteins on the nanoparticles may facilitate cellular uptake. In contrast, coating of nanomaterials with poly ethylene glycol (PEG) was demonstrated to limit cellular uptake and prolong the circulation time by inhibiting the interaction with proteins [
3,
4,
5,
6].
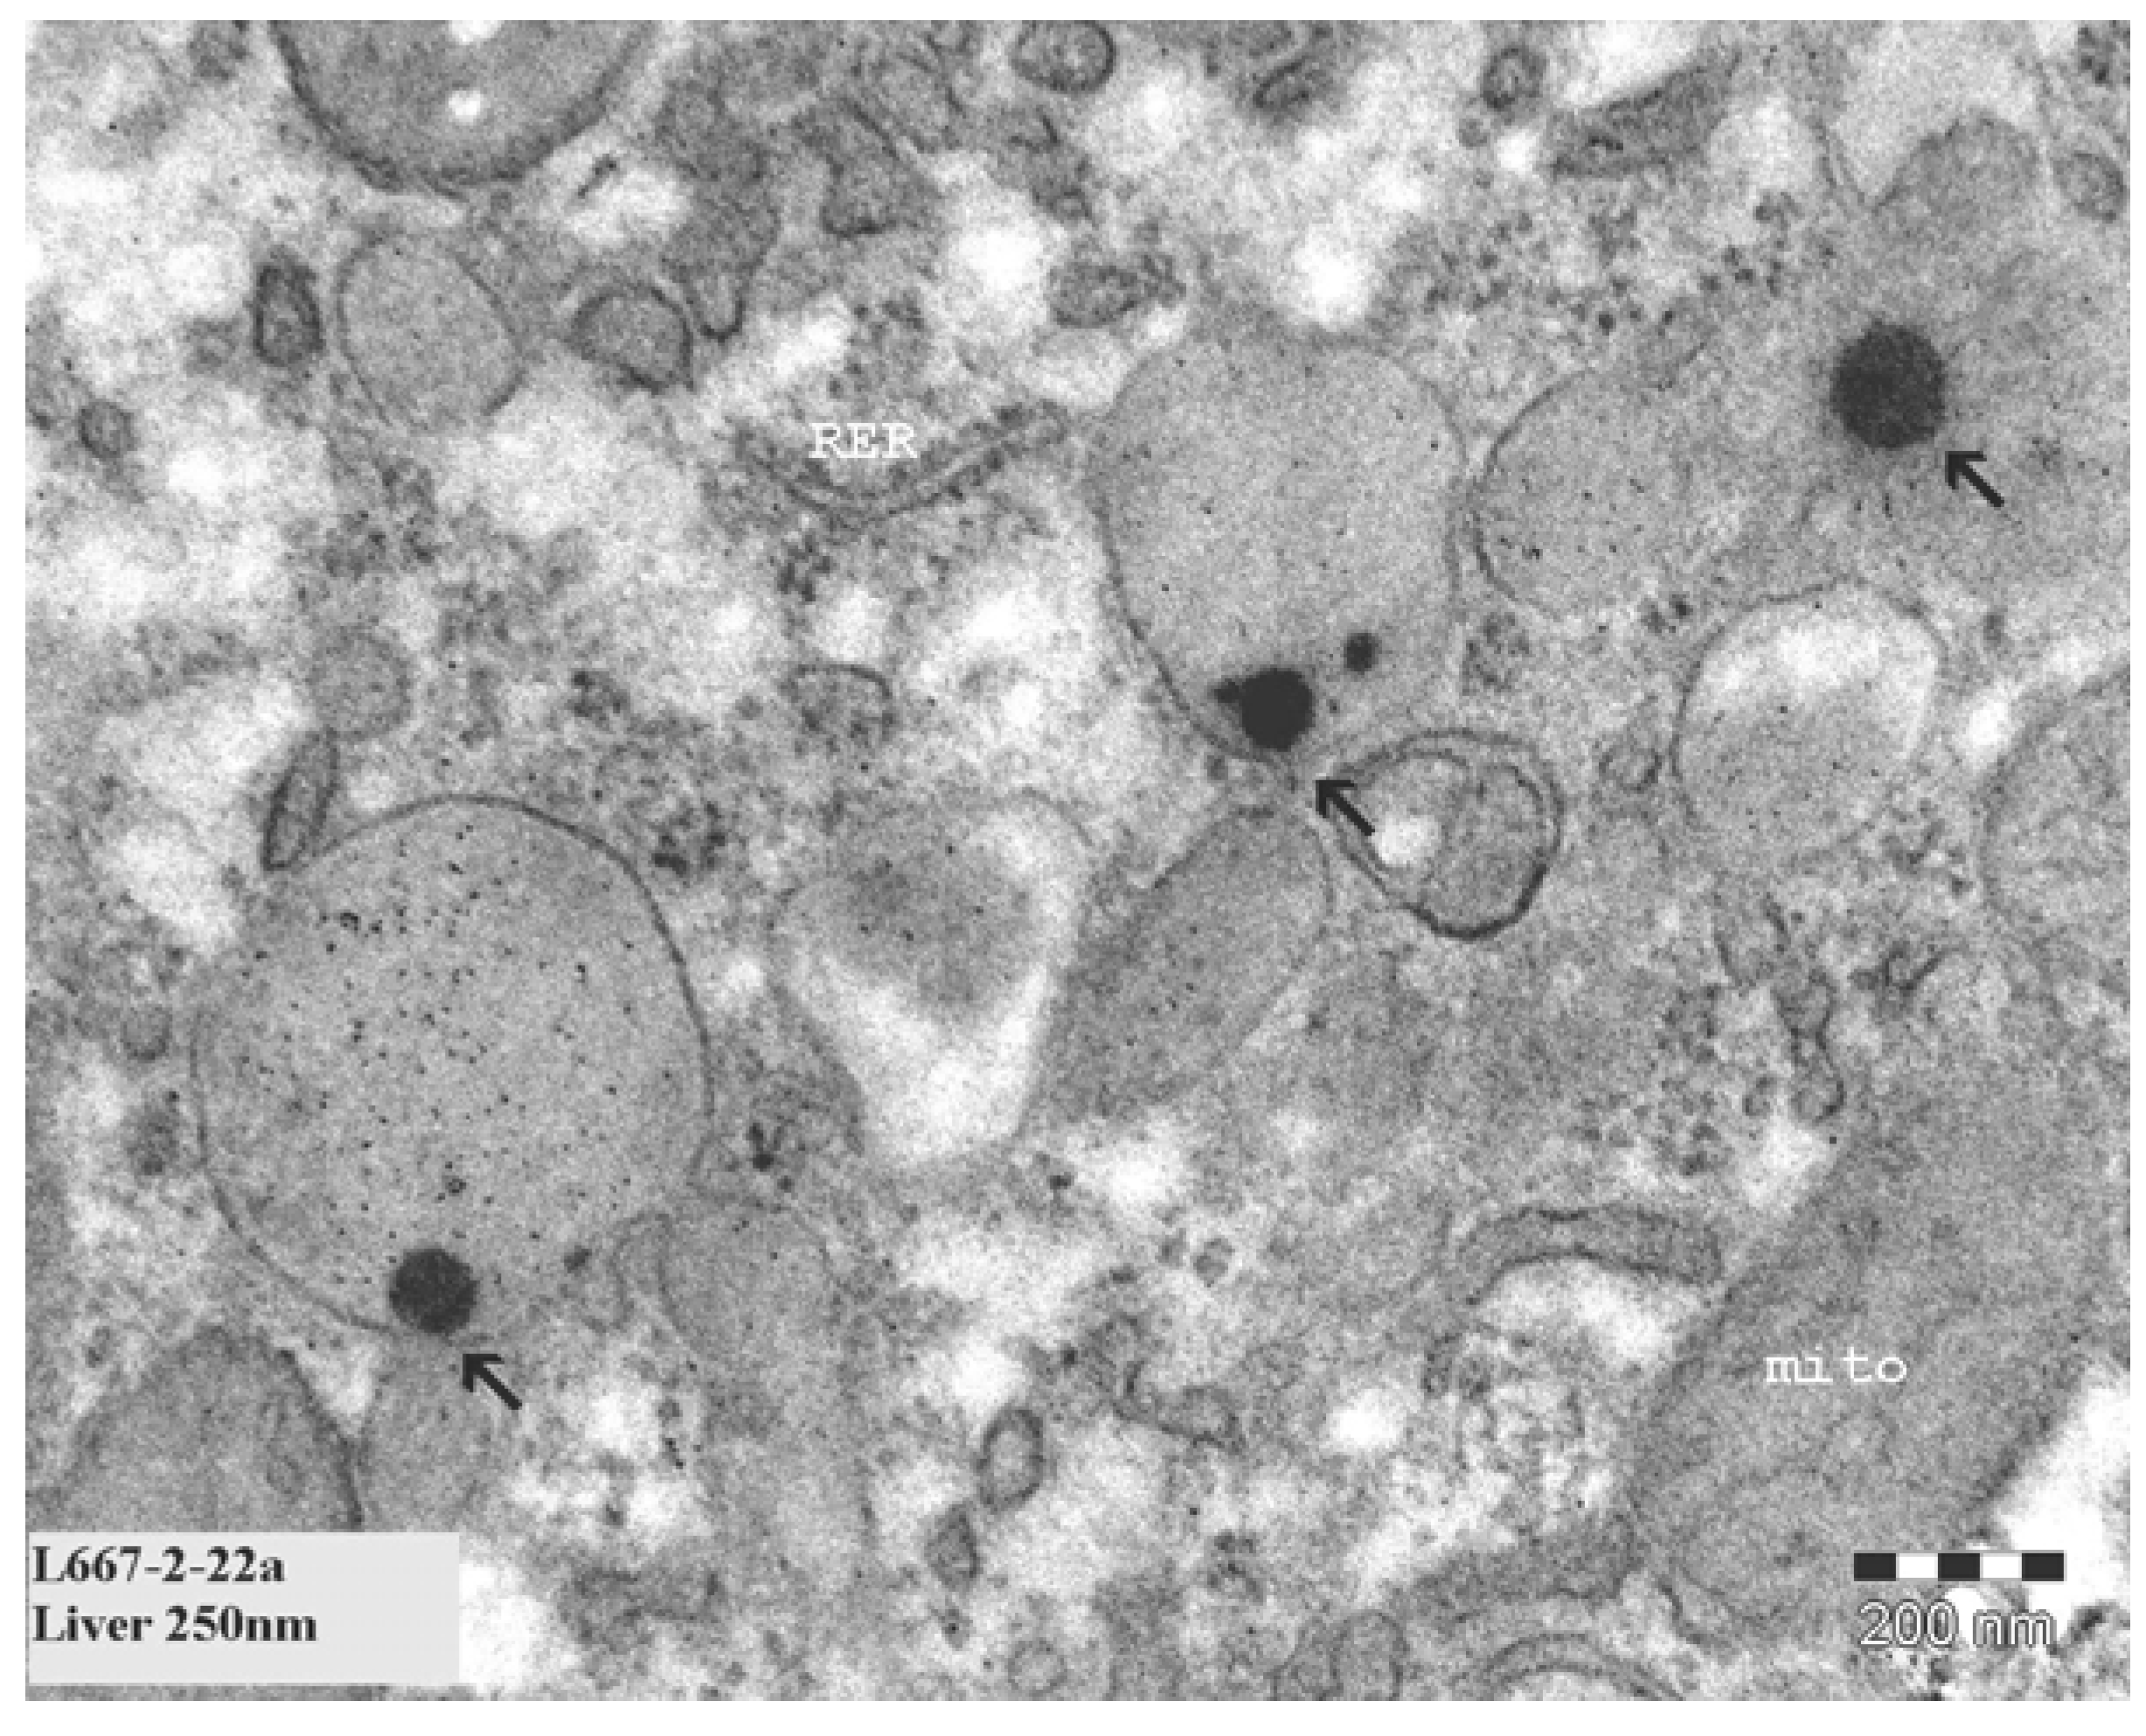
In our initial studies we observed 8–10 nm diameter structures in hepatocytes of the liver. These structures could not be identified by EDX spectrum analysis to contain gold. So, it was concluded that these structures were not the gold nanoparticles injected in the animals. We did not try to identify these structures.
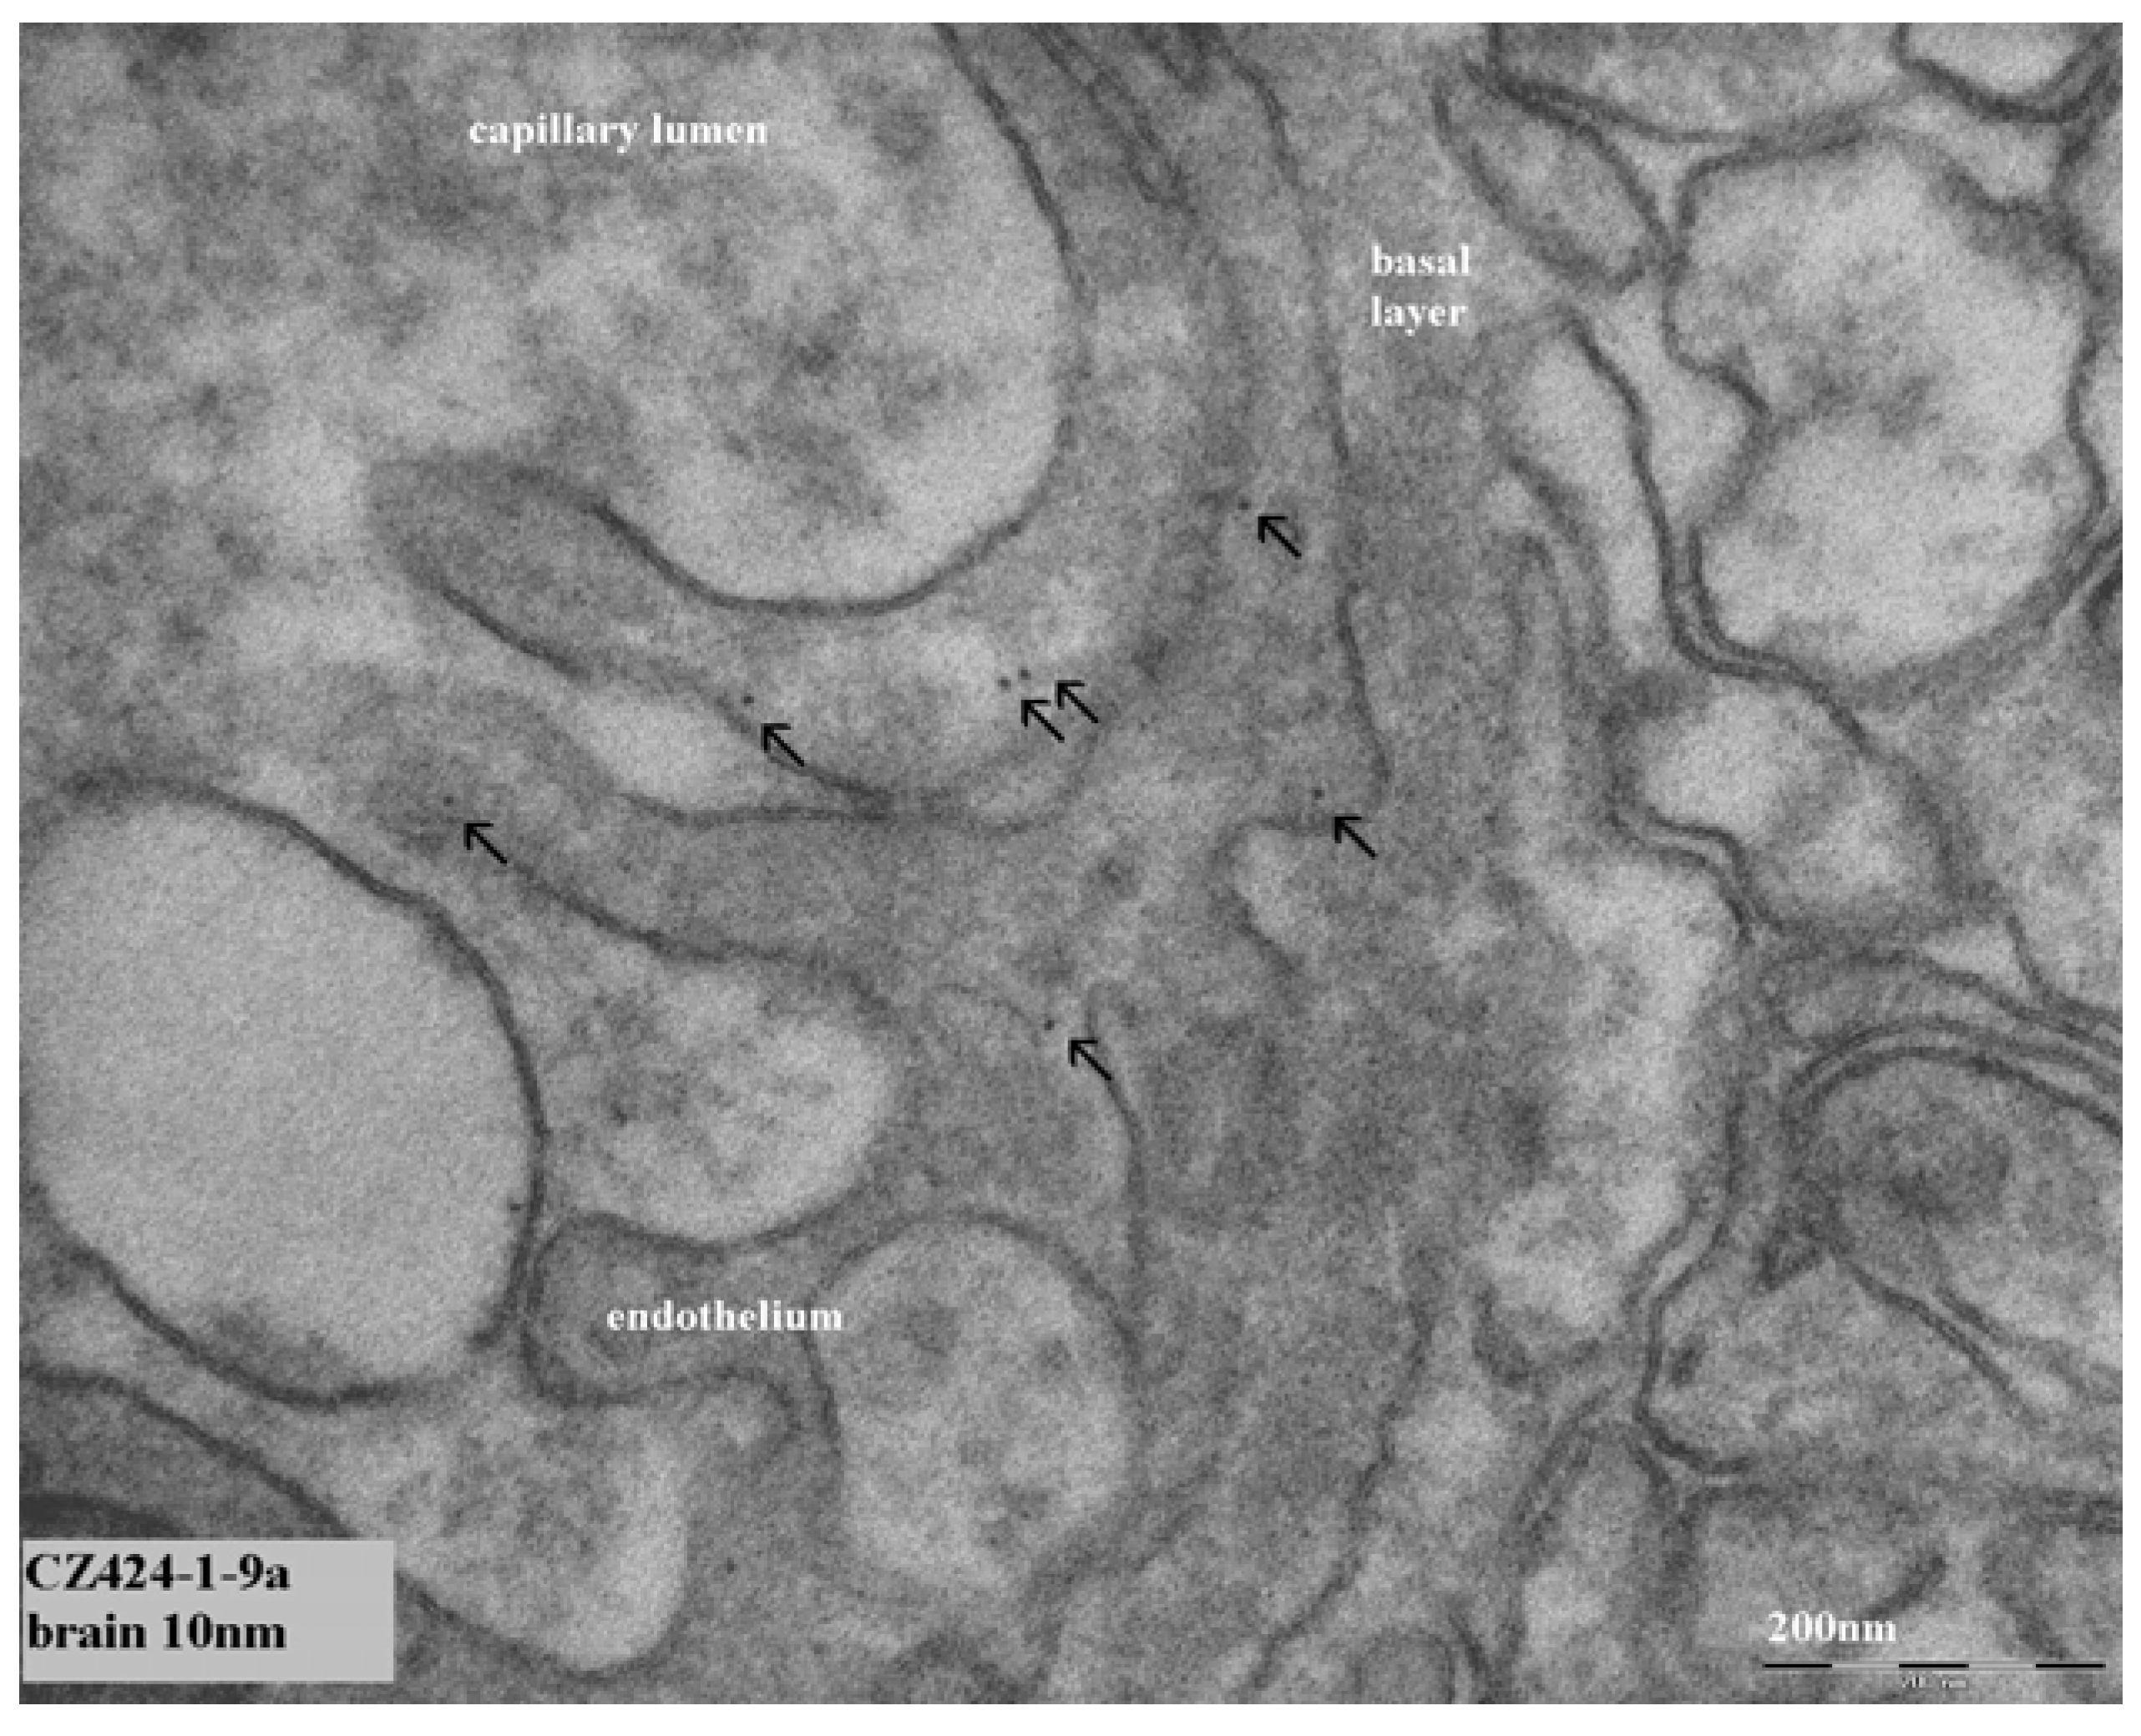
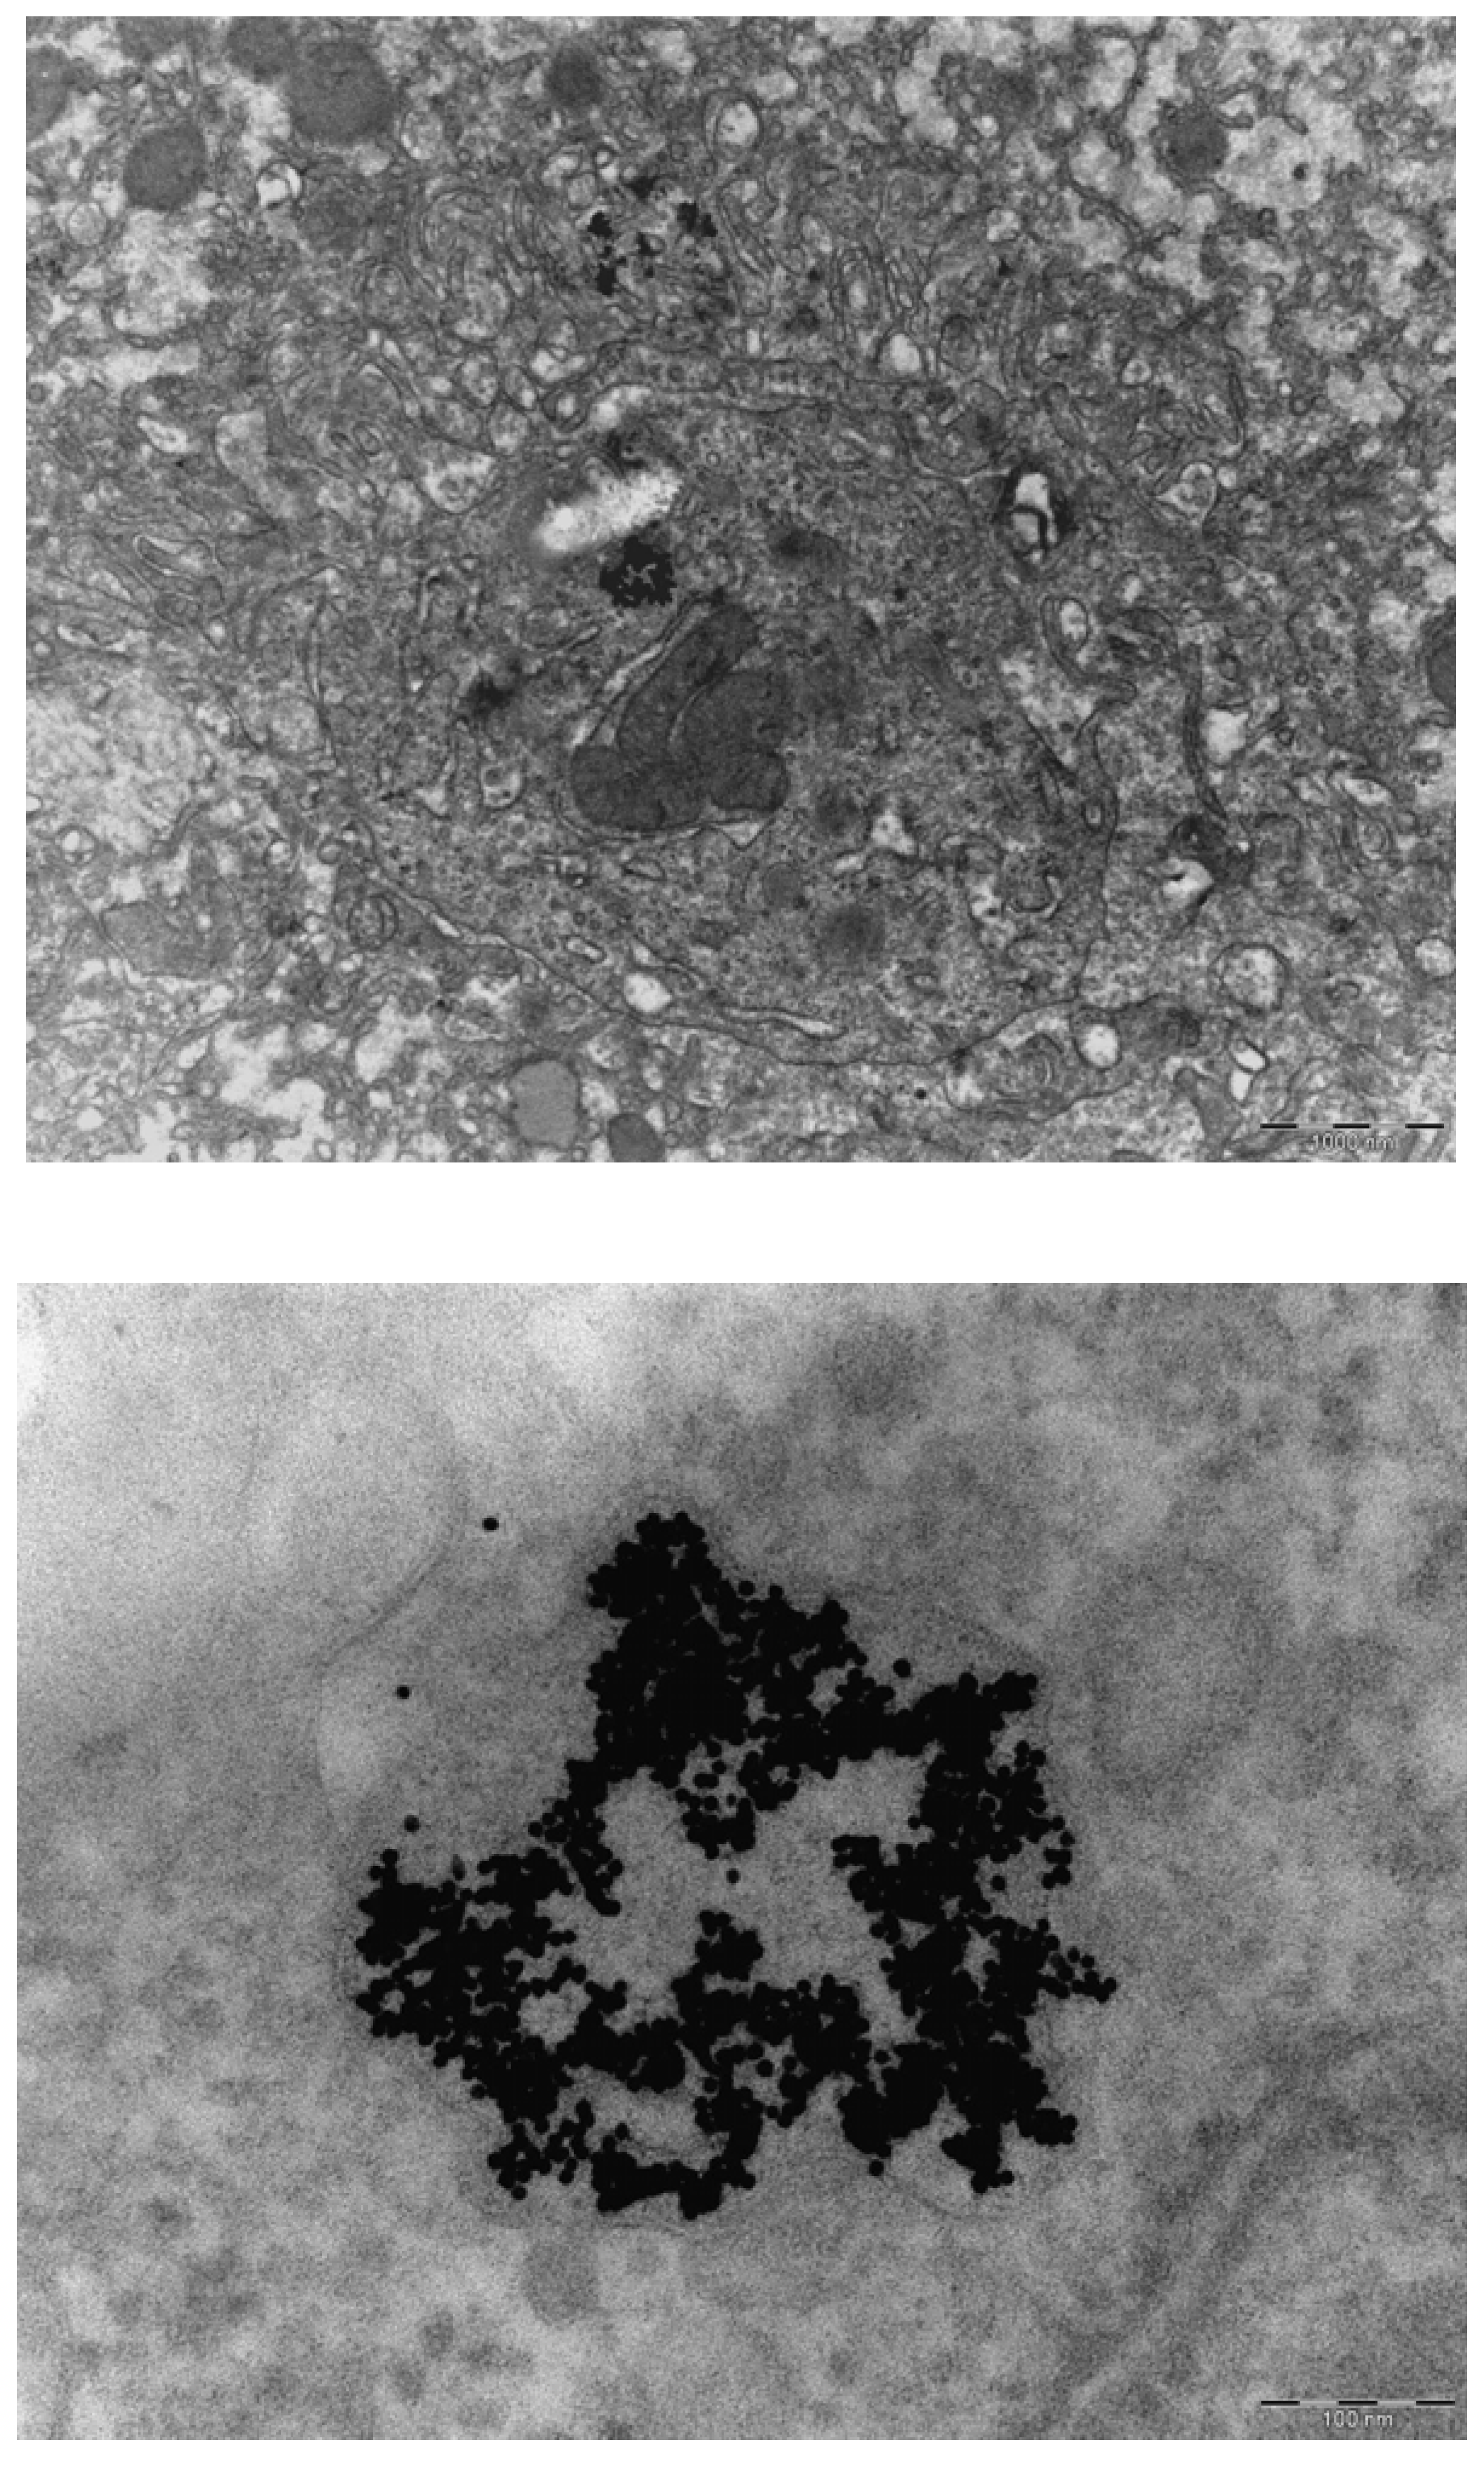
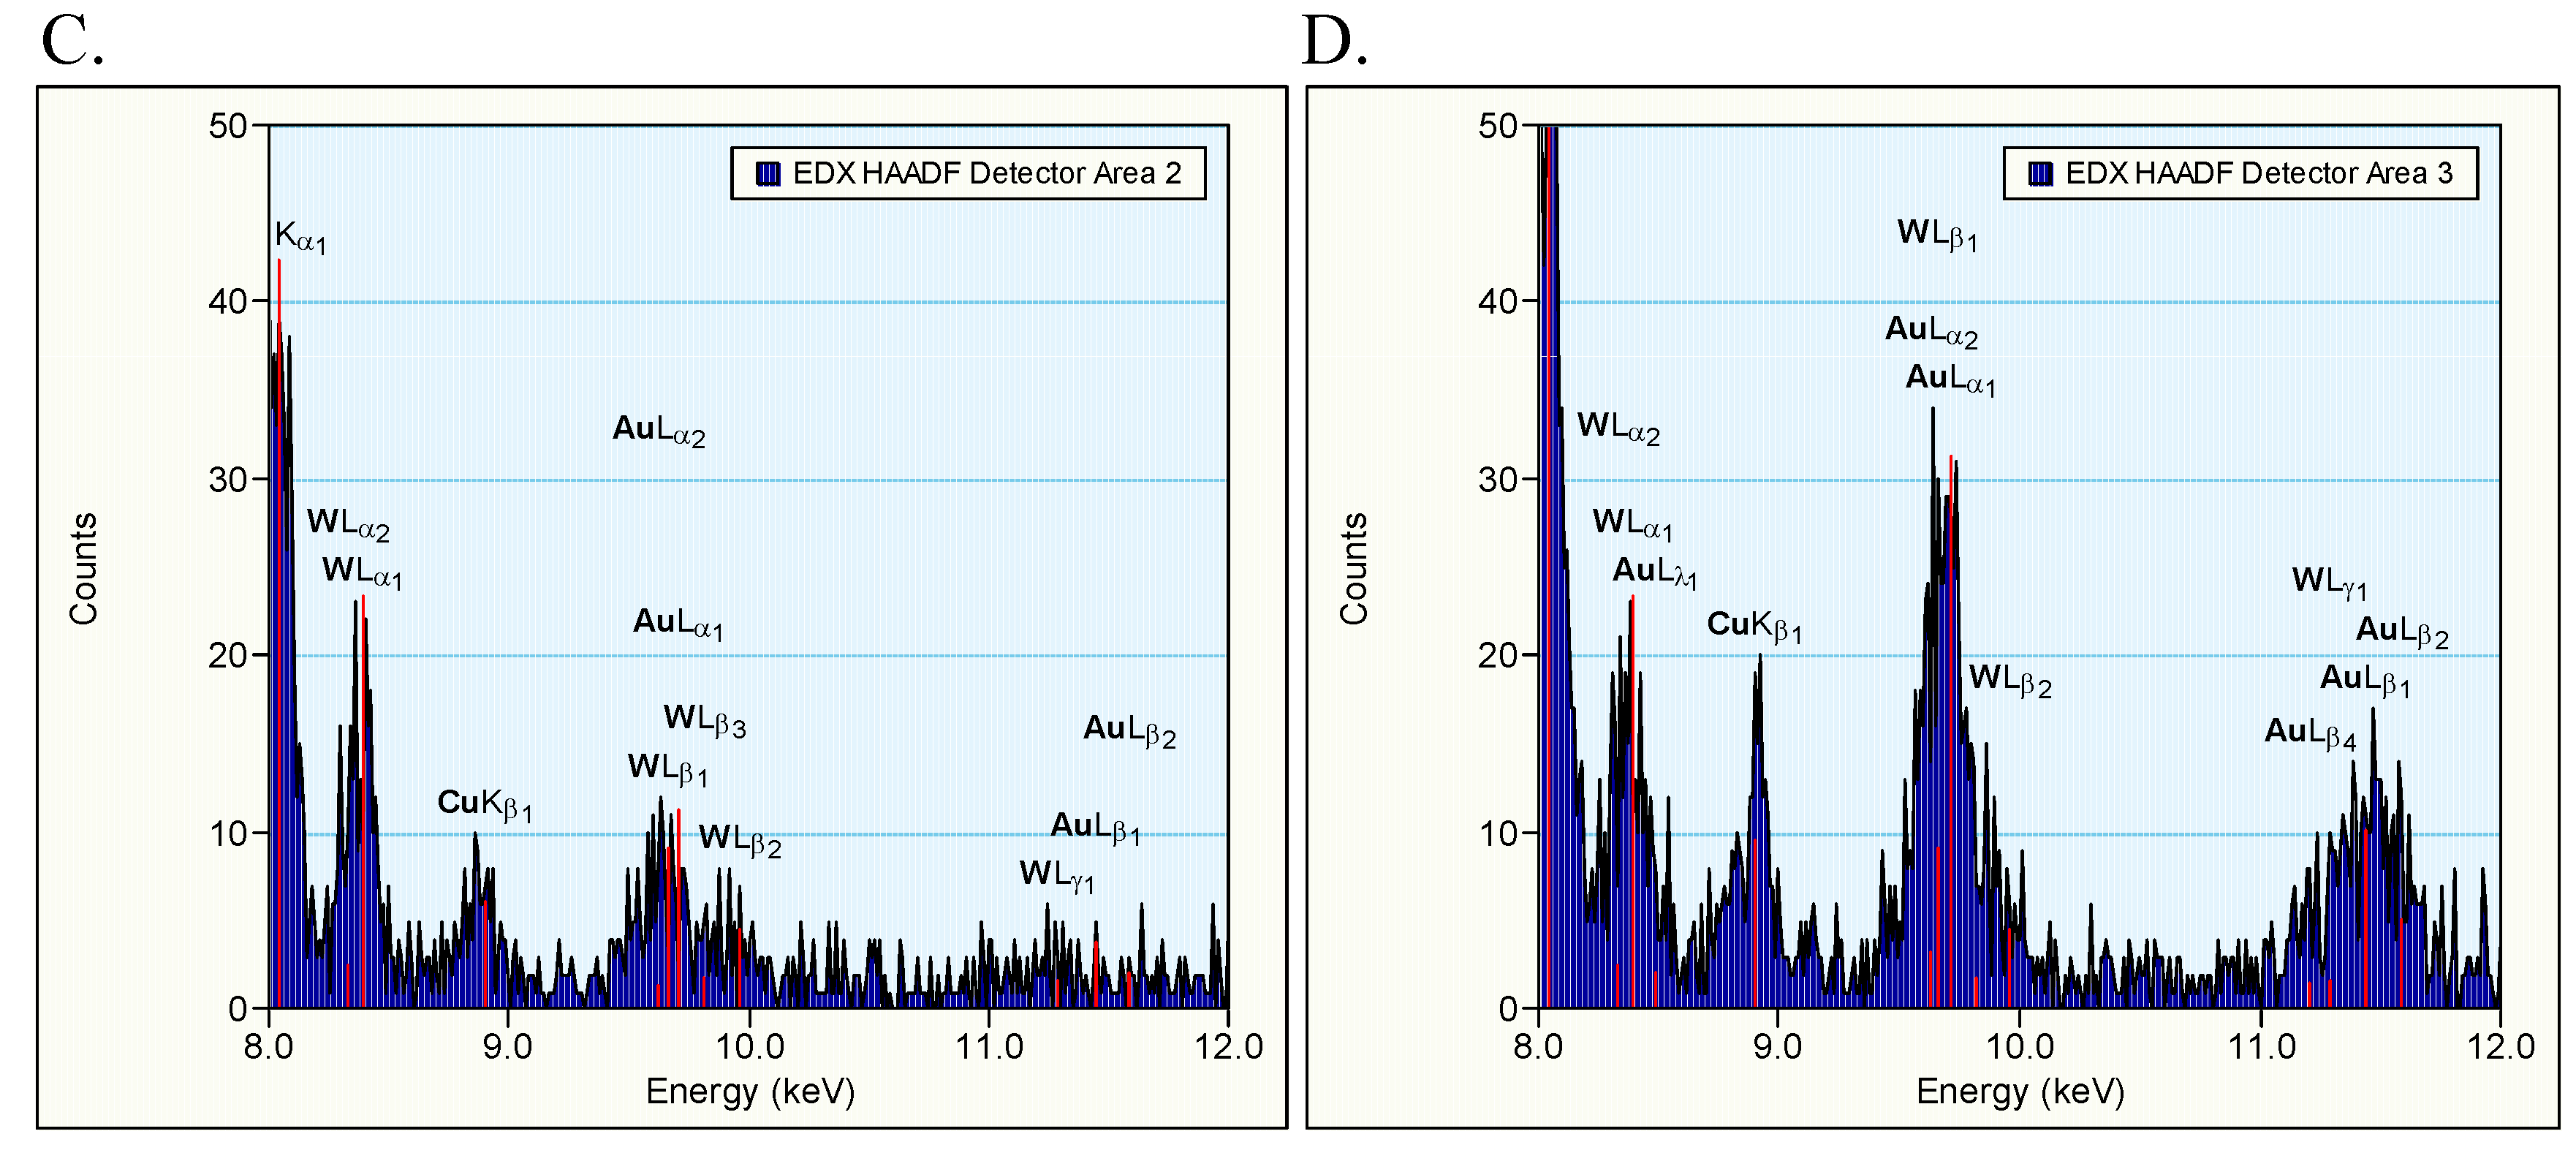
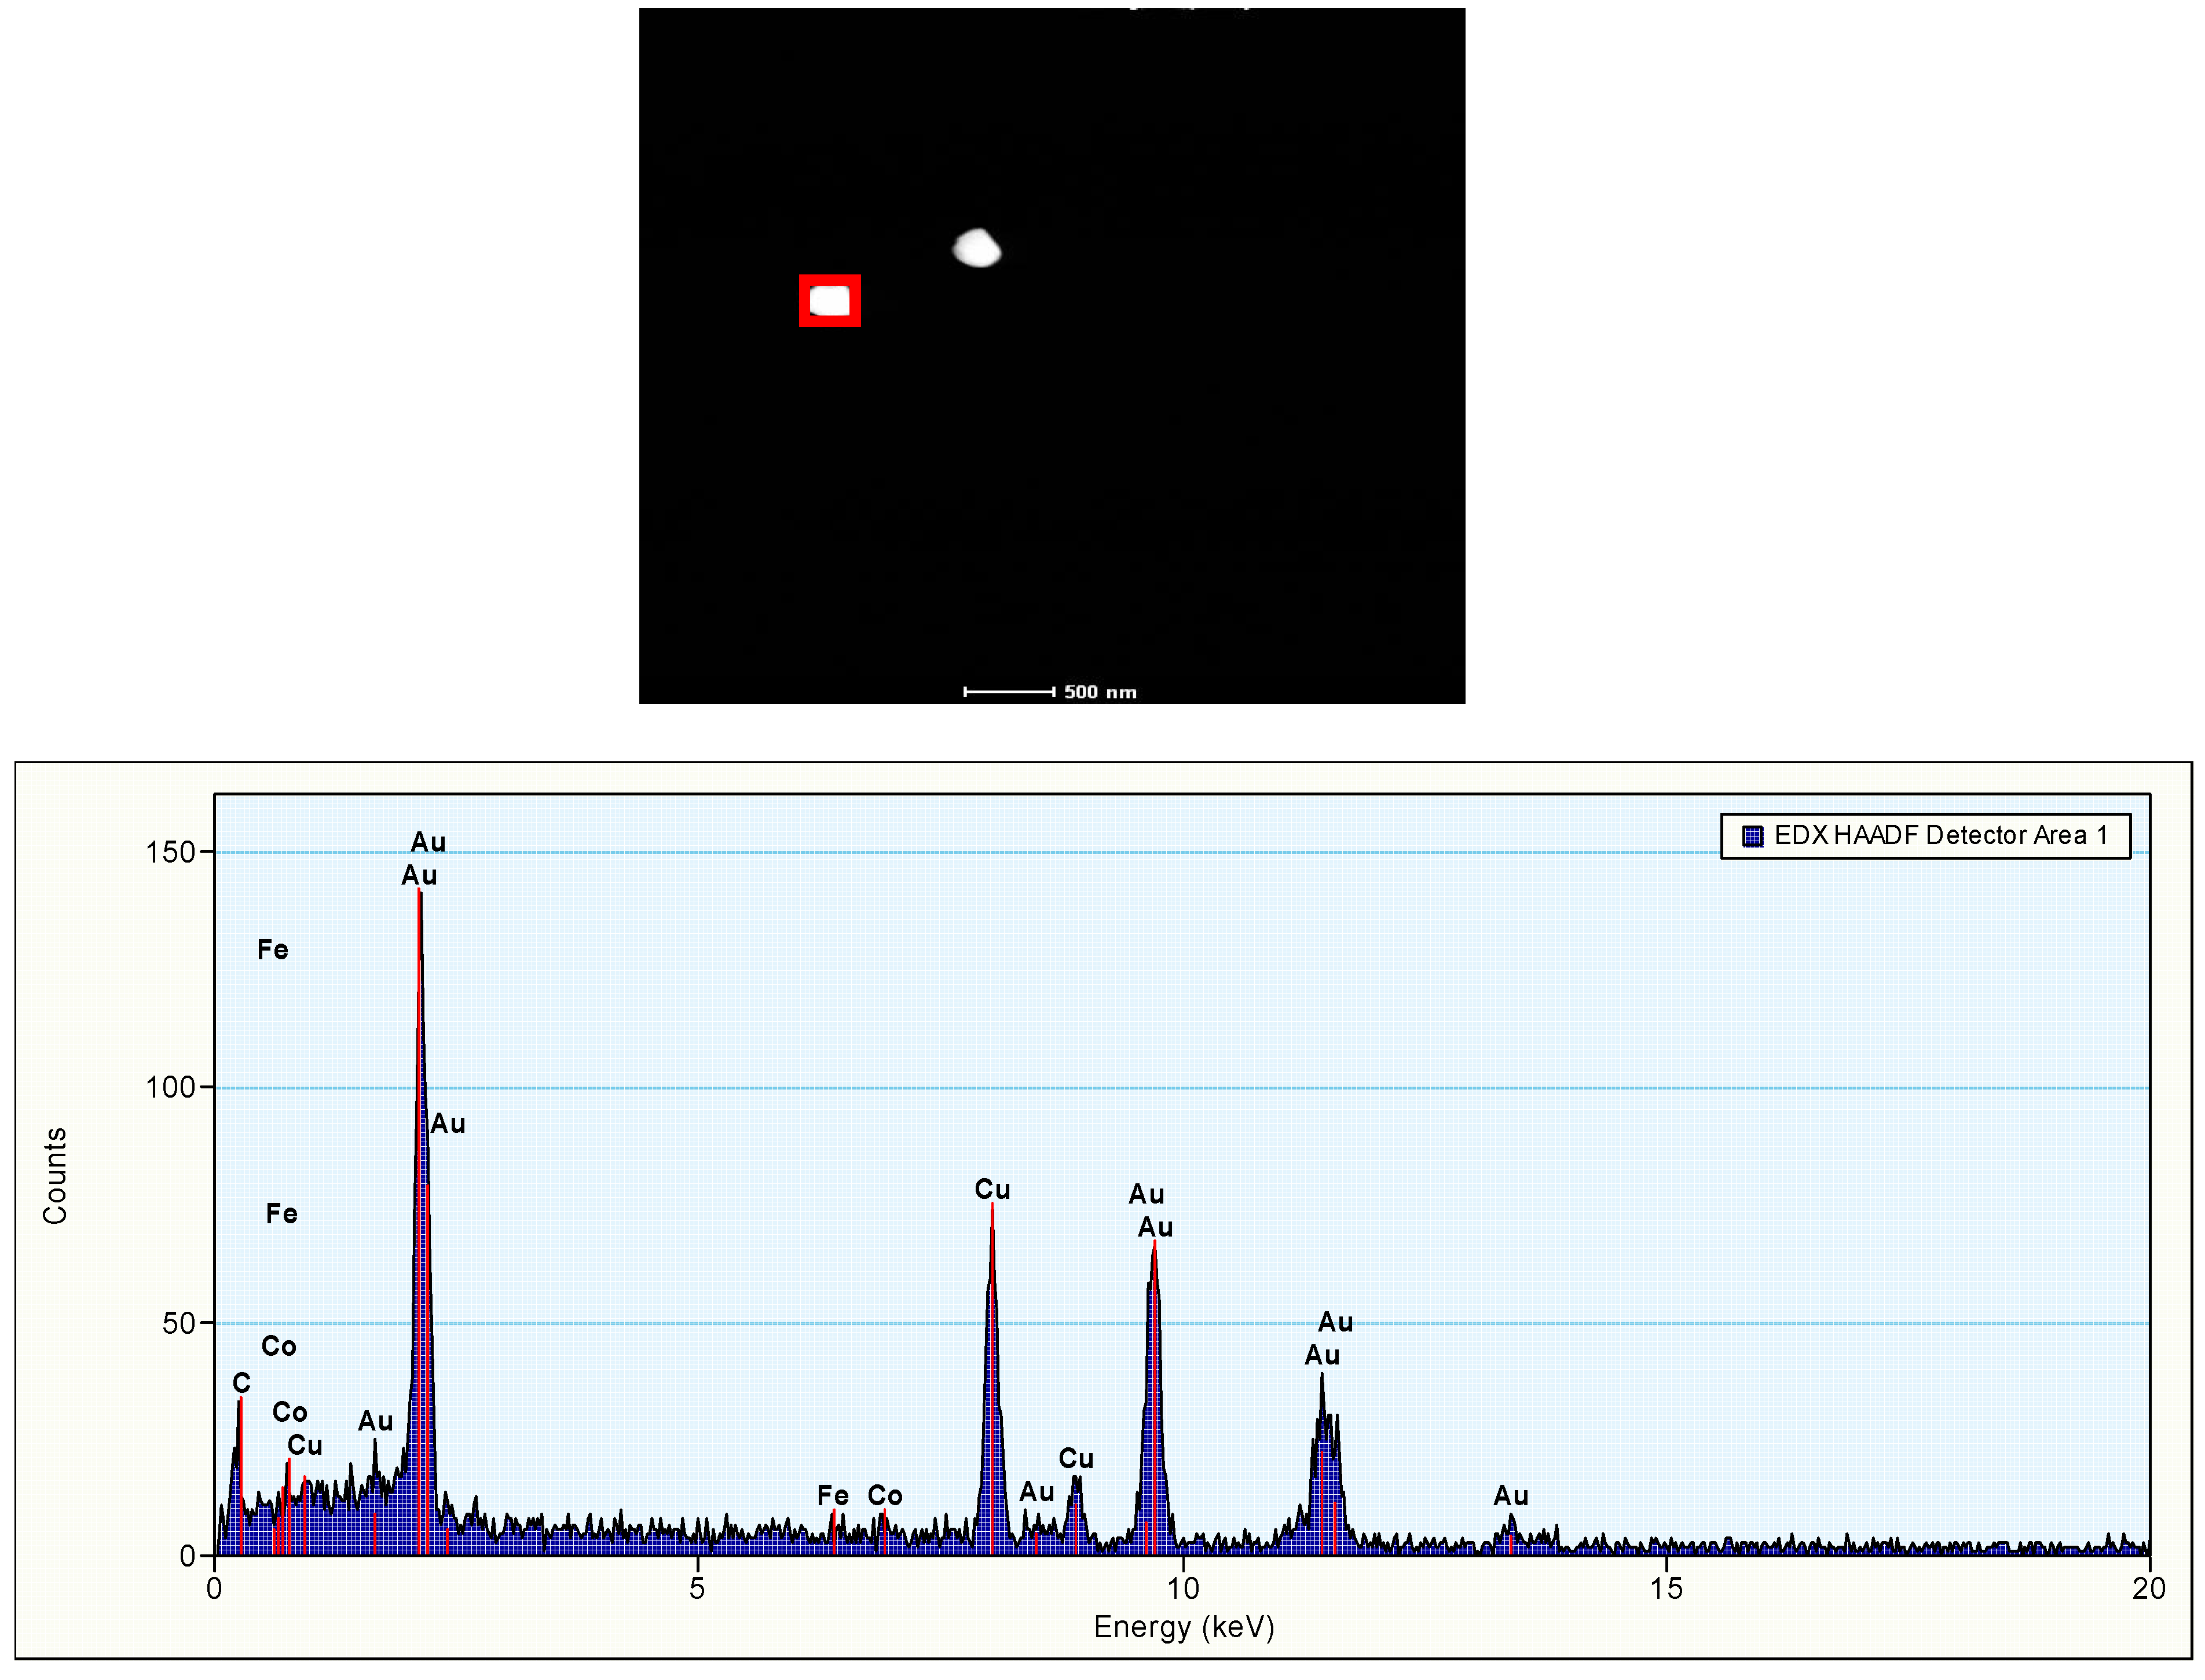
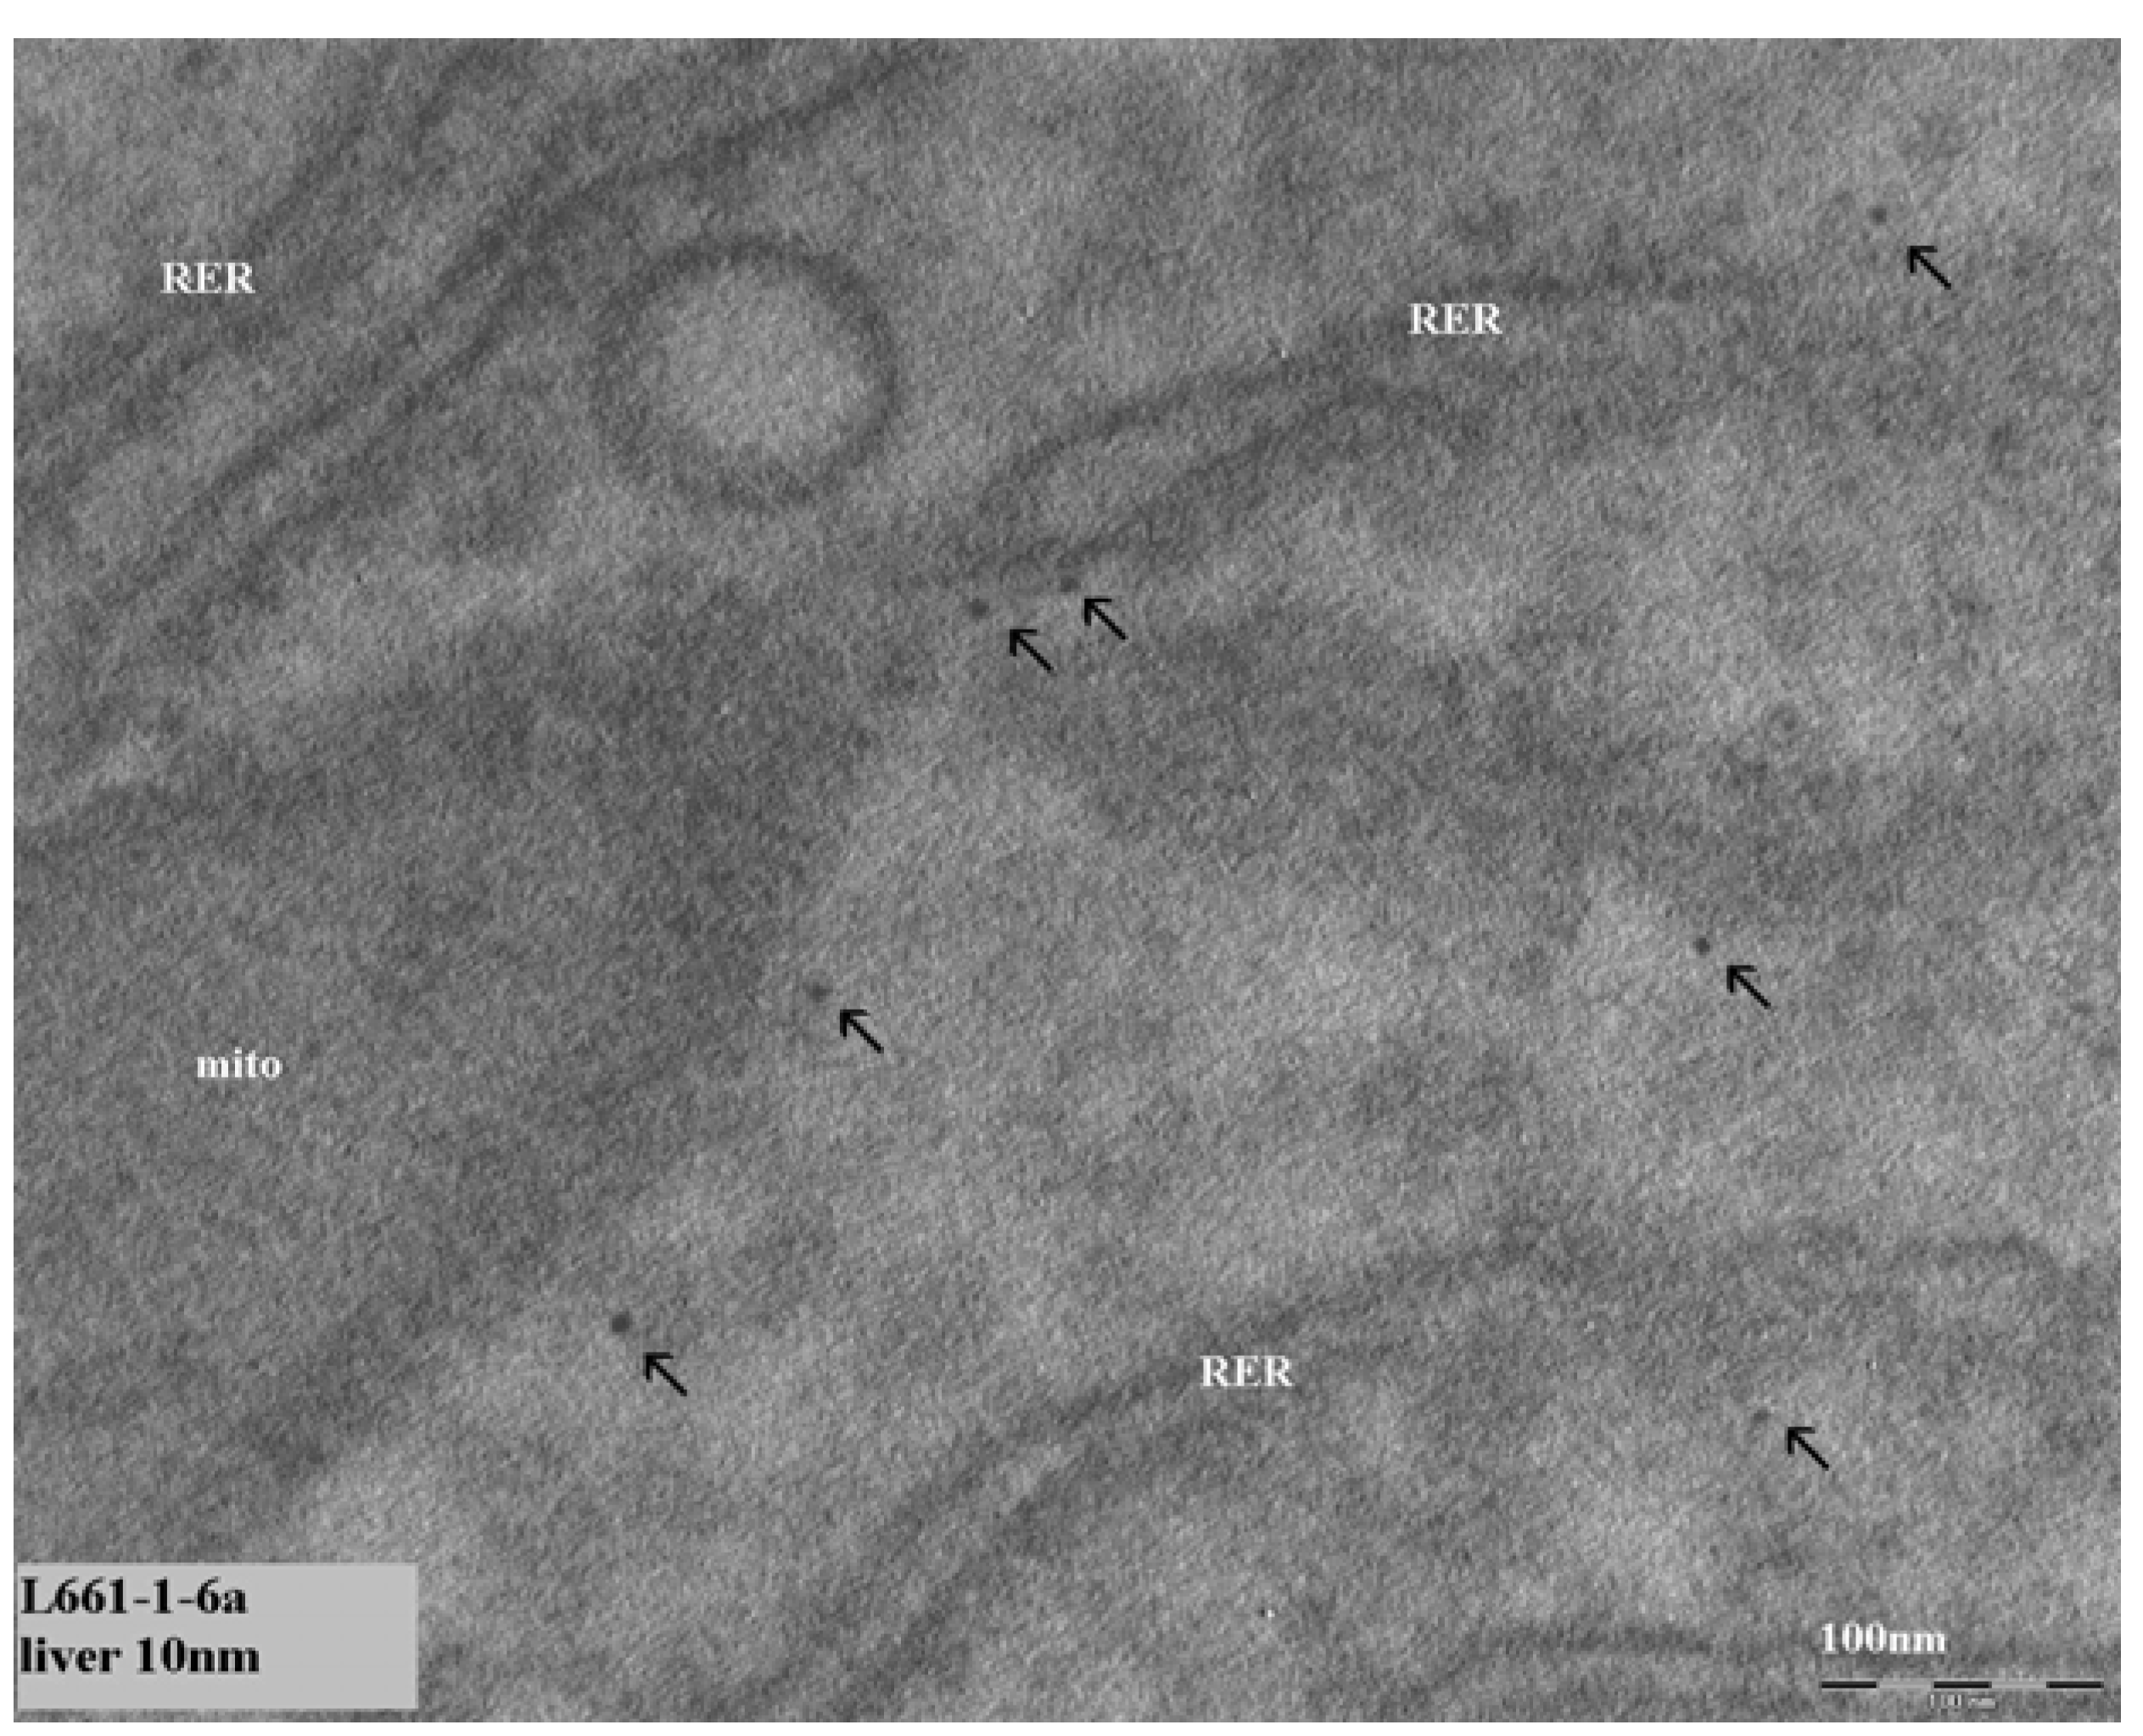
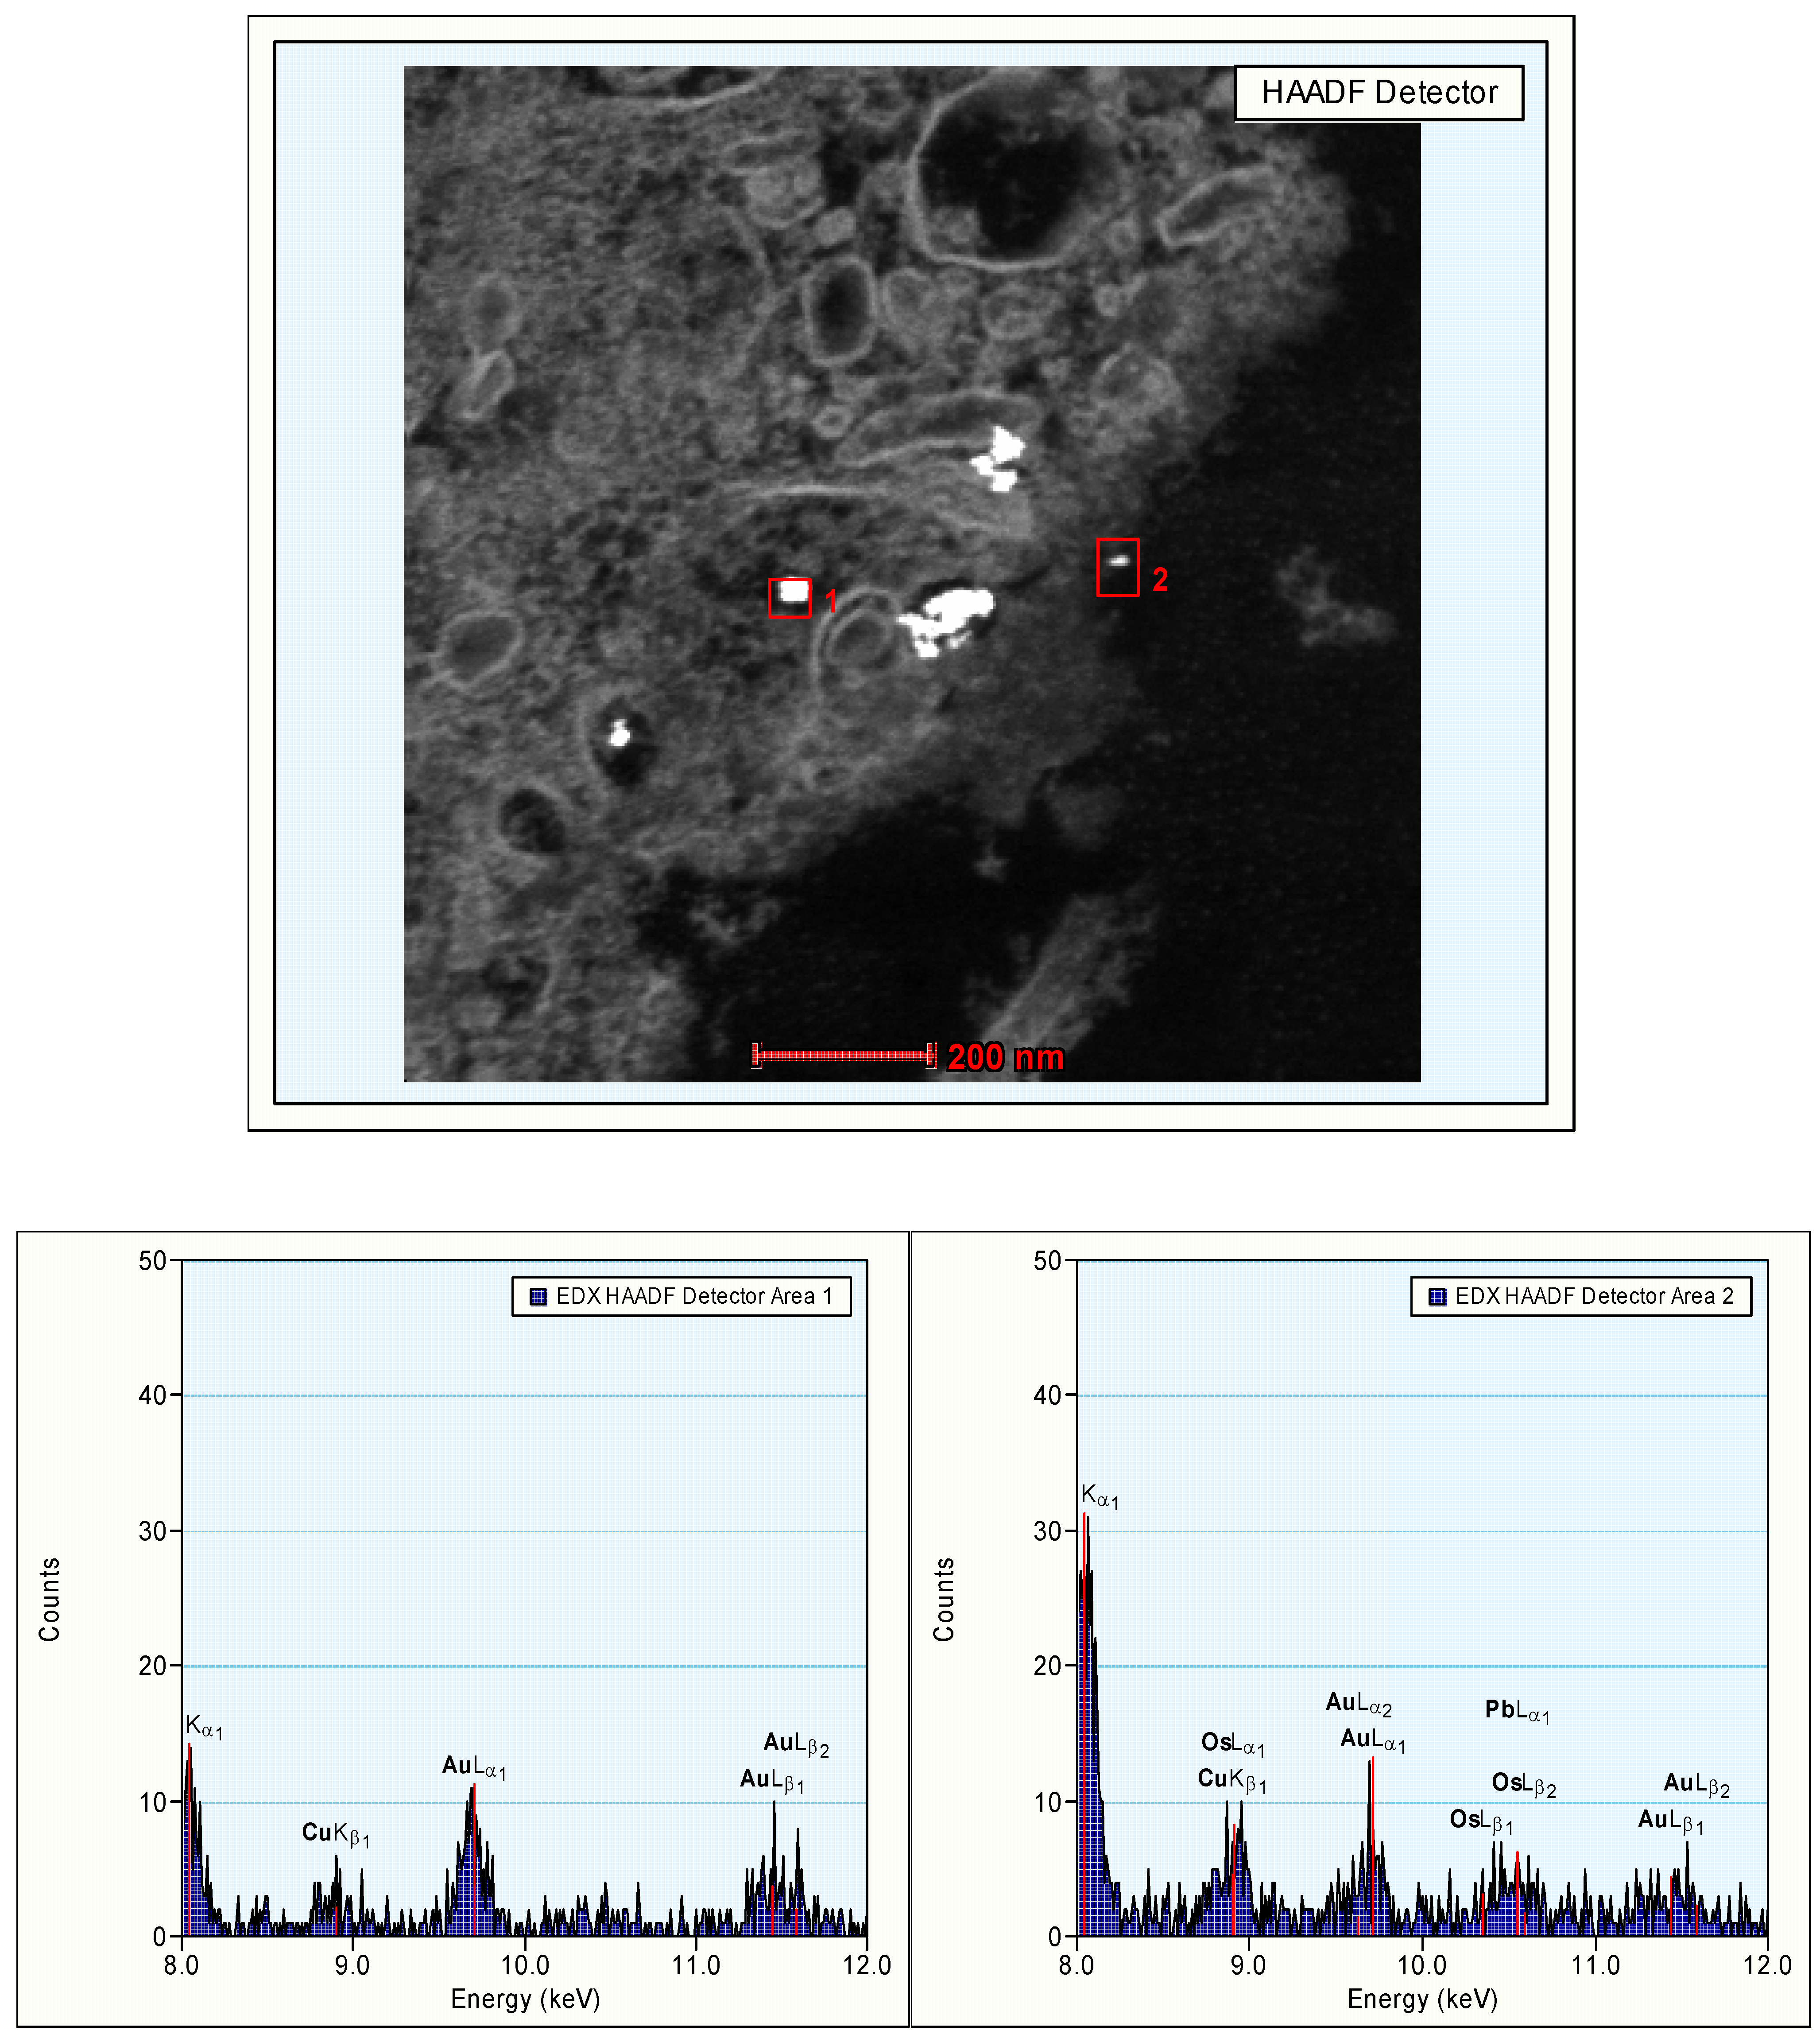
In our continued study brain, heart, kidney, liver and spleen were assessed for the presence of gold nanoparticles. Gold particles could be detected only in the liver and spleen, and only for the animals treated with 10 nm nanoparticles. Our results showed the presence of 10 nm particles in the phago–lysosomes of cells of the mononuclear phagocytic system (MPS) being macrophages in the spleen and the reliculo-endothelial system (RES) being the Kupffer cells in the liver. Both cell types have a function in clearing the blood from unwanted agents like bacteria and particulates. Although we did find the 10 nm particles in the liver, the nanoparticles were not evenly distributed in the liver tissue. There were local areas in which some nanoparticles and clusters of nanoparticles were observed while other areas were empty. These nanoparticle clusters in the cells were positively identified as gold nanoparticles by EDX spectrum analysis. To a lesser extent, similar nanoparticle clusters were observed in spleen macrophages. Whether these groups of nanoparticles are aggregates (with strong binding forces) or agglomerates (with weak binding forces) cannot be concluded from the TEM evaluation. The results of the TEM evaluation of the injected nanoparticle dispersions indicate that in the solution administered, the groups of nanoparticles are likely to consist of agglomerates. It is unknown whether the clusters found in the liver and spleen were taken up as clusters of nanoparticles or as single particles (or small clusters) ending up in the same cell. We did not perform a visual TEM analysis of blood samples in order to assess the physical shape of the nanoparticles in the circulation. Such an analysis is needed to assess whether the nanoparticles are present as single nanoparticles or as clusters of nanoparticles. Our results are in agreement with the results reported by Sadauskas
et al. [
7,
8], who used autometallographic staining to detect 40 nm gold nanoparticles in the liver of mice. Due to the enhancing effect autometallography is suited to evaluate larger sections and thus larger tissue areas for the presence the nanoparticles when compared to EM sections for the presence the nanoparticles. After the initial uptake in the Kupffer cells of the liver, a gradual decrease over time was observed in the presence of the gold nanoparticles in the liver [
7].
Particles are mainly taken up into cells by phagocytic pathways. Previously, the presence of different types of nanoparticles (gold and titanium oxide of 25 and 22 nm, respectively) was demonstrated inside red blood cells [
9,
10]. It was concluded that nanoparticles are able to cross the cell membrane by processes other than phagocytosis and endocytosis since erythrocytes do not have phagocytotic receptors. Diffusion, transmembrane channels, adhesive interactions, or other undefined transmembrane processes might play a role in this cellular uptake. Moreover, the uptake of ultrafine and 200 nm sized particles in macrophages was not blocked by the phagocytosis inhibitor cytochalasin D, whereas the uptake of 1,000 nm (1 mm) particles was inhibited [
9], indicating the non-phagocytic nature of the uptake of the smaller nanoparticles.
For the animals treated with 250 nm gold nanoparticles in our study, gold particles could not be detected in any of the tissue samples examined.
The actual dose and the number of nanoparticles administered to the animals (see
Table 1) was in total 5.1 × 10
12 particles intravenously for the 10 nm size, while for the 250 nm 3.2 × 10
8 particles were injected. Clusters of 10 nm gold particles were found in the liver but this was limited to certain areas of the liver. In the spleen it was much more difficult to find the 10 nm clusters, of which only a few could be found. It can be concluded that we have administered a relatively low dose to the animals. This explains why we did not find the 250 nm gold particles in the organs. Because of their size they are easier to find and to identify than the 10 nm particles. However, in view of the number of particles administered, the probability of finding these 250 nm particles in the ultra thin (80–100 nm) sections for TEM is rather low. For the 10 nm particles in the liver this would mean approximately 10
3 particles in one TEM section (calculation, 10
12 nanoparticles per liver of approximately 10 g, 10
11 per gram liver, equals 10
11 per cm
3 liver; tissue section for TEM is 5 × 10
–5 mm
3 (1 mm × 0.5 mm × 0.1 µm); or 5 × 10
–8 cm
3 ) For 250 nm particles, the calculation would start at 10
8 nanoparticles per liver resulting in 10
7 per gram liver tissue, ending with less than 1 (10
–1) nanoparticle per TEM section. This explains why we were unable to find the 250 nm particles in liver and spleen. In comparison, the ICP-MS method used for the detection of the element gold was thus very sensitive in detecting the gold nanoparticle distribution as even low percentages of the injected dose in various organs could be detected [
1]. The liver and spleen contained the highest amount of the injected dose at 24 h after administration, up to 40% for the liver and 2% for the spleen.
In conclusion, we were only able to identify the organ localization for the 10 nm gold nanoparticles. Groups of 10 nm gold nanoparticles were present in phagocytozing cells of both the liver (Kupffer cells) and the spleen (macrophages). In the other organs investigated (brain, heart, kidney) no gold nanoparticles could be detected. Probably the dose administered was too low to demonstrate the presence of nanoparticles in tissue samples by TEM. Studies with a high concentration might enable observations on the localization of 250 nm nanoparticles inside or outside of cells. Our studies indicate that the in vivo identification of nanoparticles cannot only depend on the detection of nanosized structures in cells. An additional identification, for example by EDX (Energy Dispersive X-ray) detection of the composing elements, or a specific marker for the administered nanoparticles, may be necessary for a positive identification of the nanomaterial in tissues and cells.
Table 1.
Gold Nanoparticle characteristics.
Table 1.
Gold Nanoparticle characteristics.
| Particle size (diameter in nm) | 10 | 50 | 100 | 250 |
| Particle number/ml | 5.7 × 10¹² | 4.5 × 10¹⁰ | 5.6 × 10⁹ | 3.6 × 10⁸ |
| Particle number/ml (x108) | 57000 | 450 | 56 | 3.6 |
| Particle size (actual size in nm) | 9.5 | 48.2 | 99.9 | 247.8 |
| Surface area per particle (nm2) | 283,5287 | 7298,674 | 31353,13 | 192909 |
| Surface area per ml particles | 1.62 × 10¹⁵ | 3.28 × 10¹⁴ | 1.79 × 10¹⁴ | 6.94 × 10¹³ |
| Surface area per ml (× 1013) | 162 | 32.8 | 17.9 | 6.9 |
| Weight injected per animal (ng) | 85,706 | 106,807 | 98,593 | 120,220 |
| Number injected per animala | 5.1 × 10¹² | 4.0 × 10¹⁰ | 5.0 × 10⁹ | 3.2 × 10⁸ |
3. Experimental Section
3.1. Animals
Male WU Wistar-derived rats, 6–8 weeks of age were obtained from the animal facility of the Institute (RIVM, Bilthoven, The Netherlands). Animals were bred under SPF conditions and barrier maintained during the experiment. Drinking water and conventional feed were provided ad libitum. Husbandry conditions were maintained according to all applicable provisions of the national laws, Experiments on Animals Decree and Experiments on Animals Act. The experiment was approved by an independent ethical committee prior to the study.
3.2. Experimental Design
Gold nanoparticles of 10, 50, 100 and 250 nm in aqueous suspension were obtained from SPI supplies, West Chester, PA, USA. The characteristics of the gold nanoparticles are presented in
Table 1. The gold suspensions were 10% diluted by adding one part of 10-times concentrated phosphate buffered saline (10 × PBS) to nine parts of the gold suspension, in order to obtain a physiological solution for intravenous injection. Directly after PBS addition, the nanoparticle solutions of 10, 50 and 100 nm showed a change in color from red to blue indicating the formation of nanoparticle agglomerates/aggregates, whereas the 250 nm particles did not. The solutions remained clear and no sediments or agglomerates/aggregates were visually noted. A PBS control solution was prepared by adding one part of 10 × PBS to nine parts of distilled water (1:10). Treatment groups were as follows: 10 nm gold nanoparticles (n = 7), 50 nm gold nanoparticles (n = 2), 100 nm gold nanoparticles (n = 4), and 250 nm gold nanoparticles (n = 5), PBS control (n = 3). One milliliter of each freshly prepared solution was injected in the tail vein. The injections were well tolerated and no adverse effects were observed during the 24 h observation period.
At 24 h after injection, blood and the following organs were collected: adrenals, aorta, brain, heart, kidney, liver, lung, lymph nodes (mesenteric and popliteal), spleen, testis, thymus, and vena cava. Organs were weighed, and tissue samples were homogenized and frozen for determination of gold content by inductively coupled plasma mass spectrometry (ICP-MS). EDTA blood was collected and stored in the refrigerator (4 °C). The results of the ICP-MS determinations of the gold content of blood and organs are reported elsewhere [
1].
3.3. Transmission Electron Microscopy (TEM)
Samples of nanoparticle dispersions used for intravenous administration were prepared for evaluation by transmission electron microscopy. Samples were added to a carbon-coated formvar film, contrasted with 2% phosphotungsten acid pH 5.2, and allowed to dry. Without further preparation, the samples were evaluated by transmission electron microscopy.
For TEM evaluation, from each group of animals treated with a different size of nanoparticles, tissue samples were collected from several animals. In this study various organs (brain, heart, kidney, liver and spleen) of two animals treated with 10 nm gold nanoparticles, and two animals treated with 250 nm gold nanoparticles were evaluated.
Tissue samples were fixed in a mixture of 2% paraformaldehyde and 2.5% glutaraldehyde in 0.1 M sodium cacodylate buffer pH 7.4 for at least one week at +4 °C. Added to the buffer was 0.01 M CaCl2, 0.01 M MgCl2, and 0.1 M sucrose. After washing, a second fixation was done in sodium cacodylate buffer with 1% osmiumtetroxide and 1.5% potassiumhexanocyanoferrat. Tissue samples were dehydrated with serial alcohol and propylene oxide, impregnated and embedded in glycidether 100 (1,2,3-tris(2,3-epoxypropoxy)propan), which was polymerized at 60 °C. Semithin sections were prepared and stained with toluidin blue. Ultrathin sections of 50–70 nm were stained by uranyl acetate and lead citrate. Transmission electron microscopy (TEM) was performed using a FEI Company TECNAI 12 (FEI Company, Eindhoven, The Netherlands) transmission electron microscope.
Additional studies at TEM level were performed for further identification of the presence of the element gold in various structures identified in the TEM evaluation as nanoparticles. These studies were performed using a TECNAI F30ST TEM operated at 300 kV. Mass sensitive HAADF (High Angular Annular Dark Field) detector was used for the detection of the presence of heavy (metallic) atoms in structures. The mass sensitive detection means that a higher brightness in the image corresponds to the presence of (a larger concentration of) heavier atoms. HAADF images are acquired in the scanning TEM mode. Using an Energy Dispersive X-ray (EDX) detector element characteristic X-rays were assessed. In the EDX spectrum, the detected signal is plotted as a function of the (characteristic) energy. Chemical compositions, in this case gold, can be obtained by quantification of the data.


