

Influence of Annealing Process on Soft Magnetic Properties of Fe-B-C-Si-P Amorphous Alloys
by
 , ,
, ,
Jili Jia
1,
You Wu
1,
Lingxiang Shi
1,2,
Ranbin Wang
1,
Wenhui Guo
1,
Hengtong Bu
1,
Yang Shao
1,
Na Chen
1 and
Kefu Yao
1,* 1
School of Materials Science and Engineering, Tsinghua University, Beijing 100084, China
2
Department of Mechanical Engineering, City University of Hong Kong, Tat Chee Avenue, Kowloon, Hong Kong
*
Author to whom correspondence should be addressed.
Materials 2024, 17(6), 1447; https://doi.org/10.3390/ma17061447
Submission received: 18 February 2024
/
Revised: 9 March 2024
/
Accepted: 11 March 2024
/
Published: 21 March 2024
(This article belongs to the Special Issue The 15th Anniversary of Materials—Recent Progresses in Advanced and Functional Ceramics and Glasses)
Abstract
:It is well known that the annealing process plays a key role in tuning the properties of Fe-based amorphous soft magnetic alloys. However, the optimal annealing process for a particular amorphous alloy is often difficult to determine. Here, Fe81.4B13.2C2.8Si1.8P0.8 and Fe82.2B12.4C2.8Si1.8P0.8 amorphous alloys (denoted as Fe81.4 and Fe82.2) were prepared to systematically study the effects of the annealing temperature and time on the soft magnetic properties. The results show that the optimum annealing temperature ranges of the Fe81.4 and Fe82.2 amorphous alloys were 623 K to 653 K and 593 K to 623 K, and their coercivity (Hc) values were only 2.0–2.5 A/m and 1.3–2.7 A/m, respectively. Furthermore, a characteristic temperature Tai was obtained to guide the choosing of the annealing temperature at which the dBs/dT begins to decrease rapidly. Based on the theory of spontaneous magnetization, the relationship between Tai and the optimum annealing temperature ranges was analyzed. When the annealing temperature was higher than Tai, the effect of the internal magnetic field generated by spontaneous magnetization on the relaxation behavior was significantly reduced, and the alloys exhibited excellent soft magnetic properties. It is worth indicating that when annealed at 603 K (slightly higher than Tai), the Fe82.2 amorphous alloys exhibited excellent and stable soft magnetic properties even if annealed for a long time. The Hc of Fe82.2B12.4C2.8Si1.8P0.8 amorphous alloys was only 1.9 A/m when annealed at 603 K for 330 min. This value of Tai is expected to provide a suggestion for the proper annealing temperature of other amorphous soft magnetic alloys.
1. Introduction
Among the diverse soft magnetic materials, Fe-based amorphous alloys have attracted intensive attention due to their highly comprehensive soft magnetic performance, including low coercivity (Hc) and core loss (W) [1,2,3,4]. The structure of Fe-based amorphous alloys obtained through rapid solidification has various inhomogeneities, such as loose and dense atomic packing regions, regions with different internal stresses, and magnetic heterogeneous regions [5]. The Hc of Fe-based amorphous alloys is directly related to the inhomogeneity, internal stress, and free volume of amorphous alloys [5,6,7,8]. In order to reduce Hc and improve the soft magnetic properties, annealing is generally carried out near or above the Curie temperature (TC) of amorphous alloys [5,9]. Above TC, amorphous alloys are paramagnetic, so the stress release and structural relaxation are no longer affected by the local internal magnetic field [5,9,10]. Therefore, the magnetic domain structure is optimized, thus greatly improving the soft magnetic properties.
At present, the annealing time of amorphous alloys reported in the literature is relatively short, especially for those with a relatively high iron content; most of them are no more than 30 min [9,11,12,13,14,15]. However, for the industrial production of amorphous alloy products, long-time annealing is of great importance. Due to the characteristics of the furnace structure and the large volume of materials, the time required for uniform temperature distribution in the industrial production process is longer than that under experimental conditions. The time required to reach the set temperature for different locations in the furnace is different, but the properties of materials annealed in the same batch need to be as similar as possible. Therefore, it is required that the properties of amorphous alloys be kept stable during the annealing time for as long as possible.
A few studies have suggested that when annealing for a long time, even if the annealing temperature is slightly lower than TC, good soft magnetic properties can also be obtained [16,17]. Thus, the question of how to determine the optimal annealing temperature for long-time annealing is important. TC is a key temperature parameter used to describe the property transition of magnetic materials from ferromagnetic to paramagnetic; it is often used as a criterion for selecting the optimal annealing temperature in short-time annealing. Similarly, it is important to find a way to determine the optimal annealing temperature in long-time annealing and to understand the variation in magnetic properties with temperature.
In this study, Fe81.4B13.2C2.8Si1.8P0.8 and Fe82.2B12.4C2.8Si1.8P0.8 amorphous alloys with relatively high Fe content were designed and prepared. The effects of the annealing temperature and time on the soft magnetic properties, magnetic domain structure, and magnetization process of the amorphous alloys were systematically studied. The correlation between the magnetic properties and the structure of the annealed amorphous alloys is discussed, and the process for the magnetic property adjustment of Fe-based amorphous alloys in long-time annealing is investigated.
2. Materials and Methods
Amorphous alloy ribbons with nominal compositions of Fe81.4B13.2C2.8Si1.8P0.8 (denoted as Fe81.4) and Fe82.2B12.4C2.8Si1.8P0.8 (denoted as Fe82.2) were produced with single-roller spinning. The thermal properties of the amorphous alloys were examined using differential scanning calorimetry (DSC, Netzsch STA 449 F3, Netzsch, Selb, Germany) at a heating rate of 40 K/min. The temperature dependence of magnetization of the amorphous alloys was measured using superconducting quantum interference device (SQUID, MPMS-3, Quantum Design, San Diego, CA, USA) magnetometry under an applied field of 800 kA/m at a heating rate of 10 K/min. The ribbons, with a width of about 1 mm and a thickness of about 25 μm, were cut to an 80 mm length for subsequent annealing and measurements. The structures of the as-spun and annealed samples were identified using X-ray diffraction (XRD, Rigaku D/max 2500, Rigaku, Tokyo, Japan) with Cu Kα radiation. The structure of the as-spun Fe82.2 amorphous alloy ribbon was also identified using high-resolution transmission electron microscopy (HRTEM, FEI Tecnai G2 F20, FEI, Hillsboro, OR, USA). The static magnetization curves and hysteresis loops were measured using a DC B-H hysteresis loop tracer (Linkjoin MATS-2010SD, Linkjoin, Loudi, China) under a field of 800 A/m. The domain structures were observed with a magneto-optical Kerr microscope (MOKE, Zeiss Imager D2m, Zeiss, Oberkochen, Germany).
In order to explore the effect of the annealing process on the soft magnetic properties of amorphous alloys, isothermal annealing treatments of the amorphous ribbons were carried out with the normal annealing (NA) process. This consisted of the following three steps: (1) the ribbon sample was fixed in a copper holder and then sealed in a quartz tube filled with argon gas; (2) the temperature inside the electric tube furnace was raised to the set value, and the quartz tube was pushed into the furnace; (3) after holding in the furnace for a given time, the quartz tube was pulled out of the furnace and quenched in water to room temperature.
3. Results and Discussion
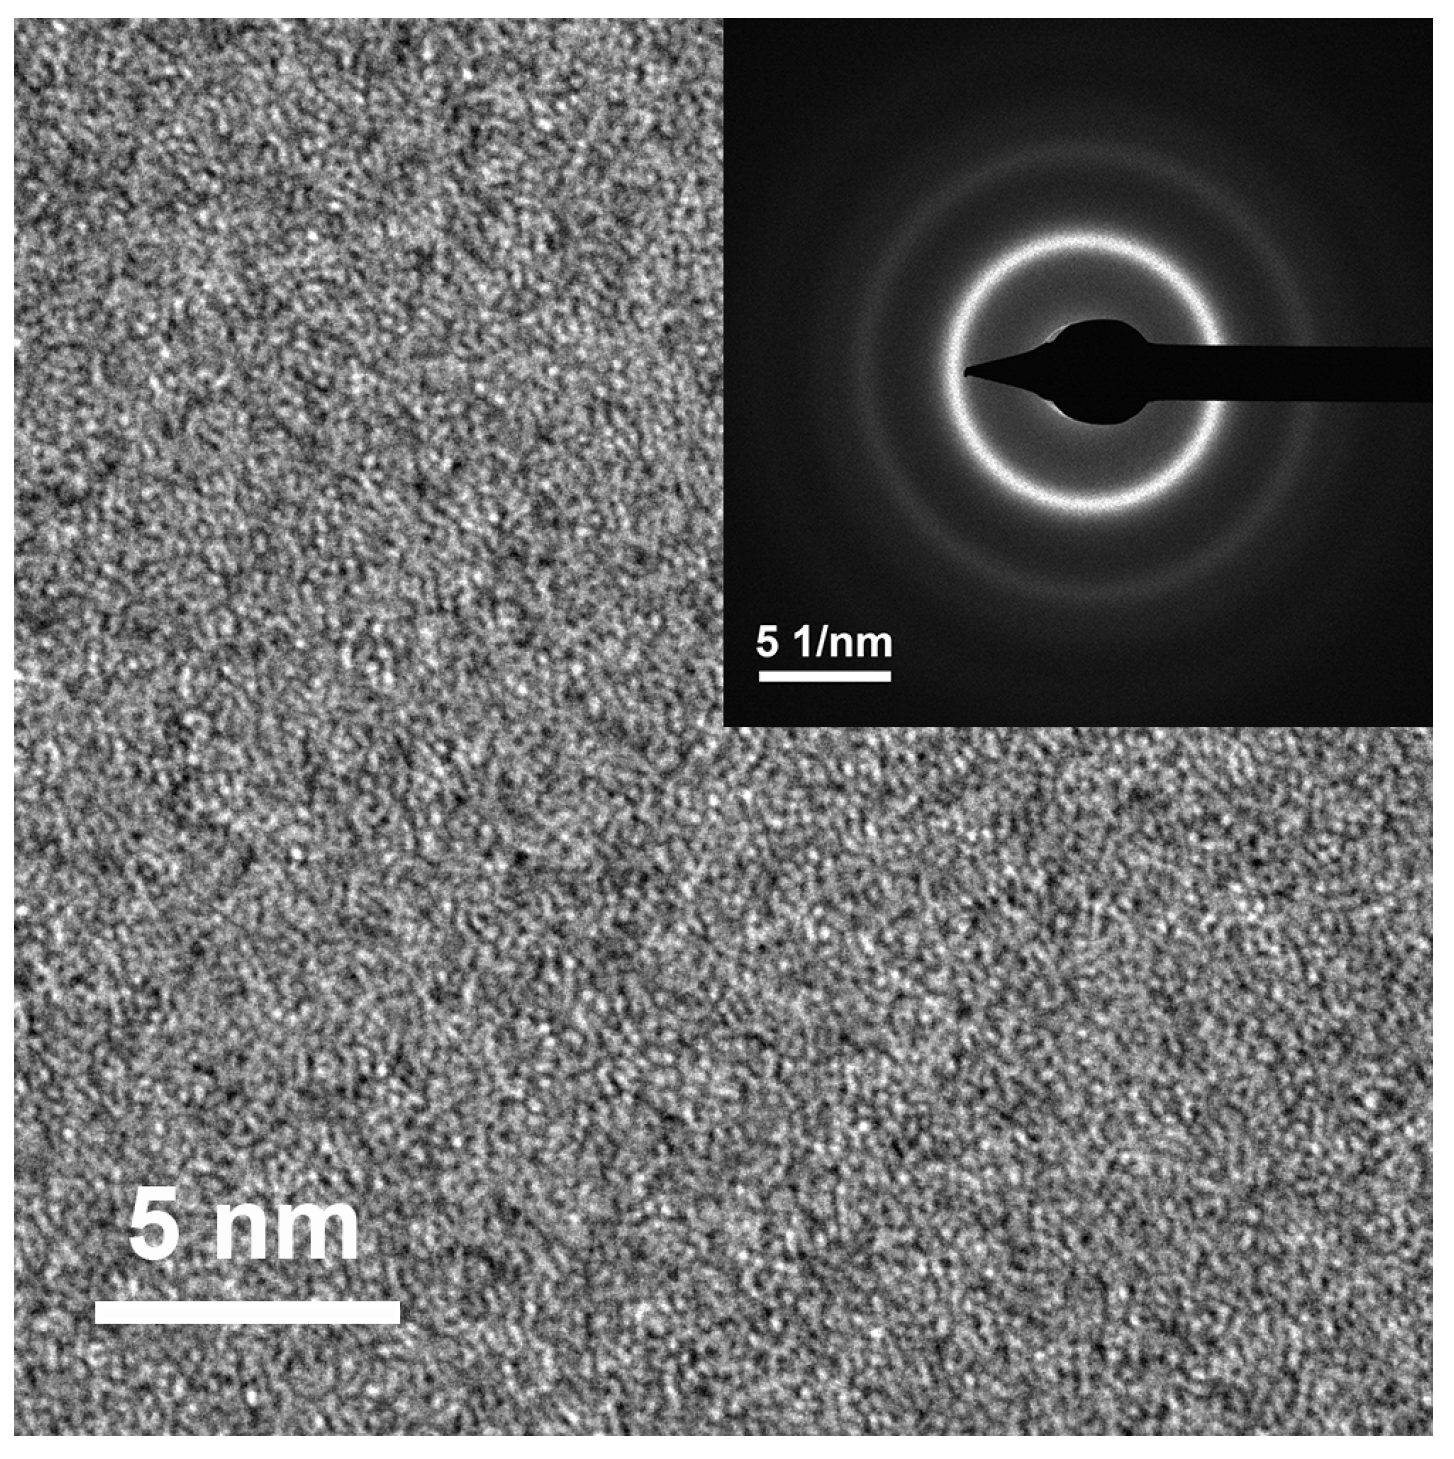
In order to enhance the saturation magnetic flux density (Bs) of Fe-based amorphous alloys, the Fe content should be increased in the alloys. Based on former research results and considering the synergetic effect of metalloid elements B, C, Si, and P [17,18,19,20,21], two alloys with nominal compositions of Fe81.4B13.2C2.8Si1.8P0.8 and Fe82.2B12.4C2.8Si1.8P0.8 were designed and prepared via single-roller spinning. The structure of the prepared alloy ribbons was examined using the XRD method. As shown in Figure 1, no sharp diffraction peak corresponding to the crystalline phases in the XRD patterns of the as-spun Fe81.4 and Fe82.2 ribbons (black lines in Figure 1a and Figure 1b, respectively) can be observed, indicating that both of them possessed an amorphous structure. The HRTEM image and SAED pattern in Figure 2 further confirm the amorphous nature of the as-spun Fe82.2 ribbon. This implies that the designed alloys possessed good glass-forming abilities. The thermal properties of the as-spun ribbons, including the Curie temperature (TC) and the onset temperature of crystallization (Tx), were determined from the DSC curves shown in Figure 3. The TC and Tx of the Fe81.4 amorphous ribbons were 661 K and 776 K, respectively, and those of Fe82.2 were 635 K and 766 K, respectively. This indicates that the value of Tx−TC was over 110 K. When the Fe content was slightly increased by 0.8 at.% (the B content was reduced by 0.8 at.%), the TC and Tx of the Fe-based amorphous alloy were clearly reduced. The decrease in the Tx is due to the decrease in thermal stability caused by the increase in Fe content and the decrease in B content [22,23]. Meanwhile, the decrease in TC is due to the decrease in the exchange interaction [18,24].
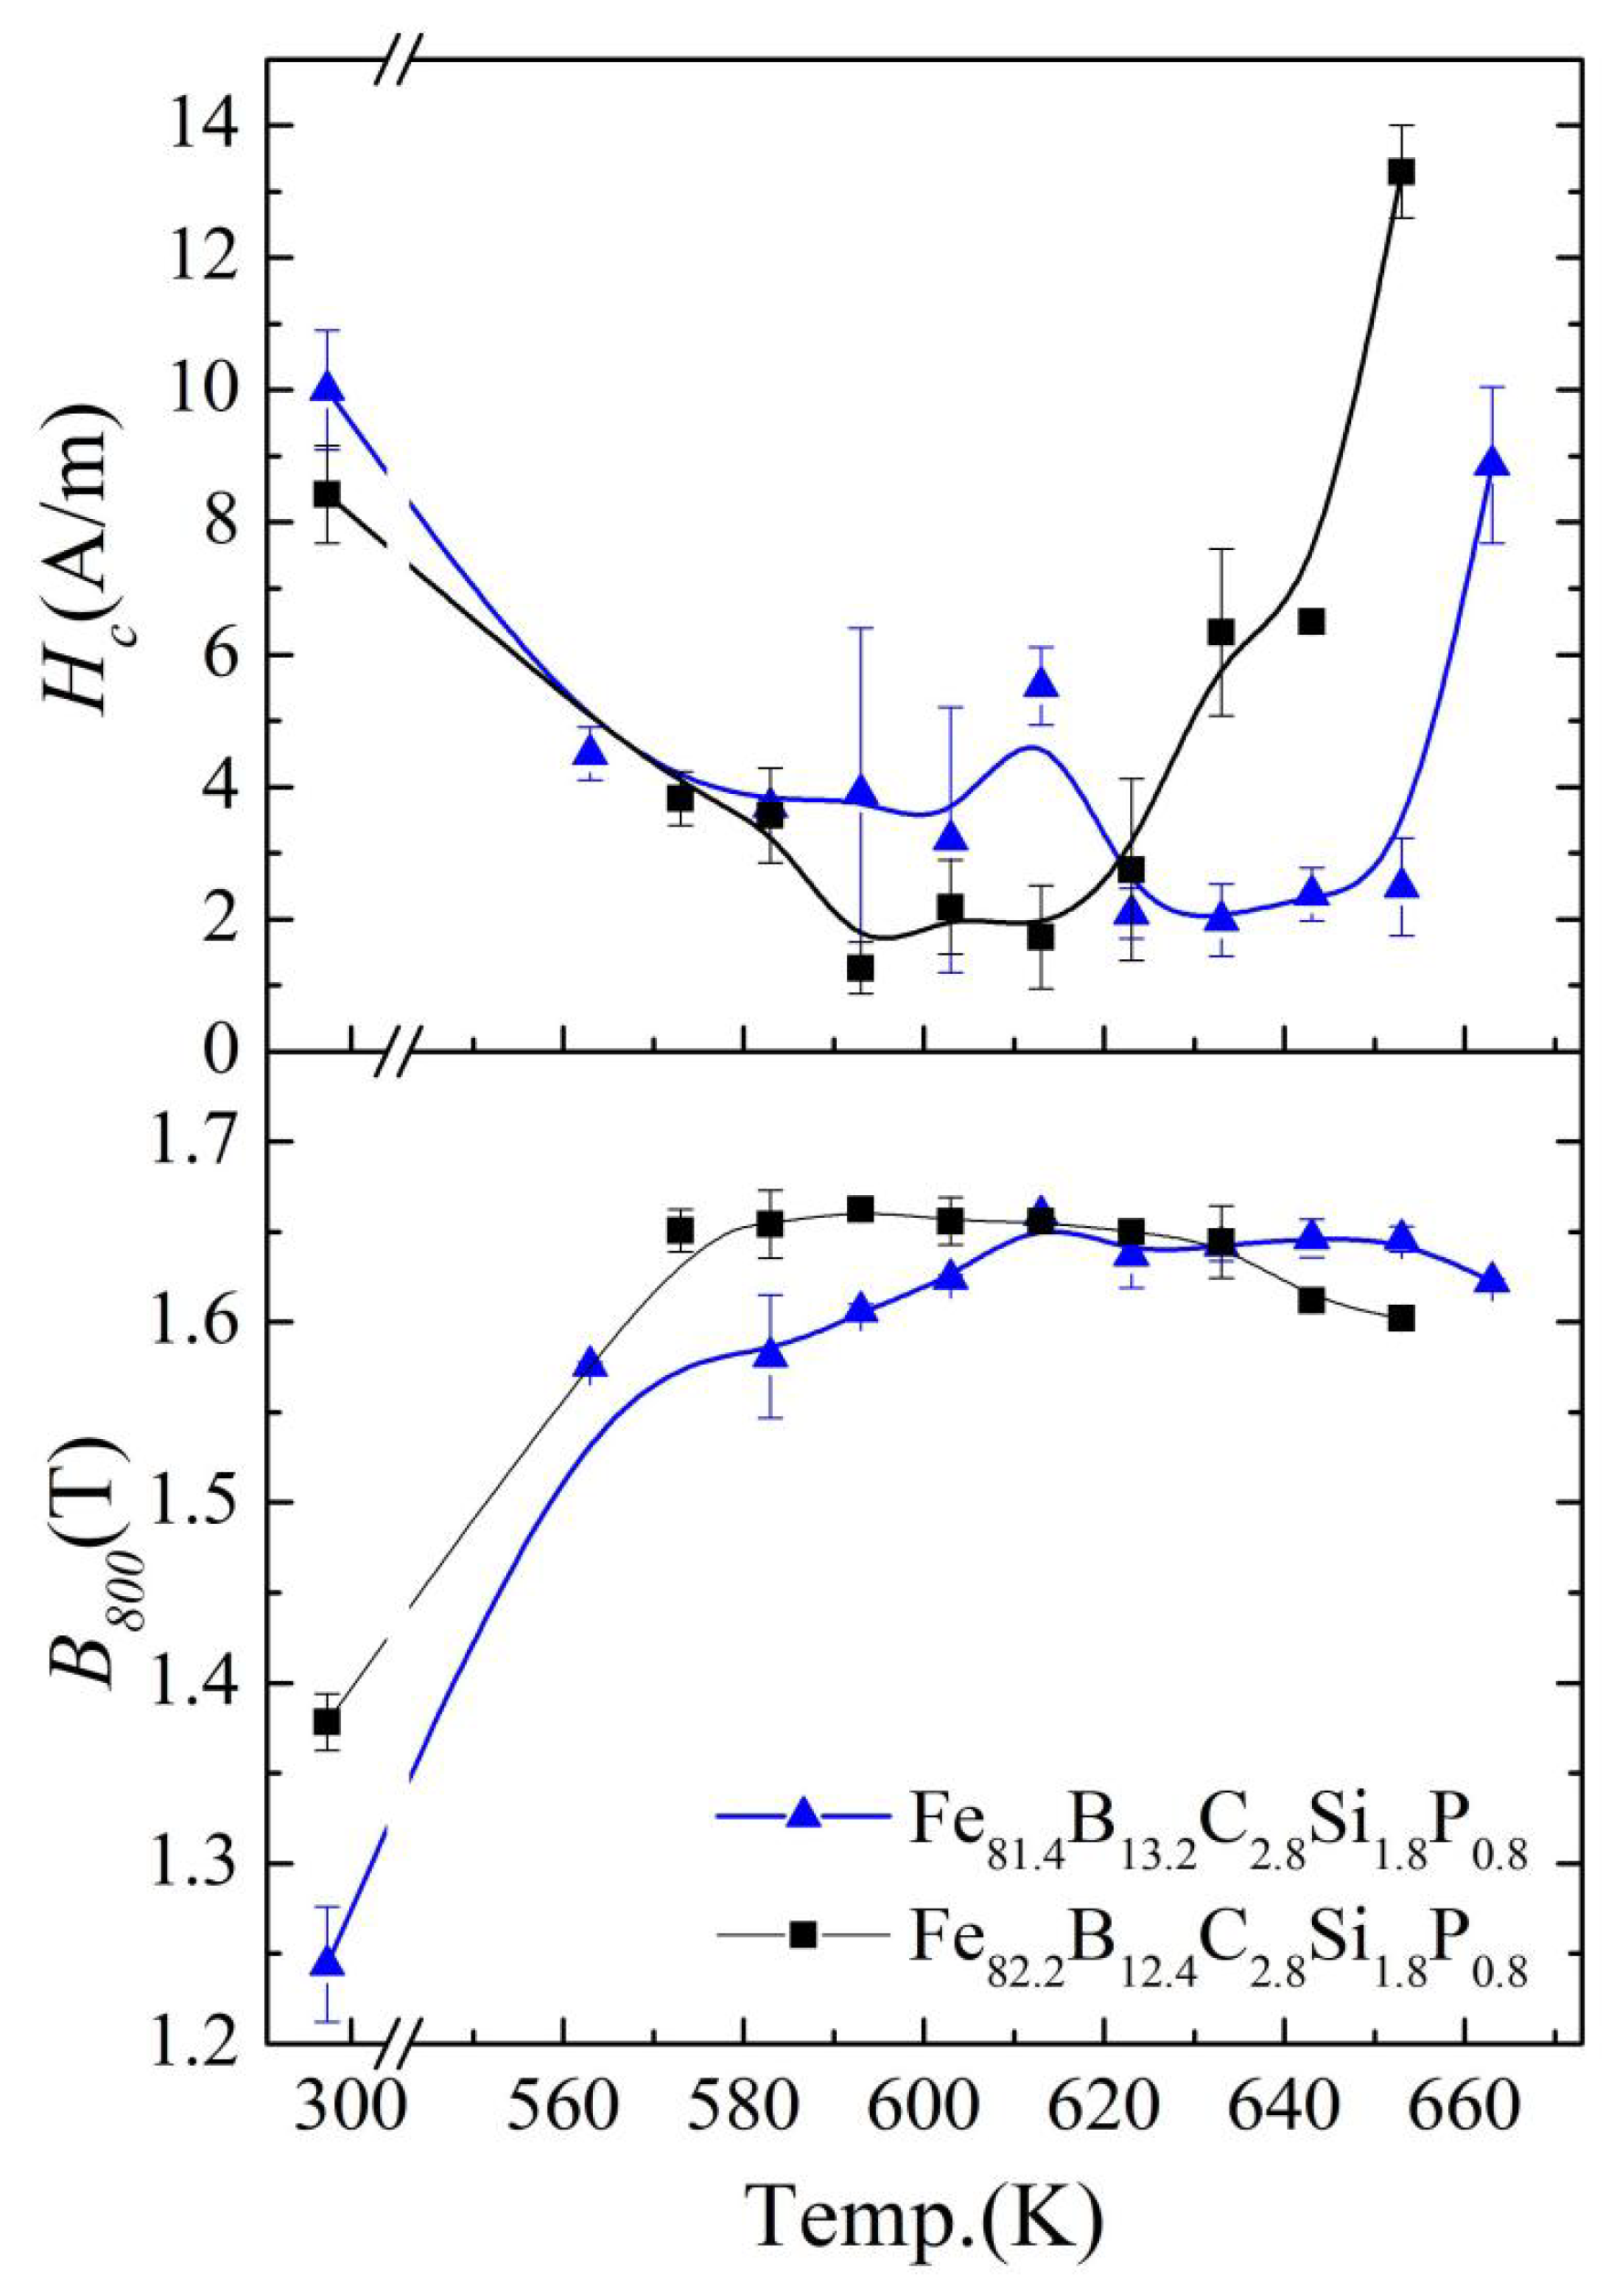
The amorphous ribbons were annealed at different temperatures from 563 K to 663 K with an interval of 10 K. Figure 4 shows the annealing temperature dependence of coercivity (Hc) and the magnetic flux density measured at an applied magnetic field of 800 A/m (B800) for the Fe81.4B13.2C2.8Si1.8P0.8 and Fe82.2B12.4C2.8Si1.8P0.8 amorphous alloy ribbons after normal annealing for 90 min. With the increase in the annealing temperature, the Hc decreased to a low point at first, then maintained a stable state and finally increased rapidly. The stable region with the lowest Hc obtained in the experiment is defined as the optimal annealing temperature range. The lowest temperature of the optimum annealing temperature range is denoted as Ta0, and the highest temperature is denoted as Tam. The Ta0 and Tam of the Fe81.4 amorphous alloy were 623 K and 653 K, respectively, while the Ta0 and Tam of the Fe82.2 amorphous alloy were 593 K and 623 K, respectively. As the annealing temperature increased, the B800 of the alloys initially increased then reached a plateau and finally declined. B800 is a comprehensive reflection of the Bs, Hc, and permeability [25]. The initial temperatures of the B800 plateau were 613 K and 573 K for Fe81.4 and Fe82.2, respectively, which are lower than Ta0. However, the end temperature of the B800 plateau was equal to Tam. The reduction in Hc was due to the relaxation of stress and the reduction in the free volume [6]. However, spontaneous magnetization can affect the relaxation progress of amorphous alloys [5]. Therefore, the beginning of the optimum annealing temperature range of Hc did not coincide with the starting temperature of relaxation. The present results show that both the Fe81.4 and Fe82.2 amorphous alloys exhibited an optimized annealing temperature range of 30 K, together with B800 and Hc values of 1.64–1.65 T and 2.0–2.5 A/m and 1.65–1.66 T and 1.3–2.7 A/m, respectively. This indicates that, after annealing, the developed amorphous alloys were excellent soft magnetic materials, exhibiting a high B800 and low Hc (Figure 4).
In order to understand the effect of elements on the magnetic property, the temperature dependence of the saturation flux density (Bs) for the Fe81.4 and Fe82.2 amorphous alloys was obtained and studied (Figure 5). At a temperature of 5 K, the Bs values of the Fe81.4 and Fe82.2 amorphous alloys were 1.84 T and 1.92 T, respectively. At a temperature of 5 K, the Bs values of the Fe81.4 and Fe82.2 amorphous alloys were 1.84 T and 1.92 T, respectively. When the Fe content increased, the proportion of ferromagnetic atoms increased; thus, the total magnetic moment increased, leading to an increase in the Bs near 0 K [18,26]. As the temperature increased, the atomic thermal motion increased. In ferromagnetic materials, the thermal motion of atoms disturbs the spontaneous magnetization of atomic magnetic moments [24]. As a result, the Bs of the Fe81.4 and Fe82.2 amorphous alloys decreased continuously with the increase in temperature, until it reached the lowest point. The temperature with the lowest Bs is denoted as Tx0. When the temperature exceeded Tx0, the Bs began to increase, which was caused by crystallization of the amorphous alloys. Finally, the Bs decreased again because the spontaneous magnetization of α-Fe decreased rapidly. In a sense, Tx0 is the temperature at which crystallization is observed on the Bs(T)–T curve to have a noticeable effect on the magnetic properties.
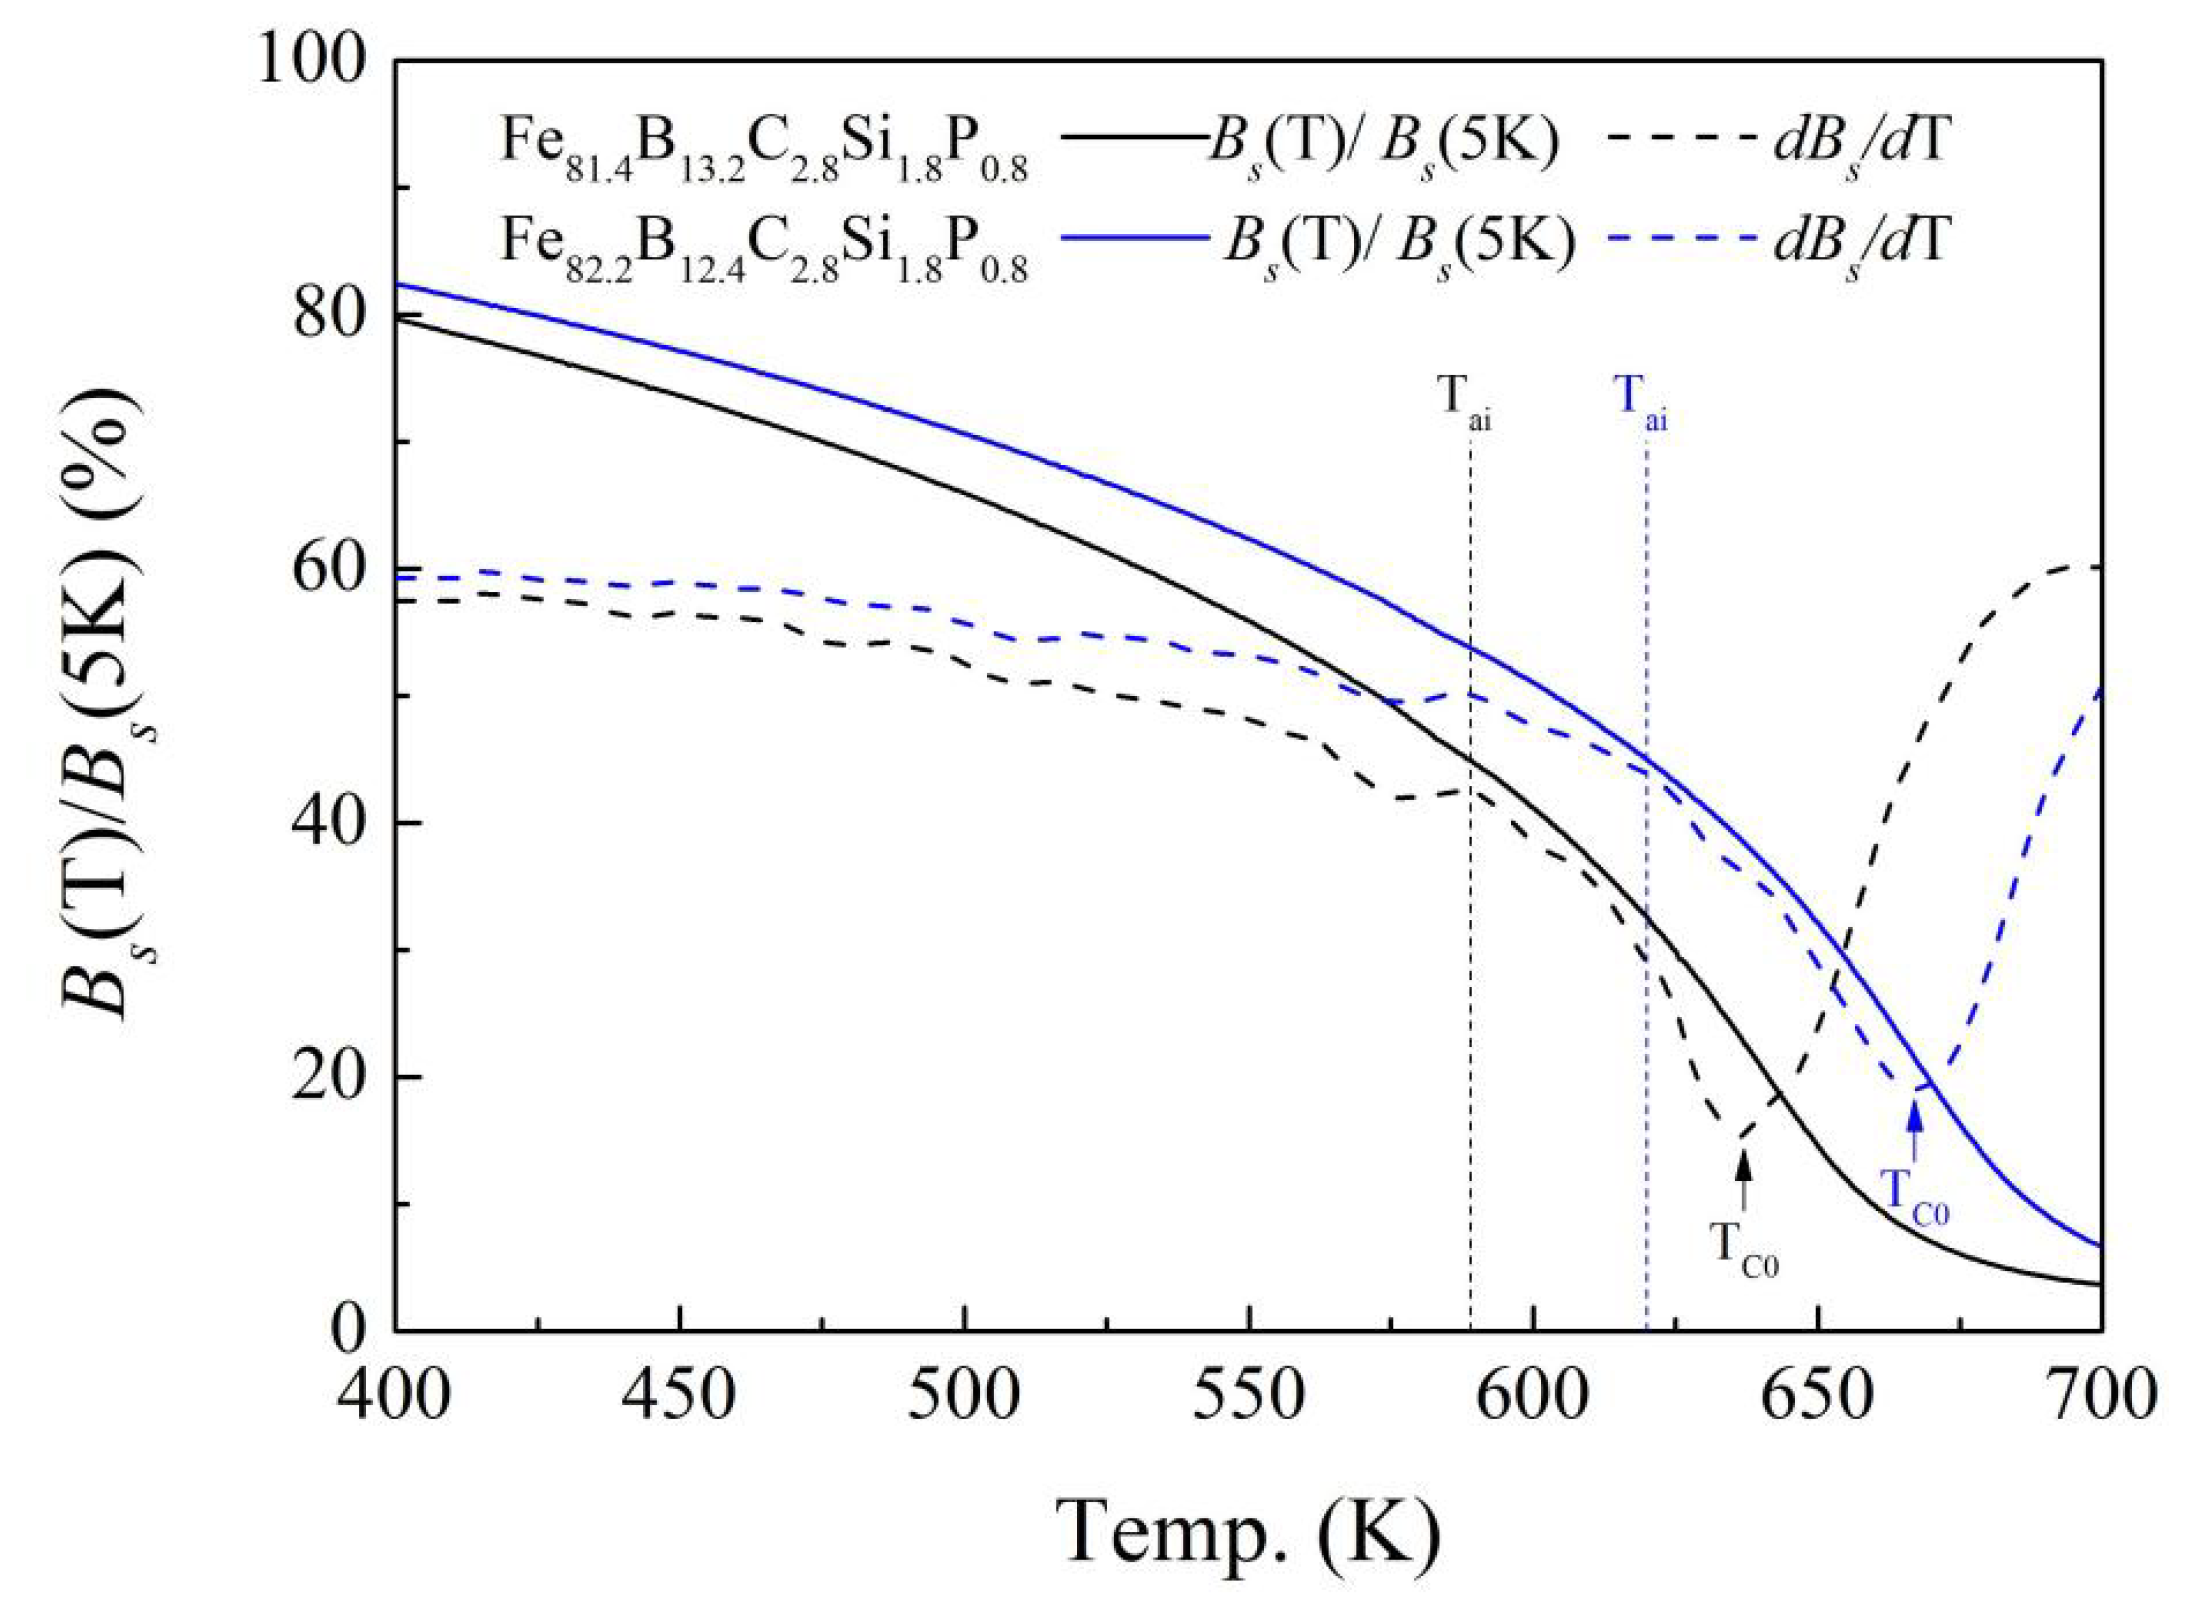
The shape of the Bs(T)–T curve is related to the strength of the exchange interaction [18,24]. In order to visualize the declining rate of the Bs with increasing temperature, the reduced saturation flux density Bs(T)/Bs(5K) as a function of temperature (T) and the derived first derivative of Bs with respect to T are shown in Figure 6. For the Fe81.4 and Fe82.2 amorphous alloys, the Bs(T)/Bs(5K)–T and dBs/dT–T curves are similar. At first, the Bs(T)/Bs(5K) and dBs/dT decreased slowly with the increase in temperature. When the temperature continued rising to near the temperature denoted as Tai, at which Bs(T)/Bs(5K) = 45%, the value of dBs/dT began to decrease rapidly. Increasing the temperature further, dBs/dT decreased further and reached the lowest level. The corresponding temperature is denoted as TC0 (as shown in Figure 6). When the temperature was higher than TC0 but lower than Tx0, dBs/dT gradually increased with the increase in temperature. Meanwhile, the decrease in Bs(T)/Bs(5K) developed slowly. In other words, TC0 represents the temperature at which the spontaneous magnetization of the alloy changed the most dramatically, i.e., the Curie temperature (the temperature at which ferromagnetism transforms into paramagnetism). The value of TC0 was indeed close to the Curie temperature obtained from the DSC curve (TC), as shown in Table 1.
Although the Bs(T)–T, Bs(T)/Bs(5K)–T, and dBs/dT–T curves of the Fe81.4 and Fe82.2 amorphous alloys are similar, the Tai and TC0 of the Fe82.2 amorphous alloy were lower than those of the Fe81.4 amorphous alloy. This is due to the difference in the strength of the exchange interaction for the Fe81.4 and Fe82.2 amorphous alloys. The metalloid content of the Fe82.2 amorphous alloy was lower than that of the Fe81.4 amorphous alloy. The decrease in the metalloid content causes a reduction of the interatomic distance between the Fe atoms [18,24]. According to the Bethe–Slater curve [24], the strength of the exchange interaction will decrease with the decrease in the interatomic distances between Fe atoms. Therefore, the dBs/dT increases, resulting in a decrease in Tai and TC0.
By examining and analyzing the results shown in Figure 4, Figure 5 and Figure 6 , it is not difficult to find that Ta0 is approximate to Tai. This may have been caused by the effect of spontaneous magnetization on the alloy relaxation process of these amorphous alloys. When the annealing temperature is lower than Tai but sufficient to allow short-distance movement of the atoms, the thermal motion of the atoms may cause changes in the local structure. On the one hand, long-term heat treatment at this temperature is enough to eliminate the influence of stress on Hc, so that Hc can be reduced compared to the cast state. On the other hand, the spontaneous magnetization is still high. Spontaneous magnetization will strengthen the local magnetic anisotropy [5,9,27], so it is difficult to achieve the optimal low coercivity after annealing. When the annealing temperature is higher than Tai, the decline in the dBs/dT value begins to accelerate, and the Bs(T) decreases to less than half of the Bs near 0 K (Bs(T)/Bs(5K) ≤ 45%), which demonstrates that the ferromagnetism of amorphous alloys is greatly weakened. The effect of the inner magnetic field generated by spontaneous magnetization on the relaxation behavior becomes negligible. The magnetic anisotropy of the alloy is reduced, and the soft magnetic properties are greatly improved. Based on the above analysis, we provide a simple way to determine the lowest temperature Tai (Bs(Tai)/Bs(5K) = 45%) of the optimum annealing temperature range for the Fe-based amorphous alloys with a relatively low Curie temperature, similar to the current amorphous alloys.
The magnetic domain structures of the amorphous alloy samples that experienced different annealing processes were characterized using a magneto-optical Kerr microscope, and the effect of spontaneous magnetization on the soft magnetic properties is discussed. Figure 7 shows the domain structures of the as-spun, NA-633 K-annealed and NA-603 K-annealed Fe81.4B13.2C2.8Si1.8P0.8 amorphous alloy samples in the demagnetized state. There were two types of typical domains in the as-spun Fe81.4 amorphous alloy sample (Figure 7a): wide-curved domains and narrow fingerprint domains. These are caused by tensile stress and compressive stress [5,28,29]. After normal annealing at 633 K, the domains of the sample appeared as a broad strip pattern oriented slightly away from the length direction of the amorphous ribbon, demonstrating a low domain energy, homogenous structure, and low stress state [30]. In contrast, more domain branches and rugged edges were present in the magnetic domain structure of the NA-603 K Fe81.4 amorphous alloy sample, and their direction deviated from the length direction, indicating a strong pinning effect. This phenomenon can be attributed to the magnetic anisotropy induced by spontaneous magnetization during the annealing process, because the annealing temperature was lower than Tai [5,9,27]. This shows that the annealing temperature above Tai is important for removing the pinning effect to obtain a low Hc, as shown in Figure 4.
Tam is the temperature related to the crystallization of amorphous alloys; above this, after annealing for a certain time, a volume fraction of α-Fe nanocrystalline would precipitate from the amorphous matrix of the alloys. Examples are shown in Figure 1: a few weak but sharp diffraction peaks corresponding to the α-Fe crystalline phase can be detected in the smooth-side XRD patterns of the Fe81.4 ribbons annealed at 663 K and the Fe82.2 ribbons annealed at 633 K for 90 min. The HRTEM image in Figure 2 shows that the as-spun Fe82.2 ribbon is completely amorphous with no pre-existing tiny α-Fe grains before annealing. Thus, the crystallization of Fe82.2 ribbons annealed at 633 K for 90 min is entirely due to annealing. It has been confirmed that partial crystallization at the surface increases the anisotropy, resulting in an increase in the Hc and deterioration of the soft magnetic properties [31,32,33]. Additionally, the Curie temperature of the α-Fe cluster is higher than that of amorphous alloys, and it further increases with the cluster size and magnetic interaction [9,31], which aggravates the effect of spontaneous magnetization on the relaxation process.
It is well known that amorphous alloys are of a thermodynamic metastable state. They will eventually crystallize as long as the annealing time is long enough at a high enough temperature. Moreover, the higher the annealing temperature is, the shorter the time required for crystallization. Therefore, the Tam is actually also related to the annealing time. When the annealing time is 90 min, crystallization of the Fe82.2 amorphous alloy occurs at 633 K, resulting in the Hc increasing to 6.3 A/m. However, after annealing at 633 K for 60 min, the Hc of the amorphous alloy is 1.4 A/m; that is, the highest temperature of the optimum annealing temperature range for 60 min is not lower than 633 K.
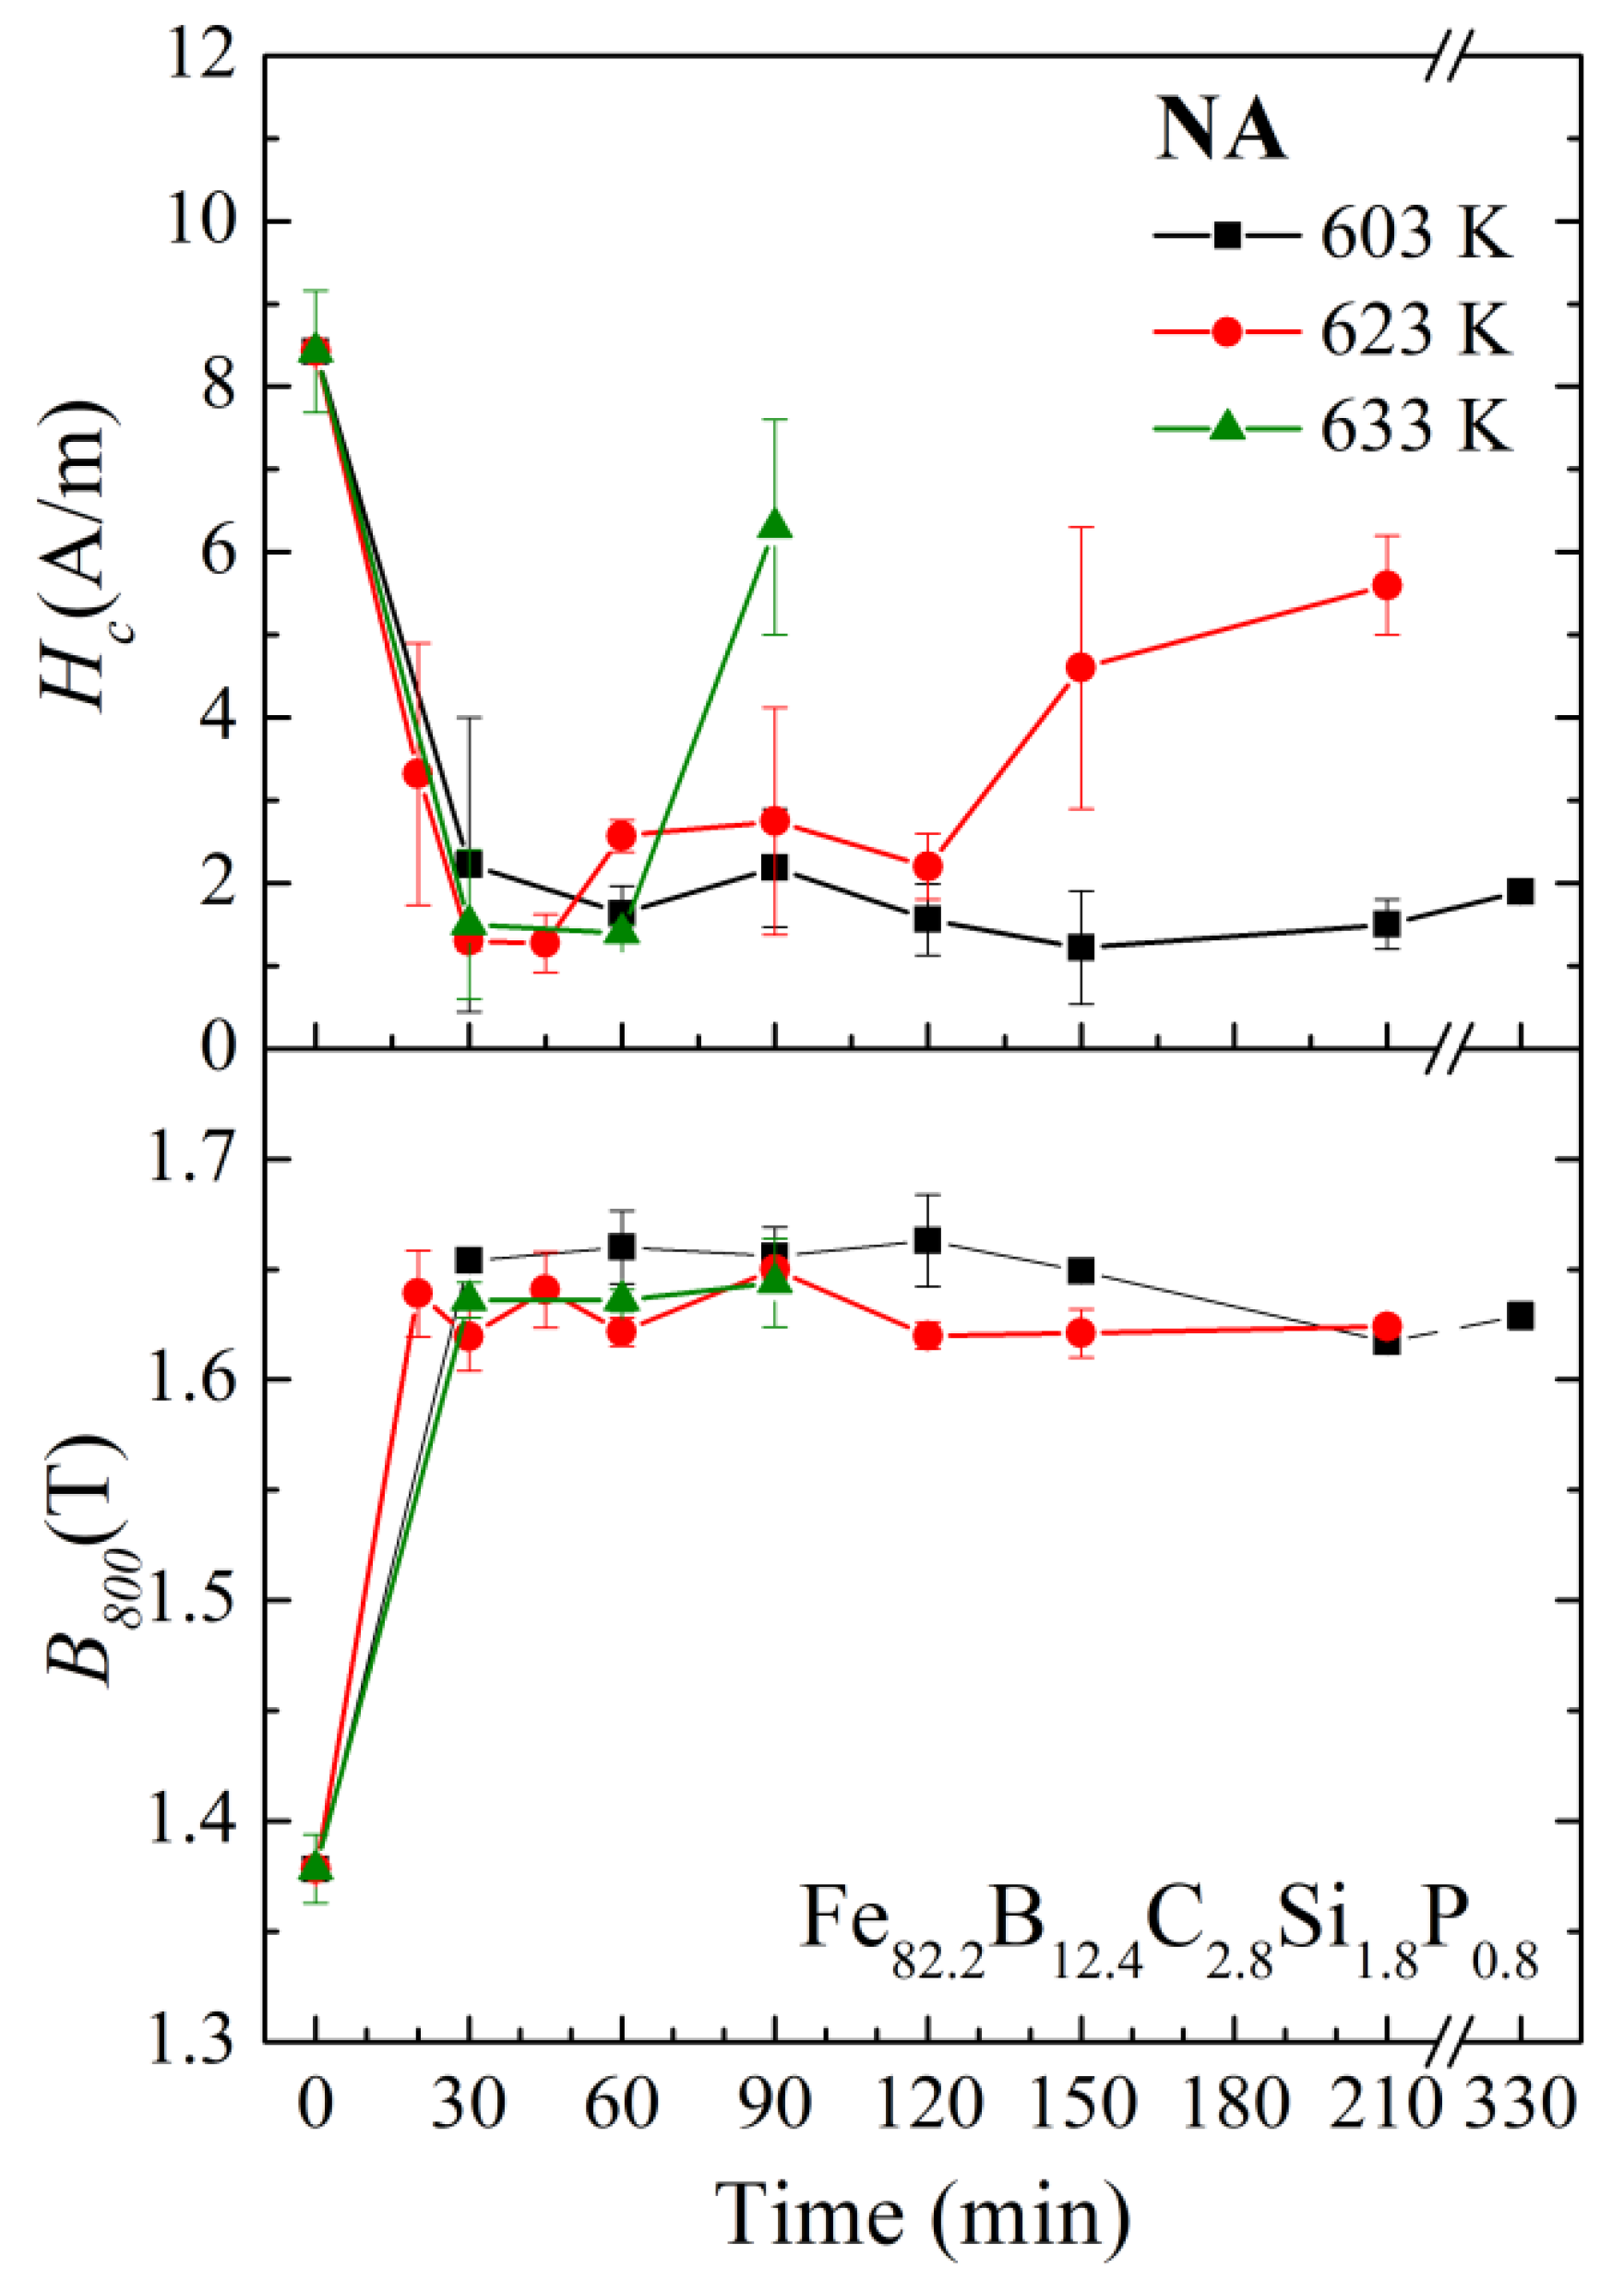
Figure 8 illustrates the annealing time dependence of Hc and B800 for the Fe82.2B12.4C2.8Si1.8P0.8 amorphous alloy ribbons with normal annealing at different temperatures. Three different annealing temperatures were selected for the Fe82.2 amorphous alloy: Ta1 = 603 K, Ta2 = Tam (90 min) = 623 K, and Ta3 = 633 K, respectively. Overall, with the increase in the annealing time, the B800 of the alloys increased initially and then remained relatively stable. When Ta3 = 633 K, the Hc first decreased rapidly as the annealing time increased, then remained stable for a short time (30–60 min), and rose quickly after the annealing time reached 90 min. When Ta2 = 623 K, the Hc showed a concave shape with respect to annealing time: the Hc first decreased rapidly, then decreased to 1.3 A/m after 30 min, and remained below 3 A/m within 30–120 min. Up to an annealing time of 150 min, the Hc rose to 4.6 A/m. However, when the annealing temperature decreased to Ta1 (603 K), the coercivity Hc of the annealed samples exhibited very strong stability with the increase in annealing time. Even when the annealing time was extended to 330 min, the Hc was still only 1.9 A/m. For the Fe82.2 amorphous alloy, Ta1 was slightly higher than Tai (Ta1 − Tai < 15 K).
The annealing time dependence of Hc and B800 for the Fe81.4B13.2C2.8Si1.8P0.8 amorphous alloy ribbons with normal annealing at different temperatures is shown in Figure 9. Two different annealing temperatures were selected for the Fe81.4 amorphous alloy, which were Ta4 = 633 K and Ta5 = 663 K, respectively. For both annealing temperatures, with the increase in annealing time, the B800 increased rapidly at first and then became stable. When the annealing temperature was Ta4 = 633 K, the Hc rapidly decreased to about 1 A/m and then slowly increased. The Hc remained at 2.7 A/m after 150 min of annealing. However, when the annealing temperature increased to Ta5 = 663 K, the Hc remained relatively stable only within 30–60 min, and at this time, the Hc was 2.8–3.7 A/m, which was significantly higher than that at 633 K. Although the Hc of the Fe81.4 amorphous alloy shown in Figure 9 is higher than that of the Fe82.2 amorphous alloy shown in Figure 8, it can also be seen that when the annealing temperature is selected properly (slightly higher than Tai), the soft magnetic properties can remain relatively stable for a longer period of time.
The increase in Hc in the long-term annealed samples shown in Figure 8 and Figure 9 is also due to the formation of nanocrystalline clusters and the growth of these clusters. Figure 10 shows the smooth-side XRD patterns of the ribbons with different annealing times and temperatures for the Fe81.4 and Fe82.2 amorphous alloys. As shown in Figure 10, few weak diffraction peaks corresponding to the α-Fe crystalline phase can be detected in the smooth-side XRD patterns of the Fe81.4 ribbons annealed at 633 K for 210 min and the Fe82.2 ribbons annealed at 623 K for 150 min.
Figure 11 shows the magnetic domain structures of the as-spun, NA-623K-45 min-annealed and NA-623K-210 min annealed Fe82.2B12.4C2.8Si1.8P0.8 amorphous alloy samples in the demagnetized state. Wide-curved domains and narrow fingerprint domains, caused by tensile stress and compressive stress [5,29], are observed in the as-spun Fe82.2 amorphous alloy sample (Figure 11a). The domains of the sample annealing at 623 K for 45 min appear as a broad strip pattern oriented slightly away from the length direction of the amorphous ribbon, demonstrating the low domain energy, homogenous structure, and low stress state. However, for the sample annealed at 623K for 210 min, the magnetic domain structure with rugged edges can be clearly observed (Figure 11c), which is quite different from those in the NA-623 K-45 min annealed sample (Figure 11b). This indicates that a strong pinning effect exists, induced by partial crystallization resulting from long-term annealing (see Figure 10b) [5,9,27,32].
The above results indicate that when the annealing temperature is selected properly (slightly higher than Tai), excellent and stable soft magnetic properties of amorphous alloys can be obtained through annealing even if the annealing is maintained for a very long time. Annealing slightly above Tai could eliminate the influence of stress and the internal magnetic field on the Hc. In addition, a relatively low annealing temperature could reduce the possibility of crystallization. This result is of great significance for designing an annealing process for industrial applications.
4. Conclusions
The effects of annealing process parameters, including the annealing temperature and time, on the soft magnetic properties and magnetic domain structures of Fe81.4B13.2C2.8Si1.8P0.8 and Fe82.2B12.4C2.8Si1.8P0.8 amorphous alloys were systematically investigated, and the conclusions are summarized as follows:
- (1)
- Fe81.4B13.2C2.8Si1.8P0.8 and Fe82.2B12.4C2.8Si1.8P0.8 amorphous alloys were designed and prepared. This revealed that a lowest and highest temperature, denoted as Ta0 and Tam, respectively, exists for the optimum annealing of the amorphous alloys. The Hc of the Fe81.4 and Fe82.2 amorphous alloys annealed at Ta0–Tam for 90 min was 1.3–2.7 A/m, together with the B800 of 1.64–1.66 T. Ta0 is determined by the variation in the magnetic properties with temperature. Tam is the temperature related to the crystallization of amorphous alloys.
- (2)
- It was found that on the Bs(T)–T curve, there is a temperature Tai at which the dBs/dT begins to decrease rapidly, and Bs(Tai)/Bs(5K) = 45%. When the amorphous alloys were annealed slightly above Tai, the effect of the inner magnetic field generated by spontaneous magnetization on the relaxation behavior became very weak. That is, the temperature Tai could be employed as a characteristic temperature. Slightly above Tai, an optimized annealing temperature Ta0 for the Fe-based amorphous alloys with a relatively low Curie temperature, similar to the studied alloys, could be determined quickly.
- (3)
- When the annealing temperature was selected properly (slightly higher than Tai), the soft magnetic properties of amorphous alloys could remain excellent and stable even if annealed for a very long time. The Hc of the Fe82.2B12.4C2.8Si1.8P0.8 amorphous alloy annealed at Ta1 = 603 K was only 1.9 A/m, while the annealing time was extended to 330 min.
Author Contributions
Conceptualization, J.J. and K.Y.; investigation, J.J., Y.W. and R.W.; data curation, J.J., Y.W., R.W. and W.G.; formal analysis, J.J., Y.W., L.S., R.W., W.G., H.B., Y.S., N.C. and K.Y.; visualization, J.J.; writing—original draft, J.J.; writing—review and editing, J.J., K.Y. and L.S. All authors have read and agreed to the published version of the manuscript.
Funding
This research was funded by the National Key Basic Research and Development Program, grant numbers 2022YFB3804100 and 2022YFB4200800, and the National Natural Science Foundation of China, grant numbers 52271148 and 51871129.
Institutional Review Board Statement
Not applicable.
Informed Consent Statement
Not applicable.
Data Availability Statement
The raw data supporting the conclusions of this article will be made available by the authors upon request.
Conflicts of Interest
The authors declare no conflicts of interest.
References
- Hasegawa, R. Application of amorphous magnetic alloys. Mater. Sci. Eng. A 2004, 375, 90–97. [Google Scholar] [CrossRef]
- Herzer, G. Modern soft magnets: Amorphous and nanocrystalline materials. Acta Mater. 2013, 61, 718–734. [Google Scholar] [CrossRef]
- Milanez, D.H.; Faria, L.I.L.; Leiva, D.R.; Kiminami, C.S.; Botta, W.J. Assessing technological developments in amorphous/glassy metallic alloys using patent indicators. J. Alloys Compd. 2017, 716, 330–335. [Google Scholar] [CrossRef]
- Silveyra, J.M.; Ferrara, E.; Huber, D.L.; Monson, T.C. Soft magnetic materials for a sustainable and electrified world. Science 2018, 362, 418–426. [Google Scholar] [CrossRef] [PubMed]
- Zhao, C.L.; Wang, A.D.; Yue, S.Q.; Liu, T.; He, A.N.; Chang, C.T.; Wang, X.M.; Liu, C.T. Significant improvement of soft magnetic properties for Fe(Co) BPSiC amorphous alloys by magnetic field annealing. J. Alloys Compd. 2018, 742, 220–225. [Google Scholar] [CrossRef]
- Kronmuller, H. Micromagnetism and Microstructure of Amorphous-Alloys. J. Appl. Phys. 1981, 52, 1859–1864. [Google Scholar] [CrossRef]
- Kronmuller, H.; Groger, B. Domains, Domain-Walls and the Coercive Field of Amorphous Ferromagnets. J. Phys. 1981, 42, 1285–1292. [Google Scholar] [CrossRef]
- Li, Z.; Yao, K.F.; Liu, T.C.; Li, X.; Wang, S. Effect of Annealing on the Magnetic Properties of FeCoNiCuNbSiB Soft Magnetic Alloys. Front. Mater. 2022, 8, 805609. [Google Scholar] [CrossRef]
- Li, H.; He, A.N.; Wang, A.D.; Xie, L.; Li, Q.; Zhao, C.L.; Zhang, G.Y.; Chen, P.B. Improvement of soft magnetic properties for distinctly high Fe content amorphous alloys via longitudinal magnetic field annealing. J. Magn. Magn. Mater. 2019, 471, 110–115. [Google Scholar] [CrossRef]
- Tejedor, M.; García, J.A.; Carrizo, J.; Elbaile, L.; Santos, J.D. Stress relief and magnetic properties of magnetostrictive Fe79B16Si5 amorphous magnetic ribbons. J. Magn. Magn. Mater. 1999, 202, 485–491. [Google Scholar] [CrossRef]
- Makino, A.; Kubota, T.; Chang, C.; Makabe, M.; Inoue, A. FeSiBP bulk metallic glasses with high magnetization and excellent magnetic softness. J. Magn. Magn. Mater. 2008, 320, 2499–2503. [Google Scholar] [CrossRef]
- Liang, X.F.; He, A.N.; Wang, A.D.; Pang, J.; Wang, C.J.; Chang, C.T.; Qiu, K.Q.; Wang, X.M.; Liu, C.T. Fe content dependence of magnetic properties and bending ductility of FeSiBPC amorphous alloy ribbons. J. Alloys Compd. 2017, 694, 1260–1264. [Google Scholar] [CrossRef]
- Yue, S.; Zhang, H.; Cheng, R.; Wang, A.; Dong, Y.; He, A.; Ni, H.; Liu, C.-T. Magnetic and thermal stabilities of FeSiB eutectic amorphous alloys: Compositional effects. J. Alloys Compd. 2019, 776, 833–838. [Google Scholar] [CrossRef]
- Zhang, G.; Zhang, H.; Yue, S.; Wang, A.; He, A.; Cheng, R.; Dong, Y.; Ni, H.; Liu, C.-T. Ultra-low cost and energy-efficient production of FePCSi amorphous alloys with pretreated molten iron from a blast furnace. J. Non-Cryst. Solids 2019, 514, 108–115. [Google Scholar] [CrossRef]
- Tokmakova, E.N.; Vvedenskiy, V.Y. Effect of annealing in unsaturated magnetic field on the magnetic properties of an amorphous alloy Fe77Ni1Si9B13. J. Mater. Sci. Mater. Electron. 2023, 34, 10. [Google Scholar] [CrossRef]
- Hatta, S.; Egami, T.; Graham, C.D. Amorphous Alloys with Improved Room-Temperature Saturation Induction. IEEE Trans. Magn. 1978, 14, 1013–1015. [Google Scholar] [CrossRef]
- Wang, A.D.; Zhao, C.L.; Men, H.; He, A.N.; Chang, C.T.; Wang, X.M.; Li, R.W. Fe-based amorphous alloys for wide ribbon production with high B-s and outstanding amorphous forming ability. J. Alloys Compd. 2015, 630, 209–213. [Google Scholar] [CrossRef]
- Shi, L.X.; Hu, X.Y.; Li, Y.H.; Yuan, G.T.; Yao, K.F. The complementary effects of Fe and metalloids on the saturation magnetization of Fe-based amorphous alloys. Intermetallics 2021, 131, 107116. [Google Scholar] [CrossRef]
- Mitera, M.; Naka, M.; Masumoto, T.; Kazama, N.; Watanabe, K. Effects of Metalloids on Magnetic-Properties of Iron Based Amorphous Alloys. Phys. Status Solidi A 1978, 49, K163–K166. [Google Scholar] [CrossRef]
- Shi, L.X.; Yao, K.F. Composition design for Fe-based soft magnetic amorphous and nanocrystalline alloys with high Fe content. Mater. Des. 2020, 189, 108511. [Google Scholar] [CrossRef]
- Liu, F.J.; Yao, K.F.; Ding, H.Y. Fe-based glassy alloys with high iron content and high saturation magnetization. Intermetallics 2011, 19, 1674–1677. [Google Scholar] [CrossRef]
- Torrens-Serra, J.; Bruna, P.; Rodriguez-Viejo, J.; Roth, S.; Clavaguera-Mora, M.T. Effect of minor additions on the glass forming ability and magnetic properties of Fe-Nb-B based metallic glasses. Intermetallics 2010, 18, 773–780. [Google Scholar] [CrossRef]
- Lashgari, H.R.; Chu, D.; Xie, S.S.; Sun, H.D.; Ferry, M.; Li, S. Composition dependence of the microstructure and soft magnetic properties of Fe-based amorphous/nanocrystalline alloys: A review study. J. Non-Cryst. Solids 2014, 391, 61–82. [Google Scholar] [CrossRef]
- Cullity, B.D.; Graham, C.D. Introduction to Magnetic Materials, 2nd ed.; IEEE/Wiley: Hoboken, NJ, USA, 2009; pp. 115–149. [Google Scholar]
- Shi, L.X.; Qin, X.L.; Yao, K.F. Tailoring soft magnetic properties of Fe-based amorphous alloys through C addition. Prog. Nat. Sci. Mater. Int. 2020, 30, 208–212. [Google Scholar] [CrossRef]
- Graham, C.D.; Egami, T. Magnetic-properties of Amorphous Ribbon. IEEE Trans. Magn. 1979, 15, 1398–1403. [Google Scholar] [CrossRef]
- Suzuki, K.; Herzer, G. Magnetic-field-induced anisotropies and exchange softening in Fe-rich nanocrystalline soft magnetic alloys. Scr. Mater. 2012, 67, 548–553. [Google Scholar] [CrossRef]
- Obi, Y. The Stress Effect on Magnetic Domain Structure of Fe-Co Amorphous Alloys. Appl. Phys. 1979, 18, 119–121. [Google Scholar] [CrossRef]
- Liu, J.P. Nanoscale Magnetic Materials and Applications; Springer: New York, NY, USA, 2009; pp. 275–304. [Google Scholar]
- Azuma, D.; Hasegawa, R.; Saito, S.; Takahashi, M. Effect of residual strain in Fe-based amorphous alloys on field induced magnetic anisotropy and domain structure. J. Appl. Phys. 2013, 113, 17A339. [Google Scholar] [CrossRef]
- Bayri, N.; Kolat, V.S.; Atalay, F.E.; Atalay, S. The effect of furnace annealing and surface crystallization on the anisotropy, ΔE and magnetoimpedance effects in FeCrSiB amorphous wires. J. Phys. D Appl. Phys. 2004, 37, 3067–3072. [Google Scholar] [CrossRef]
- Fecova, L.; Richter, K.; Varga, R. Annealing Effect on Domain Wall Dynamics in Wires with Induced Gradient of Perpendicular Anisotropy. IEEE Trans. Magn. 2022, 58, 4301405. [Google Scholar] [CrossRef]
- Lopatina, E.; Soldatov, I.; Budinsky, V.; Marsilius, M.; Schultz, L.; Herzer, G.; Schäfer, R. Surface crystallization and magnetic properties of Fe84.3Cu0.7Si4B8P3 soft magnetic ribbons. Acta Mater. 2015, 96, 10–17. [Google Scholar] [CrossRef]
Figure 1.
Smooth-side XRD patterns of as-spun ribbons and ribbons with different annealing temperatures for (a) Fe81.4B13.2C2.8Si1.8P0.8 and (b) Fe82.2B12.4C2.8Si1.8P0.8 amorphous alloys.
Figure 1.
Smooth-side XRD patterns of as-spun ribbons and ribbons with different annealing temperatures for (a) Fe81.4B13.2C2.8Si1.8P0.8 and (b) Fe82.2B12.4C2.8Si1.8P0.8 amorphous alloys.

Figure 2.
High-resolution transmission electron microscope (HRTEM) image and selected-area electron diffraction (SAED) pattern of Fe82.2B12.4C2.8Si1.8P0.8 amorphous alloy.
Figure 2.
High-resolution transmission electron microscope (HRTEM) image and selected-area electron diffraction (SAED) pattern of Fe82.2B12.4C2.8Si1.8P0.8 amorphous alloy.

Figure 3.
DSC curves of Fe81.4B13.2C2.8Si1.8P0.8 and Fe82.2B12.4C2.8Si1.8P0.8 amorphous alloys at a heating rate of 0.67 K/s. The inset shows an enlarged section of the curves around the Curie temperature TC.
Figure 3.
DSC curves of Fe81.4B13.2C2.8Si1.8P0.8 and Fe82.2B12.4C2.8Si1.8P0.8 amorphous alloys at a heating rate of 0.67 K/s. The inset shows an enlarged section of the curves around the Curie temperature TC.
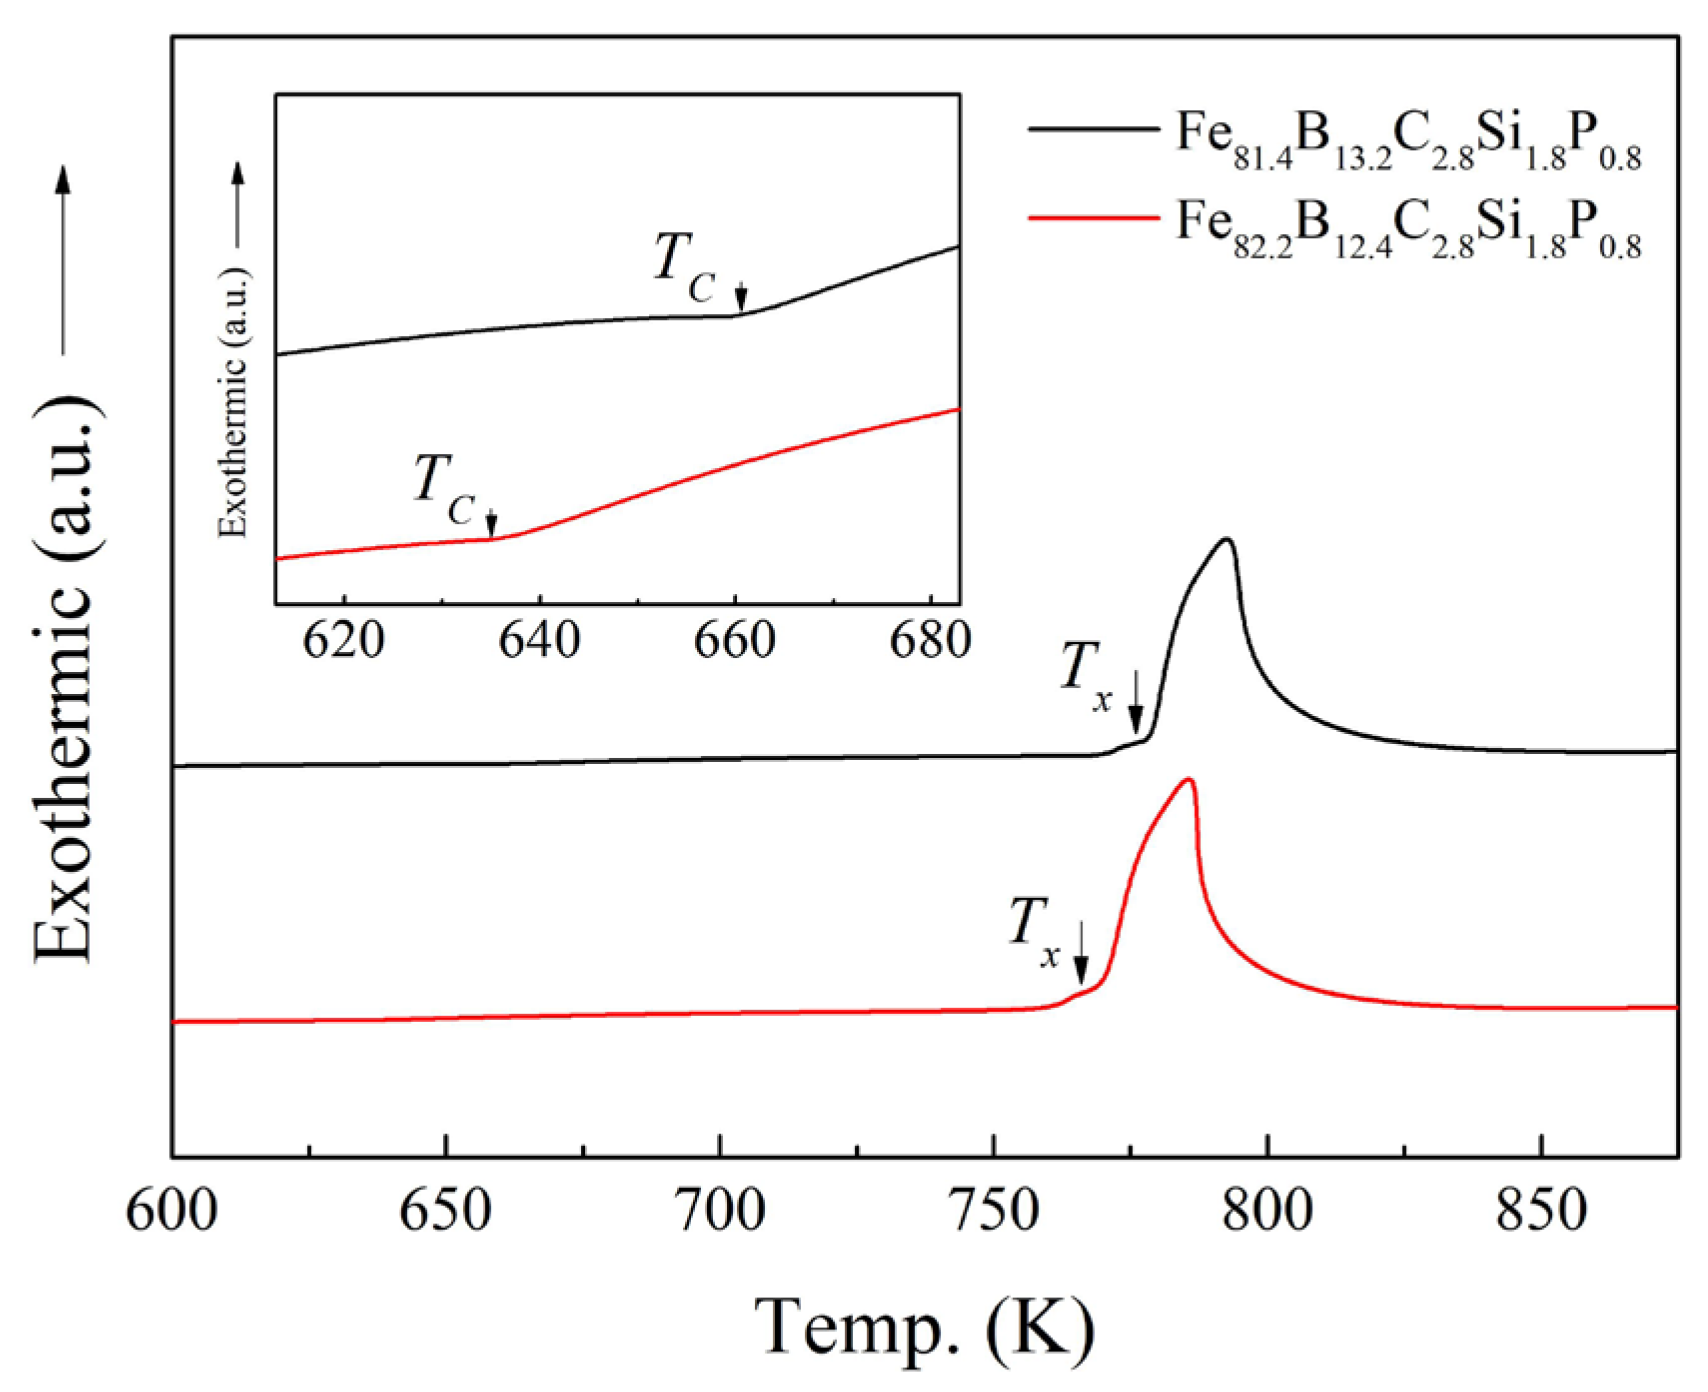
Figure 4.
Annealing temperature dependence of Hc (coercivity) and B800 for the Fe81.4B13.2C2.8Si1.8P0.8 and Fe82.2B12.4C2.8Si1.8P0.8 amorphous alloy ribbons after normal annealing for 90 min.
Figure 4.
Annealing temperature dependence of Hc (coercivity) and B800 for the Fe81.4B13.2C2.8Si1.8P0.8 and Fe82.2B12.4C2.8Si1.8P0.8 amorphous alloy ribbons after normal annealing for 90 min.

Figure 5.
Temperature dependence of Bs for Fe81.4B13.2C2.8Si1.8P0.8 and Fe82.2B12.4C2.8Si1.8P0.8 amorphous alloys.
Figure 5.
Temperature dependence of Bs for Fe81.4B13.2C2.8Si1.8P0.8 and Fe82.2B12.4C2.8Si1.8P0.8 amorphous alloys.
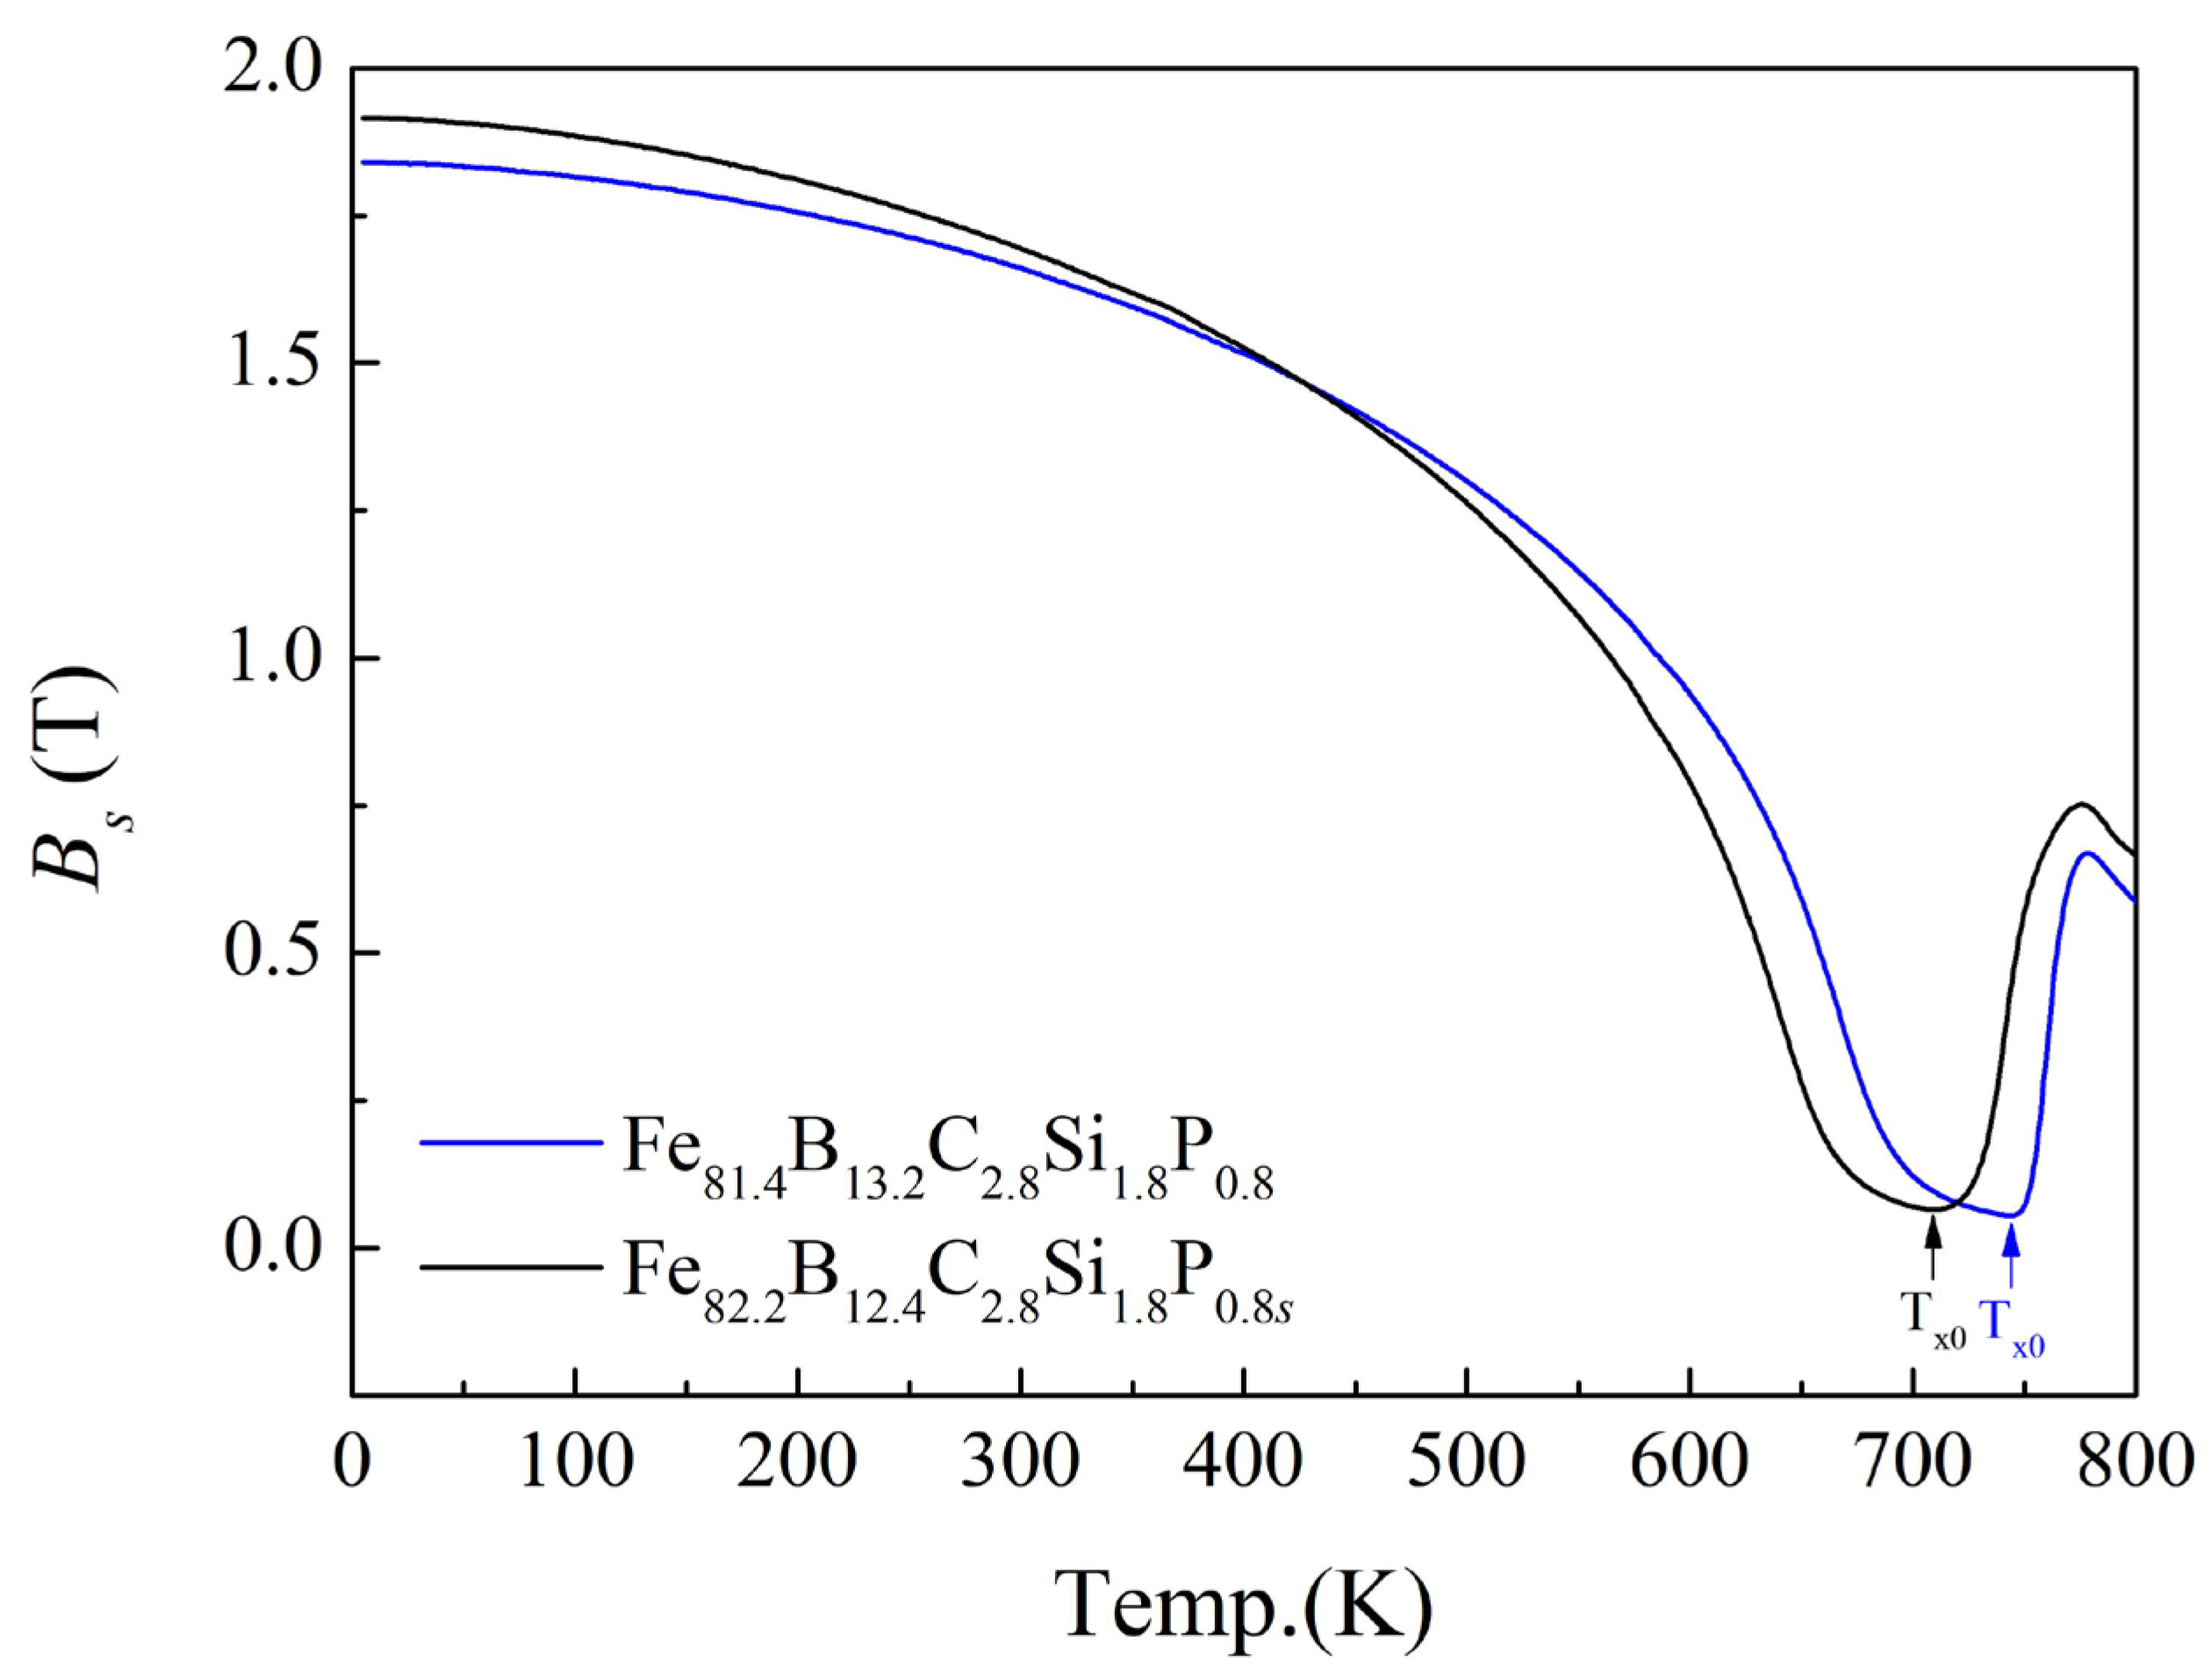
Figure 6.
Reduced saturation flux density Bs(T)/Bs(5K) as a function of temperature for Fe81.4B13.2C2.8Si1.8P0.8 and Fe82.2B12.4C2.8Si1.8P0.8 amorphous alloys. Note that the dotted lines are the first derivative of Bs with respect to temperature T for the alloys.
Figure 6.
Reduced saturation flux density Bs(T)/Bs(5K) as a function of temperature for Fe81.4B13.2C2.8Si1.8P0.8 and Fe82.2B12.4C2.8Si1.8P0.8 amorphous alloys. Note that the dotted lines are the first derivative of Bs with respect to temperature T for the alloys.

Figure 7.
Magnetic domains in the demagnetized state for Fe81.4B13.2C2.8Si1.8P0.8 amorphous alloy samples: (a) as-spun, (b) NA-633 K, and (c) NA-603 K.
Figure 7.
Magnetic domains in the demagnetized state for Fe81.4B13.2C2.8Si1.8P0.8 amorphous alloy samples: (a) as-spun, (b) NA-633 K, and (c) NA-603 K.
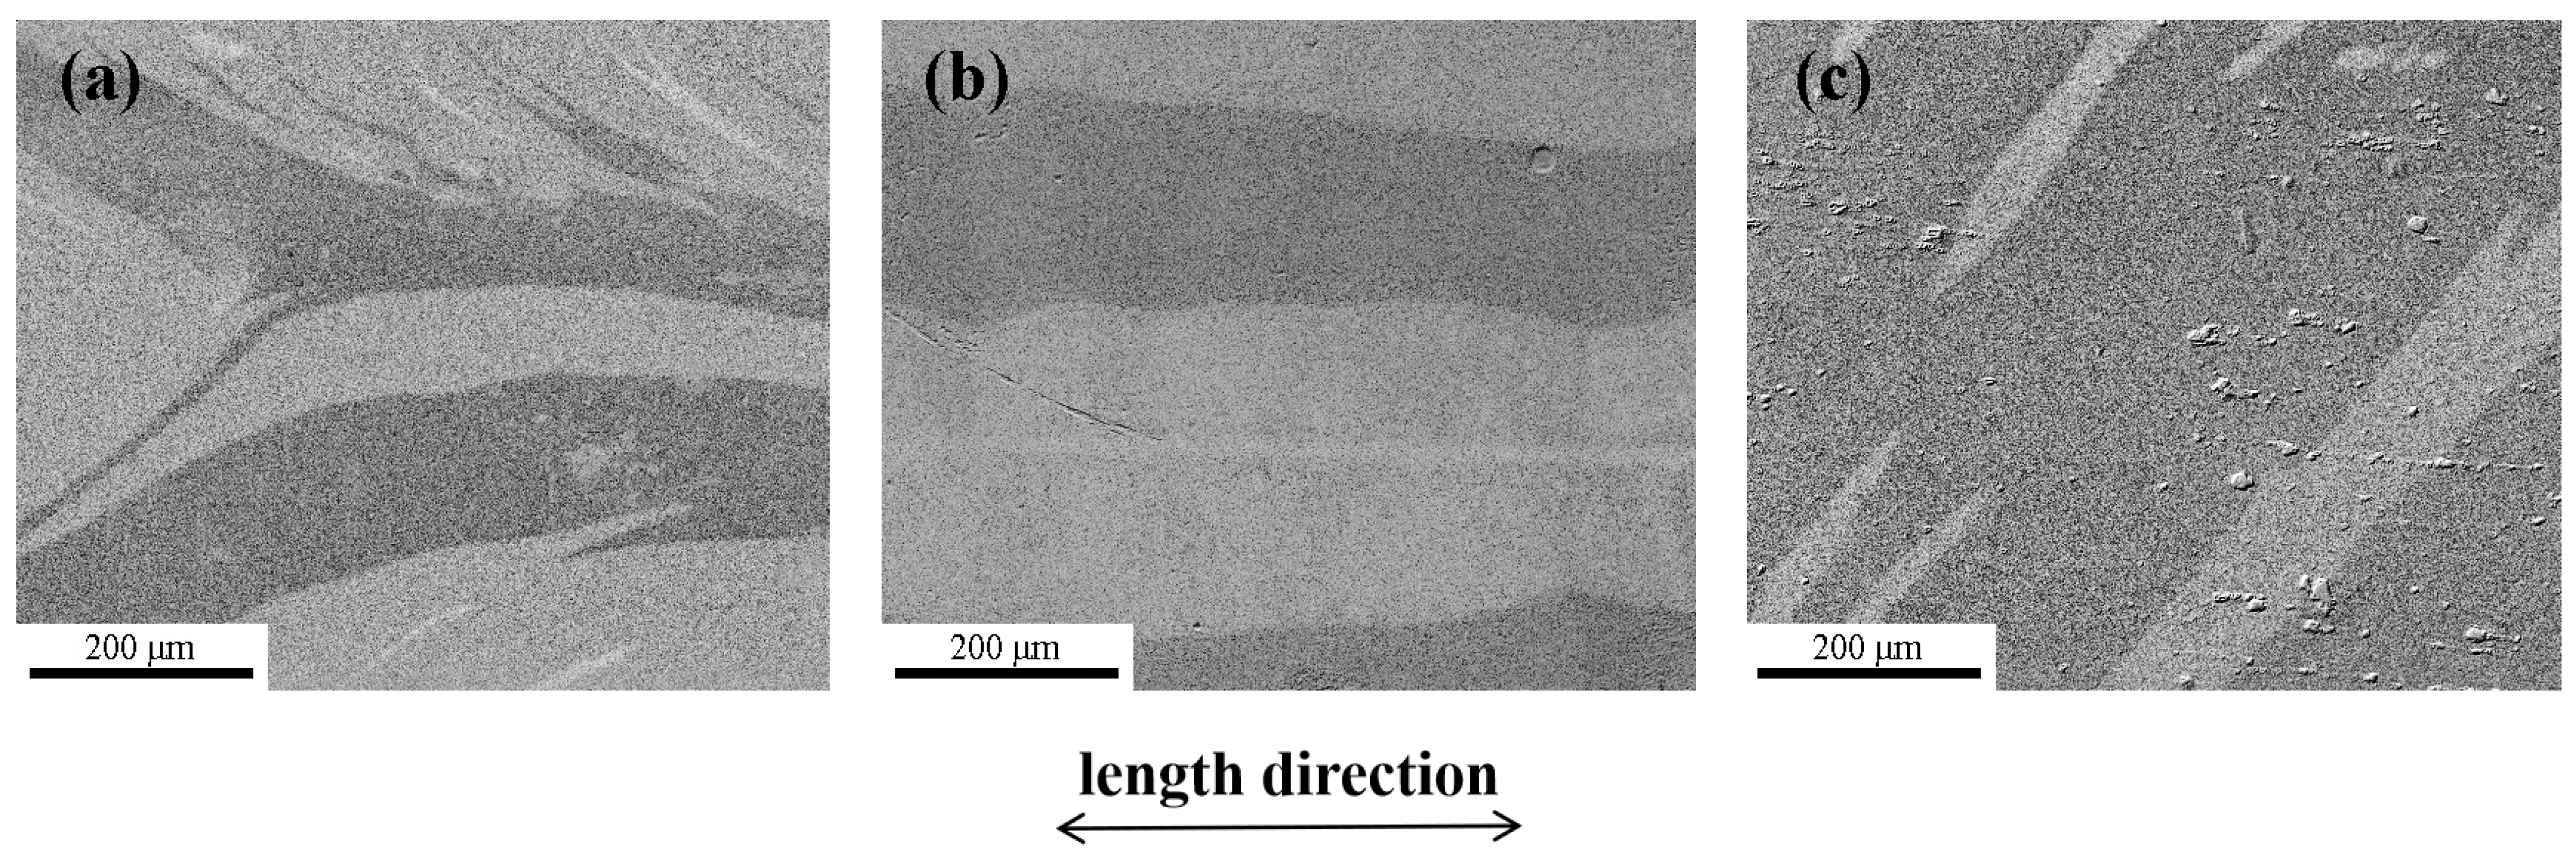
Figure 8.
Annealing time dependence of Hc and B800 for the Fe82.2B12.4C2.8Si1.8P0.8 amorphous alloy ribbons with normal annealing at different temperatures.
Figure 8.
Annealing time dependence of Hc and B800 for the Fe82.2B12.4C2.8Si1.8P0.8 amorphous alloy ribbons with normal annealing at different temperatures.

Figure 9.
Annealing time dependence of Hc and B800 for the Fe81.4B13.2C2.8Si1.8P0.8 amorphous alloy ribbons with normal annealing at different temperatures.
Figure 9.
Annealing time dependence of Hc and B800 for the Fe81.4B13.2C2.8Si1.8P0.8 amorphous alloy ribbons with normal annealing at different temperatures.
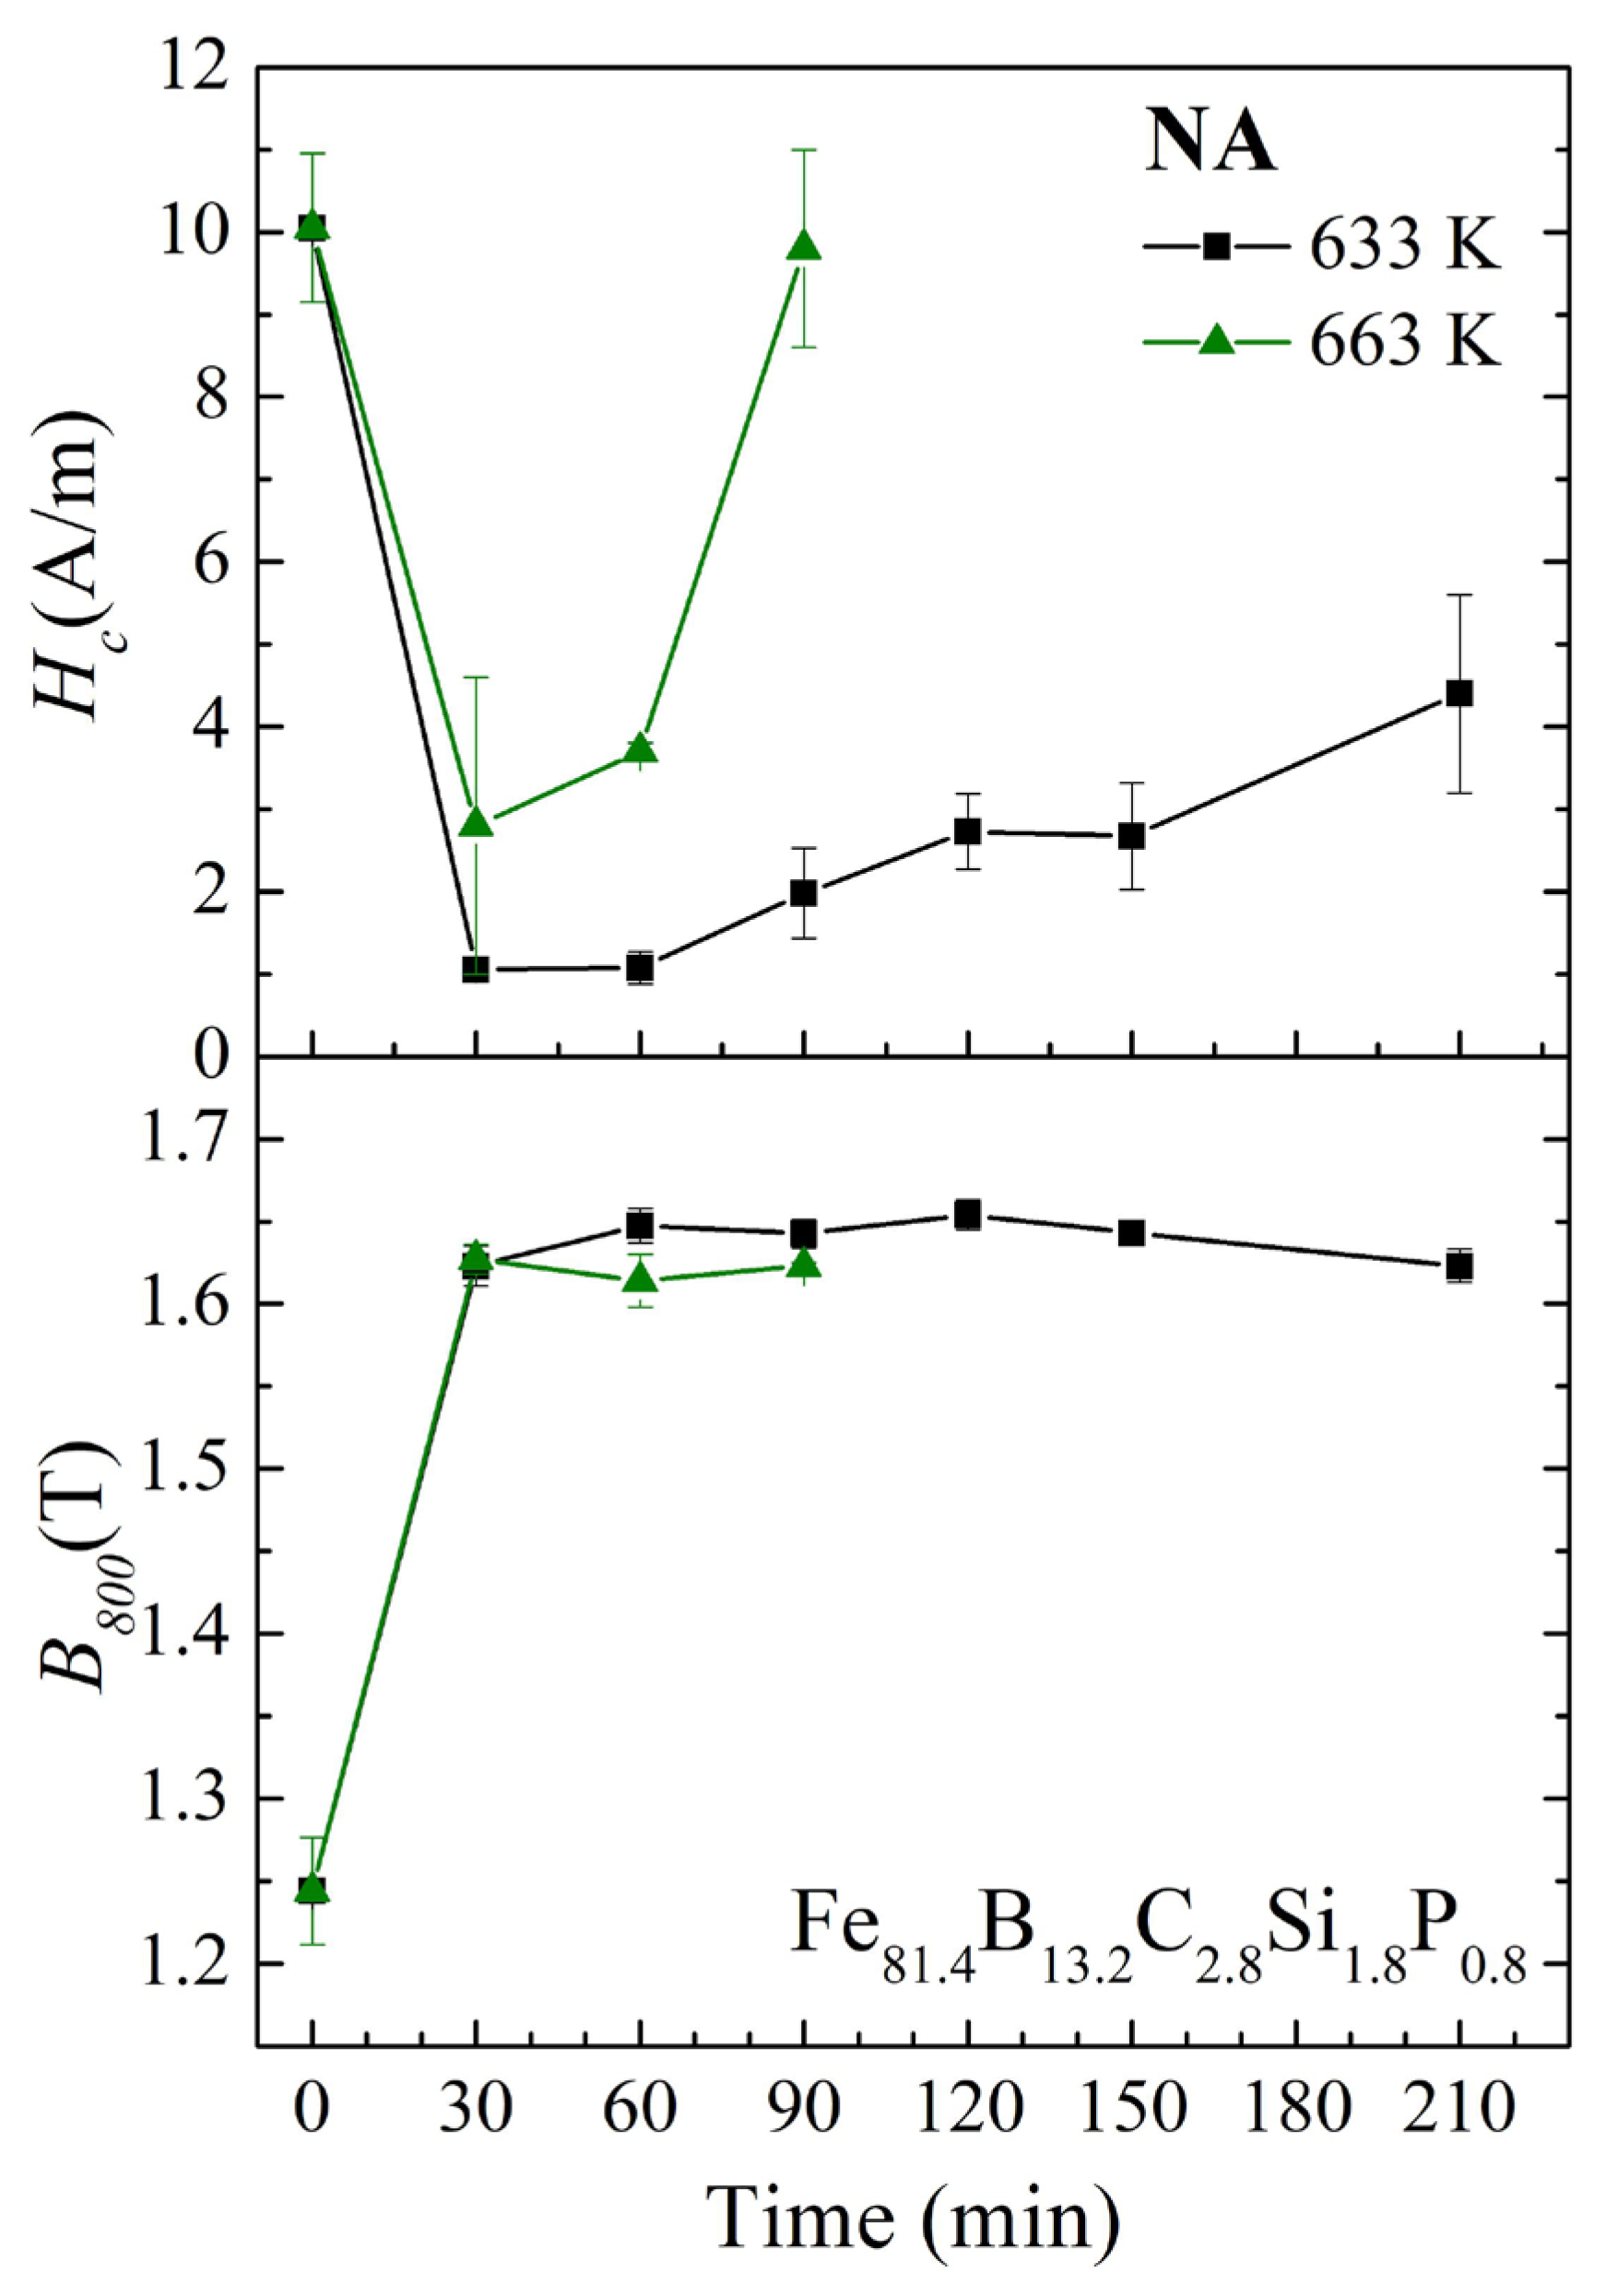
Figure 10.
Smooth-side XRD patterns of ribbons with different annealing times and temperatures for (a) Fe81.4B13.2C2.8Si1.8P0.8 and (b) Fe82.2B12.4C2.8Si1.8P0.8 amorphous alloys.
Figure 10.
Smooth-side XRD patterns of ribbons with different annealing times and temperatures for (a) Fe81.4B13.2C2.8Si1.8P0.8 and (b) Fe82.2B12.4C2.8Si1.8P0.8 amorphous alloys.

Figure 11.
Magnetic domains in the demagnetized state for the Fe82.2B12.4C2.8Si1.8P0.8 amorphous alloy samples: (a) as-spun, (b) NA-623K-45 min, and (c) NA-623K-210 min.
Figure 11.
Magnetic domains in the demagnetized state for the Fe82.2B12.4C2.8Si1.8P0.8 amorphous alloy samples: (a) as-spun, (b) NA-623K-45 min, and (c) NA-623K-210 min.


Table 1.
Several temperature parameters mentioned in this article for Fe81.4B13.2C2.8Si1.8P0.8 and Fe82.2B12.4C2.8Si1.8P0.8 amorphous alloys.
Table 1.
Several temperature parameters mentioned in this article for Fe81.4B13.2C2.8Si1.8P0.8 and Fe82.2B12.4C2.8Si1.8P0.8 amorphous alloys.
| Alloy | Ta0 (K) | Tam (K) | Tai (K) | TC0 (K) | Tx0 (K) | TC (K) | Tx (K) |
|---|---|---|---|---|---|---|---|
| Fe81.4B13.2C2.8Si1.8P0.8 | 623 | 653 | 620 | 667 | 744 | 661 | 776 |
| Fe82.2B12.4C2.8Si1.8P0.8 | 593 | 623 | 589 | 637 | 709 | 635 | 766 |
Ta0 and Tam are the lowest temperature and the highest temperature of the optimum annealing temperature range, as shown in Figure 4; Tx0, Tai, and TC0 are the characteristic temperatures, as shown in Figure 5 and Figure 6; TC and Tx are the Curie temperature and the onset temperature of crystallization, determined from the DSC curves shown in Figure 3.
Disclaimer/Publisher’s Note: The statements, opinions and data contained in all publications are solely those of the individual author(s) and contributor(s) and not of MDPI and/or the editor(s). MDPI and/or the editor(s) disclaim responsibility for any injury to people or property resulting from any ideas, methods, instructions or products referred to in the content. |
© 2024 by the authors. Licensee MDPI, Basel, Switzerland. This article is an open access article distributed under the terms and conditions of the Creative Commons Attribution (CC BY) license (https://creativecommons.org/licenses/by/4.0/).
Share and Cite
MDPI and ACS Style
Jia, J.; Wu, Y.; Shi, L.; Wang, R.; Guo, W.; Bu, H.; Shao, Y.; Chen, N.; Yao, K. Influence of Annealing Process on Soft Magnetic Properties of Fe-B-C-Si-P Amorphous Alloys. Materials 2024, 17, 1447. https://doi.org/10.3390/ma17061447
AMA Style
Jia J, Wu Y, Shi L, Wang R, Guo W, Bu H, Shao Y, Chen N, Yao K. Influence of Annealing Process on Soft Magnetic Properties of Fe-B-C-Si-P Amorphous Alloys. Materials. 2024; 17(6):1447. https://doi.org/10.3390/ma17061447
Chicago/Turabian StyleJia, Jili, You Wu, Lingxiang Shi, Ranbin Wang, Wenhui Guo, Hengtong Bu, Yang Shao, Na Chen, and Kefu Yao. 2024. "Influence of Annealing Process on Soft Magnetic Properties of Fe-B-C-Si-P Amorphous Alloys" Materials 17, no. 6: 1447. https://doi.org/10.3390/ma17061447
Note that from the first issue of 2016, this journal uses article numbers instead of page numbers. See further details here.