
Fixed Yellow-to-Blue Intensity Ratio of Dy3+ in KY(CO3)2 Host for Emission Color Tuning
1
School of Physics and Electronic Information, Huaibei Normal University, Huaibei 235000, China
2
Anhui Province Key Laboratory of Pollutant Sensitive Materials and Environmental Remediation, Huaibei 235000, China
*
Author to whom correspondence should be addressed.
Materials 2024, 17(6), 1438; https://doi.org/10.3390/ma17061438
Submission received: 19 February 2024
/
Revised: 18 March 2024
/
Accepted: 19 March 2024
/
Published: 21 March 2024
(This article belongs to the Special Issue Advanced Luminescent Materials: Synthesis, Properties and Applications)
Abstract
:Dy3+, Ce3+ co-doped KY(CO3)2 phosphors with a monoclinic structure were synthesized using the hydrothermal method to create a fixed yellow-to-blue ratio emission. The [YO8] polyhedron, consisting of a Y atom and eight oxygen atoms, forms a relatively independent microstructure within the KY(CO3)2 host. Y3+ ions are partially replaced by Ce3+ or Dy3+ ions to construct the [CeO8] or [DyO8] polyhedral fluorescence emission unit. The spectral measurements indicate that Ce3+ and Dy3+ can maintain relatively independent fluorescence emission characteristics in the KY(CO3)2 host. The yellow-to-blue intensity ratio of Dy3+ remains close to 1 and does not change with the variation in the doping concentration of KY(CO3)2:Dy3+ and KY(CO3)2:Dy3+,Ce3+ phosphors. When Ce3+ and Dy3+ are co-doped with KY(CO3)2, the emission intensities of Dy3+ under 339 nm and 365 nm excitation increase by 8.43 and 2.32 times, respectively, through resonance energy transfer and cross-relaxation. All Ce3+-doped KY(CO3)2:Dy3+ phosphors can emit white light. Among them, the emitted light of KY(CO3)2:3%Dy3+,5%Ce3+ is closest to standard daylight. Therefore, a stable [YO8] polyhedral structure can be used to achieve more color tuning of light.
1. Introduction
Dy3+ is an important rare earth luminescent ion with strong blue and yellow emission [1,2]. Tunable emission properties are widely used in the fields of solid-state lighting [3,4,5], temperature sensing [6,7,8], gamma detection [9], and anti-counterfeiting [10,11]. The intense emission of two visible lights is attributed to the energy level transitions from 4F9/2 to 6H15/2 and 6H13/2 [3]. The 4F9/2 → 6H15/2 transition belongs to the magnetic dipole transition, whereas the 4F9/2 → 6H13/2 transition belongs to the hypersensitive electric dipole transition, which is greatly affected by the crystal field environment [12]. The electric field environment around Dy3+ can be modified by doping with different concentrations of ions in the host. The higher the asymmetry is, the greater the yellow emission intensity [13,14]. An asymmetric crystal field changes the yellow-to-blue intensity ratio in the Dy3+ emission spectrum, resulting in an unpredictable variety of luminescent color. However, the doping concentration should not be excessive for Dy3+. An excessive concentration in the crystal lattice could reduce the distance between two Dy3+ ions and promote cross-relaxation and resonance energy transfer [14,15]. Consequently, the emission intensity is weakened due to concentration quenching [16,17,18]. Therefore, it is essential to investigate an asymmetric fluorescent material with a relatively fixed intensity ratio for intense emission [19].
Asymmetric microstructures are widely used for the emission of Dy3+ [20,21]. A phosphor with a tetragon tungsten bronze structure is used to produce stable blue and yellow light emissions [12]. However, the yellow/blue ratio is limited due to the relatively balanced tendency of Dy3+ in both pentagonal-A and square-B sites of the PbTa2O6 crystal structure. The yellow emission of 4F9/2 → 6H13/2 corresponds to an electric dipole transition, which is sensitive to the asymmetric arrangement of Dy3+. The degree of asymmetry in the Dy3+ environment is often described by the yellow-to-blue intensity ratio (Y/B) [19]. The yellow light intensity is highly uncertain in differently doped hosts. The Y/B ratios are larger than 1 in Dy3+-doped Bi2MoO6 [15], K3YB6O12 [16], and YGdPO4 [20] and less than 1 in Y4AI2O9 [5], PbTa2O6 [12], and YAI5O12 [22]. Moreover, the value of Y/B does not change synchronously with the concentration of Dy3+ [23]. Variation in the Y/B value in the Dy3+ emission spectrum may induce uncertainty in the luminescence color. Therefore, a stable crystal field environment with high emission intensity is particularly important for the single luminescent color of Dy3+. A host with a polyhedral structure is one of the good options.
As one of the fluorescent crystals, the monoclinic KY(CO3)2 is a good optical material with high optical transmittance [24]. In the [Y(CO3)2]− framework of the KY(CO3)2 host, Y3+ is coordinated to eight O2− to form a relatively independent [YO8] polyhedron. The Y3+ in this polyhedron can be replaced by other rare earth ions to achieve a stable luminescent emission [25]. The radius of Dy3+ ions is close to Y3+. The independent crystal field environment in the [DyO8] polyhedron ensures stable emission of Dy3+ in yellow and blue light, which means that the light color in KY(CO3)2:Dy3+ is relatively stable. In this work, Dy3+ and Ce3+ co-doped KY(CO3)2 are prepared, and the structures, morphologies, luminescence, decay curves, and color tuning are discussed.
2. Materials and Methods
A series of KY1-x-y(CO3)2:x%Dy3+,y%Ce3+ (KYC:x%Dy3+,y%Ce3+) phosphors were prepared by the hydrothermal method. High-purity Y(NO3)3·H2O (99.99%), Dy(NO3)3·H2O (99.99%), and Ce(NO3)3·H2O (99.99%) were used as raw materials for the chemical reactions (Shanghai Xianding Biotechnology Co., Ltd., Shanghai, China). The detailed synthesis process has been described in the literature [25]. First, all rare earth nitrates were weighed according to the stoichiometric ratio and dissolved in 5 mL deionized water. Second, the nitrate solution was added dropwise into a vigorously stirred 25 mL K2CO3 solution (0.55 mol/L). Third, the pH value of the nitrate mixed solution was adjusted to 9.5 using dilute nitric acid. After 30 min of vigorous stirring, the mixed solution was transferred to a 50 mL reactor and heated to 200 °C for 12 h. The reaction precipitate was filtered and washed with deionized water, and the final fluorescent powder was obtained.
The crystal structures of KYC:x%Dy3+,y%Ce3+ were characterized with an X-ray diffractometer. Lattice parameters were fitted by Rietveld refinement using FullProf software (5.10). The morphologies of grains and the types of elements were analyzed with cold-field emission scanning electron microscopy (Regulus 8220, Hitachi High-Tech Co., Tokyo, Japan). The luminescent properties of KYC:x%Dy3+,y%Ce3+ were detected with an FLS920 fluorescence spectrophotometer equipped with a 450 W Xe-lamp (Edinburgh Instruments, Livingston, UK). The decay curves were recorded with a 60 W microsecond flashlamp (Edinburgh Instruments, Livingston, UK).
3. Results and Discussion
3.1. Crystal Structures
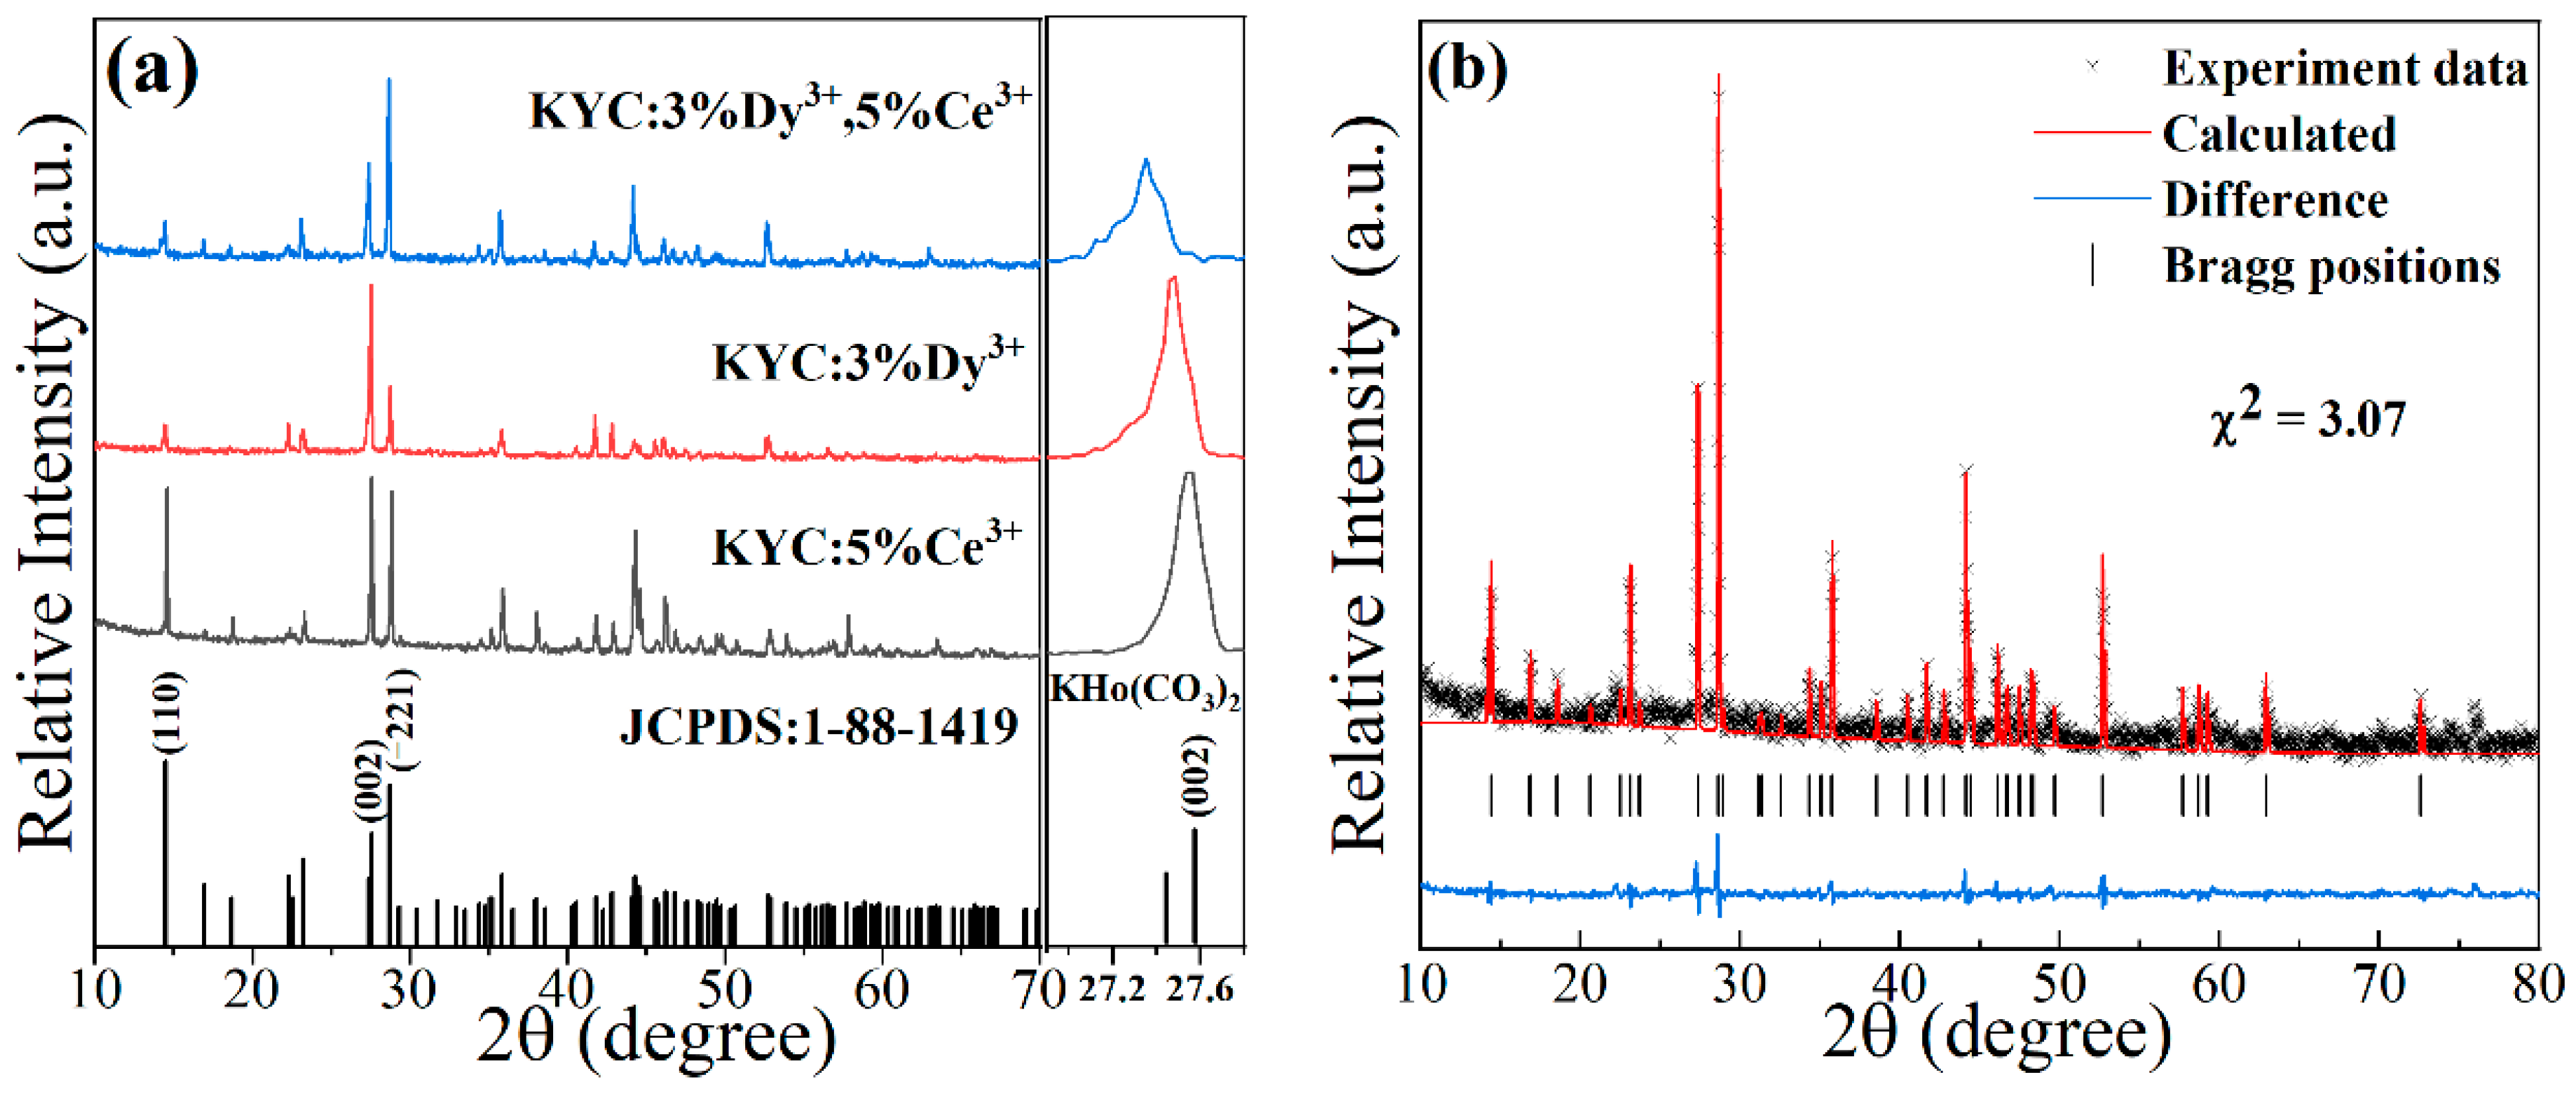
Figure 1a shows the XRD patterns of KYC:3%Dy3+,5%Ce3+, KYC:5%Ce3+, and KYC:3%Dy3+. Three diffraction spectra of the sample show the similar diffraction peaks with slight differences in intensities. All diffraction peaks match well with the standard diffraction spectrum of KHo(CO3)2 (JCPDS: 1-88-1419). No secondary phases are detected in the spectrum. The crystal structure is the same as reported in the literature [24]. In the enlarged image, 2θ angles at the (002) crystal plane are observed to shift to a lower angle in comparison to KHo(CO3)2. The reason for lattice expansion is that the radius of doped ions is larger than that of Ho3+ ions. The ionic radii of Ho3+, Y3+, Dy3+, and Ce3+ are 1.015, 1.019, 1.027, and 1.143 Å [26], respectively. Figure 1b presents the Rietveld refinement of KYC:3%Dy3+,5%Ce3+ with FullProf software. KHo(CO3)2 was selected as the initial structural mode. The refined cell parameters are presented in Table 1. From the refined lattice parameters of KYC:3%Dy3+,5%Ce3+, the values of the cell volume and parameters are larger than those of KY(CO3)2, which indicates that Ce3+ and Dy3+ ions were successfully doped into the monoclinic structure of KY(CO3)2 [27].
3.2. Morphologies and Element Analysis
The morphologies of KYC:3%Dy3+,y%Ce3+ (y = 0, 1, 2, 3, 4, 5, 6, 7) are illustrated in Figure 2a–h. According to the scanning electron microscopy images, both KYC hosts doped with Dy3+ and Ce3+ are monoclinic and consist of well-crystallized grains. In Figure 2a, for KYC:3%Dy3+, the grain size is relatively uniform, ranging from 20 to 50 microns. However, when Ce3+ ions were added to KYC:3%Dy3+, the grains grew and became more likely to fracture. Many small particle fragments were found in the middle of the grains (Figure 2b–h). This fragmentation of grains may be caused by excessive internal stress in the grains due to the significant difference in ionic radii between Dy3+ and Ce3+. Ce3+ and Dy3+ ions were doped into KYC through a chemical reaction that generates different small crystal nuclei for Ce3+, Dy3+, and Y3+. The crystals merge and grow, but due to differences in crystal growth direction between the various small crystal nuclei, it is impossible for the crystals to form a uniform size completely. As the concentration of Ce3+ doping increases, primary grains that have not been completely merged can still be found at the fracture of bulk grains. The presence of pores and spaces between grains makes them more prone to fragmentation.
In addition, Figure 2i shows the elemental analysis of KYC:3%Dy3+,5%Ce3+ examined by energy dispersive spectroscopy. Although the doping concentrations of Ce3+ and Dy3+ are relatively low, it can still be observed from the energy spectrum that the grain contains elements such as K, Y, Ce, and Dy. The element contents of Y, Ce, and Dy are 9.9%, 0.4% and 0.3%, respectively. The ratio of Y to the total content of Ce and Dy is 14.1, which is close to the original stoichiometric ratio of 13.3. These results indicate that Ce3+ and Dy3+ have been successfully doped into the KYC host.
3.3. Luminescent Properties
Figure 3a displays the typical emission spectra of KYC:x%Dy3+ when exposed to an excitation wavelength of 365 nm. The emission spectrum of Dy3+ has four distinct emission bands, with peak values located at 492, 577, 666, and 756 nm. These peaks correspond to the transition from 4F9/2 to 6H15/2, 6H13/2, 6H11/2, and 6H9/2 [14,28], respectively. The emission intensity initially increases and then decreases with the doping concentration of Dy3+. The maximum emission intensity occurs at a doping concentration of 3% Dy3+; excessive Dy3+ ions will reduce the distance between two adjacent Dy3+ ions, resulting in concentration quenching [16,17,18]. The reason is that cross-relaxation consumes the number of excited state electrons at the emission level of 4F9/2 between the two similar energy gaps of 4F9/2-6F3/2 and 6H9/2-6H15/2. This relaxation process can be expressed as follows: 4F9/2+6H15/2 → 6F3/2+6H9/2. Additionally, the emission of excited-state electrons in Dy3+ mainly concentrates in the regions 462–504 nm and 553–597 nm. The emission colors are blue and yellow for the two main emission bands. To investigate the emission intensity, the emission intensities in the blue and yellow regions are integrated, and the relative intensities of the two emission bands are shown in Figure 3b. The ratios of blue-to-yellow light change with concentration and can be fitted linearly. The fitting results show that the integrated intensity ratio of blue and yellow light is close to 1, and the slope of the fitted line approaches 0. In the Dy3+ emission spectrum, the emission of each spectral component remains stable, and the change in doping concentration does not induce hypersensitive transitions of the 4F9/2 → 6H13/2 [29]. The normal emission of yellow light indicates that Dy3+ is in a relatively stable crystal field environment. The [DyO8] polyhedra in the KYC:Dy3+ lattice effectively weaken the influence of external electric fields on Dy3+ [24]. The energy transfers of adjacent Dy3+ between different polyhedra only occur through the zig-zag chains along the C-axis direction [25], which means that Dy3+ is less affected by the other electric field environment. Hence, the emission of electronic transitions between different energy levels is relatively stable. Dy3+ ions with different concentrations emit a single luminescent color. The luminescent properties of Dy3+ ions can be used for color modulation, especially for solid-state lighting. Multi-color luminescence can be achieved simply through spectral adjustment. Finally, 3% of Dy3+ was used to synthesize white light in the KYC host.
Figure 4 clearly displays the excitation spectra of KYC doped with Ce3+ and Dy3+ monitored at 577 nm. Sharp excitation peaks are visible in the excitation spectrum of KYC:3%Dy3+. These peaks are observed at 325, 339, 351, 365, 386, 428, 453, and 476 nm and correspond to the transition of Dy3+ from 6H15/2 to 6P3/2, 4I9/2, 6P7/2, 6P5/2, 4I13/2, 4G11/2, 4I15/2, and 4F9/2 [5,28], respectively. When Ce3+ was added to KYC:3%Dy3+, two broad absorption peaks were detected at 274 and 340 nm (monitoring at 577 nm), which belong to the energy transition of Ce3+ from 4f to 5d [30]. The excitation intensity of KYC:3%Dy3+,5%Ce3+ in the range of 230–360 nm is significantly greater than that of KYC:3%Dy3+. This is primarily due to the overlap of energy levels between Ce3+ and Dy3+, which promotes electron resonance migration [31,32]. The other excitation intensities of Dy3+ at 428, 453, and 476 nm remain the same as before. Therefore, a higher excitation intensity benefits the emission of Dy3+ ions in the resonance excitation wavelength.
Figure 5 presents the emission spectra of KYC:3%Dy3+,y%Ce3+. In Figure 5a, the emission spectrum is mainly composed of the emission of Ce3+ and Dy3+. The emission wavelength of Ce3+ is distributed in the range of 350–460 nm, while Dy3+ is in the range of 460–800 nm. When KYC:3%Dy3+,y%Ce3+ is excited at 339 nm, the collaboration between Ce3+ and Dy3+ enables it to emit a higher fluorescence intensity. As shown in the figure, the emission intensity of Ce3+ is maximum when the Ce3+ concentration in KYC:3%Dy3+,y%Ce3+ is 4, while the maximum emission intensity of Dy3+ corresponds to a Ce3+ concentration of 5. Before a concentration of 5%, Ce3+ ions enhance the emission intensity of Dy3+. However, as the Ce3+ ion content continues to increase, the concentration quenching of Ce3+ weakens the emission intensity of Dy3+ [33]. This phenomenon is mainly caused by the electric multipole interaction between Ce3+ ions. The type of electric multipole interaction can be determined using Dexter’s formula [34]:
where I is the emission intensity of Ce3+ at 399 nm, χ is an activator concentration of Ce3+ in KYC:Dy3+, Ce3+, θ is a multipole–multipole interaction type, and K and β are constants. To obtain the value of θ, the above equation can be simplified as follows:
After fitting the Ce3+ emission data, it was found that the value of θ is close to 8. The result shows that the mechanism of Ce3+ concentration quenching is attributed to the dipole–quadrupole.
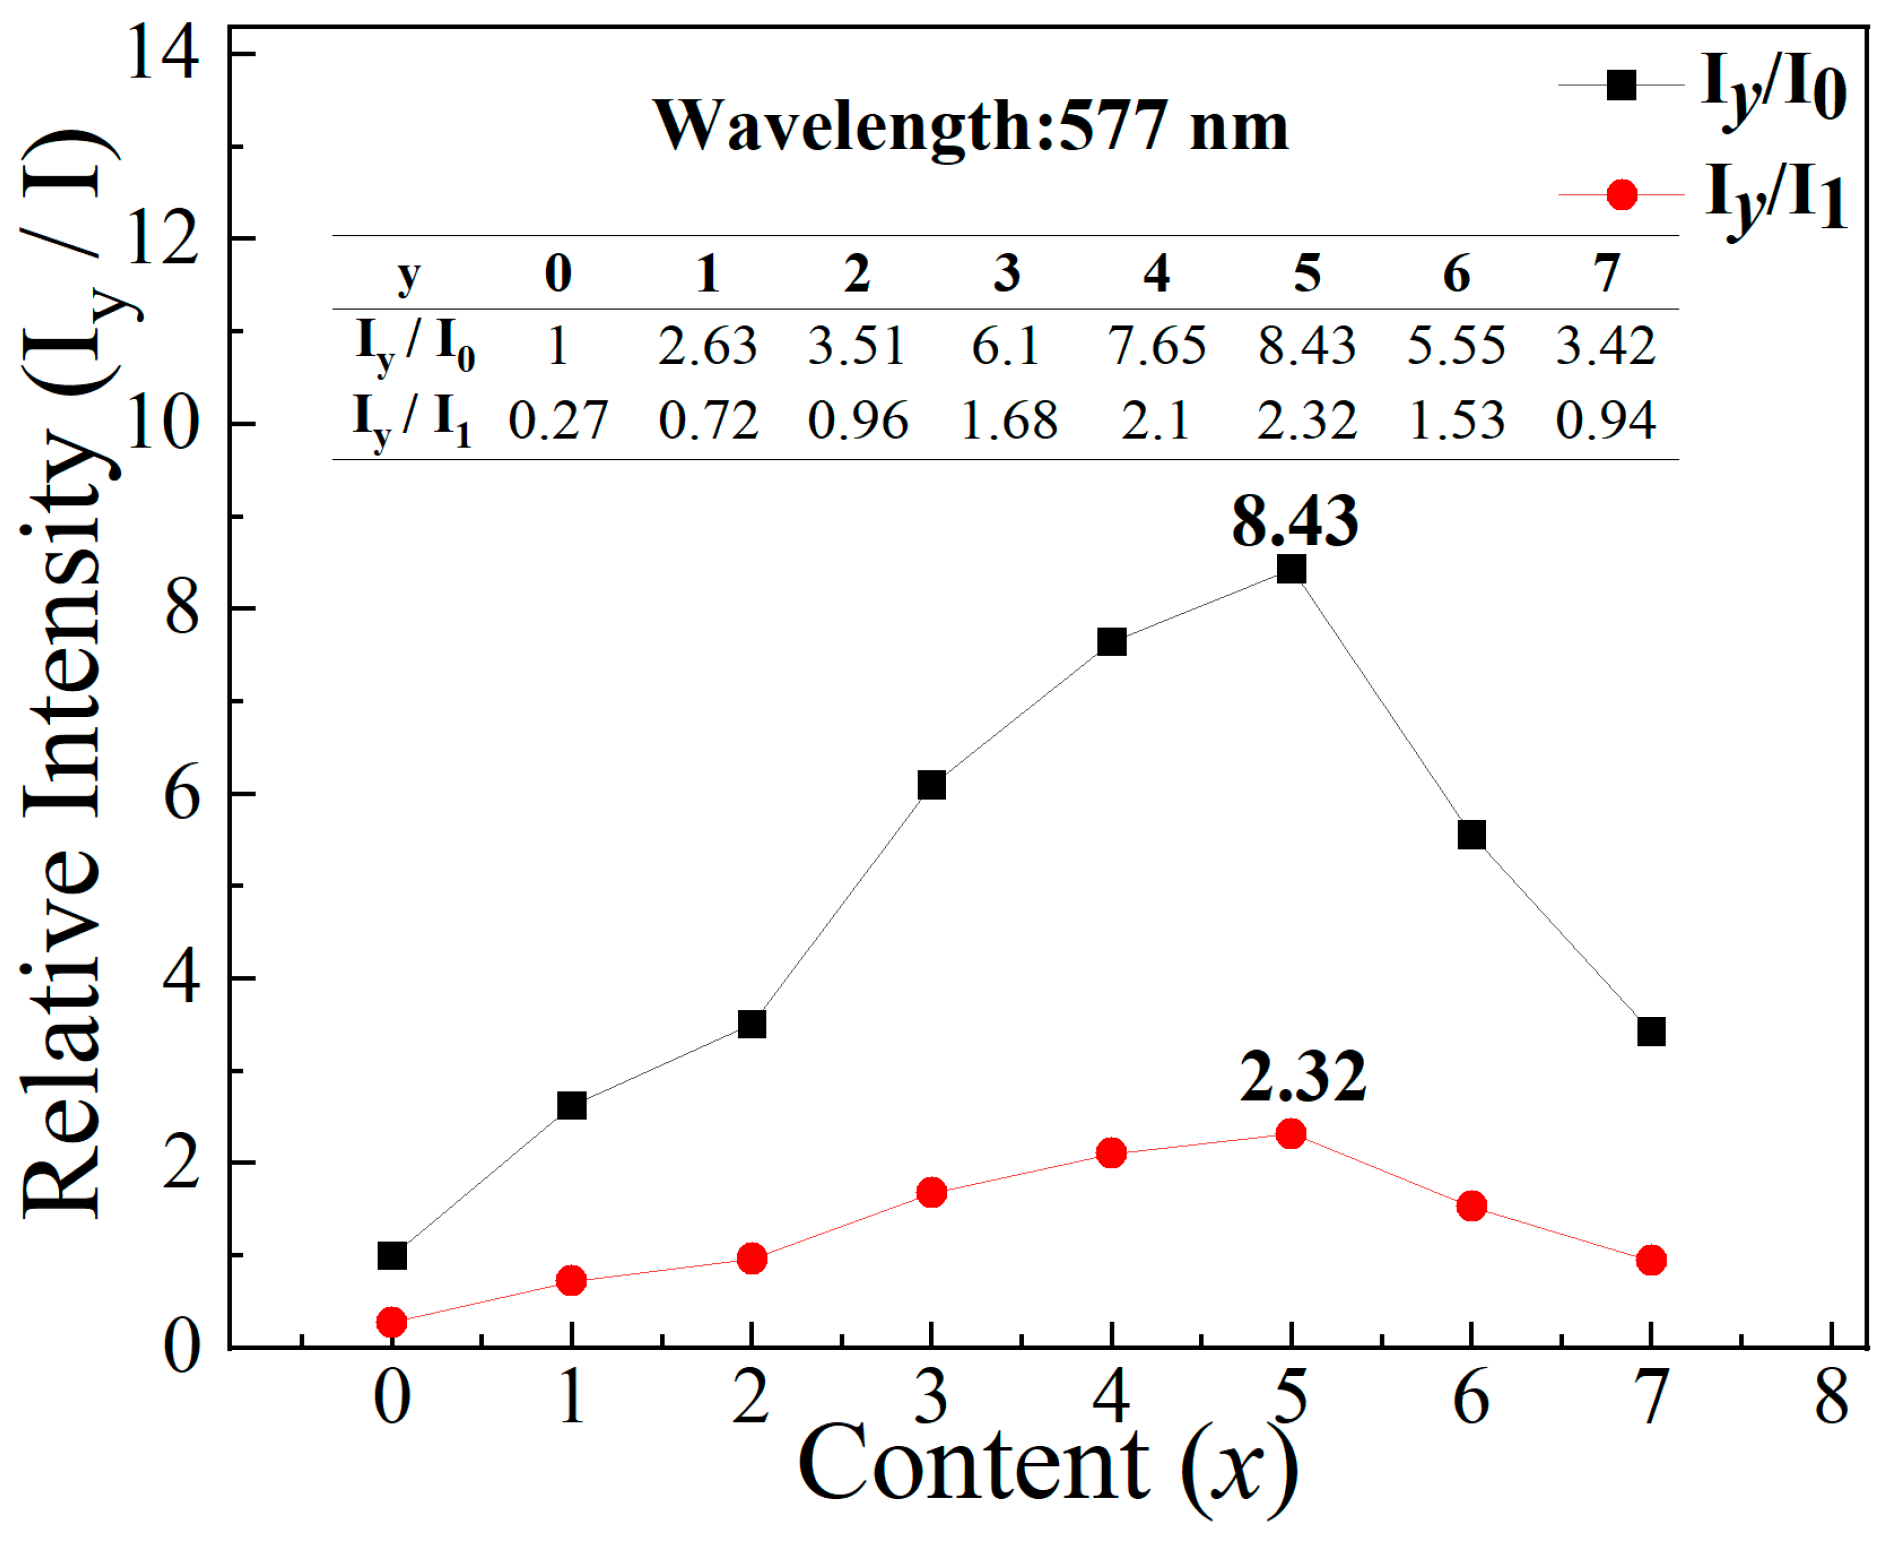
The emission intensities of Dy3+ in the presence of Ce3+ ions were calculated in Figure 5b. The integral intensity ratios of blue to yellow are similar in KYC:3%Dy3+,y%Ce3+ (y = 0–7). The intensity ratio of each sample can be linearly fitted, and the slope of the fitted line is close to 0. The similar intensity ratio of Dy3+ indicates that its emission has relative independence. The doping of Ce3+ ions only enhances the emission of Dy3+ through energy transfer and does not trigger the hypersensitive transition. The relative intensities at different y concentrations are shown in Figure 6. The enhancement values are described by Iy/I0 and Iy/I1 at the emission wavelength of 577 nm, where Iy and I0 are the peak intensities excited by 339 nm at KYC:3%Dy3+,y%Ce3+, and KYC:3%Dy3+,0Ce3+, I1 is the maximum peak intensity excited by 365 nm in KYC:3%Dy3+. From the curves, the maximum value of enhancement occurs at a Ce3+ concentration of 5%, which is 8.43 and 2.32 times for I0 and I1, respectively. Therefore, Ce3+ is employed to not only increase the emission intensity of Dy3+ but also to adjust spectral components.
3.4. Decay Curves
Figure 7 illustrates the typical photoluminescence decay curve of KYC:3%Dy3+,5%Ce3+. The phosphor was excited at 339 nm and emitted at 577 nm. From the figure, the decay curve can be fitted by a double-exponential function. The fitted residuals are well distributed around 0. The double-exponential fitting curve indicates that two main factors are dominating the radiation process of Dy3+. In general, the lifetimes vary with different concentrations due to the energy transfer between the Dy3+ ions [35]. Therefore, a constant concentration of Dy3+ was used to investigate the contribution of Ce3+. The lifetimes of Dy3+ with different Ce3+ concentrations (1% to 7%) were calculated. Table 2 provides the detailed values of lifetime for τ1 and τ2 corresponding to the double-exponential components. From the table, it can be observed that the τ1 and τ2 values increase with the increase in the Ce3+ concentration in the range of 1% to 5%, which is consistent with the trend of emission intensity variation. The increase in lifetime is mainly attributed to the transfer of excited state electrons from Ce3+ to Dy3+. Overlapping excitation bands are more prone to resonance transfer and cross-relaxation [14,31]. However, as the concentration of Ce3+ continues to increase, the number of excited electrons in Dy3+ decreases due to the quenching of the Ce3+ concentration [33]. As a result, the lifetimes of Dy3+ slightly decrease.
3.5. Energy Level Diagram
Figure 8 shows the energy transfer mechanism of KYC:Dy3+,Ce3+. When excited by 339 nm, the electrons of both Ce3+ and Dy3+ are stimulated from the ground state to the excited state simultaneously. In the Ce3+ excited state of 5D3/2, one of the electrons relaxes to 2F5/2 and 2F7/2 producing the emission of 375 and 396 nm through the lowest 5d excited state [31]. The other excited state electrons of Ce3+ (5D3/2) could transfer to the excited energy level of Dy3+ (4I9/2) by the resonance energy transfer (RET) [14,31]. For the excited state of Dy3+, the excited electrons initially relax to the lower excited state of 4F9/2 by non-radiation and then emit blue (6H15/2), yellow (6H13/2), and red (6H11/2, 6H9/2) light when returning to the ground state [36]. This simultaneous excitation of Ce3+ at 339 nm enhances the emission intensity of Dy3+. In addition, according to the emission spectra of KYC:3%Dy3+,4%Ce3+ and KYC:3%Dy3+,5%Ce3+, there were no simultaneous increases or decreases in the emission intensity of Ce3+ and Dy3+ ions, indicating the existence of other energy transfer forms. The energy levels of 6P5/2 (Dy3+) and 4K17/2 (Dy3+) in an excited state are 27,503 and 26,365 cm−1 [37]. Due to the overlap of Ce3+ emission and Dy3+ excitation, the energy of the Ce3+ excited state electrons can be transported from Ce3+ to Dy3+ by the cross-relaxation (CR). The cross-relaxation processes can be described as 5D3/2+6H15/2 → 2F5/2+6P5/2 and 5D3/2+6H15/2 → 2F7/2+4K17/2. When the concentration of Ce3+ exceeds 5%, the emission intensities of Ce3+ and Dy3+ decrease simultaneously due to the concentration quenching of Ce3+.
3.6. Chromaticity Coordinates
The Dy3+ emission spectrum comprises blue, yellow, and red components. In the KYC:3%Dy3+,y%Ce3+ spectrum, the emission intensity of yellow light is consistently similar to that of blue light at different Ce3+ concentrations. Therefore, the luminescence color can be adjusted by changing the concentration of Ce3+ ions. Figure 9 shows the chromaticity coordinates of KYC:3%Dy3+,y%Ce3+ (y = 0–7) and KYC:5%Ce3+. From the graph, it is evident that KYC:3%Dy3+ emits light in the yellow-green region, KYC:5%Ce3+ emits light in the purplish-blue region, and all Ce-doped KYC:3%Dy3+,y%Ce3+ (y = 1–7) color coordinates appear in the white light region. The KYC:Dy3+ phosphor is used for white light mainly due to the relatively consistent and high emission intensity of blue and yellow light in the Dy3+ emission spectrum. Moreover, KYC:Dy3+ luminescent color is close to daylight, and its luminescent color is similar to the emission of Dy3+ in Bi(PO4)6 [3], Y4AI2O5 [5], and K3YB6O12 [16], belonging to warm white light. It is easy to adjust the luminescent color by adding other luminescent ions to the KYC:Dy3+, while the luminescent color of Dy3+ remains constant.
The correlated color temperatures were calculated by the formula [38], and the detailed values are provided in Table 3. The coordinate of KYC:3%Dy3+,5%Ce3+ is (0.3204, 0.2972) with a correlated color temperature of 6270 K, which is closer to standard daylight (0.33, 0.33). Moreover, the other Ce-doped KYCs emit cold white light. These cold white lights have relatively high color temperatures and can be used in locations that require clear vision, such as factories, exhibition rooms, conference rooms, or product exhibitions.
4. Conclusions
Monoclinic KYC:Dy3+,Ce3+ was successfully prepared by the hydrothermal method. In the KYC host, Dy3+ maintains relatively independent emission characteristics. The relative intensity of blue and yellow light in the emission spectrum is not affected by the doping concentration of Dy3+ ions. Even when Ce3+ and Dy3+ are co-doped with KYC, Dy3+ can still maintain relatively independent emission. The relative intensity ratio of blue-to-yellow light is a constant value in each sample. The cross-relaxation and resonance energy transfer between Ce3+ and Dy3+ effectively enhance the emission intensity of Dy3+. Moreover, all Ce-doped KYC samples can emit white light. The light emitted by KYC:3%Dy3+,5%Ce3+ is closest to standard daylight. These results indicate that both Ce3+ and Dy3+ ions maintain relatively independent emission characteristics in the KYC host, which makes it convenient to tune the emission color.
Author Contributions
Conceptualization, D.L. and L.H.; methodology, L.H., S.S. and J.Q.; validation, D.L. and L.H.; formal analysis, D.L. and L.H.; investigation, D.L.; resources, L.H.; data curation, L.H., S.S. and J.Q.; writing—original draft preparation, L.H.; writing—review and editing, D.L.; visualization, D.L.; supervision, D.L.; project administration, D.L.; and funding acquisition, D.L. All authors have read and agreed to the published version of the manuscript.
Funding
This research was funded by the University Natural Science Research Project of Anhui Province, grant numbers 2023AH050311, 2023AH010043, and 2023AH010044.
Institutional Review Board Statement
Not applicable.
Informed Consent Statement
Not applicable.
Data Availability Statement
Data are contained within the article.
Conflicts of Interest
The authors declare no conflicts of interest.
References
- Chandrappa, V.; Basavapoornima, C.; Venkatramu, V.; Depuru, S.R.; Kaewkhao, J.; Pecharapa, W.; Jayasankar, C.K. A critical review and future prospects of Dy3+-doped glasses for white light emission applications. Optik 2022, 266, 169583. [Google Scholar] [CrossRef]
- Reddy, L. A Review of the Efficiency of White Light (or Other) Emissions in Singly and Co-Doped Dy3+ Ions in Different Host (Phosphate, Silicate, Aluminate) Materials. J. Fluoresc. 2023, 33, 2181–2192. [Google Scholar] [CrossRef]
- Nandanwar, C.M.; Kokode, N.S.; Yerpude, A.N.; Dhoble, S.J. Luminescence properties of BiPO4:Ln (Ln = Dy3+, Tb3+ and Sm3+) orthophosphate phosphors for near-UV-based solid-state lighting. Bull. Mater. Sci. 2023, 46, 51. [Google Scholar] [CrossRef]
- Alqarni, A.S.; Bulus, I.; Yusof, N.N.; Alomar, M.; Ghoshal, S.K. Luminescence properties of Dy3+ doped B2O3–CaMg(CO3)2–TeO2 glasses: A promising host for solid state lighting devices. Opt. Laser Technol. 2024, 170, 110327. [Google Scholar] [CrossRef]
- Kumar, P.; Singh, D.; Gupta, I.; Singh, S.; Nehra, S.; Kumar, R. A study of phase evolution, crystallographic and down-conversion luminescent behaviour of monoclinic Y4Al2O9:Dy3+ nanophosphors for white light applications. Opt. Mater. 2023, 138, 113677. [Google Scholar] [CrossRef]
- Bindhu, A.; Naseemabeevi, J.I.; Ganesanpotti, S. Insights into the crystal structure and photophysical response of Dy3+ doped Li3Y3Te2O12 for ratiometric temperature sensing. J. Sci. Adv. Mater. Dev. 2022, 7, 100444. [Google Scholar] [CrossRef]
- Vu, T.H.Q.; Stefańska, D.; Dereń, P.J. Effect of A-Cation Radius on the Structure, Luminescence, and Temperature Sensing of Double Perovskites A2MgWO6 Doped with Dy3+ (A = Ca, Sr, Ba). Inorg. Chem. 2023, 62, 20020–20029. [Google Scholar] [CrossRef]
- Abbas, M.T.; Khan, S.A.; Mao, J.; Khan, N.Z.; Qiu, L.; Ahmed, J.; Wei, X.; Chen, Y.; Alshehri, S.M.; Agathopoulos, S. Optical thermometry based on the luminescence intensity ratio of Dy3+-doped GdPO4 phosphors. J. Therm. Anal. Calorim. 2022, 147, 11769–11775. [Google Scholar] [CrossRef]
- Vidya Saraswathi, A.; Prabhu, N.S.; Naregundi, K.; Sayyed, M.I.; Murari, M.S.; Almuqrin, A.H.; Kamath, S.D. Thermoluminescence investigations of Ca2Al2SiO7:Dy3+ phosphor for gamma dosimetry applications. Mater. Chem. Phys. 2022, 281, 125872. [Google Scholar] [CrossRef]
- Shashikala, B.S.; Premkumar, H.B.; Sharma, S.C.; Nagabhushana, H.; Daruka Prasad, B.; Darshan, G.P. Dy3+ ions activated CaAl2O4 nanophosphors: Photoluminescent and photometric properties prompted manifold applications. Inorg. Chem. Commun. 2022, 142, 109619. [Google Scholar] [CrossRef]
- Jung, J.-y.; Kim, J.; Shim, Y.-S.; Hwang, D.; Son, C.S. Structure and Photoluminescence Properties of Rare-Earth (Dy3+, Tb3+, Sm3+)-Doped BaWO4 Phosphors Synthesized via Co-Precipitation for Anti-Counterfeiting. Materials 2020, 13, 4165. [Google Scholar] [CrossRef]
- İlhan, M.; Keskin, İ.Ç.; Gültekin, S. Assessing of Photoluminescence and Thermoluminescence Properties of Dy3+ Doped White Light Emitter TTB-Lead Metatantalate Phosphor. J. Electron. Mater. 2020, 49, 2436–2449. [Google Scholar] [CrossRef]
- Luewarasirikul, N.; Kaewkhao, J. Light-emitting CaMoO4:Dy3+ phosphors for photonic materials: Synthesis and luminescence properties. AIP Conf. Proc. 2020, 2279, 060009. [Google Scholar]
- Lodi, T.A.; Dantas, N.F.; Gonçalves, T.S.; de Camargo, A.S.S.; Pedrochi, F.; Steimacher, A. Dy3+ doped calcium boroaluminate glasses and Blue Led for smart white light generation. J. Lumin. 2019, 207, 378–385. [Google Scholar] [CrossRef]
- Chidthong, R.; Insiripong, S.; Angnanon, A.; Tipwan, J.; Rajaramakrishna, R.; Kaewkhao, J. Photoluminescence properties of Bi2MoO6:Dy3+ phosphors fabricated by solid state reactions. AIP Conf. Proc. 2020, 2279, 060007. [Google Scholar]
- Fu, Y.; Zhang, Z.; Zhang, F.; Li, C.; Liu, B.; Li, G. Electronic structure, energy transfer mechanism and thermal quenching behavior of K3YB6O12:Dy3+,Eu3+ phosphor. Opt. Mater. 2020, 99, 109519. [Google Scholar] [CrossRef]
- Meena, M.L.; Som, S.; Singh, R.K.; Lu, C.-H. Synthesis, spectroscopic characterization and estimation of Judd-Ofelt parameters for Dy3+ activated Li2MgZrO4 double perovskite materials. Polyhedron 2020, 177, 114322. [Google Scholar] [CrossRef]
- Sehrawat, P.; Khatkar, A.; Boora, P.; Kumar, M.; Singh, S.; Malik, R.K.; Khatkar, S.P.; Taxak, V.B. Fabrication of single-phase BaLaAlO4:Dy3+ nanophosphors by combustion synthesis. Mater. Manuf. Process. 2020, 35, 1259–1267. [Google Scholar] [CrossRef]
- Kaewnuam, E.; Wantana, N.; Kim, H.J.; Kaewkhao, J. Study on structure and luminescence properties of LaBMoO6:Dy3+ phosphor for photonic material applications. J. Meta Mater. Min. 2018, 28, 63–68. [Google Scholar]
- Gupta, S.K.; Jafar, M.; Thekke Parayil, R.; Bahadur, J.; Sudarshan, K. White light emitting nanocrystalline Y1−xGdxPO4:Dy3+ and improved PLQY on Gd3+ co-doping. Inorg. Chem. Commun. 2024, 159, 111908. [Google Scholar] [CrossRef]
- Girisha, H.R.; Krushna, B.R.R.; Prasad, B.D.; Sharma, S.C.; Srikanth, C.; Kumar, J.B.P.; Nagabhushana, H. A novel single phase La2CaZnO5:Dy3+ phosphor for potential applications in WLED’s, latent fingerprint and cheiloscopy. J. Lumin. 2023, 255, 119539. [Google Scholar] [CrossRef]
- Cao, X.; Li, X.; Chen, X.; Xu, S.; Xiong, D.; Deng, W. Preparation, characterization and optical properties of Dy-doped yttrium aluminum garnet. Int. J. Mod. Phys. B 2017, 31, 1744071. [Google Scholar] [CrossRef]
- Koseva, I.; Tzvetkov, P.; Ivanov, P.; Gancheva, M.; Nikolov, V. Dysprosium doped calcium germanate (Ca2GeO4) as a candidate for LED application. J. Int. Sci. Publ. Mater. Methods Technol. 2019, 13, 18–24. [Google Scholar]
- Cao, L.; Peng, G.; Yan, T.; Luo, M.; Lin, C.; Ye, N. Three alkaline-rare earth cations carbonates with large birefringence in the deep UV range. J. Alloys Compd. 2018, 742, 587–593. [Google Scholar] [CrossRef]
- Li, D.; Zhu, G. Quantum Cutting in Ultraviolet B-Excited KY(CO3)2:Tb3+ Phosphors. Materials 2022, 15, 6160. [Google Scholar] [CrossRef] [PubMed]
- Shannon, R. Revised effective ionic radii and systematic studies of interatomic distances in halides and chalcogenides. Acta Crystallogr. 1976, 32, 751–767. [Google Scholar] [CrossRef]
- Kutlu, I.; Kalz, H.-J.; Wartchow, R.; Ehrhardt, H.; Seidel, H.; Meyer, G. Kalium-Lanthanoid-Carbonate, KM(CO3)2 (M = Nd, Gd, Dy, Ho, Yb). Z. Anorg. Allg. Chem. 1997, 623, 1753–1758. [Google Scholar] [CrossRef]
- Song, R.; Zhang, Z.; Li, H.; Luo, Z.; Yang, J.; Ma, J.; Xiang, X.; Zeng, Q.; Zhu, J. A single-phase white-emitting La(BO3,PO4):Dy3+ phosphor with high thermostability. Ceram. Int. 2023, 49, 6965–6973. [Google Scholar] [CrossRef]
- Kesavulu, C.R.; Kim, H.J.; Lee, S.W.; Kaewkhao, J.; Chanthima, N.; Tariwong, Y. Physical, vibrational, optical and luminescence investigations of Dy3+-doped yttrium calcium silicoborate glasses for cool white LED applications. J. Alloys Compd. 2017, 726, 1062–1071. [Google Scholar] [CrossRef]
- Feng, J.; Yuan, S.; Wu, X.; Zhu, D.; Chen, J.; Mu, Z. KCaLa(PO4)2:Ce3+,Dy3+ Phosphorsfor White Light-Emitting Diodes with Abnormal Thermal Quenching and High Quantum Efficiency. J. Electron. Mater. 2021, 50, 6283–6290. [Google Scholar] [CrossRef]
- Cheng, Y.; Liu, S.; Zhu, D. Tunable emission, energy transfer and thermal stability of a single-phased Sr(1-x-y)MgP2O7:xCe3+,yDy3+ phosphor for ultraviolet converted white LEDs. J. Alloys Compd. 2019, 783, 19–27. [Google Scholar]
- Choubey, S.R.; Gedam, S.C.; Dhoble, S.J. Resonant and non-resonant energy transfer from Ce3+→X (X=Tb3+, Eu3+ or Dy3+) in NaMgSO4F material. Luminescence 2017, 32, 253–256. [Google Scholar] [CrossRef]
- Richhariya, T.; Brahme, N.; Bisen, D.P.; Badapanda, T.; Tiwari, K.; Jain, A. Investigation of photoluminescence, thermoluminescence, and energy transfer mechanism in Ce/Dy co-doped Sr2Al2SiO7. Mater. Sci. Semicon. Proc. 2023, 159, 107396. [Google Scholar] [CrossRef]
- Hargunani, S.P.; Sonekar, R.P.; Singh, A.; Khosla, A.; Arya, S. Structural and spectral studies of Ce3+ doped Sr3Y(BO3)3 nano phosphors prepared by combustion synthesis. Mater. Technol. 2022, 37, 450–461. [Google Scholar] [CrossRef]
- Karacaoglu, E. Synthesis and effects of co-dopants (La3+, Sm3+, Mn2+, Nd3+, V5+, Y3+) on photoluminescence of SrAl2O4:Dy3+ phosphor. Luminescence 2022, 37, 1714–1724. [Google Scholar] [CrossRef] [PubMed]
- Bandi, V.R.; Nien, Y.-T.; Chen, I.-G. Enhancement of white light emission from novel Ca3Y2Si3O12:Dy3+ phosphors with Ce3+ ion codoping. J. Appl. Phys. 2010, 108, 023111. [Google Scholar] [CrossRef]
- Carnall, W.T.; Fields, P.R.; Rajnak, K. Electronic Energy Levels in the Trivalent Lanthanide Aquo Ions. I. Pr3+, Nd3+, Pm3+, Sm3+, Dy3+, Ho3+, Er3+, and Tm3+. J. Chem. Phys. 1968, 49, 4424–4442. [Google Scholar] [CrossRef]
- Durmus, D. Correlated color temperature: Use and limitations. Light. Res. Technol. 2021, 54, 363–375. [Google Scholar] [CrossRef]
Figure 1.
(a) XRD patterns of KYC:5%Ce3+, KYC:3%Dy3+, and KYC:3%Dy3+,5%Ce3+; (b) Rietveld refinements of KYC:3%Dy3+,5%Ce3+.
Figure 1.
(a) XRD patterns of KYC:5%Ce3+, KYC:3%Dy3+, and KYC:3%Dy3+,5%Ce3+; (b) Rietveld refinements of KYC:3%Dy3+,5%Ce3+.

Figure 2.
(a–h) Morphologies of KYC:3%Dy3+,y%Ce3+ (y = 0, 1, 2, 3, 4, 5, 6, 7); (i) energy dispersive spectrum.
Figure 2.
(a–h) Morphologies of KYC:3%Dy3+,y%Ce3+ (y = 0, 1, 2, 3, 4, 5, 6, 7); (i) energy dispersive spectrum.

Figure 3.
(a) Emission spectra of Dy3+-doped KYC; (b) integrated intensity ratio of blue to yellow (B/Y).
Figure 3.
(a) Emission spectra of Dy3+-doped KYC; (b) integrated intensity ratio of blue to yellow (B/Y).

Figure 4.
Excitation spectra of KYC:3%Dy3+,y%Ce3+ (y = 0, 5).

Figure 5.
(a) Emission spectra of KYC:3%Dy3+,y%Ce3+; (b) integrated intensity ratio of blue to yellow (B/Y).
Figure 5.
(a) Emission spectra of KYC:3%Dy3+,y%Ce3+; (b) integrated intensity ratio of blue to yellow (B/Y).

Figure 6.
Relative intensities of KYC:3%Dy3+,y%Ce3+ at different y concentrations.

Figure 7.
Photoluminescence decay curve of KYC: 3%Dy3+,5%Ce3+.

Figure 8.
Energy transfer mechanism of Ce3+ and Dy3+ in KYC:3%Dy3+,y%Ce3+.

Figure 9.
CIE chromaticity coordinates (×) of KYC: 3%Dy3+,y%Ce3+ excited at 339 nm.


Table 1.
Refined parameters of KYC:3%Dy3+,5%Ce3+.
| Parameter | KY(CO3)2 [24] | KYC:3%Dy3+,5%Ce3+ [This Work] |
|---|---|---|
| Crystal System | Monoclinic | Monoclinic |
| Space group | C2/c | C2/c |
| a (Å) | 8.488 | 8.489 |
| b (Å) | 9.442 | 9.447 |
| c (Å) | 6.913 | 6.922 |
| α (°) | 90.00 | 90.00 |
| β (°) | 110.963 | 110.94 |
| γ (°) | 90.00 | 90.00 |
| Cell Volume (Å3) | 517.4 | 518.340 |
Table 2.
Lifetimes of KYC:3%Dy3+,y%Ce3+.
| No. | y% | τ1 (μs) | τ2 (μs) | τ (μs) |
|---|---|---|---|---|
| 1 | 1% | 274.3 | 949.1 | 826.1 |
| 2 | 2% | 277.4 | 950.2 | 827.4 |
| 3 | 3% | 290.1 | 974.7 | 844.5 |
| 4 | 4% | 300.2 | 985.6 | 859.2 |
| 5 | 5% | 308.4 | 993.3 | 858.7 |
| 6 | 6% | 292.9 | 974.4 | 851.0 |
| 7 | 7% | 311.5 | 985.9 | 850.7 |
Table 3.
Chromaticity coordinates and correlated color temperatures.
| NO. | Samples | x | y | CCT (K) |
|---|---|---|---|---|
| 1 | KYC: 3%Dy3+ | 0.3517 | 0.3524 | 4762 |
| 2 | KYC: 3%Dy3+,1%Ce3+ | 0.3038 | 0.2743 | 8067 |
| 3 | KYC:3%Dy3+,2%Ce3+ | 0.3034 | 0.2737 | 8129 |
| 4 | KYC: 3%Dy3+,3%Ce3+ | 0.3174 | 0.2919 | 6527 |
| 5 | KYC: 3%Dy3+,4%Ce3+ | 0.3138 | 0.2860 | 6879 |
| 6 | KYC:3%Dy3+,5%Ce3+ | 0.3204 | 0.2972 | 6270 |
| 7 | KYC: 3%Dy3+,6%Ce3+ | 0.3149 | 0.2869 | 6777 |
| 8 | KYC: 3%Dy3+,7%Ce3+ | 0.3129 | 0.2840 | 6984 |
| 9 | KYC: 5%Ce3+ | 0.2078 | 0.0632 | 1759 |
| 10 | Daylight | 0.33 | 0.33 | 5616 |
Disclaimer/Publisher’s Note: The statements, opinions and data contained in all publications are solely those of the individual author(s) and contributor(s) and not of MDPI and/or the editor(s). MDPI and/or the editor(s) disclaim responsibility for any injury to people or property resulting from any ideas, methods, instructions or products referred to in the content. |
© 2024 by the authors. Licensee MDPI, Basel, Switzerland. This article is an open access article distributed under the terms and conditions of the Creative Commons Attribution (CC BY) license (https://creativecommons.org/licenses/by/4.0/).
Share and Cite
MDPI and ACS Style
Huang, L.; Qian, J.; Sun, S.; Li, D. Fixed Yellow-to-Blue Intensity Ratio of Dy3+ in KY(CO3)2 Host for Emission Color Tuning. Materials 2024, 17, 1438. https://doi.org/10.3390/ma17061438
AMA Style
Huang L, Qian J, Sun S, Li D. Fixed Yellow-to-Blue Intensity Ratio of Dy3+ in KY(CO3)2 Host for Emission Color Tuning. Materials. 2024; 17(6):1438. https://doi.org/10.3390/ma17061438
Chicago/Turabian StyleHuang, Lei, Jian Qian, Shijian Sun, and Dechuan Li. 2024. "Fixed Yellow-to-Blue Intensity Ratio of Dy3+ in KY(CO3)2 Host for Emission Color Tuning" Materials 17, no. 6: 1438. https://doi.org/10.3390/ma17061438
Note that from the first issue of 2016, this journal uses article numbers instead of page numbers. See further details here.