
Optimization of Pore Characteristics of Graphite-Based Anode for Li-Ion Batteries by Control of the Particle Size Distribution

1
Hydrogen & C1 Gas Research Center, Korea Research Institute of Chemical Technology (KRICT), Daejeon 34114, Republic of Korea
2
Department of Chemical Engineering and Applied Chemistry, Chungnam National University, Daejeon 34134, Republic of Korea
3
Advanced Materials and Chemical Engineering, University of Science and Technology (UST), Daejeon 34113, Republic of Korea
*
Authors to whom correspondence should be addressed.
Materials 2023, 16(21), 6896; https://doi.org/10.3390/ma16216896
Submission received: 15 September 2023
/
Revised: 17 October 2023
/
Accepted: 23 October 2023
/
Published: 27 October 2023
(This article belongs to the Special Issue Green Materials and Manufacturing Processes (2nd Edition))
Abstract
:We investigate the reassembly techniques for utilizing fine graphite particles, smaller than 5 µm, as high-efficiency, high-rate anode materials for lithium-ion batteries. Fine graphite particles of two sizes (0.4–1.2 µm and 5 µm) are utilized, and the mixing ratio of the two particles is varied to control the porosity of the assembled graphite. The packing characteristics of the assembled graphite change based on the mixing ratio of the two types of fine graphite particles, forming assembled graphite with varying porosities. The open porosity of the manufactured assembled graphite samples ranges from 0.94% to 3.55%, while the closed porosity ranges from 21.41% to 26.51%. All the assembled graphite shows improved electrochemical characteristics properties compared with anodes composed solely of fine graphite particles without granulation. The sample assembled by mixing 1.2 µm and 5 µm graphite at a 60:40 ratio exhibits the lowest total porosity (27.45%). Moreover, it exhibits a 92.3% initial Coulombic efficiency (a 4.7% improvement over fine graphite particles) and a capacity of 163.4 mAh/g at a 5C-rate (a 1.9-fold improvement over fine graphite particles).
1. Introduction
The demand for large-scale secondary batteries for electric vehicles and energy storage systems has rapidly increased. Consequently, there is increasing attention on high-rate and high-efficiency anode materials for use in lithium-ion batteries (LIBs) [1,2]. Accordingly, extensive studies are underway to improve various characteristics of materials, such as the rate performance and efficiency of natural graphite, which has been mostly utilized as an anode material for LIBs [3,4,5]. Graphite is the most frequently utilized anode material for LIBs owing to its high electrical conductivity, excellent reversibility for Li+ intercalation/deintercalation, and low operating potential [6,7]. In particular, natural graphite is considered a high-quality and cost-effective carbon material owing to its wide availability, better crystallinity than synthetic graphite, and low energy-intensive processes (thermal treatment is unnecessary) [8,9,10]. However, naturally mined graphite has large flake sizes, which results in limitations, such as Li+ diffusion inhibition and decreased electrode stability owing to accumulated Li+ (e.g., lithium dendrite formation) caused by particle orientation that occurs parallel to the current collector during the rolling process in electrode manufacturing [11,12,13]. Therefore, post-processing steps, such as grinding, classification, and spheronization, are essential to utilize natural graphite as an anode material. During post-processing, a substantial amount of fine graphite particles inevitably forms as by-products [14,15,16,17]. These fine graphite particles exhibit high purity and crystallinity, making them potential candidates for use in LIBs as anode materials. If these fine graphite particles can be utilized, they could resolve environmental and cost-related problems associated with waste disposal while improving the processing efficiency of graphite-based anode materials. However, to achieve this, the shape of the fine graphite particles must be modified to control particle orientation and reduce the specific surface area of the fine particles.
These problems can be addressed by binding fine graphite particles with binder materials to form assembled graphite (secondary particles) via granulation [15,18,19]. Granulation fixes the graphite crystalline to become poly-oriented with binder materials, facilitating multidirectional Li+ movement, and thus improving the rate performance [20,21]. However, existing studies have adopted complex procedures or equipment for manufacturing assembled graphite. In other words, additional processing costs to utilize low-grade graphite particle products have hindered their industrial application [16,22,23]. Therefore, studies should aim to establish methods to effectively use assembled graphite in existing anode manufacturing processes and apply fine graphite particle recycling technology to industrial applications.
In this study, assembled graphite with varying pore characteristics was produced by controlling only the particle size distribution of fine graphite particles. The adopted approach involves a relatively simple manufacturing process, primarily because only the ratio of the input materials in existing anode material production processes is required. Assembled graphite was prepared by mixing and shaping particle size-controlled fine graphite particles with a binder pitch. The pore characteristics of the manufactured assembled graphite were investigated by analyzing the bulk, apparent, and true densities to determine the quantity and shape of the pores. The optimal processing conditions (mixing ratio of fine graphite particles) to manufacture high-rate, high-efficiency anode materials were deduced from the correlation between pore and electrochemical characteristics.
2. Materials and Methods
2.1. Materials
Commercial natural graphite with a size similar to that of fine graphite particles, generated as a process by-product, was purchased (US Research Nanomaterials, Inc., USA). Two types of fine graphite particles were utilized to examine the effect on the particle size distribution of fine graphite particles: large and small particles. The average size of large particles (C > 99.5%, Ash: <0.5%; Moisture: <0.3%, CAS#7782-42-5) was 5 µm, whereas that of small particles (C > 99.9%, Ash: <0.5%; Moisture: <0.3%, CAS#7782-42-5) ranged from 0.4 to 1.2 µm. The two types of fine graphite particles were named NG5 and NG1.2, and both were flake-type graphite. A coal-tar pitch was used as the binder (Handan Jinghao Chemical Co., Ltd., Handan, China). The softening point and coking value of the binder were 107 °C and 34 wt%, respectively.
2.2. Experiments
Assembled graphite was manufactured by bonding fine graphite particles with a binder. In this study, a block was manufactured with a constant state to improve the uniformity of the sample and the reproducibility of the experiment. The overall experimental schematic is shown in Figure 1. Blocks were manufactured through (1) filler mixing/kneading, (2) hot-pressing, and (3) carbonization. Fine graphite particles were used as the filler for the graphite block. The particle size distribution of the filler was set as a variable to control the particle packing in the assembled anode, which was controlled by mixing NG1.2 and NG5 by a weight ratio of 0:100, 10:90, 20:80, 30:70, 40:60, 50:50, 60:40, 80:20, and 100:0. Then, the mixed graphite filler was mixed with binder pitch at 70:30 vol%. The graphite and binder pitch mixing ratio was calculated from the true density to convert the weight format from the volumetric ratio. A total of 10 g graphite filler/binder mixture was kneaded with 30 mL tetrahydrofuran (THF) at 100 °C for 60 min to enhance the uniformity. The kneaded mixture was kept in a convection oven at 80 °C for 24 h to remove the residual THF. The mixture was put into a cylinder mold with a diameter of 10 mm and hot-pressed to 33.34 MPa (340 kgf/cm2) for 5 min at 120 °C (considering the softening point of the binder pitch) to prepare the green block. The green block was carbonized at 1300 °C for 60 min, and the carbonized block (graphite block) was named BSGXs (Xs; NG1.2 fraction). The manufactured graphite block was pulverized using a grinder (Mortar Grinder MG200, POWTEQ, Beijing Grinder Instrument Co., Ltd., Beijing, China) and then classified to 20 um or less using a sieve. Assembled graphite was obtained by granulation, as above, and the prepared anode sample was named SGXs (Xs; NG1.2 fraction).
2.3. Characterization of Assembled Anode
The tap density of the powder sample was measured by utilizing BT-301 (BETTERSIZE, Dandong, China). The tap density was calculated from the volume measured after 3000 taps at 300 taps/min, which was related to the packing density. The pore structure of the graphite block was predicted by utilizing three density values: bulk, apparent, and true densities. The bulk density was calculated from the diameter and height, measured using digital Vernier calipers. The underwater replacement method (JIS Z8807 [24]) was determined for the apparent density using a density meter (DME-220E, Shinko Denshi Co., Ltd., Tokyo, Japan). The true density was obtained by utilizing Micromeritics (AccuPyc II 1340 Pycnometer, Micromeritics, Norcross, GA, USA) in helium gas. In this study, the volume for bulk density was assumed to include open and closed pores, whereas that of the apparent density was assumed to only include closed pores. The true density was assumed to be the volume excluding the pores. The open pore, closed pore, and total porosity of the graphite block were calculated using Equations (1)–(3), as follows [25]:
The carbon yield of the graphite block was calculated as the remaining weight after carbonization at 1300 °C (weight after carbonization/before carbonization × 100, wt%). Images of the assembled graphite and electrode before and after the cycle were obtained via field emission scanning electron microscopy (FE-SEM) and energy-dispersive spectroscopy (EDS) analyses by using the Zeiss GemeniSEM 560 (Zeiss Group, Jena, Germany) at 10 kV. The specific surface area of the assembled graphite was measured by N2 adsorption at −196 °C, utilizing an ASAP 2420 (Micrometrics, Norcross, GA, USA), and calculated using the Brunauer−Emmett−Teller (BET) equation.
2.4. Electrochemical Characterization of Assembled Anode
Electrochemical measurements were performed using coin-type cells (CR2032-type). For the electrode, the slurry was mixed with a composition of 95 wt% active material, 2.5 wt% carboxymethylcelluloses, and 2.5 wt% styrene–butadiene rubber using a THINKY mixer (Thinky USA, Laguna Hills, CA, USA). Subsequently, the slurry was uniformly coated on a Cu current collector and dried at 80 °C for 8 h. The dried electrodes were punched into disk (∅ = 13.5 mm) forms. The loading level of the electrode was 5.0–5.2 mg/cm2, and the loading density was 1.38–1.39 g/cc. The porosity of the electrode was controlled at a range of 35–36% by roll-pressing. The coin cells were assembled in an Ar-filled glove box (H2O, O2 < 0.5 ppm). The electrolyte was 1.0 M LiPF6 with a mixture of ethylene carbonate and diethyl carbonate (1:1 vol%), and polyethylene was utilized as a separator. The galvanostatic charge–discharge of the electrode was measured at 25 °C in a voltage range of 0.01–1.5 V vs. Li/Li+ using a WonATech WBCS3000 (Seoul, Republic of Korea). To measure the rate performance, the coin cells were lithiated at a rate of 0.2 C and delithiated at various rates, ranging from 0.1 C to 5 C. Electrochemical impedance spectroscopy (EIS) was performed at an amplitude of 10 mV and in the frequency range of 100 kHz–0.01 Hz.
3. Results and Discussion
3.1. Effect of Graphite Filler Size Distribution on Block Porosity
Before the graphite block was manufactured, we measured the tap density of physically mixed fine graphite particles of two sizes (without a binder) to observe the packing characteristics based on their mixing ratios. The tap density measurements, corresponding to various fractions (Xs: 0, 10, 20, 30, 40, 50, 60, 80, 90, and 100%) of small graphite particles (NG1.2), are presented in Figure 2 and Table S1. Generally, when different sized particles are mixed, the smaller particles are packed between the larger particles, increasing the tap density [26]. To maximize the tap density, several factors, such as particle size and mixing ratio, must be considered simultaneously [26,27]. In this study, the maximum tap density was achieved when the fraction of small particles was 40%; the tap density exhibited a decreasing trend above and below this point. Based on these tap density measurements, five mixtures with maximum, minimum, and intermediate values in the increasing and decreasing tap density regions were selected to perform the granulation of fine graphite. The selected samples had Xs values of 0, 20, 40, 60, and 100, and their respective tap densities were 0.27, 0.28, 0.35, 0.31, and 0.23 g/mL, respectively.
Graphite blocks (BSG-Xs) were prepared by mixing with the binder pitch, followed by kneading and carbonizing mixtures with Xs values of 0, 20, 40, 60, and 100. The packing characteristics of the manufactured graphite blocks were evaluated through three types of density (bulk, apparent, and true density), as presented in Table 1 and Figure 3a. All three densities showed a common trend reversal in BSG60. Such changes in density indicate a transformation in the pore structure. The porosity (open, closed, and total porosity) of the graphite block was calculated from the three types of density, as indicated in Table 1 and Figure 3b [25]. As the mixing ratio of smaller particles increased, total porosity decreased, reaching a minimum point in the BSG60 sample before increasing again. In other words, the BSG60 sample with a small particle mixing ratio of 60% represents the optimal point for porosity minimization, exhibiting the highest closed porosity (26.51%) and the lowest open porosity (0.94%).
The total porosity and carbonization yield of the block were inversely related. Despite using the same type and ratio of binder pitch, the carbon yield between graphite blocks differed. As graphite has no mass or state changes during carbonization, only the carbonization behavior of the binder pitch influences the carbon yield of the graphite block. Assuming a 0% change in the mass of graphite during carbonization, the calculated carbon yields of the binder pitch in BSG0, BSG20, BSG40, BSG60, and BSG100 are 39.5, 48.2, 49.9, 51.1, and 49.9 wt%, respectively. This implies that the carbonization behavior of the binder pitch varied with the particle packing structure of the graphite filler. For an accurate comparison, we carried out TG analysis to investigate the carbon yield of the binder pitch carbonized without the graphite filler, as shown in Figure 4. Based on the results, the carbon yield of the binder pitch alone was 34 wt%, which is substantially lower than when co-carbonized with a graphite filler. Thus, the following conclusions can be drawn. First, when the binder pitch coexists with graphite filler, the interaction between graphite and pitch enhances the carbon yield of the binder pitch. Second, the particle packing structure of the graphite filler influences the carbonization behavior of the binder pitch, thereby altering the porosity of the graphite block.
The mechanism to explain these two facts is illustrated in Figure 5. Generally, the carbon yield of the pitch increases when it is co-carbonized with filler materials, such as cokes or graphite. This results from the interaction between the pitch and the filler material, which suppresses the volatilization of components with low boiling points in the pitch [28,29]. Therefore, the open porosity varied based on the contact area between the binder pitch and graphite filler, influenced by the volatilization of components with low boiling points. When only utilizing large particles as fillers to manufacture the block, the particle packing is loose, resulting in a relative increase in regions where the binder pitch locally aggregates. This increases the open pore fraction, as shown in Figure 5a, thereby decreasing the carbon yield. This explains the reason BSG0 exhibits the highest open porosity (30.96%) and the lowest yield (87.89 wt%). However, the contact sites between the filler and pitch increase when small particles are packed between large particles. In other words, the areas in which the pitch locally aggregates decreases. As shown in Figure 5b, this resulted in relatively low open porosity and high carbon yield.
Closed pores refer to internally isolated pores that are not connected to the exterior. Graphite blocks containing both small and large particles exhibited a high fraction of closed pores because the binder pitch was insufficient to fill the void spaces between particles. When the contact area of graphite filler increases, more binder pitch is required for bonding between particles. More binder pitch is required when containing both small and large particles because their contact area also increases. However, in this study, the same binder ratio prepared the entire graphite blocks. BSG 20, 40, and 60 are considered binder shortage conditions, rather than BSG0, in which a large portion of the pitch is used for the binding of particles [30]. Therefore, the effect of filling the void spaces between the particles can be weakened, and the void remains a closed pore [30].
For the high-density and high-strength graphite block, the formation of open and closed pores should be minimized by optimizing the amount of binder pitch in the highest tap-density filler particle mixture. However, from the perspective of electrode materials, the role of pores differs. As the ratio of open pores increases, the solid electrode interphase (SEI) layer forms broadly and unevenly, which should be minimized [31,32,33]. Conversely, closed pores formed inside graphite particles can act as a volume expansion buffer during repeated charge and discharge, improving long-term cycle stability [34,35]. The fine graphite assembly process presented in this study shows a phenomenon in which open pores transform into closed pores at the optimum point, suggesting that the SEI layer on the anode material will form stably while improving the the cycle stability.
3.2. Characteristics of Assembled Graphite According to the Porosity of the Graphite Block
The produced graphite blocks were ground and classified to sizes below 20 µm for application as anode materials in LIBs. The ground and classified assembled graphite particles were named SG-Xs. The images of the fine graphite particles utilized as a graphite filler and the assembled graphite (secondary particles by granulation) are shown in Figure 6. As shown in Figure 6a,b, fine graphite particles exist in the form of flake-type 2D sheets. The assembled graphite has relatively spherical shapes formed by the aggregation of fine graphite particles owing to the binder. The particle size increased to 17.5 μm based on the d50 criteria, compared with the size of fine graphite particles (Figure S1). Thus, it is validated that assembled graphite with a controlled shape and size was successfully manufactured.
The changes in tap density and BET-specific surface area before and after granulation are listed in Table 2. Compared with the fine graphite particles (NG1.2 and NG5), the assembled graphite (SG-series) exhibits a reduced specific surface area. The nm-scale pores detected in BET analysis accelerate the electrolyte decomposition reaction, reducing Coulombic efficiency and cycle stability [36,37]. Meanwhile, the tap density increased in all assembled graphite samples compared with fine graphite particles, with a maximum increase of 37% (SG60; 0.3142 g/mL). A high tap density implies a higher Li+ storage site in limited space, which is crucial for improving the energy density [38]. Therefore, assembled graphite can be applied as a promising anode material in terms of its high efficiency and high energy density.
3.3. Electrochemical Characteristics of Assembled Graphite
The galvanostatic charge and discharge profiles of the assembled graphite corresponding to the first cycle are shown in Figure 7a, and Table 3 summarizes the first cycle charge/discharge capacity and initial Coulombic efficiency (ICE). ICE increased as the open porosity calculated in Table 1 and Figure 3a decreased. SG60, which had the lowest open porosity at 0.94%, exhibited the highest ICE of 92.3%. The decrease in ICE originated from the irreversible capacity lost during the formation of the SEI layer [31,32,33]. Therefore, open pores accelerated the electrolyte decomposition reaction. Peaks related to SEI layer formation occurred in the 0.6–0.7 V range during the first charge profile, as depicted in Figure 7a [39,40]. A more detailed comparison of the peak intensity through differential capacity analysis (dQ/dV) is shown in Figure 7b. Based on the results, the most distinct peaks were observed in SG0 and SG20 (86.4% and 86.0%), which had the lowest ICEs. However, SG60, which had the highest ICE, only showed a slight peak, validating the effective suppression of the electrolyte decomposition reaction.
The rate performance test of the assembled and fine graphite particles was measured at scan rates of 0.1, 0.2, 0.5, 1, 2, and 5 C, respectively, as shown in Figure 7c. Following a pre-cycle (three cycles at 0.1 C), measurements were performed at each c-rate for every three cycles. NG1.2, the fine graphite particle with the smaller particle size, was selected for comparison to comprehensively examine the granulation effect. As presented in Figure 7c and Table S2, all the assembled graphite (SG-series) showed an improved rate capability compared with fine graphite particles. At 5 C/0.2 C, the capacity retention of NG1.2 was just 24.4%, the poorest among the samples. NG1.2 has limited sites for Li+ intercalation because the flakes aligned in a uniaxial direction during rolling [11,12,13]. However, the assembled graphite was less impacted by rolling effects because its flake pieces were assembled into a spherical shape without a preferred orientation, enabling multidirectional Li+ intercalation [20,21]. The superior rate capability of assembled graphite originated from this relatively advantageous structure for Li+ transport. Among the assembled graphite, SG60 exhibited the best rate capability, with a capacity retention of 47.0% at 5 C/0.2 C. This is because the binder pitch included in BSG60 had the highest carbon yield. Upon carbonization, the binder pitch transformed into amorphous carbon, which, owing to its low crystallinity, contributed less to capacity, but it is an excellent material for rate capability [41]. As explained in Section 3.1, BSG60 had the highest carbon yield owing to its unique packing structure (Table 1, Figure 4), indicating that it had the highest proportion of residual amorphous carbon. Therefore, the rate capability was enhanced owing to the high proportion of amorphous carbon in the assembled graphite. The prepared SG60 also exhibited excellent electrochemical properties compared to commercial graphite (Table S3).
The cycle performance test was conducted at 0.2 C for 100 cycles and is illustrated in Figure 7d. The assembled graphite showed excellent cycle stability, with over 100% capacity retention and 98% Coulombic efficiency after 100 cycles (Table 4). In contrast, NG1.2 exhibited a relatively low capacity retention of 91.5%. The continuous capacity fading of NG1.2 resulted from the formation of a thick and unstable SEI layer caused by its high specific surface area, as indicated in Table 2. This is evidenced in the EDS mapping image. Meanwhile, a slight initial increase in capacity was observed for the assembled graphite. This is common in materials with high porosity, resulting from gradual electrolyte infiltration [42,43].
To better understand the electrochemical behavior, we performed EIS measurements. Nyquist plots before and after 10 cycles are illustrated in Figure 8a and Figure 8c, respectively. The related EIS parameters are listed in Table 5. Rs, RSEI, and Rct represent the electrolyte resistance, resistance due to the formation of an SEI layer at the electrode interface, and charge-transfer resistance, respectively [44]. As shown in Figure 8a, the Nyquist plots of the pre-cycle samples comprised a semicircle and straight line in the high-frequency and low-frequency regions, respectively. The diameter of the semicircle is related to the charge-transfer resistance (Rct) at the electrode–electrolyte interface. Assembled graphite exhibited lower Rct values compared with NG1.2, indicating improved accessibility for Li+ to the electrode. Among the assembled graphite, SG60 had the lowest Rct value of 119.3 Ω, implying that it had the most favorable structure for Li+ transport. This is consistent with the rate performance test results shown in Figure 7c. The diameter of the first semicircle in the high-frequency region of the Nyquist plots after 10 cycles, shown in Figure 8c, represents RSEI, and the calculated values are presented in Figure 8d and Table 5. NG1.2 exhibited the highest RSEI value (4.23 Ω), which may be related to its poor cycling characteristics, as shown in Figure 7d.
The diffusion coefficient for Li+ (DLi+) was calculated to further investigate the electrochemical kinetics. The Warburg factor (σ) was calculated as follows [45,46]:
The value of σ was determined by utilizing the slope of linear fitting of the real part of the impedance (Re(Z)) versus the inverse square root of the angular frequency (ω-0.5), as shown in Figure 8b. The DLi+ was calculated based on the obtained σ using Equation (5) [45,46]:
where R denotes the gas constant, T symbolizes the absolute temperature, A refers to the surface area of the electrode, F is Faraday’s constant, and C is the molar concentration of Li+ in the solution. The calculated DLi+ values are listed in Table 6. NG1.2 exhibited the lowest DLi+ value of 9.2007 10−13, indicating that Li+ diffusion within the electrode was more favorable in the assembled graphite.
FE-SEM images of the electrode cross-sections before and after 100 cycles are displayed in Figure 9. In Figure 9a, NG1.2 shows densely packed particles in a flake-like form owing to their uniaxial directional compression during rolling. In contrast, as shown in Figure 9b, SG60 maintained micrometer-scale voids between particles, even after rolling, owing to its controlled morphology. Such voids facilitate electrolyte infiltration, which is correlated with the excellent rate capability of SG60. After 100 cycles, the electrode thicknesses for NG1.2 and SG60 were 66.8 µm and 58.2 µm, respectively, displaying expansion rates of 32.8% and 17.1%, respectively. When a lithium-ion battery (LIB) undergoes charge/discharge process, the intercalation/deintercalation of lithium ions into/from the graphite lattice causes repeated expansion and contraction of graphite. Stresses are inevitably generated in electrodes by such periodic volume changes and are probably accumulated during the cycling process. For this reason, volume expansion of the electrode occurs as shown in Figure 9, which is more critical to the NG1.2 electrode, which has more dense packing [47]. This difference in electrode expansion behavior originated from the structural features of the two materials. Based on numerous studies, the closed pores formed within the particles absorb the volume expansion owing to repeated charging and discharging, thereby enhancing cycle stability [34,35]. Therefore, the impact resulted from the closed pores that naturally occurred in the granulation process of SC60. EDS mapping was performed to further examine the distribution of the SEI layer after 100 cycles. The F mapping images, representing major elements of the SEI layer, are shown in Figure 10. In Figure 10a,b, NG1.2 shows a thick, localized accumulation of the SEI layer on the surface owing to its large specific surface area and dense particle packing. This resulted in a poor rate capability and low cycle stability. However, SG60 exhibited a uniform and stable formation of the SEI layer across the surface and the interior of the electrode.
4. Conclusions
In this study, assembled graphite electrodes were manufactured by utilizing fine graphite particles. Assembled graphite with differing pore characteristics was prepared by controlling the particle size distribution of the fine graphite particles. All assembled graphite samples exhibited reduced specific surface areas, increased tap density, and improved electrochemical properties compared with those of fine graphite particles. The most electrochemically superior assembled graphite was the SG60 electrode, which exhibited the lowest total porosity of 27.45% and the highest block carbon yield (90.22 wt%). The SG60 electrode showed the highest ICE of 92.3% owing to its low open porosity of 0.94% and also showed the lowest RSEI values after 10 cycles. Furthermore, the SG60 electrode exhibited only a 17.1% electrode expansion rate after 100 cycles at 0.2 C, further validating its vastly superior structural stability compared with fine graphite particles (with an electrode expansion rate of 32.8%). Finally, SG60 exhibited the highest rate capability owing to its multidirectional increase in Li+ intercalation sites and high amorphous carbon content. The granulation process proposed in this study could enhance properties by only controlling material composition, without involving complex procedures. Therefore, it is expected to be highly utilizable in the existing secondary battery anode material industry.
Supplementary Materials
The following supporting information can be downloaded at: https://www.mdpi.com/article/10.3390/ma16216896/s1, Figure S1: Particle size distribution of fine and assembled graphite; Table S1: Tap density based on the fraction of small graphite particles; Table S2: Average capacity and capacity retention based on the C-rate; Table S3: Electrochemical properties of assembled graphite, NG1.2 and commercial graphite: discharge capacity, first cycle Coulombic efficiency, and Retention rate. Reference [48] are cited in the supplementary materials.
Author Contributions
Conceptualization, J.-H.K.; methodology, Y.-J.C.; formal analysis, Y.-J.C.; investigation, Y.-J.C. and J.-H.K.; data curation, Y.-J.C.; writing—original draft preparation, Y.-J.C.; writing—review and editing, J.-H.K., J.-S.I. and Y.-S.L.; visualization, Y.-J.C.; supervision, J.-S.I. and Y.-S.L.; project administration, J.-S.I. and Y.-S.L.; funding acquisition, J.-S.I. All authors have read and agreed to the published version of the manuscript.
Funding
This work was supported by the Technology Innovation Program (20006696, Development of isotropic graphite block for semiconductor process) funded By the Ministry of Trade, Industry & Energy (MOTIE, Korea).
Institutional Review Board Statement
Not applicable.
Informed Consent Statement
Not applicable.
Data Availability Statement
Data are contained within the article.
Conflicts of Interest
The authors declare no conflict of interest.
References
- Hu, D.; Chen, L.; Tian, J.; Su, Y.; Li, N.; Chen, G.; Hu, Y.; Dou, Y.; Chen, S.; Wu, F. Research Progress of Lithium Plating on Graphite Anode in Lithium-Ion Batteries. Chin. J. Chem. 2021, 39, 165–173. [Google Scholar] [CrossRef]
- Zhan, H.; Yang, Y.; Ren, D.; Wang, L.; He, X. Graphite as anode materials: Fundamental mechanism, recent progress and advances. Energy Storage Mater. 2021, 36, 147–170. [Google Scholar] [CrossRef]
- Kwon, H.-J.; Woo, S.-W.; Lee, Y.-J.; Kim, J.-Y.; Lee, S.-M. Achieving High-Performance Spherical Natural Graphite Anode through a Modified Carbon Coating for Lithium-Ion Batteries. Energies 2021, 14, 1946. [Google Scholar] [CrossRef]
- Fischer, S.; Doose, S.; Müller, J.; Höfels, C.; Kwade, A. Impact of Spheroidization of Natural Graphite on Fast-Charging Capability of Anodes for LIB. Batteries 2023, 9, 305. [Google Scholar] [CrossRef]
- Im, U.-S.; Hwang, J.U.; Yun, J.H.; Ahn, W.; Kim, K.S.; Im, J.S. The effect of mild activation on the electrochemical performance of pitch-coated graphite for the lithium-ion battery anode material. Mater. Lett. 2020, 278, 128421. [Google Scholar] [CrossRef]
- Chang, H.; Wu, Y.-R.; Han, X.; Yi, Y.-F. Recent developments in advanced anode materials for lithium-ion batteries. Energy Mater. 2021, 1, 100003. [Google Scholar] [CrossRef]
- Zhao, L.; Ding, B.; Qin, X.-Y.; Wang, Z.; Lv, W.; He, Y.-B.; Yang, Q.-H.; Kang, F. Revisiting the Roles of Natural Graphite in Ongoing Lithium-Ion Batteries. Adv. Mater. 2022, 34, 2106704. [Google Scholar] [CrossRef]
- Heng, S.; Shan, X.; Wang, W.; Wang, Y.; Zhu, G.; Qu, Q.; Zheng, H. Controllable solid electrolyte interphase precursor for stabilizing natural graphite anode in lithium ion batteries. Carbon 2020, 159, 390–400. [Google Scholar] [CrossRef]
- Biber, B.; Sander, S.; Martin, J.; Wohlfahrt-Mehrens, M.; Mancini, M. Improved production process with new spheroidization machine with high efficiency and low energy consumption for rounding natural graphite for Li-ion battery applications. Carbon 2023, 201, 847–855. [Google Scholar] [CrossRef]
- Moradi, B.; Botte, G.G. Recycling of graphite anodes for the next generation of lithium ion batteries. J. Appl. Electrochem. 2016, 46, 123–148. [Google Scholar] [CrossRef]
- Jara, A.D.; Betemariam, A.; Woldetinsae, G.; Kim, Y.J. Purification, application and current market trend of natural graphite: A review. Int. J. Min. Sci. Technol. 2019, 25, 671–689. [Google Scholar] [CrossRef]
- Wu, X.; Song, B.; Chein, P.-H.; Everett, S.M.; Zhao, K.; Liu, J.; Du, Z. Structural Evolution and Transition Dynamics in Lithium Ion Battery under Fast Charging: An Operando Neutron Diffraction Investigation. Adv. Sci. 2021, 8, 2102318. [Google Scholar] [CrossRef] [PubMed]
- Weiss, M.; Ruess, R.; Kasnatscheew, J.; Levartovsky, Y.; Levy, N.R.; Minnmann, P.; Stolz, L.; Waldmann, T.; Wohlfahrt-Mehrens, M.; Aurbach, D.; et al. Fast Charging of Lithium-Ion Batteries: A Review of Materials Aspects. Adv. Energy Mater. 2021, 11, 2101126. [Google Scholar] [CrossRef]
- Liu, P.; Wang, H.; Huang, T.; Li, L.; Xiong, W.; Huang, S.; Ren, X.; Ouyang, X.; Hu, J.; Zhang, Q.; et al. Cost-effective natural graphite reengineering technology for lithium ion batteries. Chin. Chem. Lett. 2023, in press. [CrossRef]
- Fu, Y.; Jin, Y.; Ma, J.; Liu, J.; Wang, Z.; Wang, B.; Gong, X. Lithium-ion transfer strengthened by graphite tailings and coking coal for high-rate performance anode. Chem. Eng. J. 2022, 442, 136184. [Google Scholar] [CrossRef]
- Abrego-Martinez, J.C.; Wang, Y.; Vanpeene, V.; Roué, L. From waste graphite fines to revalorized anode material for Li-ion batteries. Carbon 2023, 209, 118004. [Google Scholar] [CrossRef]
- Escher, I.; Mancini, M.; Martin, J.; Janßen, K.A.; Axmann, P.; Adelhelm, P. Towards low-cost sodium-ion batteries: Electrode behavior of graphite electrodes obtained from spheroidization waste fractions and their structure-property relations. J. Phys. Energy 2023, 5, 014011. [Google Scholar] [CrossRef]
- Yang, X.; Zhan, C.; Ren, X.; Wang, C.; Wei, L.; Yu, Q.; Xu, D.; Nan, D.; Lv, R.; Shen, W.; et al. Nitrogen-doped hollow graphite granule as anode materials for high-performance lithium-ion batteries. J. Solid State Chem. 2021, 303, 122500. [Google Scholar] [CrossRef]
- Zhang, J.-P.; Wang, D.-K.; Zhang, L.-H.; Liu, H.-Y.; Liu, Z.-B.; Xing, T.; Ma, Z.-K.; Chen, X.-H.; Song, H.-H. A wet granulation method to prepare graphite particles with a high tap density for high volumetric energy density lithium-ion storage. New Carbon Mater. 2022, 37, 402–410. [Google Scholar] [CrossRef]
- Ma, Y.; Zheng, Y.; Xu, M.; Huang, S.; Yuan, G. One-Step Binding and Wrapping Fragmented Natural Microcrystalline Graphite via Phenolic Resin into Secondary Particles for High-Performance Lithium-Ion Battery Anode. JOM 2023, in press. [CrossRef]
- Mu, Y.; Han, M.; Li, J.; Liang, J.; Yu, J. Growing vertical graphene sheets on natural graphite for fast charging lithium-ion batteries. Carbon 2021, 173, 477–484. [Google Scholar] [CrossRef]
- Chen, L.; Xie, X.; Wang, B.; Wang, K.; Xie, J. Spherical nanostructured Si/C composite prepared by spray drying technique for lithium ion batteries anode. Mater. Sci. Eng. B 2006, 131, 186–190. [Google Scholar] [CrossRef]
- Wu, X.; Yang, X.; Zhang, F.; Cai, L.; Zhang, L.; Wen, Z. Carbon-coated isotropic natural graphite spheres as anode material for lithium-ion batteries. Ceram. Int. 2017, 43, 9458–9464. [Google Scholar] [CrossRef]
- Methods of Measuring Density and Specific Gravity of Solid, 12th ed.; Japanese Standards Association (JSA): Japan, 2022.
- Kim, J.H. Control of the properties of a binder pitch to enhance the density and strength of graphite blocks. Carbon Lett. 2023, 33, 1757–1766. [Google Scholar] [CrossRef]
- Liu, Z.-R.; Ye, W.-M.; Zhang, Z.; Wang, Q.; Chen, Y.-G.; Cui, Y.-J. Particle size ratio and distribution effects on packing behaviour of crushed GMZ bentonite pellets. Powder Technol. 2019, 351, 92–101. [Google Scholar] [CrossRef]
- Xu, W.; Zhang, K.; Zhang, Y.; Jiang, J. Packing Fraction, Tortuosity, and Permeability of Granular-Porous Media With Densely Packed Spheroidal Particles: Monodisperse and Polydisperse Systems. Water Resour. Res. 2022, 58, e2021WR031433. [Google Scholar] [CrossRef]
- Petrova, B.; Budinova, T.; Ekinci, E.; Petrov, N.; Yardim, F. Influence of pitch composition and surface properties of petroleum coke on their interaction during the preparation of carbon/carbon composites. Carbon 2007, 45, 704–709. [Google Scholar] [CrossRef]
- Lahaye, J.; Aubert, J.-P. Interaction between a coke and a tar. 1. Influence of the surface chemical functions of coke. Fuel 1977, 56, 185–187. [Google Scholar] [CrossRef]
- Kim, J.-H.; Hwang, H.-I.; Im, J.-S. Optimization of the Filler-and-Binder Mixing Ratio for Enhanced Mechanical Strength of Carbon–Carbon Composites. Materials 2023, 16, 4084. [Google Scholar] [CrossRef] [PubMed]
- An, S.J.; Li, J.; Daniel, C.; Mohanty, D.; Nagpure, S. The state of understanding of the lithium-ion-battery graphite solid electrolyte interphase (SEI) and its relationship to formation cycling. Carbon 2016, 105, 52–76. [Google Scholar] [CrossRef]
- Kim, J.; Jeghan, S.M.N.; Lee, G. Superior fast-charging capability of graphite anode via facile surface treatment for lithium-ion batteries. Microporous Mesoporous Mater. 2020, 305, 110325. [Google Scholar] [CrossRef]
- Yu, K.; Li, J.; Qi, H.; Liang, C. High-capacity activated carbon anode material for lithium-ion batteries prepared from rice husk by a facile method. Diam. Relat. Mater. 2018, 86, 139–145. [Google Scholar] [CrossRef]
- Mundszinger, M.; Farsi, S.; Rapp, M.; Golla-Schindler, U.; Kaiser, U.; Wachtler, M. Morphology and texture of spheroidized natural and synthetic graphites. Carbon 2017, 111, 764–773. [Google Scholar] [CrossRef]
- Sutton, A.L.; Howard, V.C. The role of porosity in the accommodation of thermal expansion in graphite. J. Nucl. Mater. 1962, 7, 58–71. [Google Scholar] [CrossRef]
- Sun, L.; Liu, Y.; Wu, J.; Shao, R.; Jiang, R.; Tie, Z.; Jin, Z. A Review on Recent Advances for Boosting Initial Coulombic Efficiency of Silicon Anodic Lithium Ion batteries. Small 2022, 18, 2102894. [Google Scholar] [CrossRef]
- Li, X.; Sun, X.; Hu, X.; Fan, F.; Cai, S.; Zheng, C.; Stucky, G.D. Review on comprehending and enhancing the initial Coulombic efficiency of anode materials in lithium-ion/sodium-ion batteries. Nano Energy 2020, 77, 105143. [Google Scholar] [CrossRef]
- Tian, J.; Yang, H.; Fu, C.; Sun, M.; Wang, L.; Liu, T. In-situ synthesis of microspherical Sb@C composite anode with high tap density for lithium/sodium-ion batteries. Compos. Commun. 2020, 17, 177–181. [Google Scholar] [CrossRef]
- Kim, K.H.; Cho, J.H.; Hwang, J.U.; Im, J.S.; Lee, Y.-S. A key strategy to form a LiF-based SEI layer for a lithium-ion battery anode with enhanced cycling stability by introducing a semi-ionic C-F bond. J. Ind. Eng. Chem. 2021, 25, 48–54. [Google Scholar] [CrossRef]
- Li, X.; Geng, D.; Zhang, Y.; Meng, X.; Li, R.; Sun, X. Superior cycle stability of nitrogen-doped graphene nanosheets as anodes for lithium ion batteries. Electrochem. Commun. 2011, 13, 822–825. [Google Scholar] [CrossRef]
- Lee, S.E.; Kim, J.H.; Lee, Y.-S.; Im, J.S. Effect of coke orientation on the electrochemical properties of lithium-ion battery anode. J. Appl. Electrochem. 2021, 51, 1407–1418. [Google Scholar] [CrossRef]
- Jeong, C.-U.; Umirov, N.; Jung, D.-H.; Seo, D.-H.; Lee, B.-M.; Choi, B.-S.; Kim, S.-S.; Choi, J.-H. Li-incorporated porous carbon monoliths derived from carboxymethyl cellulose as anode material for high power lithium-ion batteries. J. Power Sources 2021, 506, 230050. [Google Scholar] [CrossRef]
- Gao, P.; Tang, H.; Xing, A.; Bao, Z. Porous silicon from the magnesiothermic reaction as a high-performance anode material for lithium ion battery applications. Electrochim. Acta 2017, 228, 545–552. [Google Scholar] [CrossRef]
- Chen, S.; Huang, Y.; Zhang, K.; Feng, X.; Wang, M. Synthesis and high-performance of carbonaceous polypyrrole nanotubes coated with SnS2 nanosheets anode materials for lithium ion batteries. Chem. Eng. J. 2017, 330, 470–479. [Google Scholar] [CrossRef]
- Kurc, B.; Piglowska, M. An influence of temperature on the lithium ions behavior for starch-based carbon compared to graphene anode for LIBs by the electrochemical impedance spectroscopy (EIS). J. Power Sources 2021, 485, 229323. [Google Scholar] [CrossRef]
- Peng, J.; Li, W.; Wu, Z.; Li, H.; Zeng, P.; Chen, G.; Chang, B.; Zhang, X.; Wang, X. Si/C composite embedded nano-Si in 3D porous carbon matrix and enwound by conductive CNTs as anode of lithium-ion batteries. Sustain. Mater. Technol. 2022, 32, e00410. [Google Scholar] [CrossRef]
- Liu, D.; Wang, Y.; Xie, Y.; He, L.; Chen, J.; Wu, K.; Xu, R.; Gao, Y. On the stress characteristics of graphite anode in commercial pouch lithium-ion battery. J. Power Sources 2013, 232, 29–33. [Google Scholar] [CrossRef]
- Han, Y.-J.; Kim, J.; Yeo, J.-S.; An, J.C.; Hong, I.-P.; Nakabayashi, K.; Miyawaki, J.; Jung, J.-D.; Yoon, S.-H. Coating of graphite anode with coal tar pitch as an effective precursor for enhancing the rate performance in Li-ion batteries: Effects of composition and softening points of coal tar pitch. Carbon 2015, 94, 432–438. [Google Scholar] [CrossRef]
Figure 1.
Schematic of the experimental method.
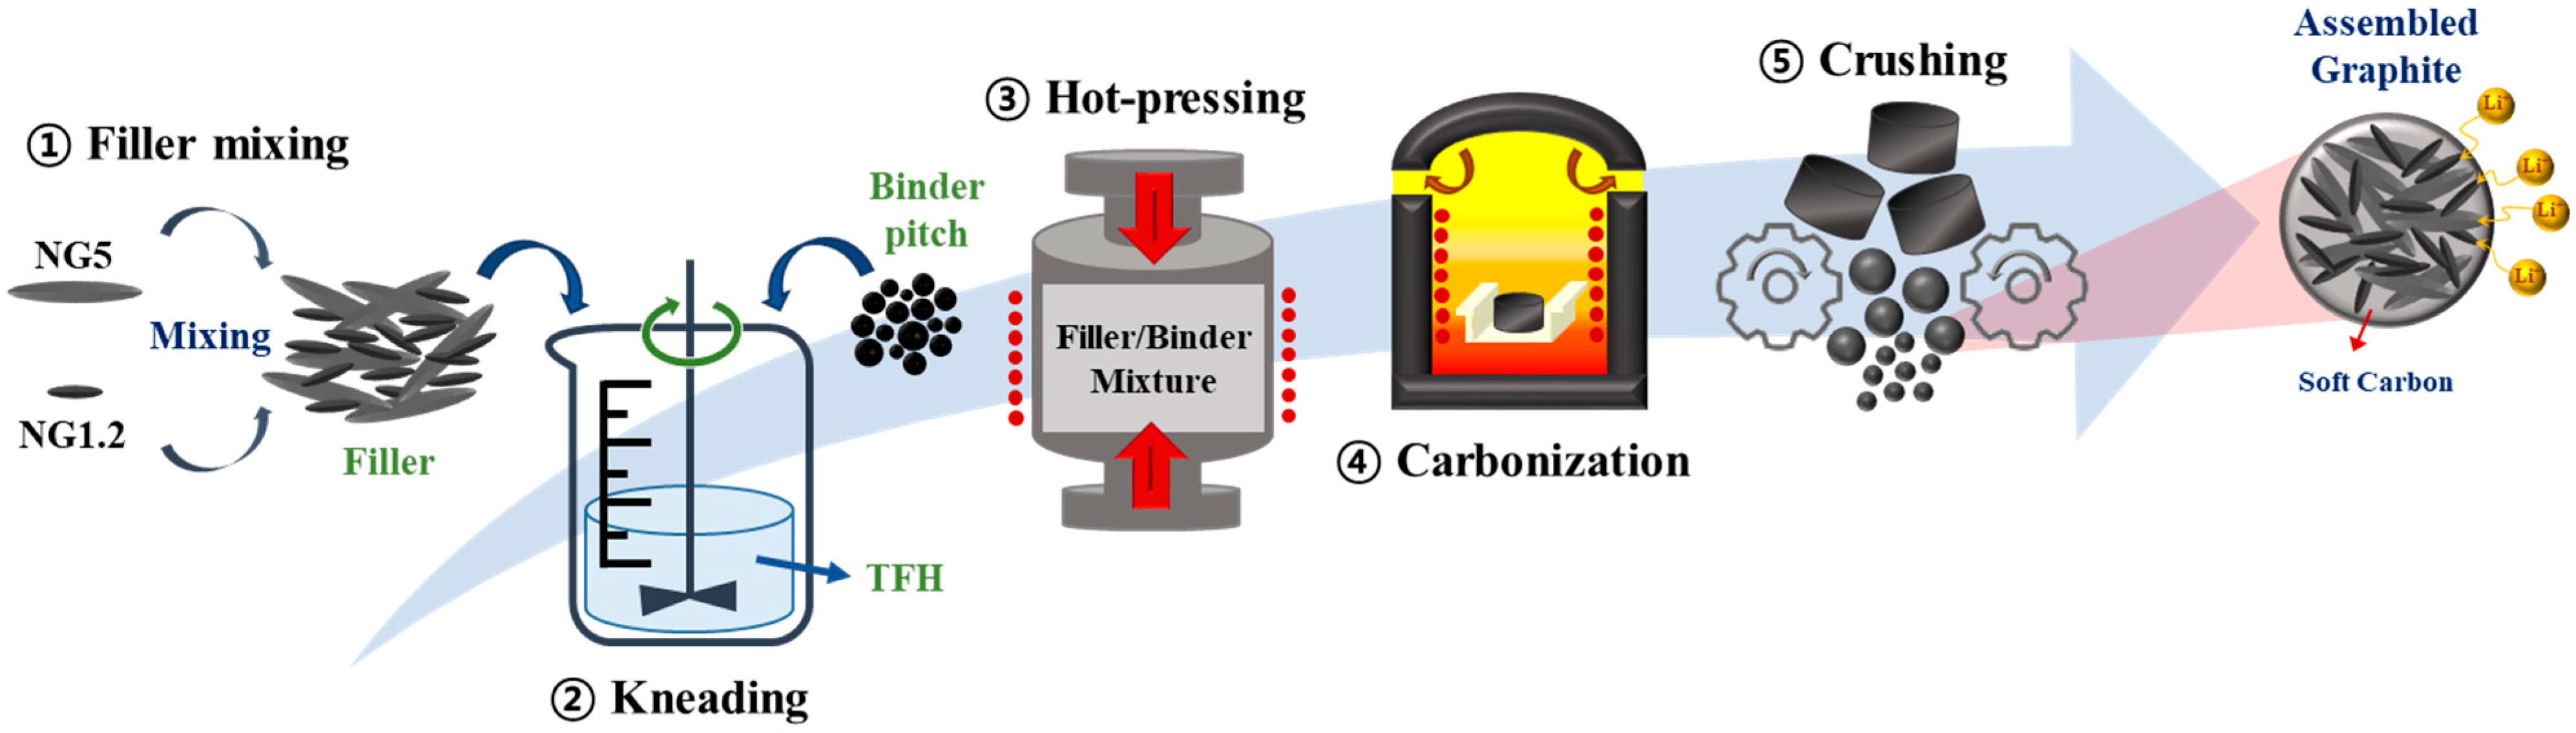
Figure 2.
Tap density based on the fraction of small graphite particles.
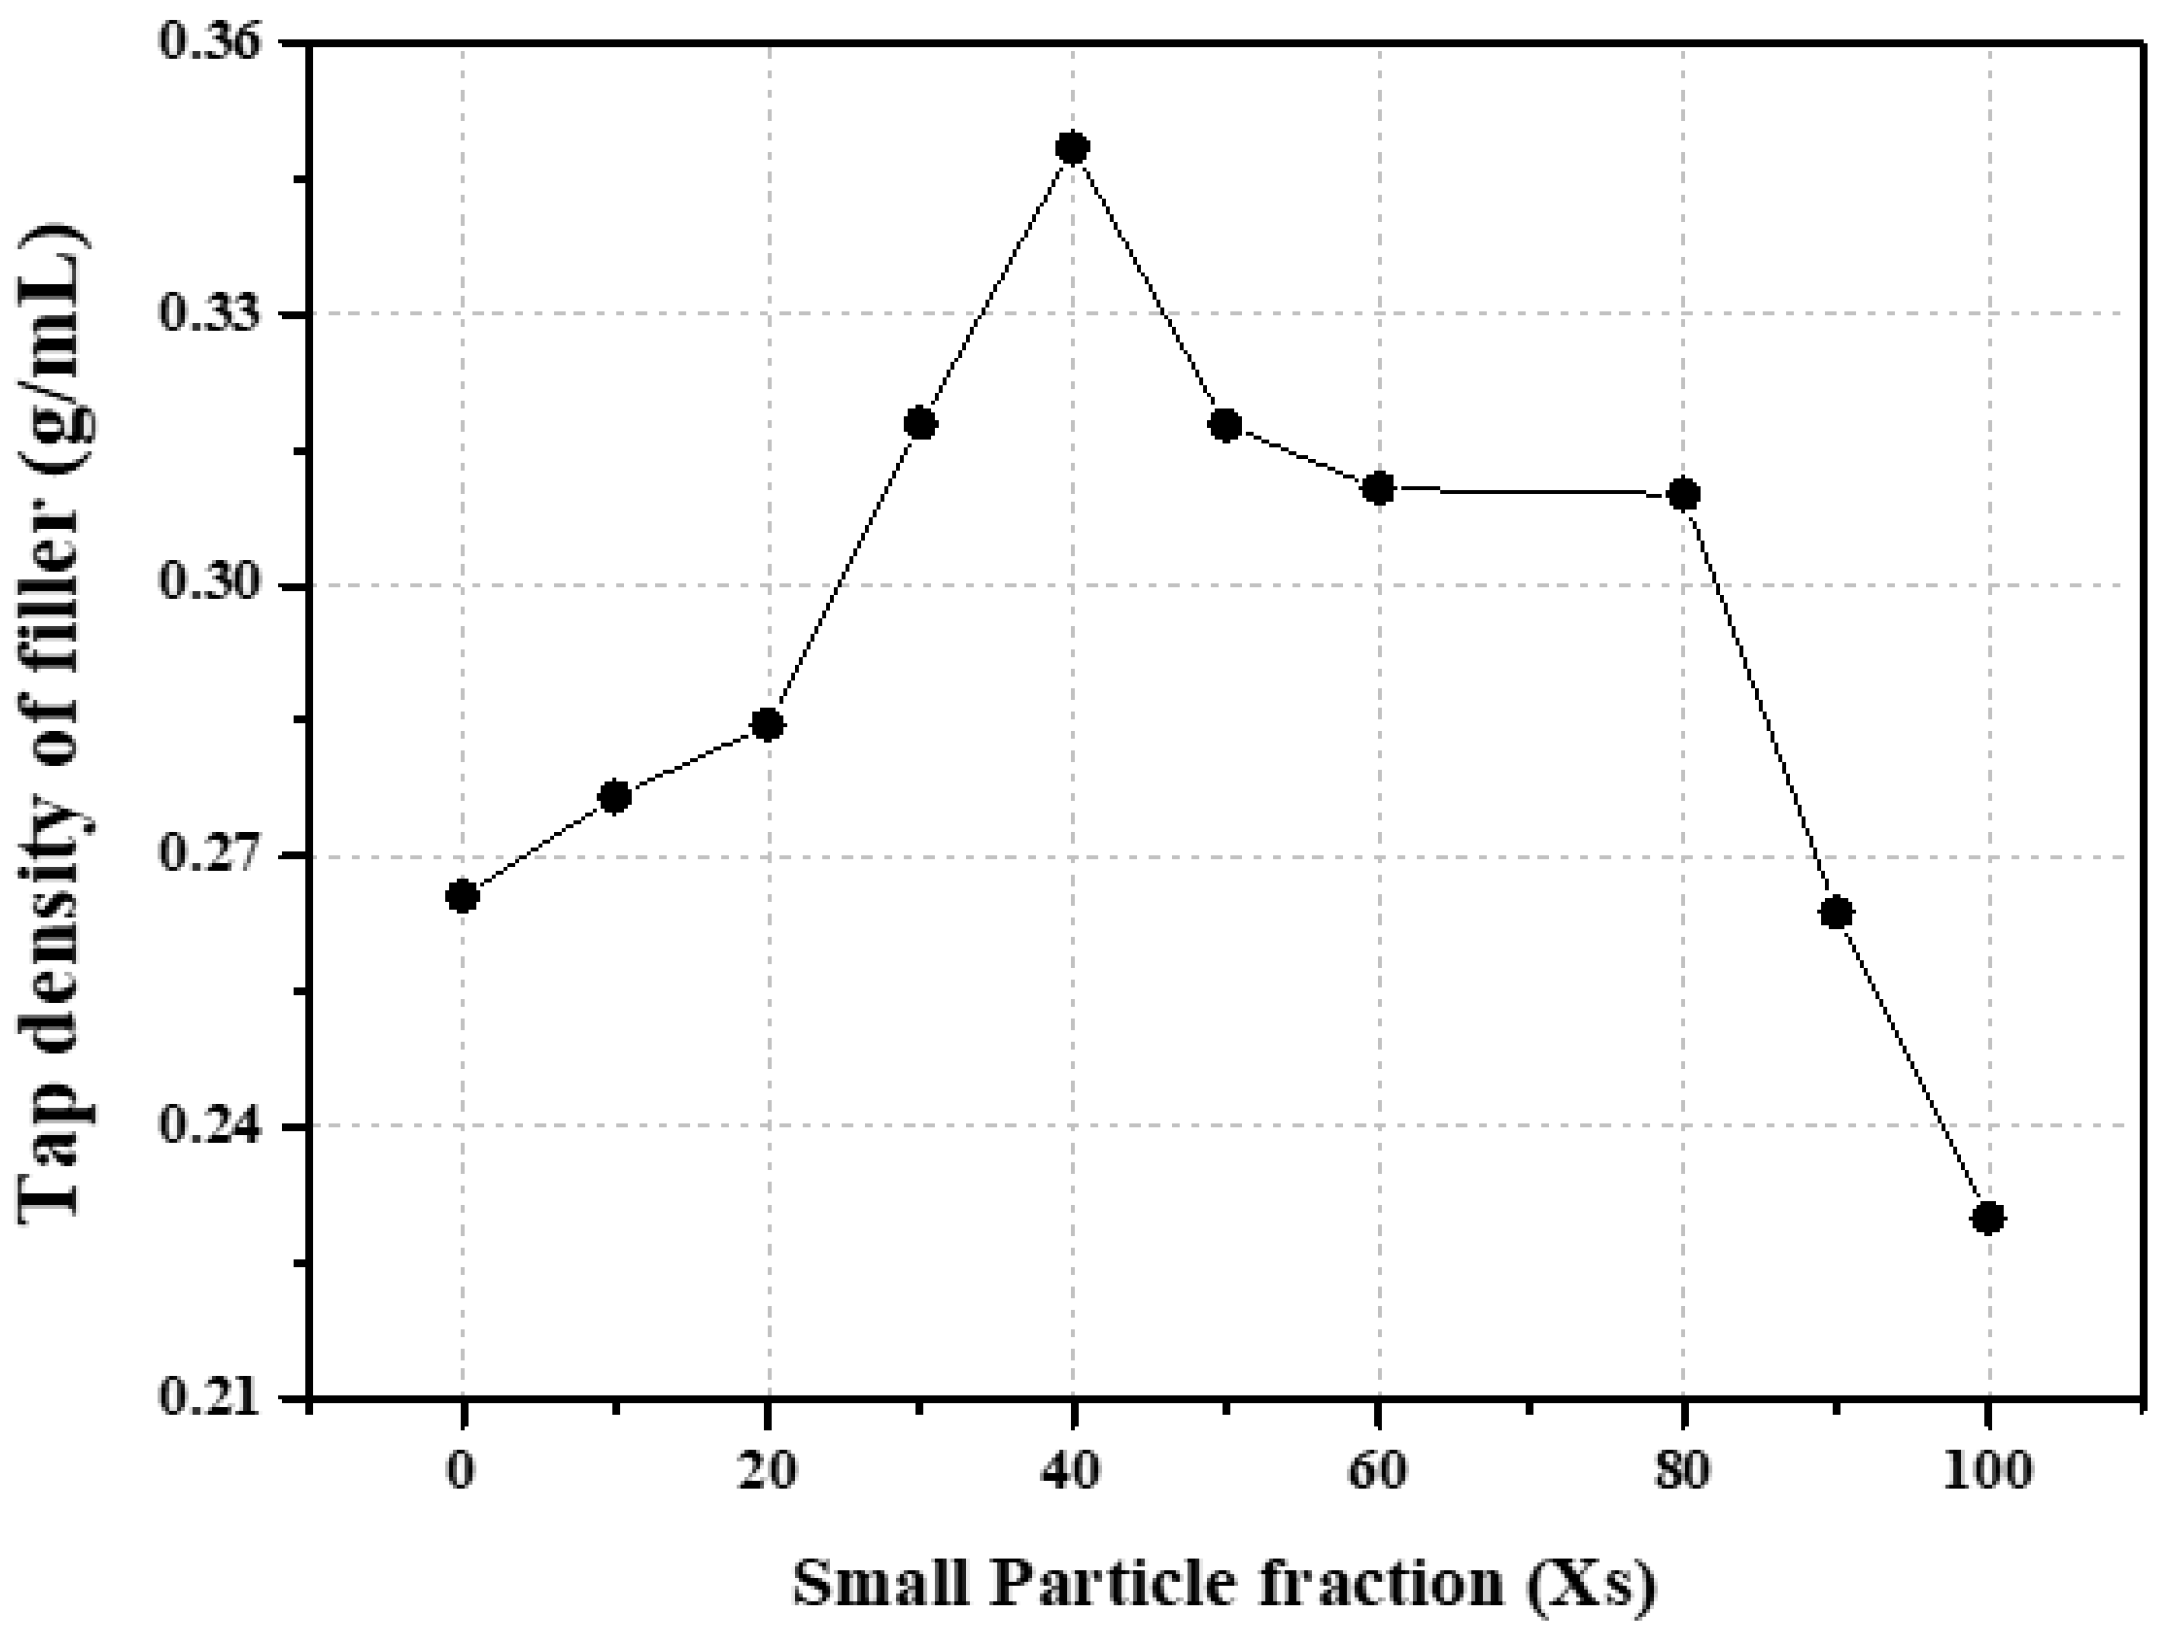
Figure 3.
Density of the graphite block measured using various analysis methods and calculated porosity (a,b).
Figure 3.
Density of the graphite block measured using various analysis methods and calculated porosity (a,b).
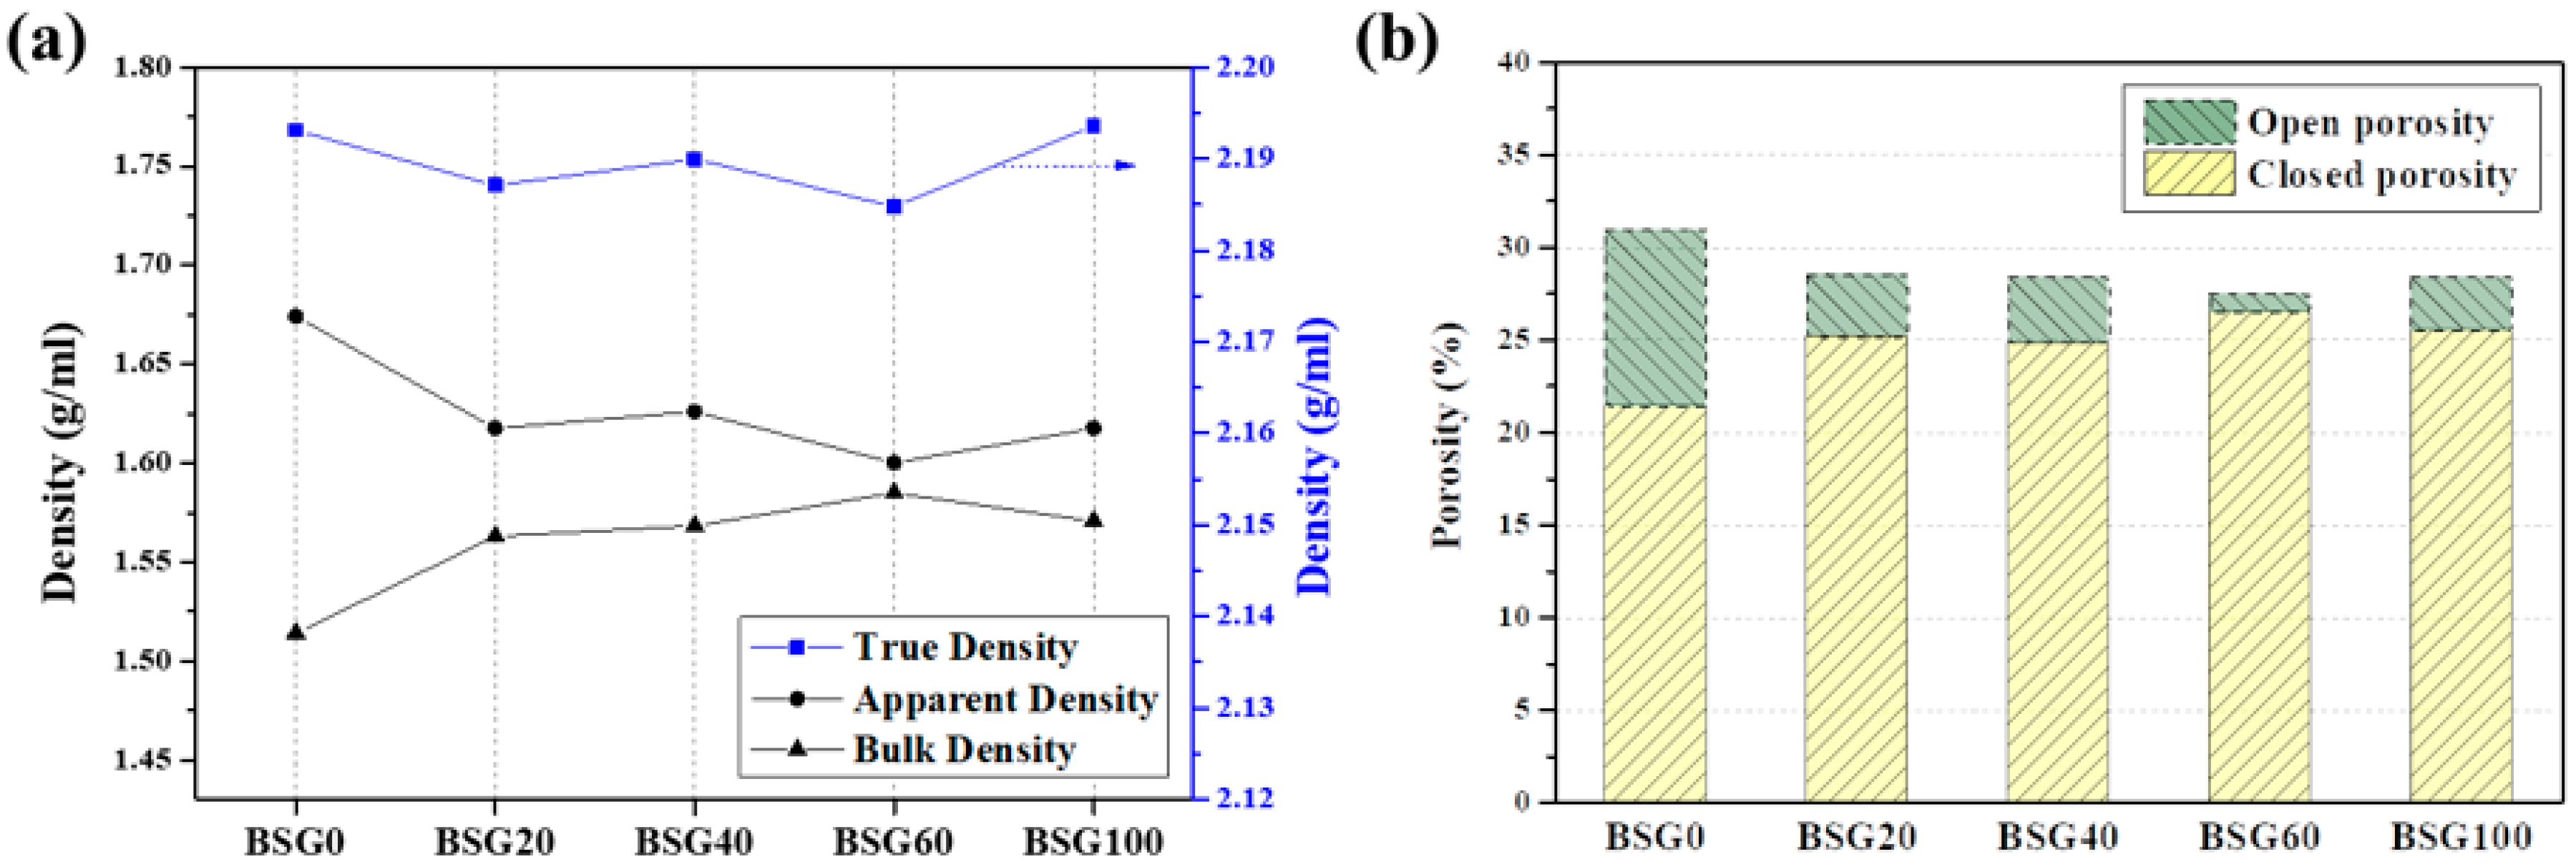
Figure 4.
Difference in carbon yield after carbonization of the binder pitch only and after co-carbonization with a graphite block (inserted figure; thermogravimetric analysis curve only showing the carbonization of the binder pitch).
Figure 4.
Difference in carbon yield after carbonization of the binder pitch only and after co-carbonization with a graphite block (inserted figure; thermogravimetric analysis curve only showing the carbonization of the binder pitch).
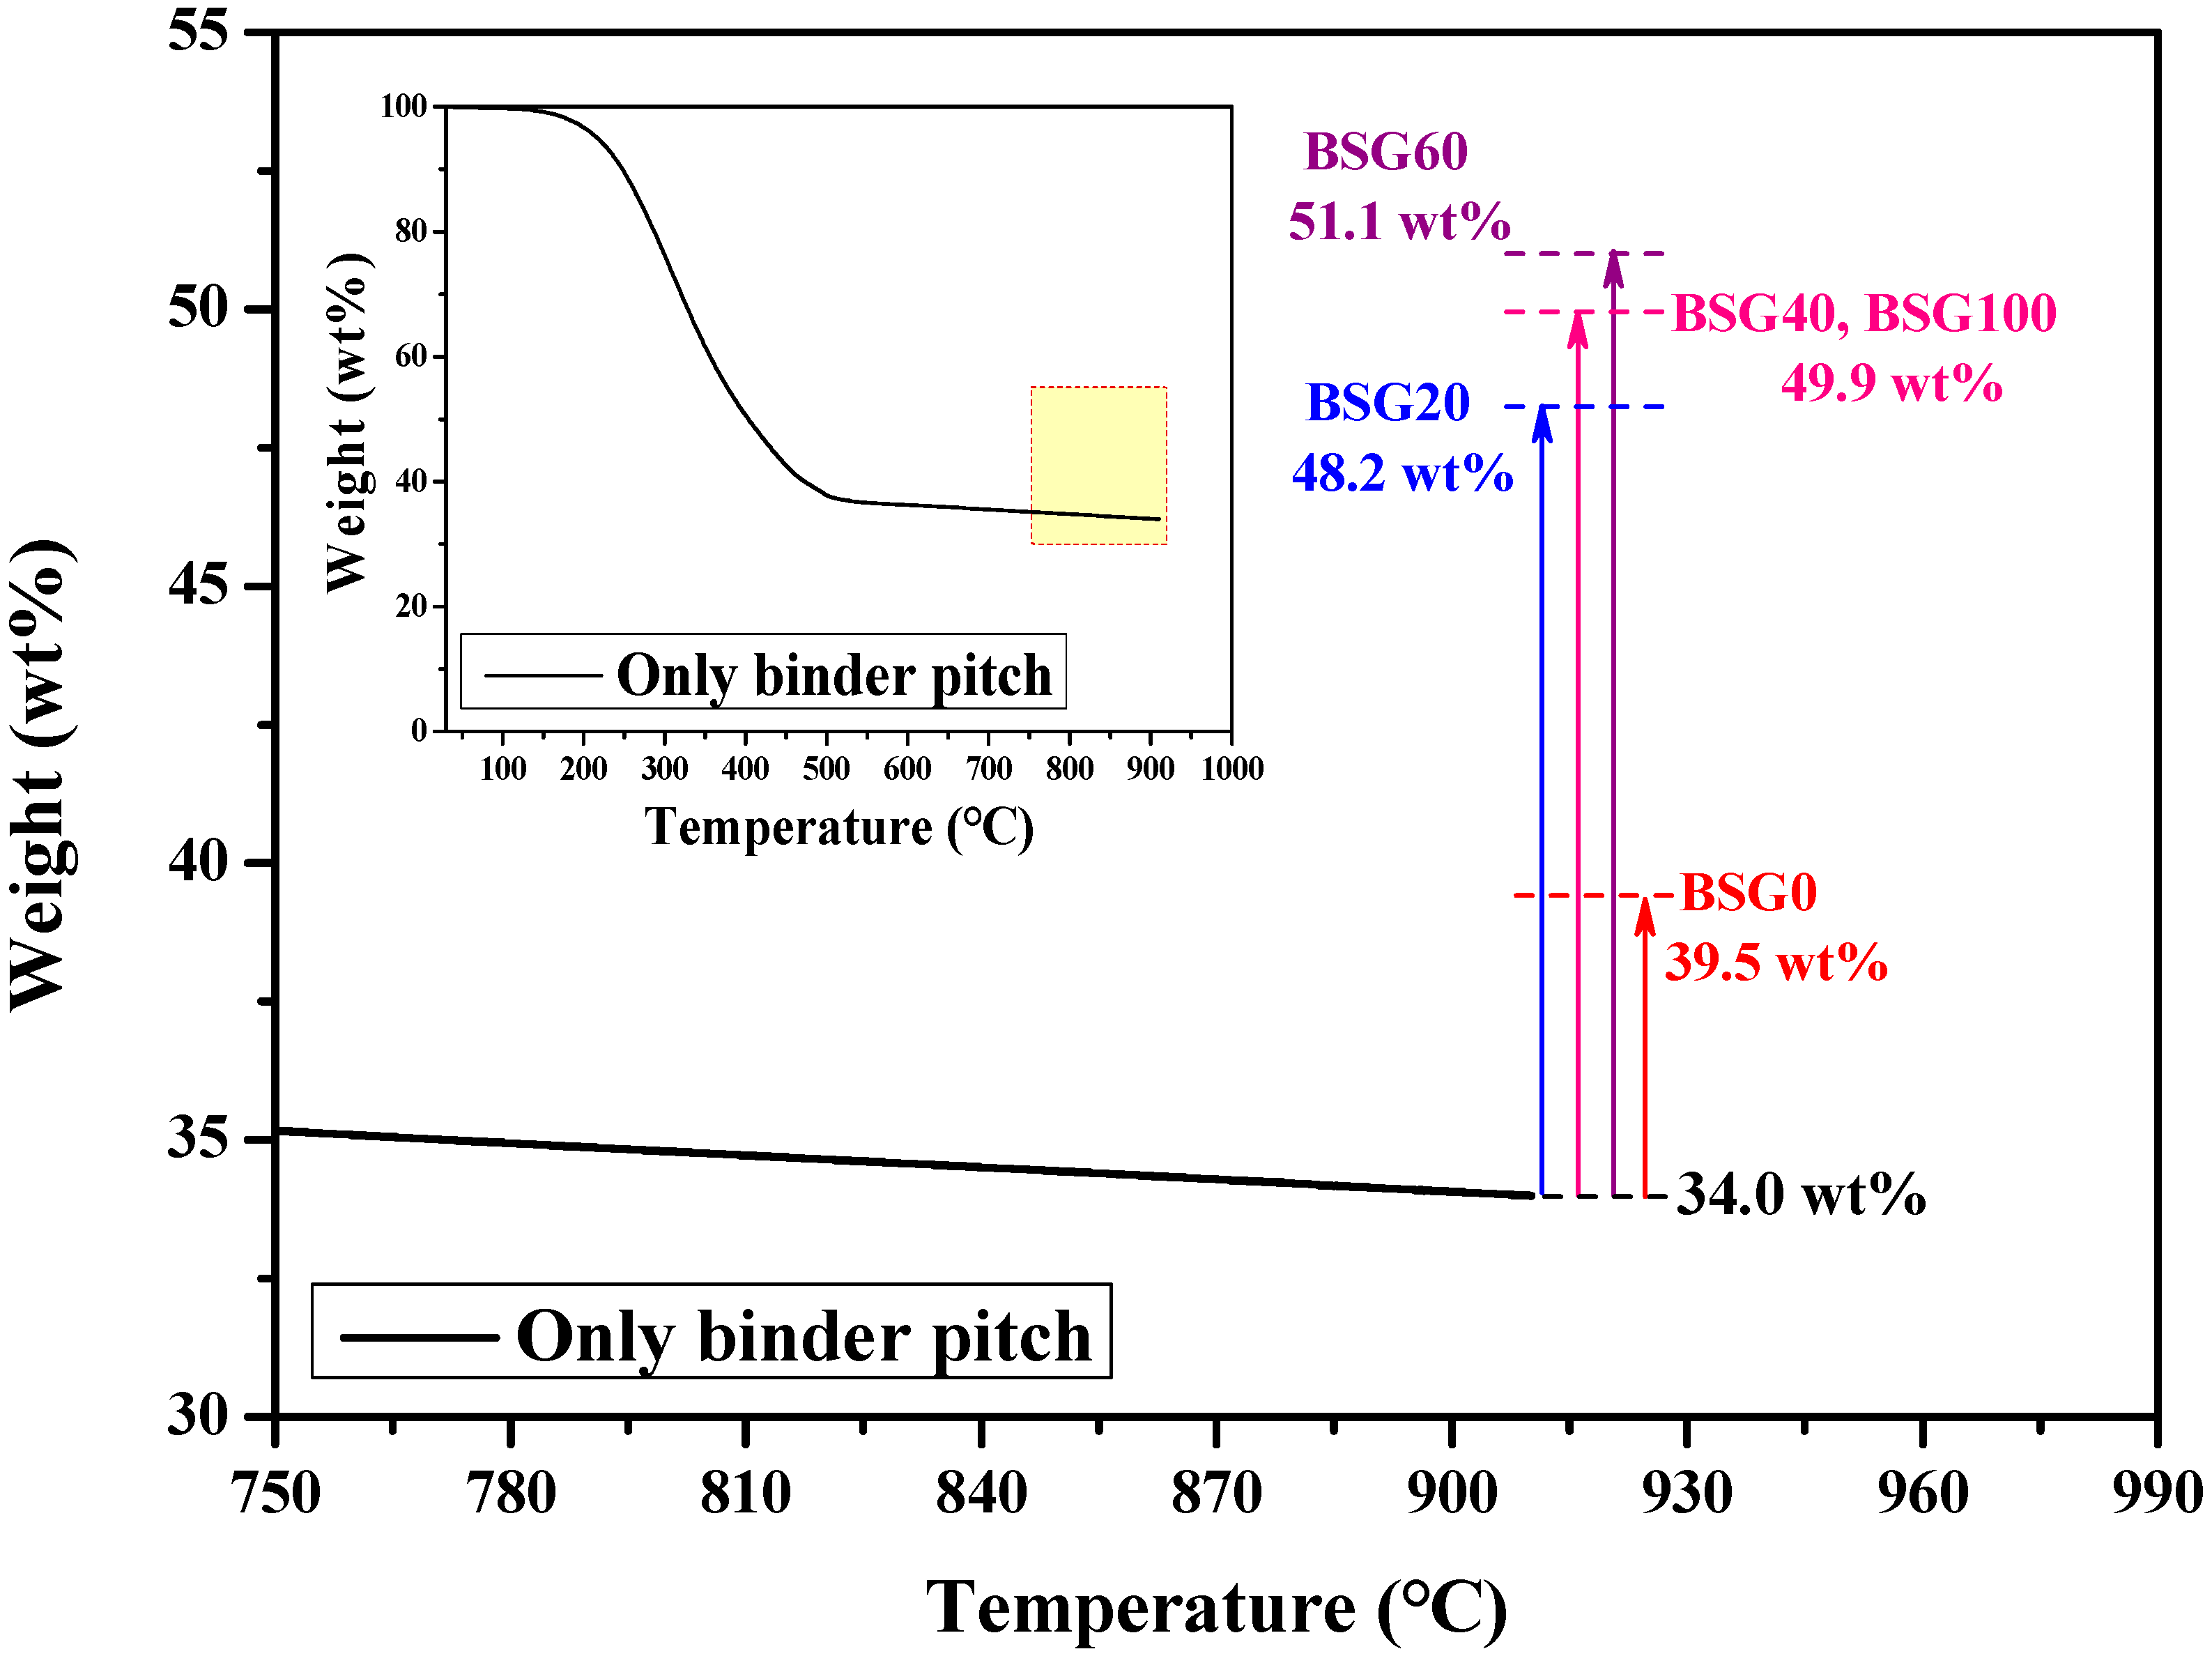
Figure 5.
Correlation between the particle packing structure of the graphite filler and open porosity of graphite blocks (a,b).
Figure 5.
Correlation between the particle packing structure of the graphite filler and open porosity of graphite blocks (a,b).
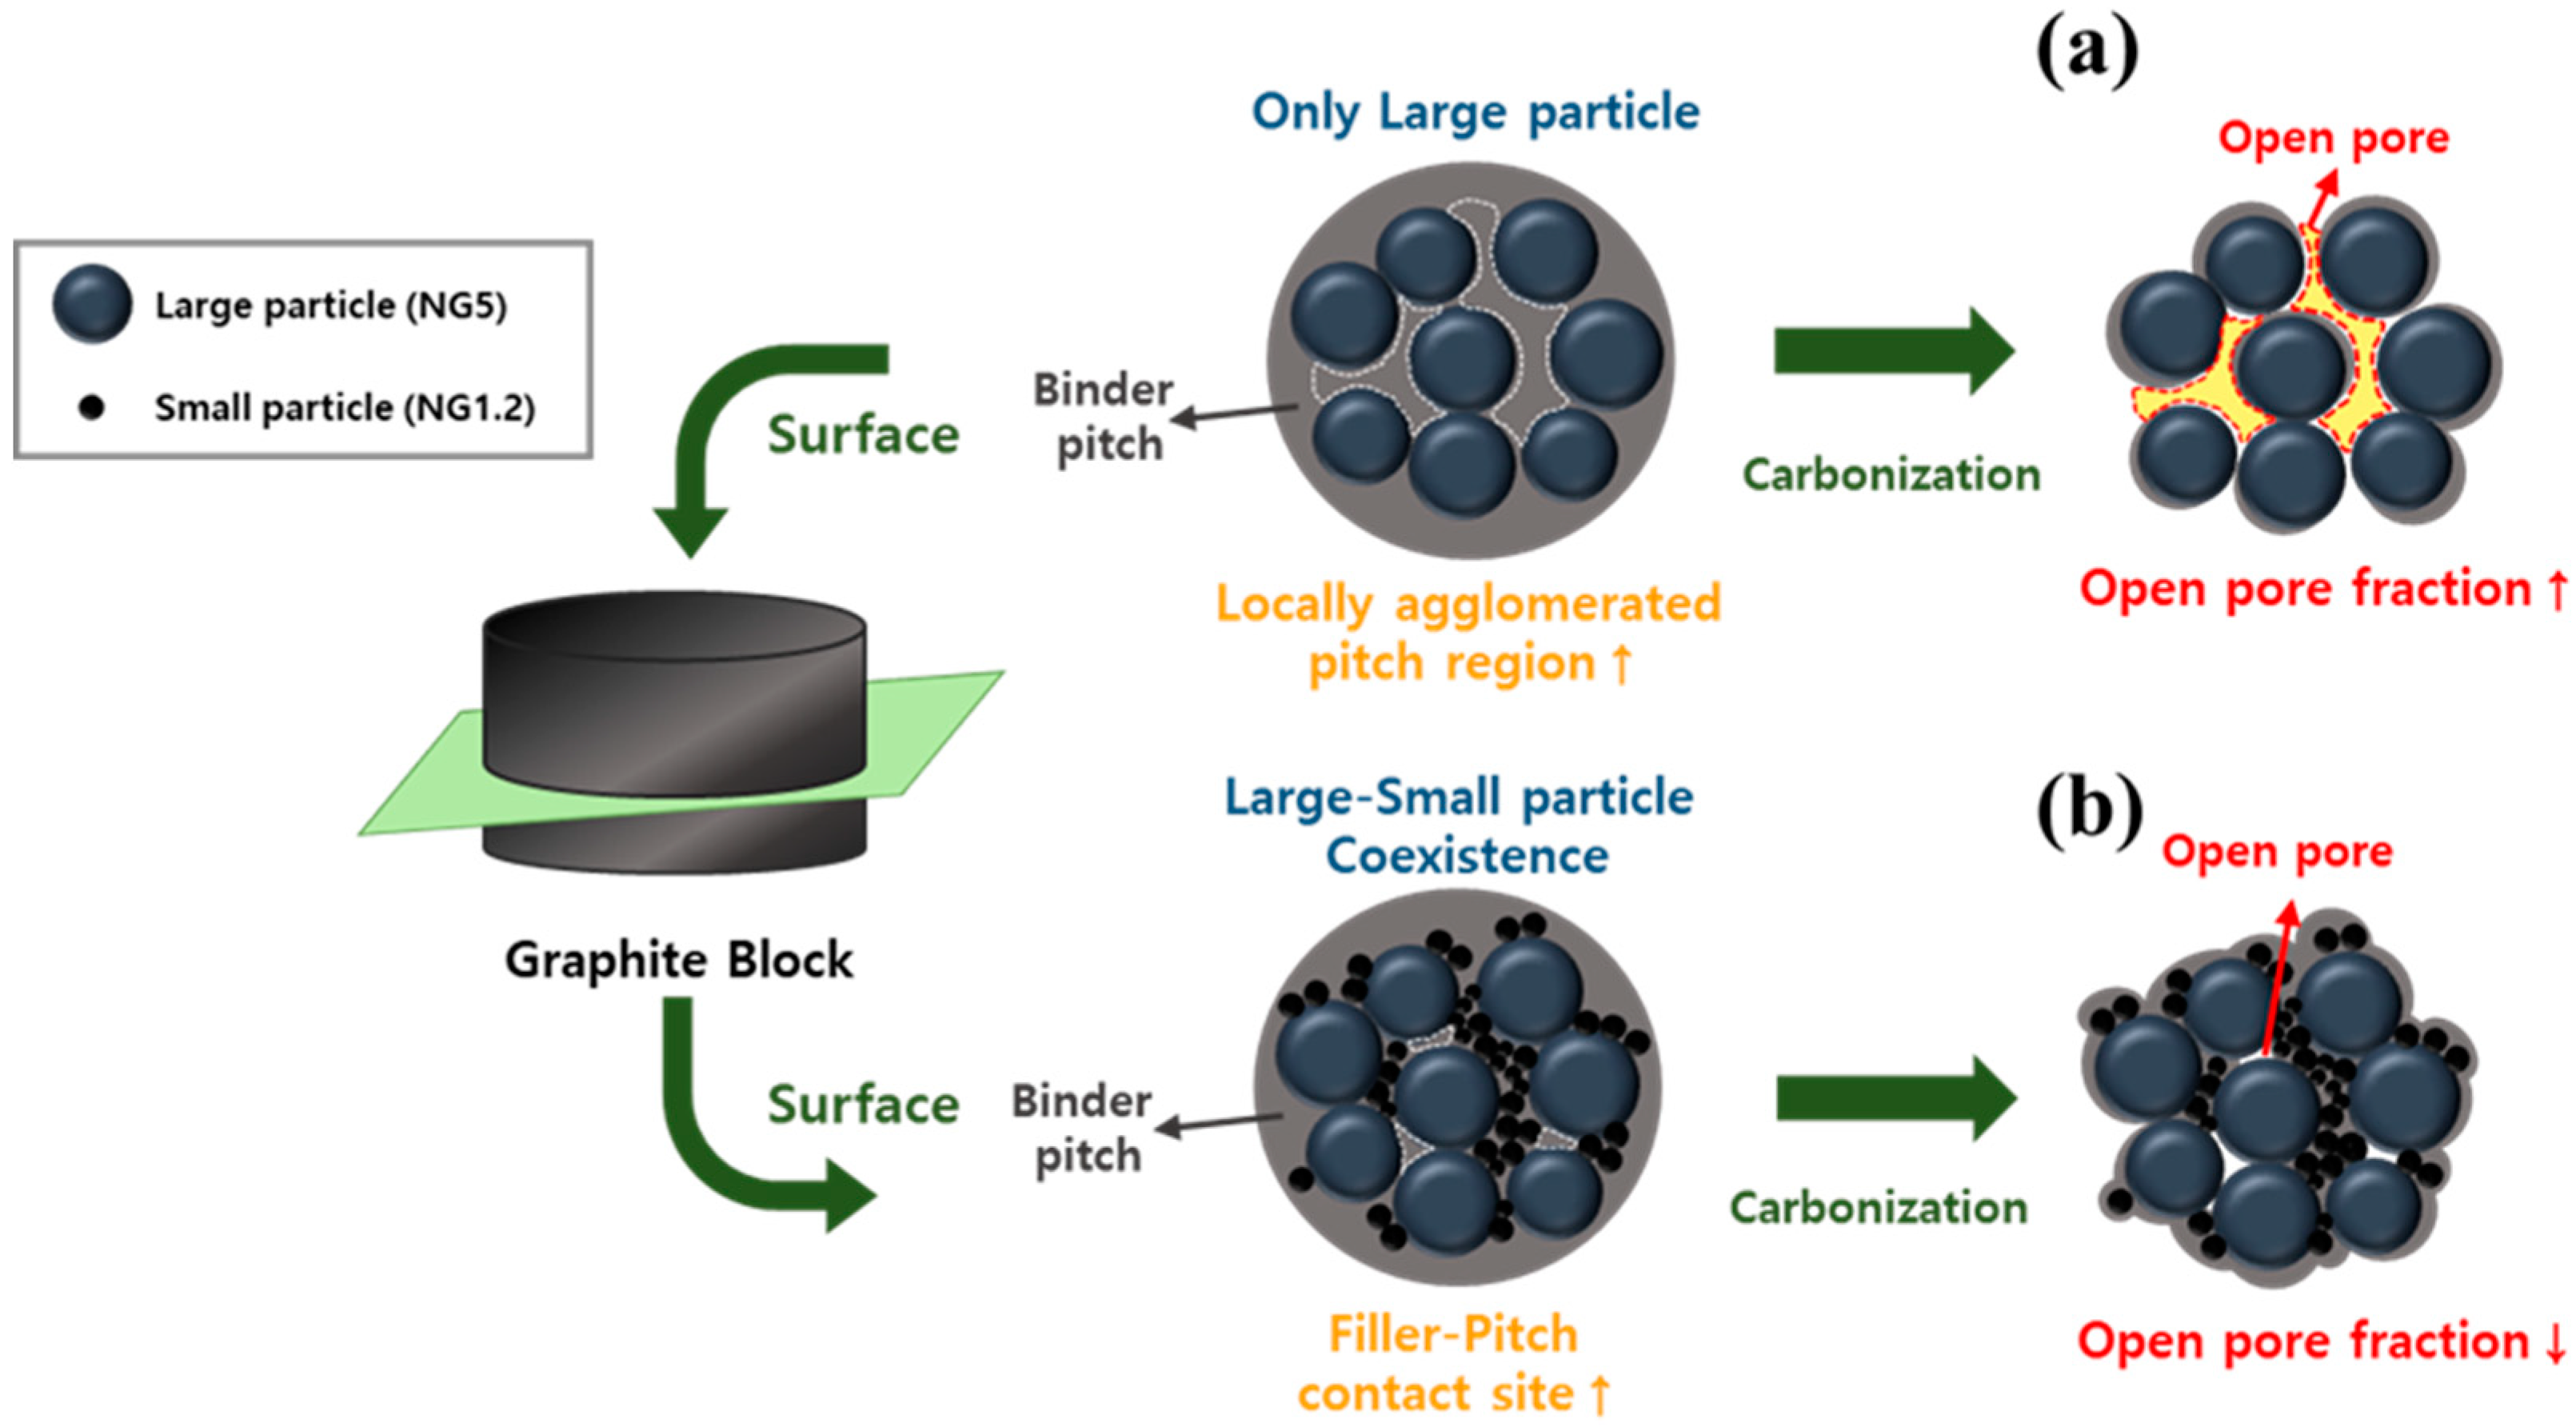
Figure 6.
FE-SEM image of fine and assembled graphite via granulation; (a) NG5, (b) NG1.2, and (c) SG60.
Figure 6.
FE-SEM image of fine and assembled graphite via granulation; (a) NG5, (b) NG1.2, and (c) SG60.

Figure 7.
(a) First galvanostatic charge/discharge profiles of assembled graphite at 0.2 C (inset image; zoomed-in 0–1 V range); (b) differential capacity (dQ/dV vs. V) curves of assembled graphite at the 1st cycle (inset image; zoomed-in 0.3–0.9 V range); (c) rate performance test of assembled and fine graphite; (d) cycling performance of assembled and fine graphite (solid and open symbols indicate the specific capacity and Coulombic efficiency, respectively).

Figure 8.
(a) Nyquist plots of the assembled and fine graphite before the cycle; (b) relationship between Re(Z) and the inverse square root of the angular speed (ω-0.5) in the low-frequency region; (c) nyquist plots of assembled and fine graphite after 10 cycles; (d) classified resistance of the electrode after 10 cycles.
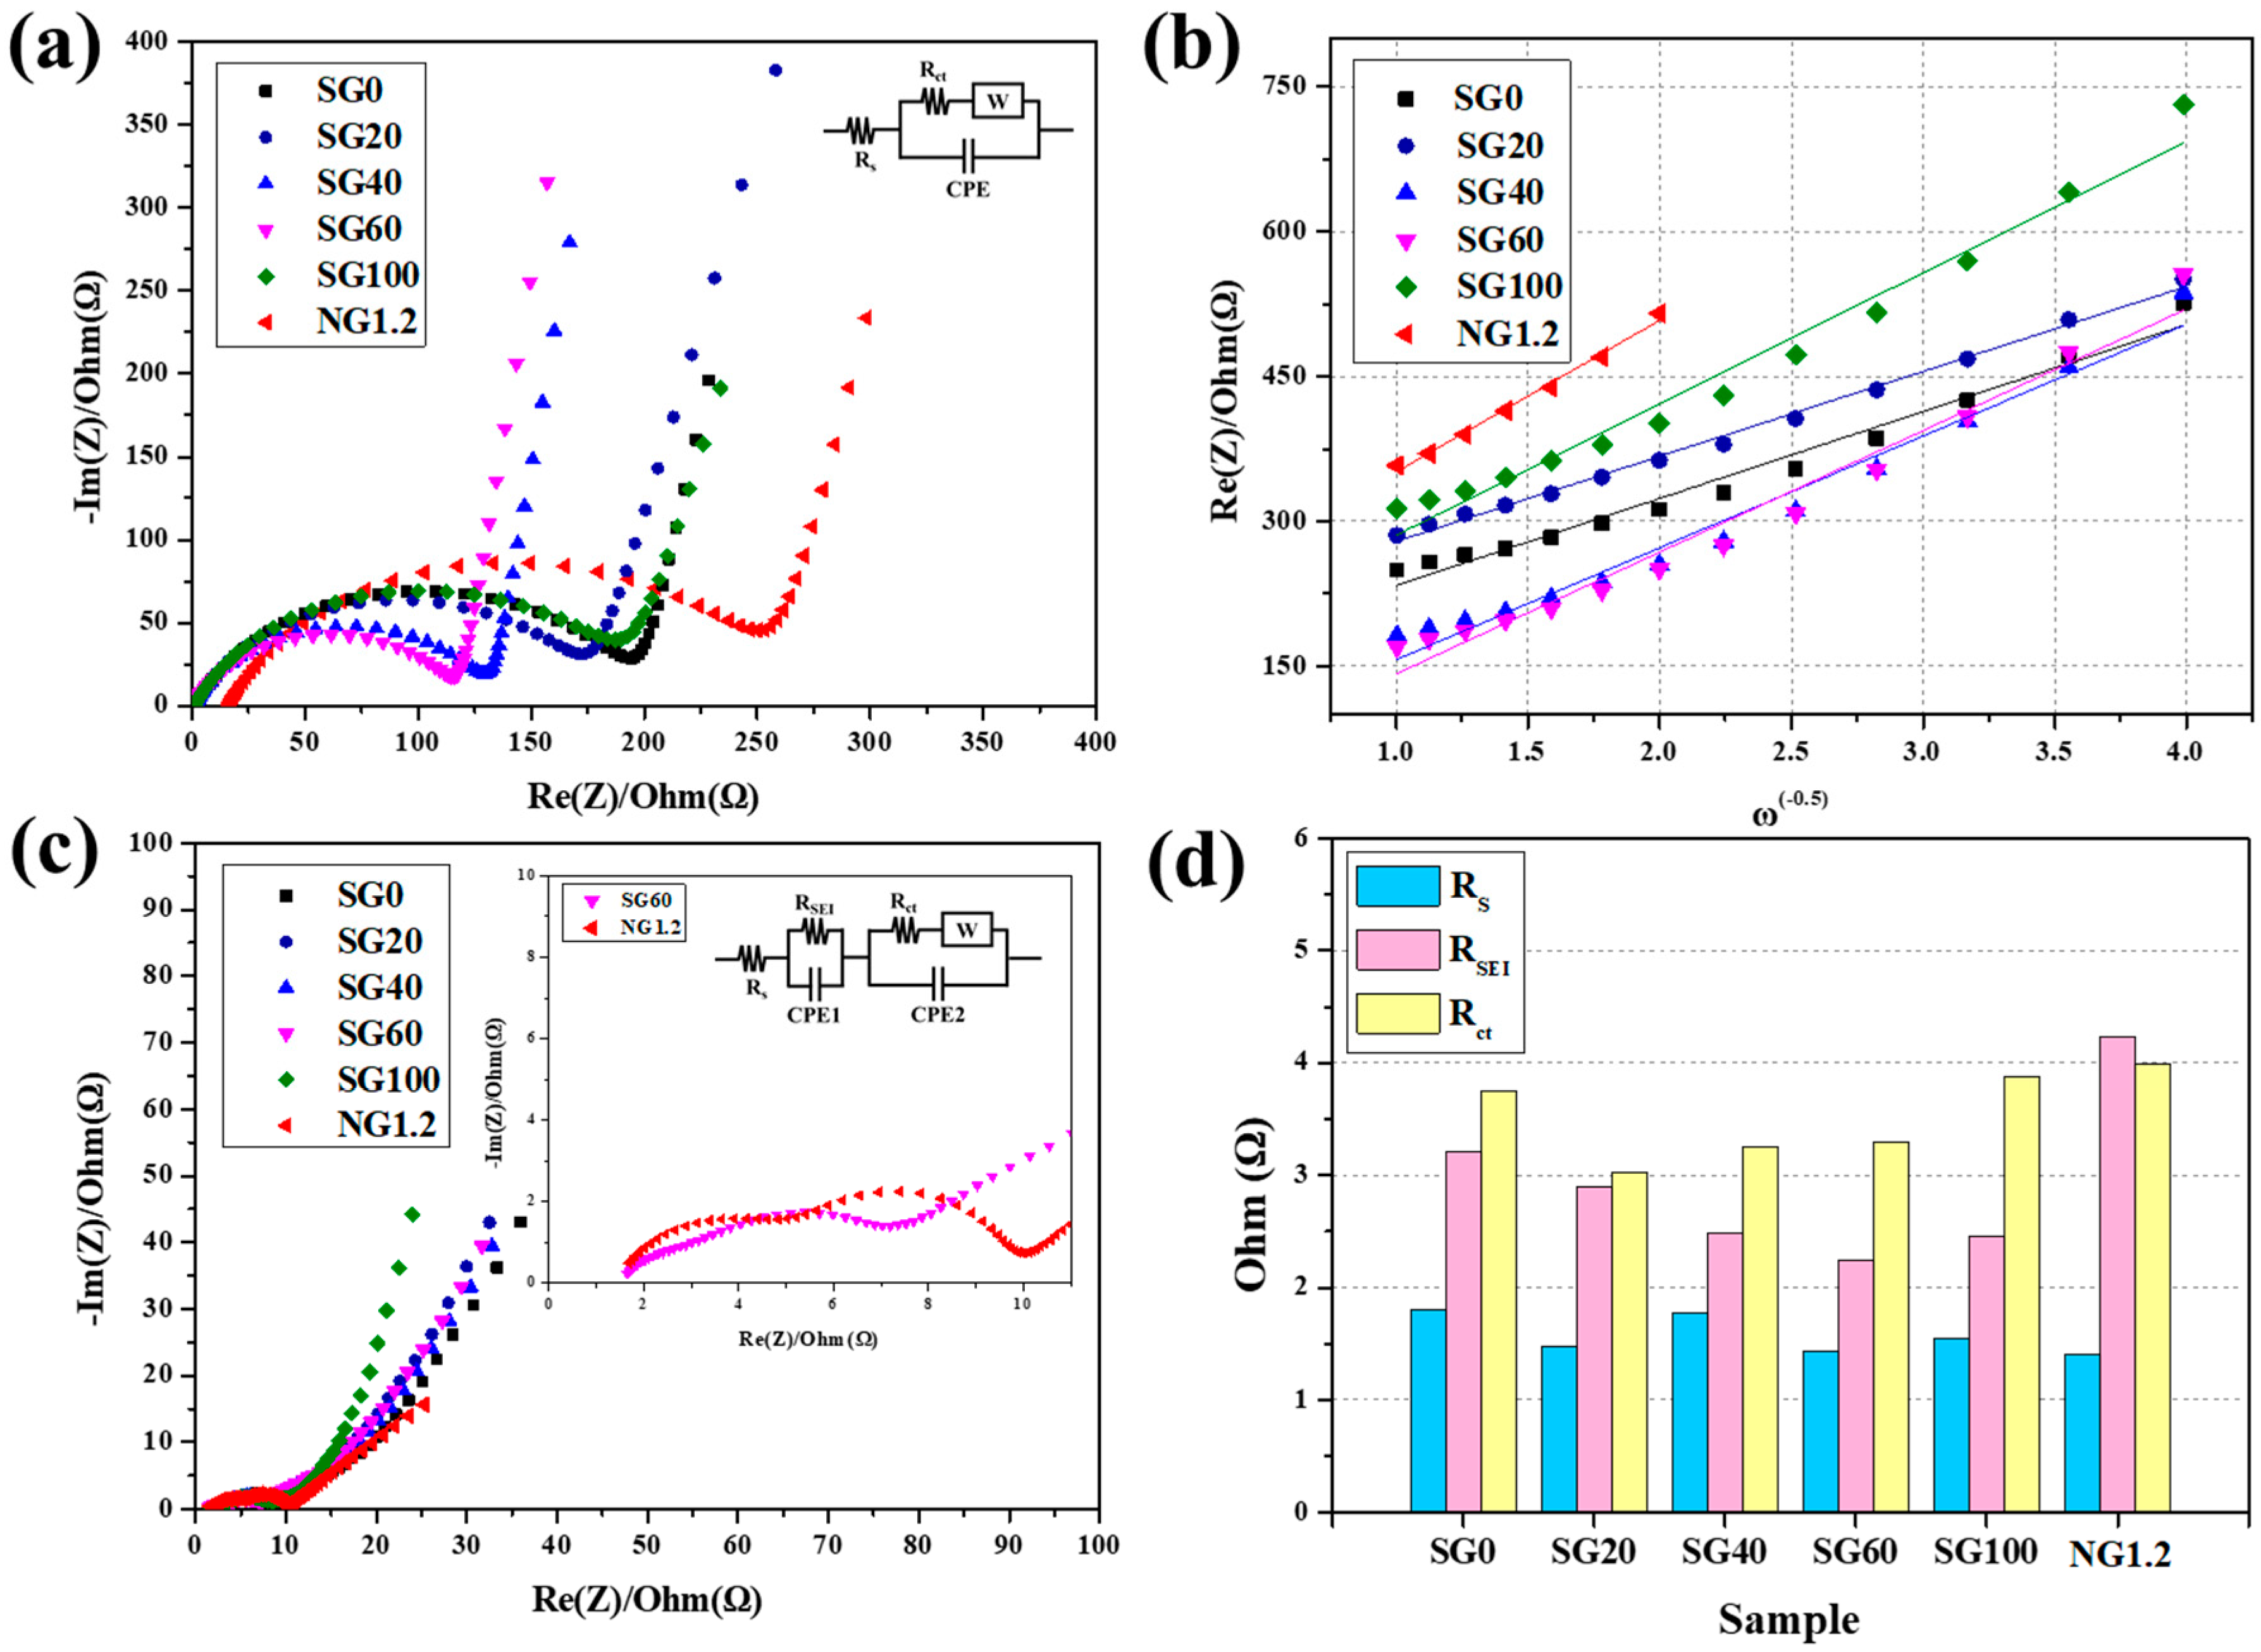
Figure 9.
FE-SEM images of electrode cross-sections; (a) before cycling for NG1.2, (b) before cycling for SG60, (c) after 100 cycles for NG1.2, (d) after 100 cycles for SG60.
Figure 9.
FE-SEM images of electrode cross-sections; (a) before cycling for NG1.2, (b) before cycling for SG60, (c) after 100 cycles for NG1.2, (d) after 100 cycles for SG60.

Figure 10.
FE-SEM and EDS mapping images of electrode cross-sections after 100 cycles; (a,b) NG1.2, (c,d) SG60.
Figure 10.
FE-SEM and EDS mapping images of electrode cross-sections after 100 cycles; (a,b) NG1.2, (c,d) SG60.


Table 1.
Density of the graphite block measured using various analysis methods, calculated porosity, and carbon yield of the graphite block after carbonization.
Table 1.
Density of the graphite block measured using various analysis methods, calculated porosity, and carbon yield of the graphite block after carbonization.
| Sample Name | dB (1) (g/mL) | dA (2) (g/mL) | dT (3) (g/mL) | Closed Porosity (%) | Open Porosity (%) | Total Porosity (%) | Yield (wt%) |
|---|---|---|---|---|---|---|---|
| BSG0 | 1.51 | 1.67 | 2.1931 | 21.41 | 9.56 | 30.96 | 87.89 |
| BSG20 | 1.56 | 1.62 | 2.1871 | 25.16 | 3.37 | 28.54 | 89.63 |
| BSG40 | 1.57 | 1.63 | 2.1900 | 24.84 | 3.55 | 28.39 | 89.99 |
| BSG60 | 1.58 | 1.60 | 2.1848 | 26.51 | 0.94 | 27.45 | 90.22 |
| BSG100 | 1.57 | 1.62 | 2.1936 | 25.50 | 2.90 | 28.40 | 89.98 |
(1) dB: Bulk density, (2) dA: Apparent density, (3) dT: True density.
Table 2.
Tap density and BET-specific surface area of fine and assembled graphite.
| Sample Name | dTap (1) (g/mL) | SBET (2) (m2/g) |
|---|---|---|
| NG1.2 | 0.2299 | 10.96 |
| NG5 | 0.2656 | 12.13 |
| SG0 | 0.3028 | 8.68 |
| SG20 | 0.3053 | 8.59 |
| SG40 | 0.2895 | 9.10 |
| SG60 | 0.3142 | 8.51 |
| SG100 | 0.2716 | 9.75 |
(1) dTap: tap density, (2) SBET: specific surface area.
Table 3.
First cycle charge-discharge capacity and initial coulombic efficiency (ICE) of assembled and fine graphite electrodes.
Table 3.
First cycle charge-discharge capacity and initial coulombic efficiency (ICE) of assembled and fine graphite electrodes.
| 1st Charge Capacity (mAh/g) | 1st Discharge Capacity (mAh/g) | I.C.E (%) | |
|---|---|---|---|
| SG0 | 400.6 | 346.2 | 86.4 |
| SG20 | 368.8 | 317.2 | 86.0 |
| SG40 | 376.8 | 340.1 | 90.3 |
| SG60 | 340.8 | 314.5 | 92.3 |
| SG100 | 372.3 | 339.2 | 91.1 |
| NG1.2 | 395.7 | 346.8 | 87.6 |
Table 4.
Charge–discharge capacity and capacity retention after 100 cycles for assembled and fine graphite.
Table 4.
Charge–discharge capacity and capacity retention after 100 cycles for assembled and fine graphite.
| 1st Discharge Capacity (mAh/g) | 100th Discharge Capacity (mAh/g) | Capacity Retention after 100 Cycles (%) | |
|---|---|---|---|
| SG0 | 346.2 | 346.1 | 100.0 |
| SG20 | 317.2 | 329.6 | 103.9 |
| SG40 | 340.1 | 344.4 | 101.3 |
| SG60 | 314.5 | 332.3 | 105.7 |
| SG100 | 339.2 | 340.9 | 100.5 |
| NG1.2 | 346.8 | 317.2 | 91.5 |
Table 5.
EIS parameters of assembled and fine graphite before and after 10 cycles.
| Sample | Before the Cycle | After 10 Cycles | |||
|---|---|---|---|---|---|
| RS (Ω) | Rct (Ω) | RS (Ω) | RSEI (Ω) | Rct (Ω) | |
| SG0 | 1.42 | 200.6 | 1.80 | 3.21 | 3.75 |
| SG20 | 1.32 | 179.4 | 1.47 | 2.89 | 3.02 |
| SG40 | 1.31 | 133.5 | 1.78 | 2.48 | 3.25 |
| SG60 | 1.13 | 119.3 | 1.43 | 2.24 | 3.30 |
| SG100 | 1.08 | 199.0 | 1.55 | 2.46 | 3.88 |
| NG1.2 | 15.9 | 249.3 | 1.40 | 4.23 | 3.99 |
Table 6.
Li-ion diffusion coefficient of assembled and fine graphite.
| Sample | SG0 | SG20 | SG40 | SG60 | SG100 | NG |
|---|---|---|---|---|---|---|
| DiLi+ (cm2 s−1) | 2.8216 × 10⁻¹² | 1.8314 × 10⁻¹² | 2.0192 × 10⁻¹² | 1.7675 × 10⁻¹² | 1.1183 × 10⁻¹² | 9.2007 × 10⁻¹³ |
Disclaimer/Publisher’s Note: The statements, opinions and data contained in all publications are solely those of the individual author(s) and contributor(s) and not of MDPI and/or the editor(s). MDPI and/or the editor(s) disclaim responsibility for any injury to people or property resulting from any ideas, methods, instructions or products referred to in the content. |
© 2023 by the authors. Licensee MDPI, Basel, Switzerland. This article is an open access article distributed under the terms and conditions of the Creative Commons Attribution (CC BY) license (https://creativecommons.org/licenses/by/4.0/).
Share and Cite
MDPI and ACS Style
Choi, Y.-J.; Lee, Y.-S.; Kim, J.-H.; Im, J.-S. Optimization of Pore Characteristics of Graphite-Based Anode for Li-Ion Batteries by Control of the Particle Size Distribution. Materials 2023, 16, 6896. https://doi.org/10.3390/ma16216896
AMA Style
Choi Y-J, Lee Y-S, Kim J-H, Im J-S. Optimization of Pore Characteristics of Graphite-Based Anode for Li-Ion Batteries by Control of the Particle Size Distribution. Materials. 2023; 16(21):6896. https://doi.org/10.3390/ma16216896
Chicago/Turabian StyleChoi, Yun-Jeong, Young-Seak Lee, Ji-Hong Kim, and Ji-Sun Im. 2023. "Optimization of Pore Characteristics of Graphite-Based Anode for Li-Ion Batteries by Control of the Particle Size Distribution" Materials 16, no. 21: 6896. https://doi.org/10.3390/ma16216896
Note that from the first issue of 2016, this journal uses article numbers instead of page numbers. See further details here.