
Experimental Study on Bio-Reinforcement of Calcareous Sand through Hydrochloric Acid Solution Precipitation into Cementing Solution
 and
and
Abstract
:1. Introduction
2. Materials
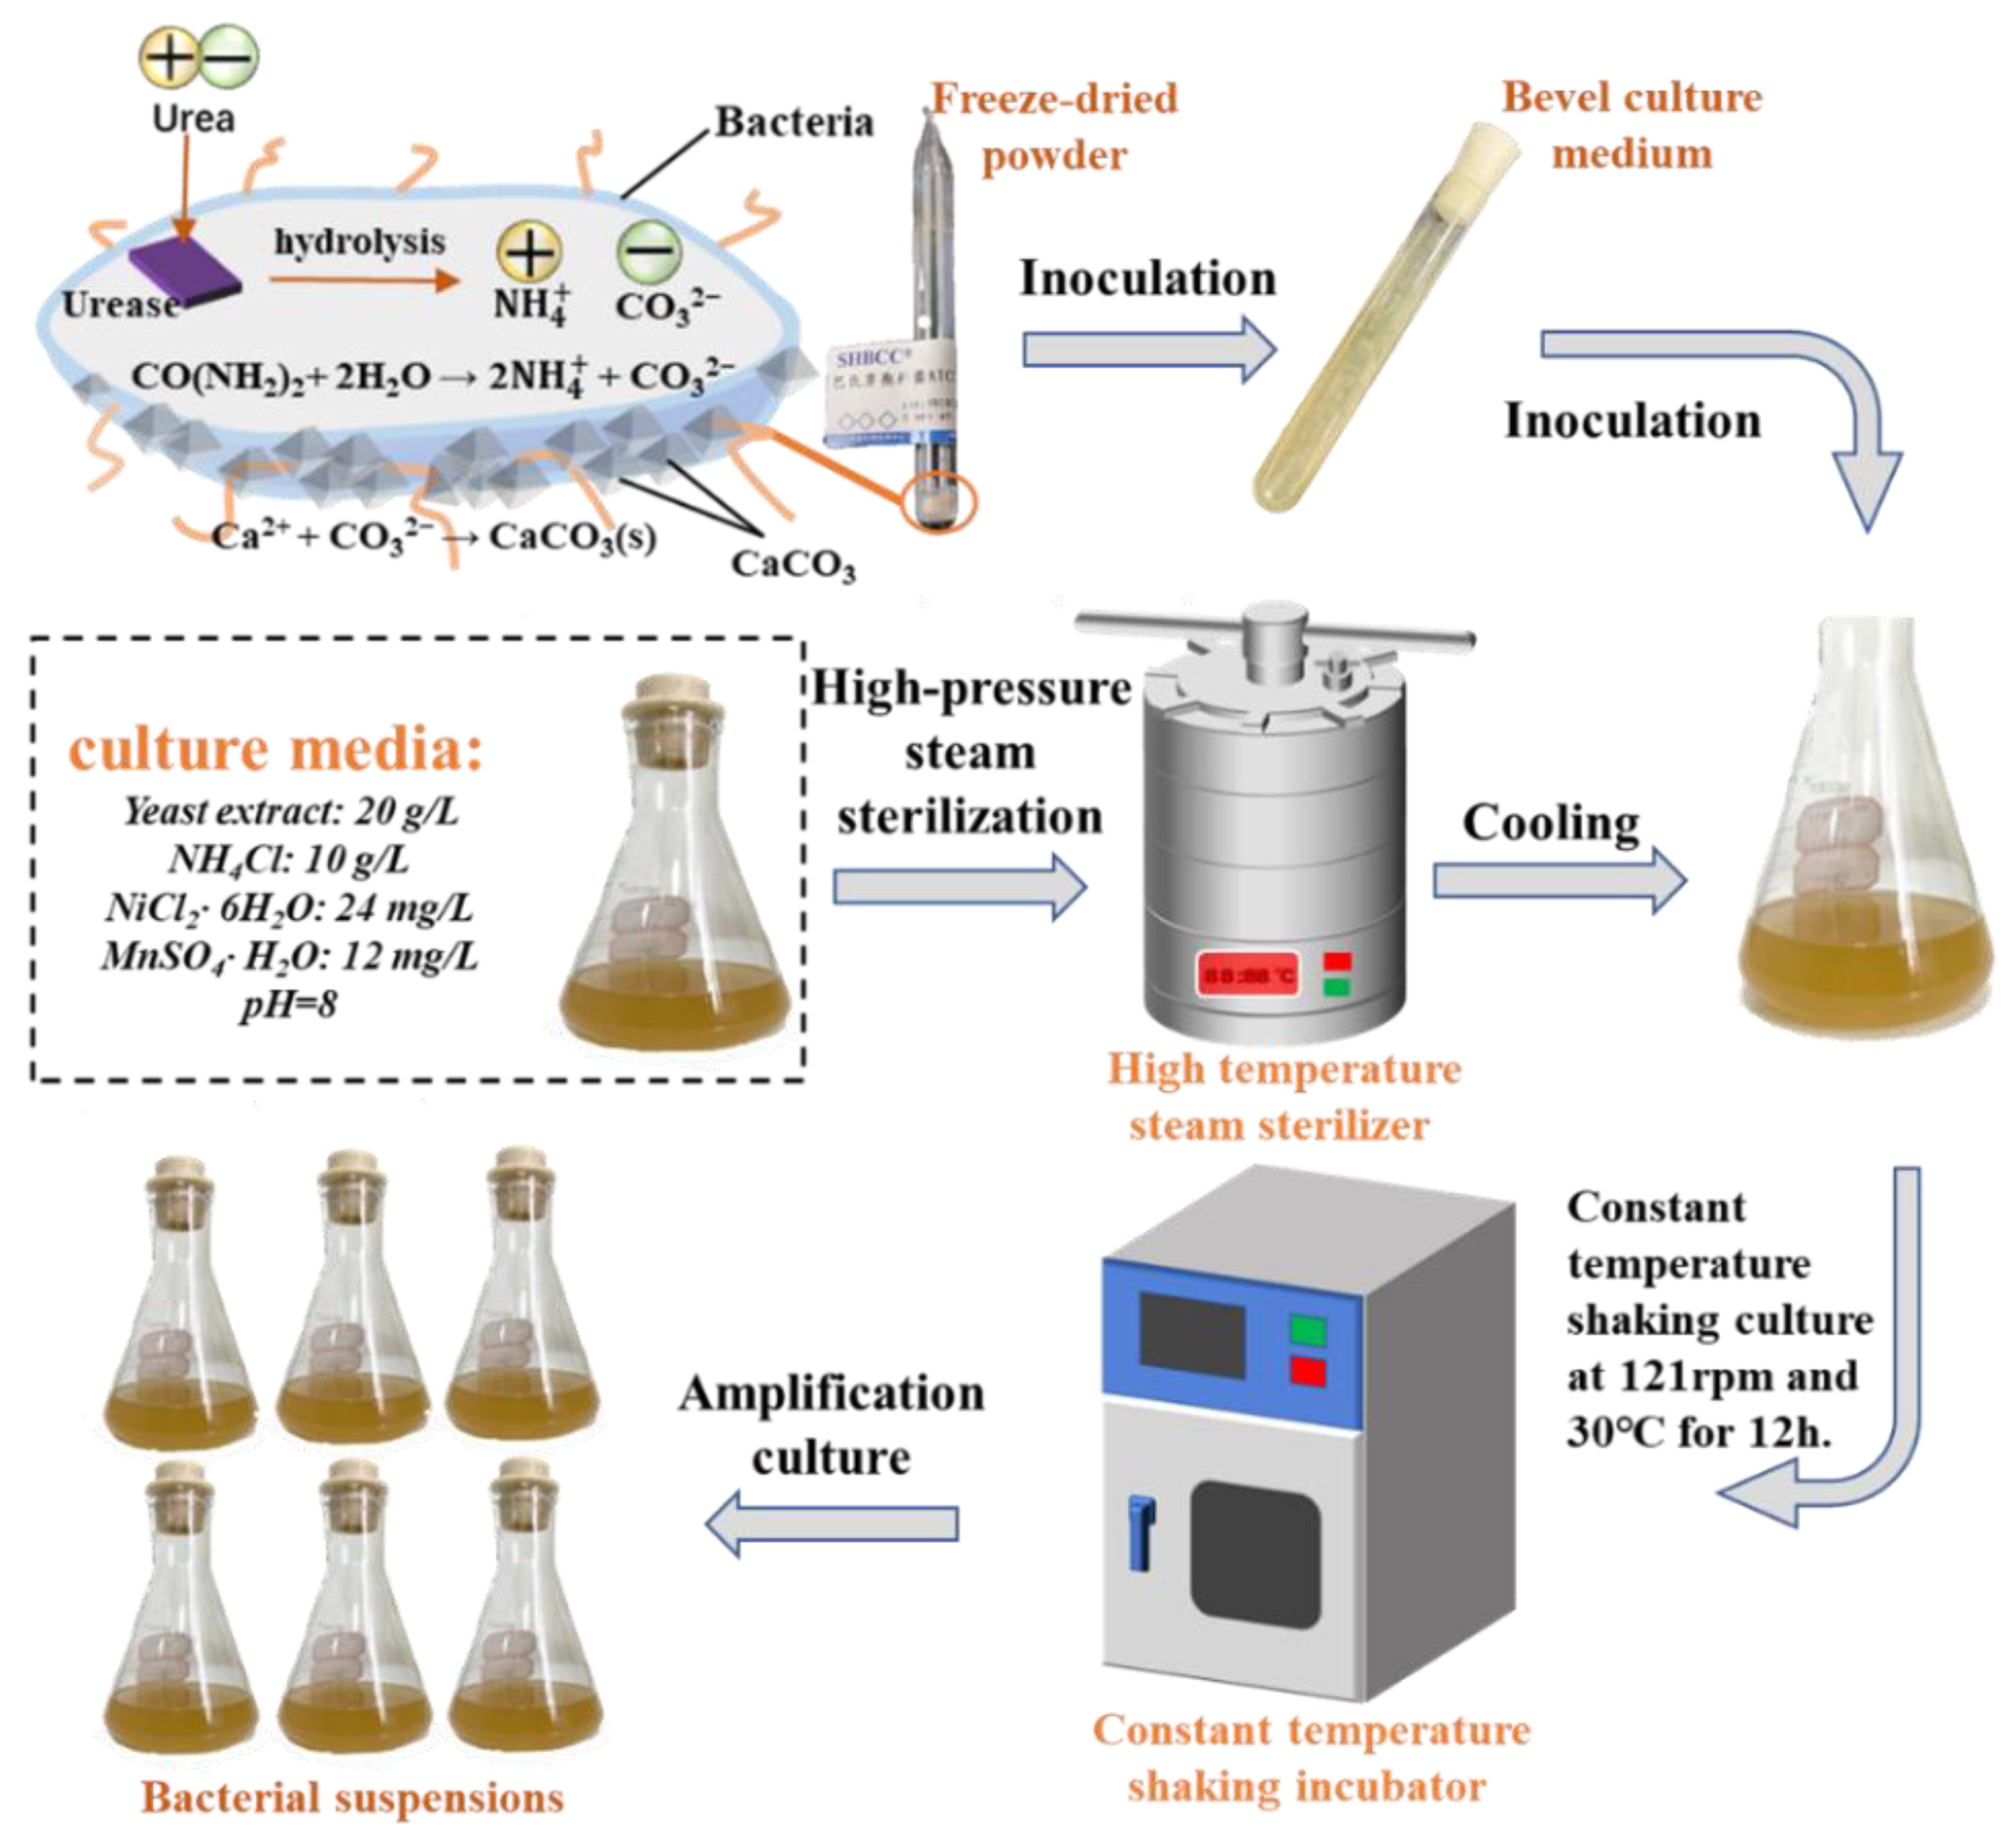
2.1. Bacterium
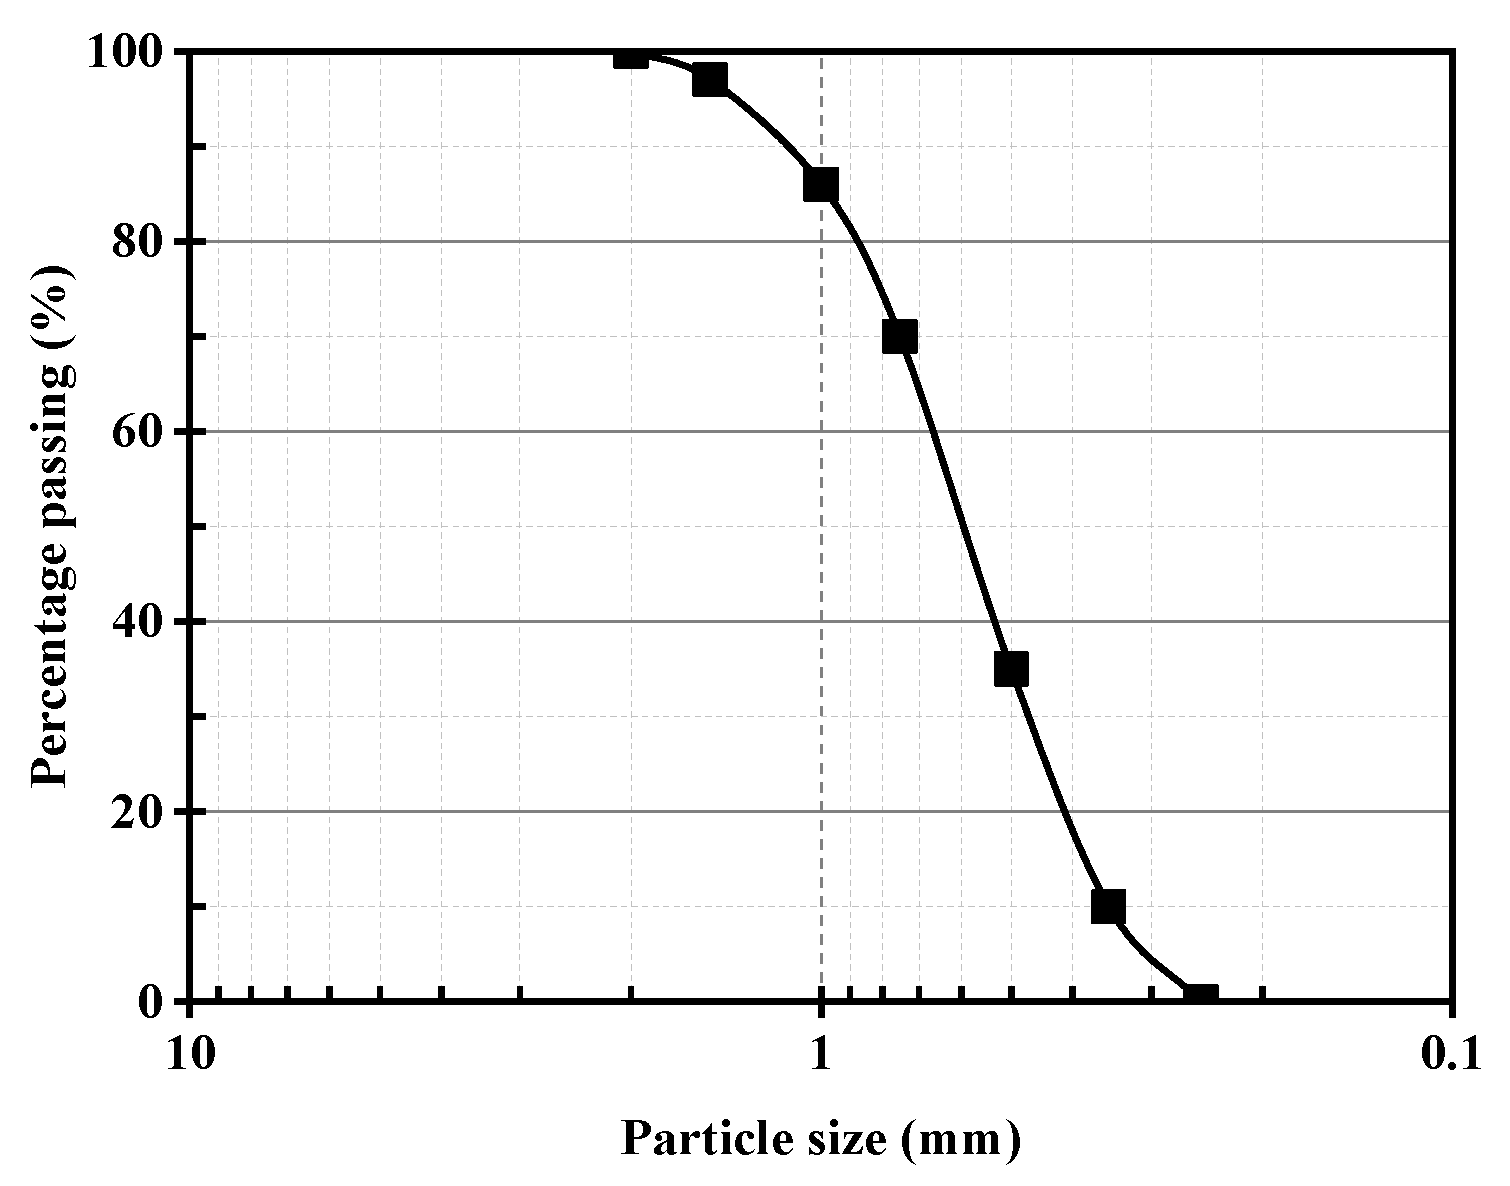
2.2. Calcareous Sand
2.3. Cementing Solution and Hydrochloric Acid
3. Methods
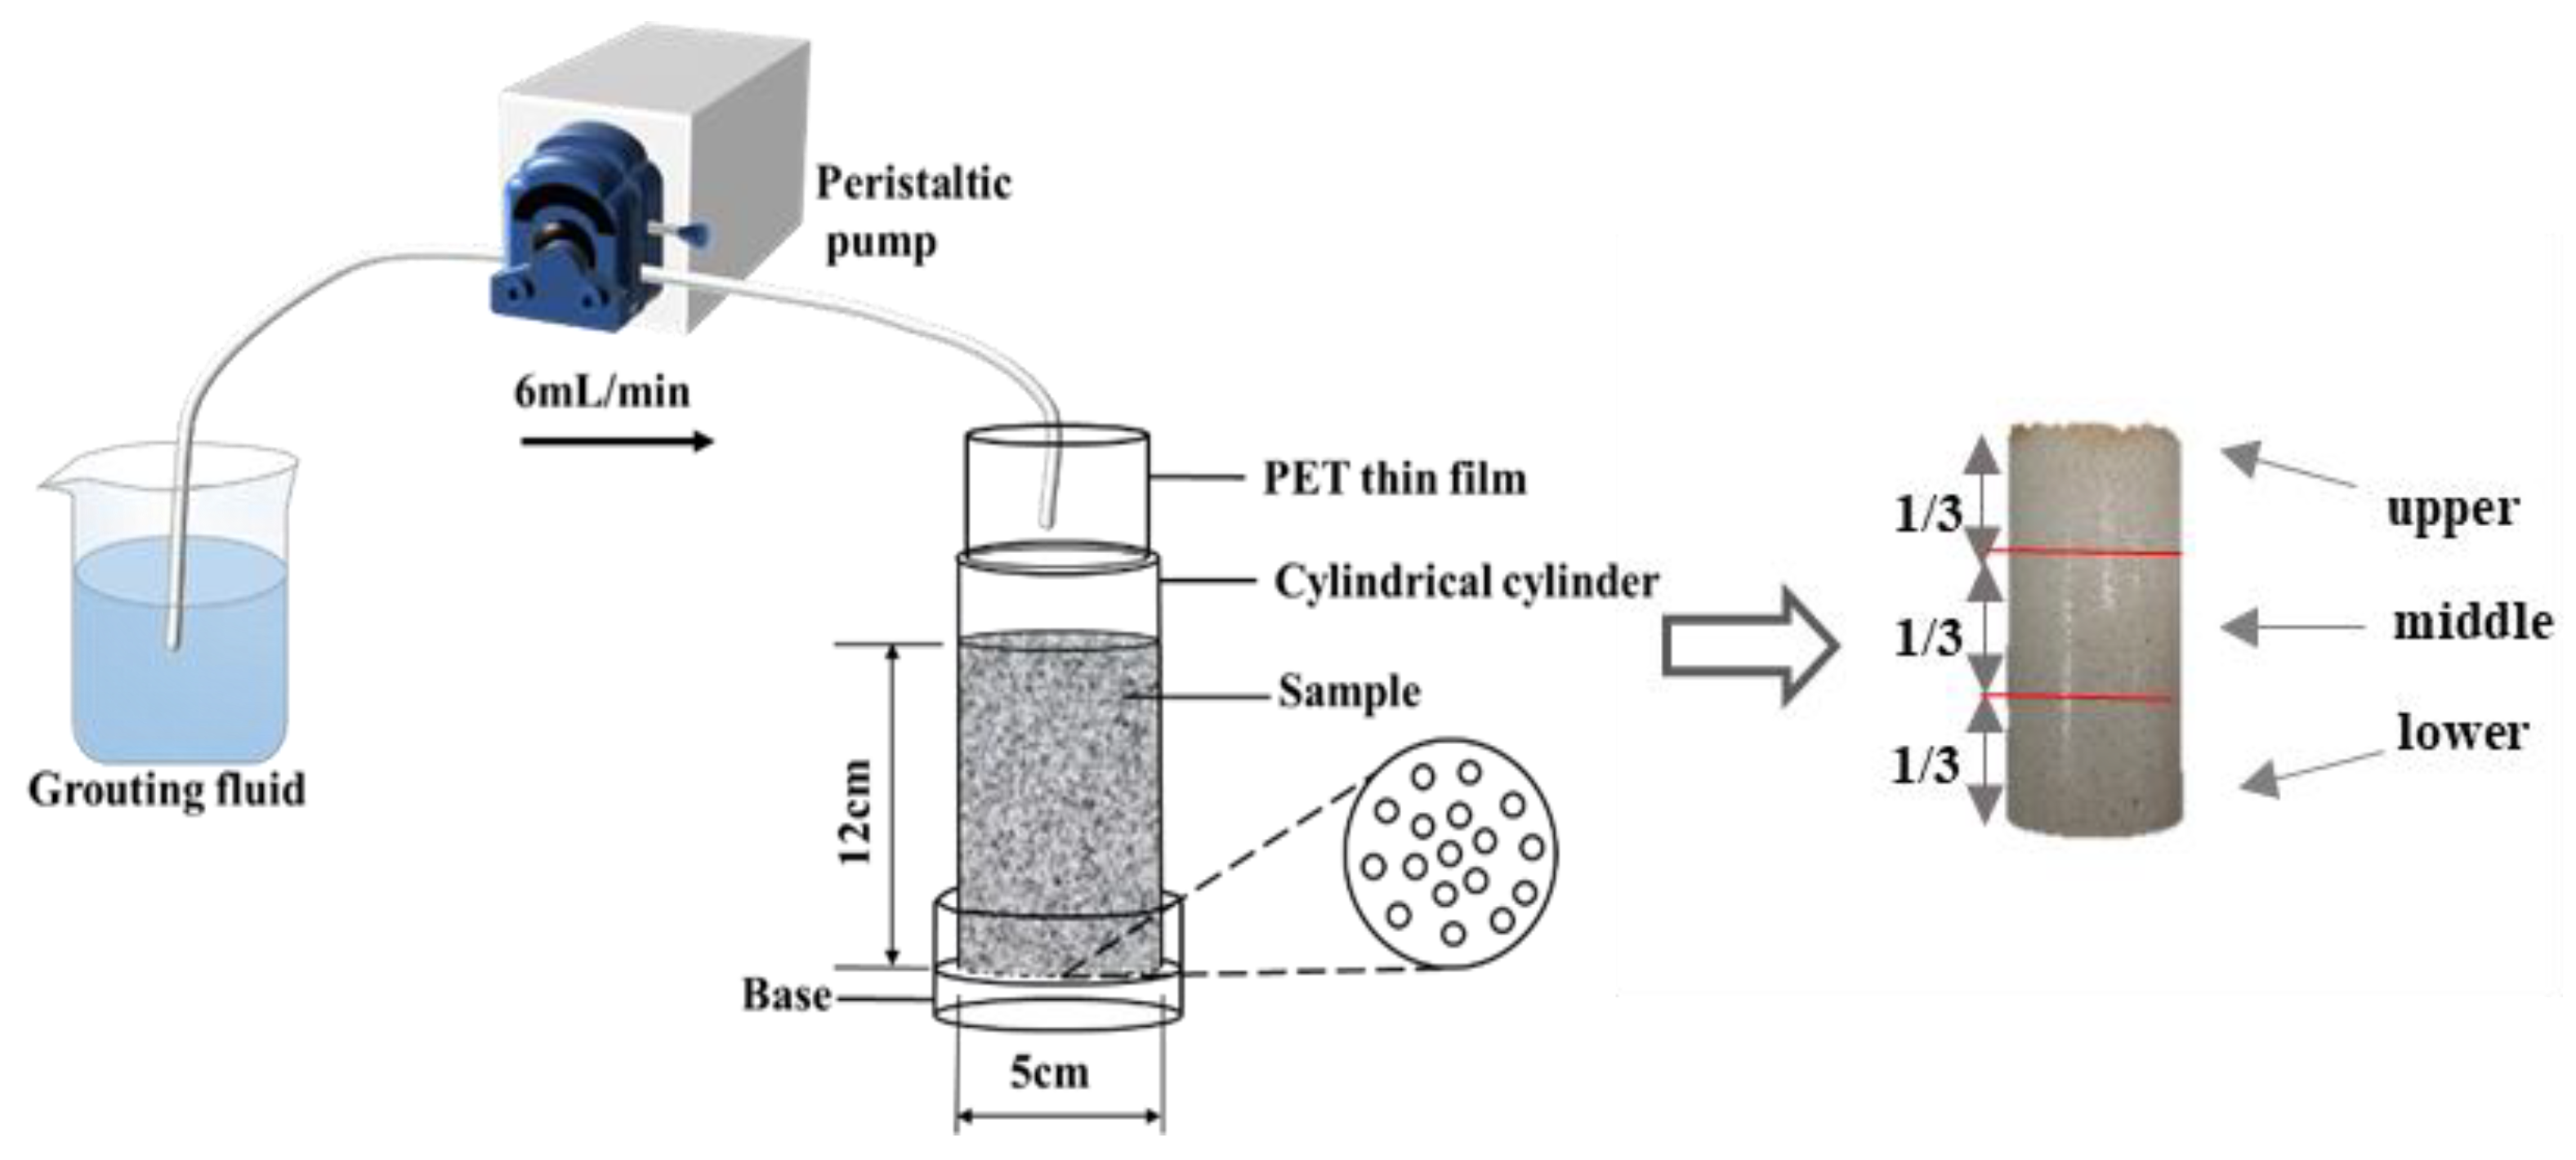
3.1. Sand Specimen Preparation
3.2. Aqueous Solution Test
3.3. Test Procedure
3.3.1. Carbonate Precipitation Content
3.3.2. UCS
3.3.3. pH
3.3.4. Bacterial Parameter Test
3.3.5. Microanalysis Test
4. Results
4.1. Sand Specimen
4.2. Aqueous Solution Test
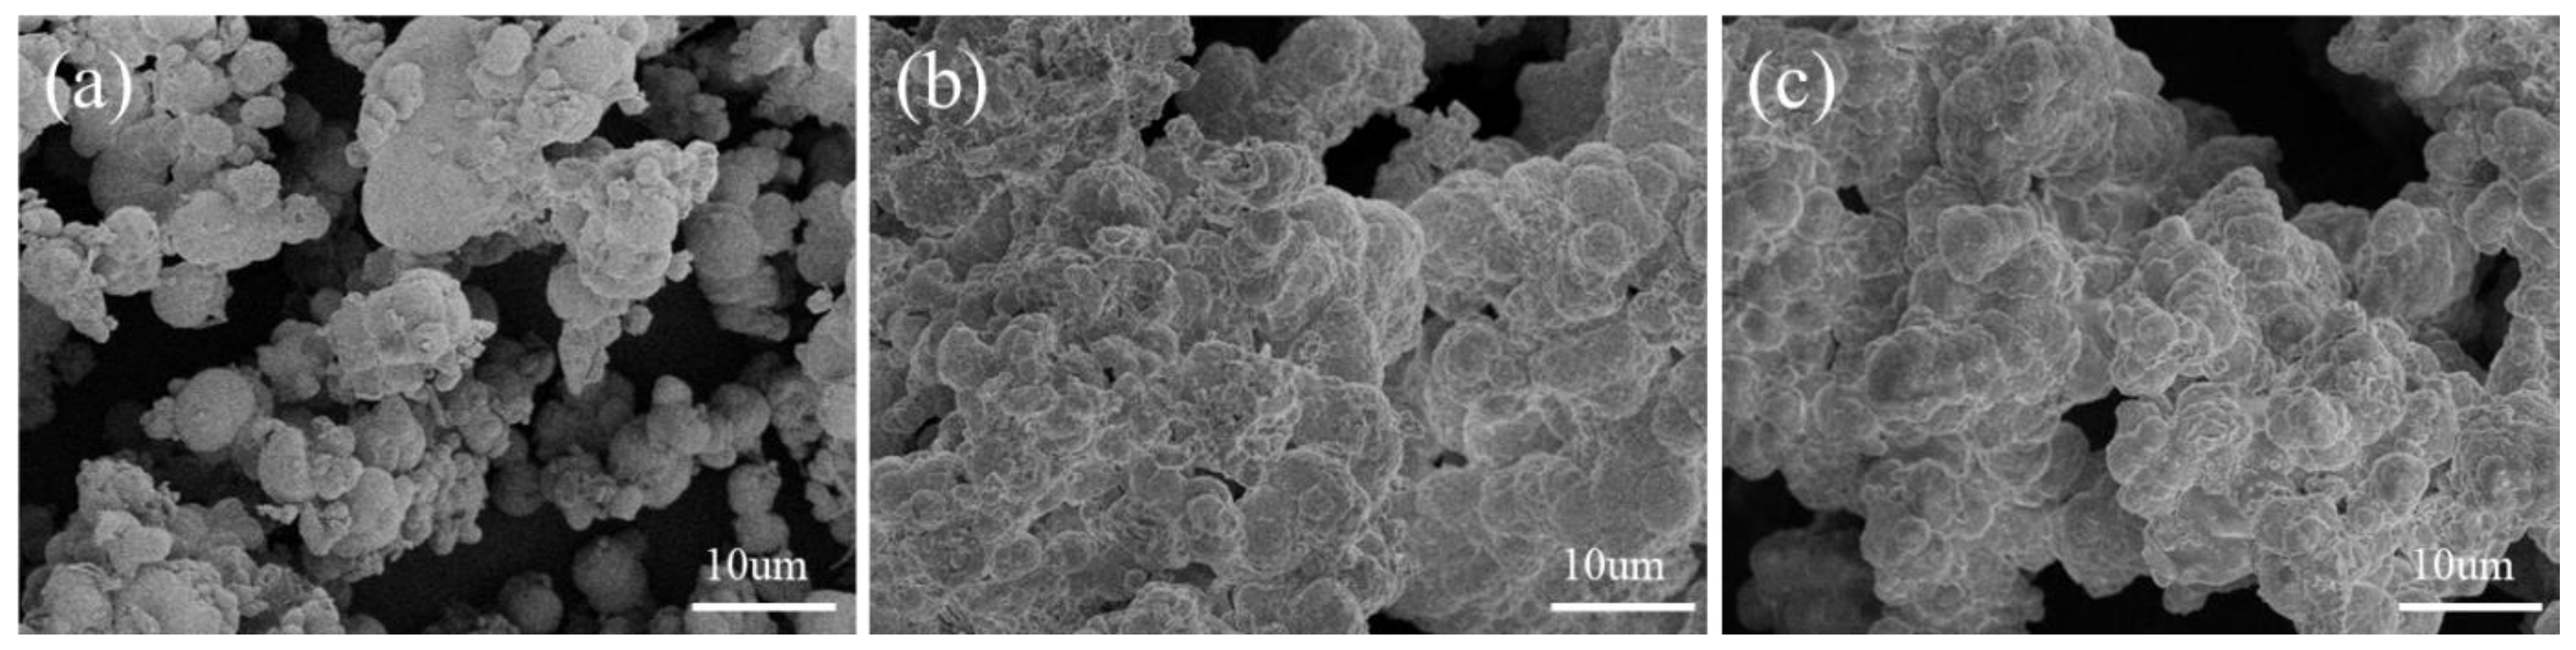
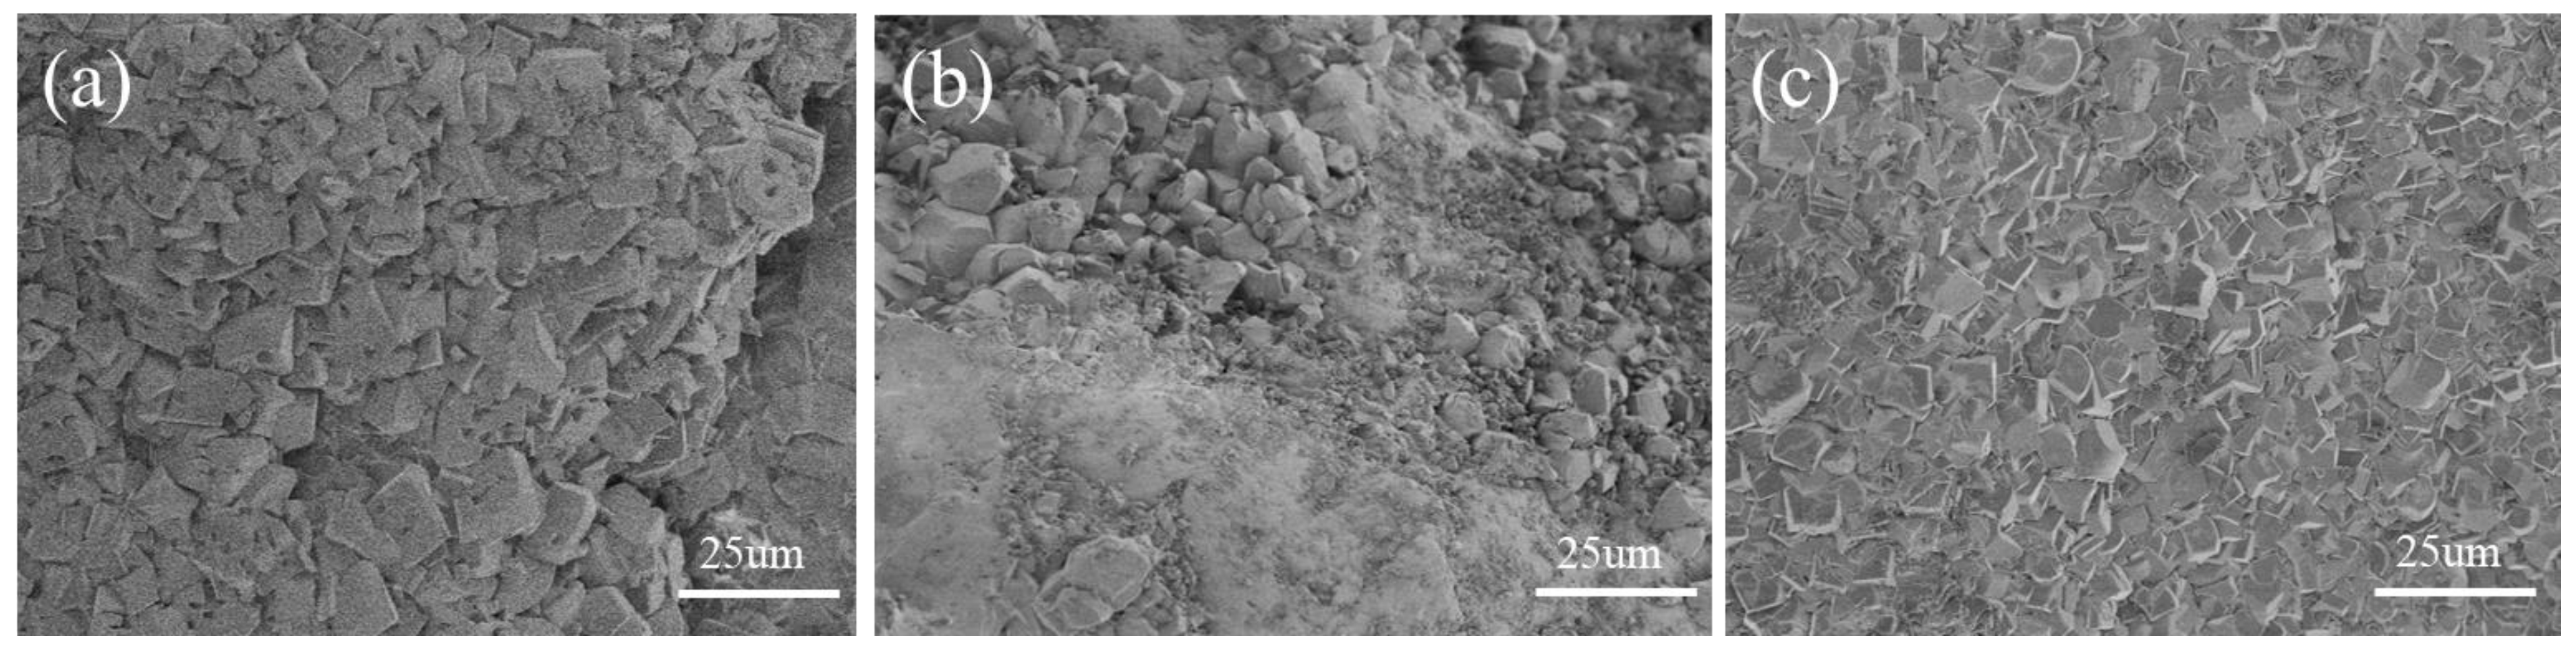
4.3. Microanalysis Test
5. Discussion
6. Conclusions
- (1)
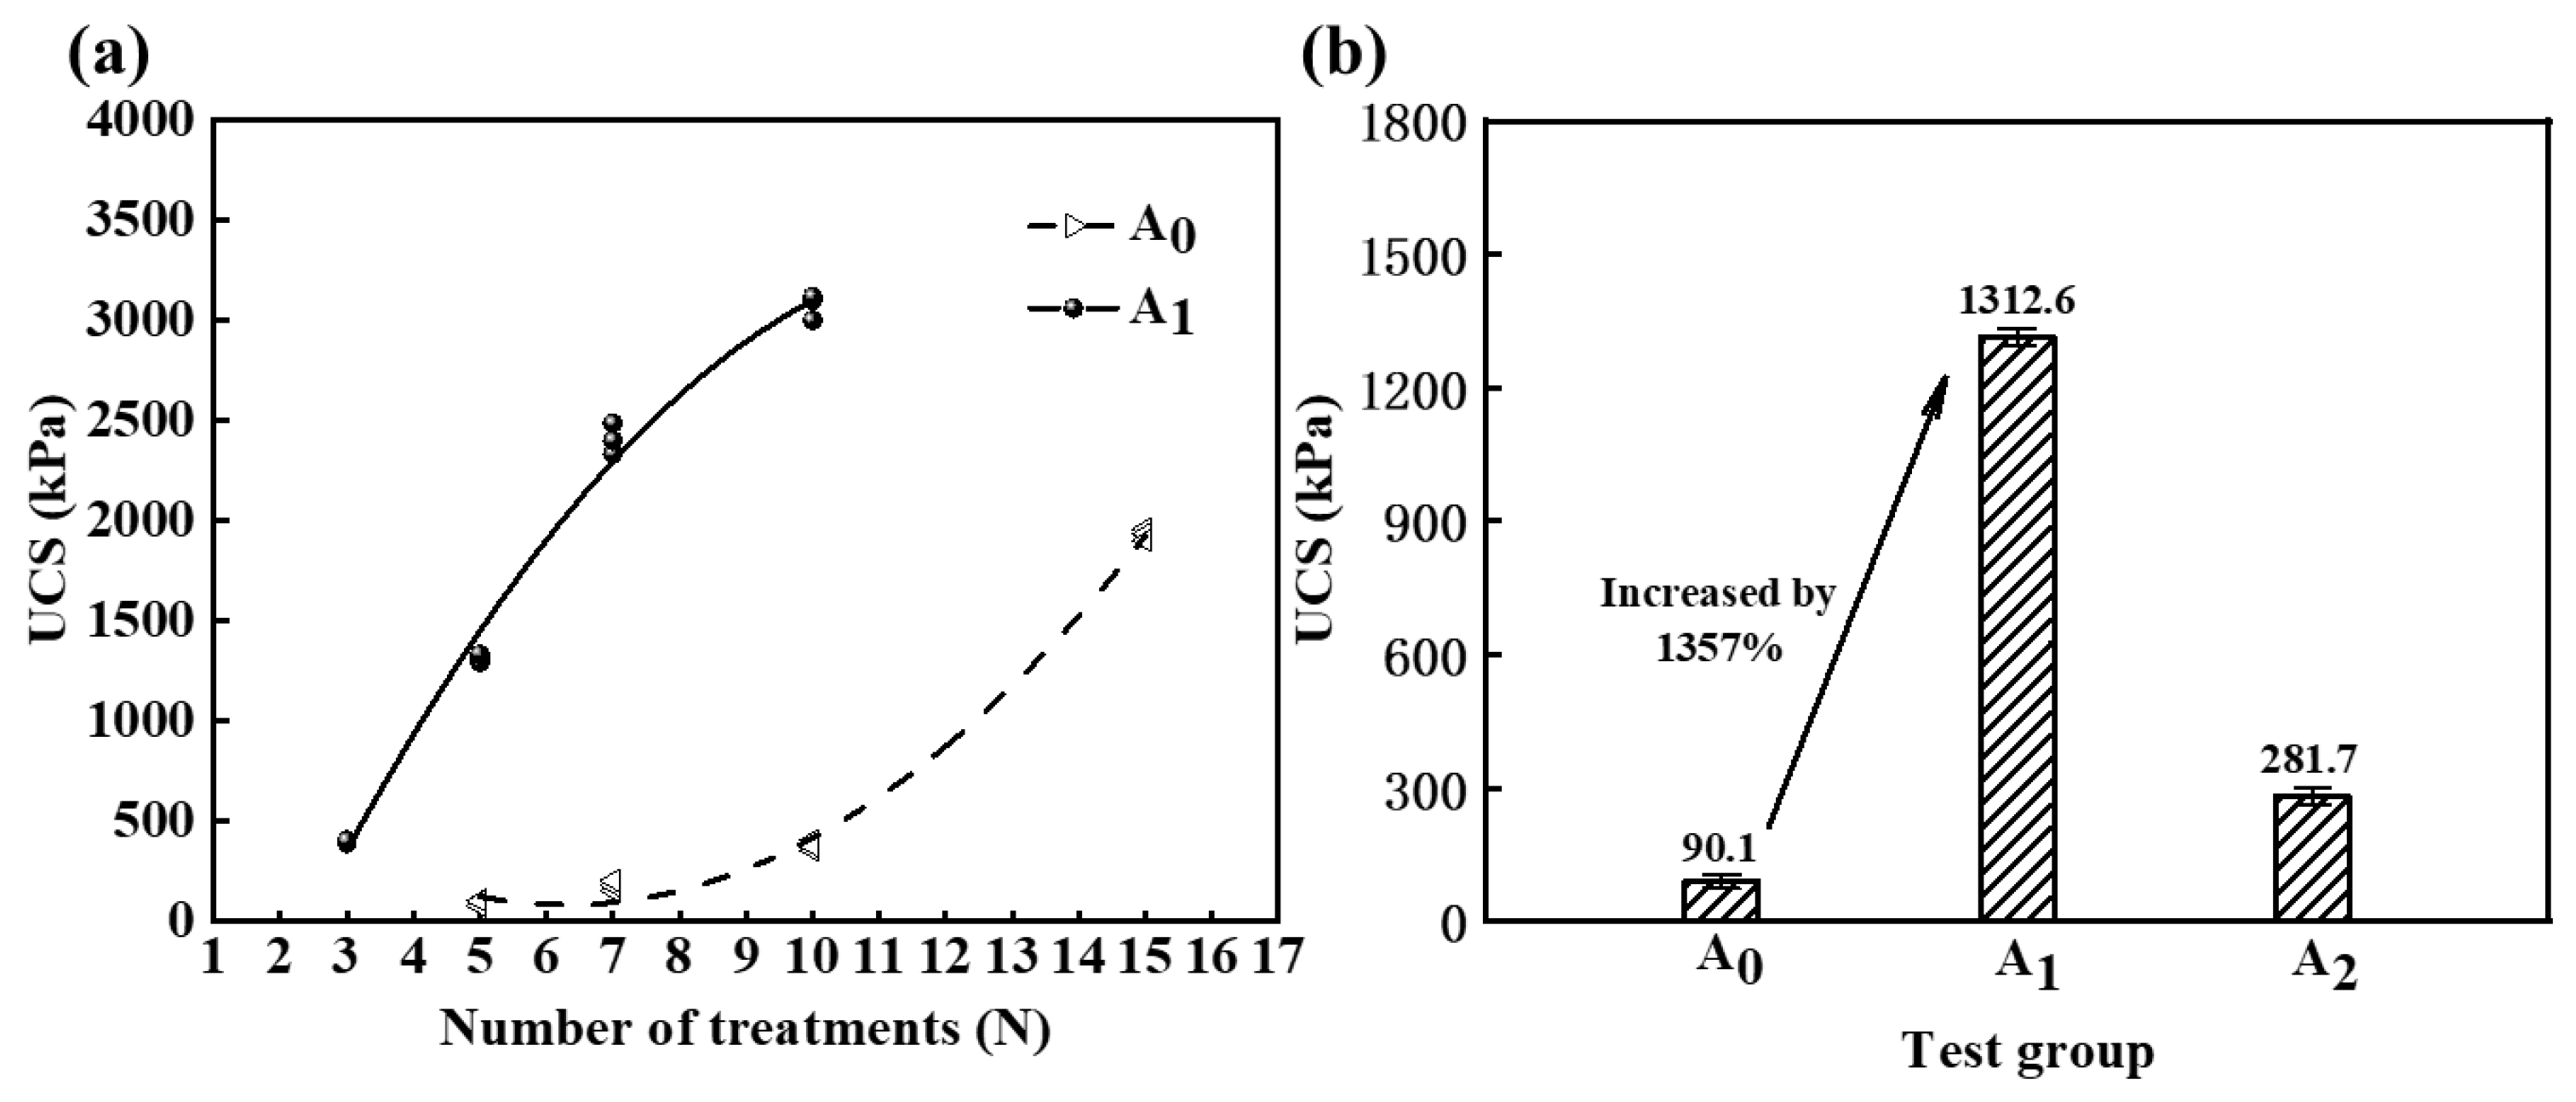
- Experimental tests were conducted to reinforce calcareous sand using MICP with a cementing solution prepared in a certain concentration of HCl solution. The findings revealed a notable enhancement in the reinforcement efficacy, as evidenced by the UCS reaching 1312.6 kPa following five treatment cycles. Notably, the UCS of the sand column exhibited a remarkable increase of 1357% compared to the control group. The inclusion of hydrochloric acid substantially amplified the reinforcement effect and facilitated the widespread implementation of MICP technology.
- (2)
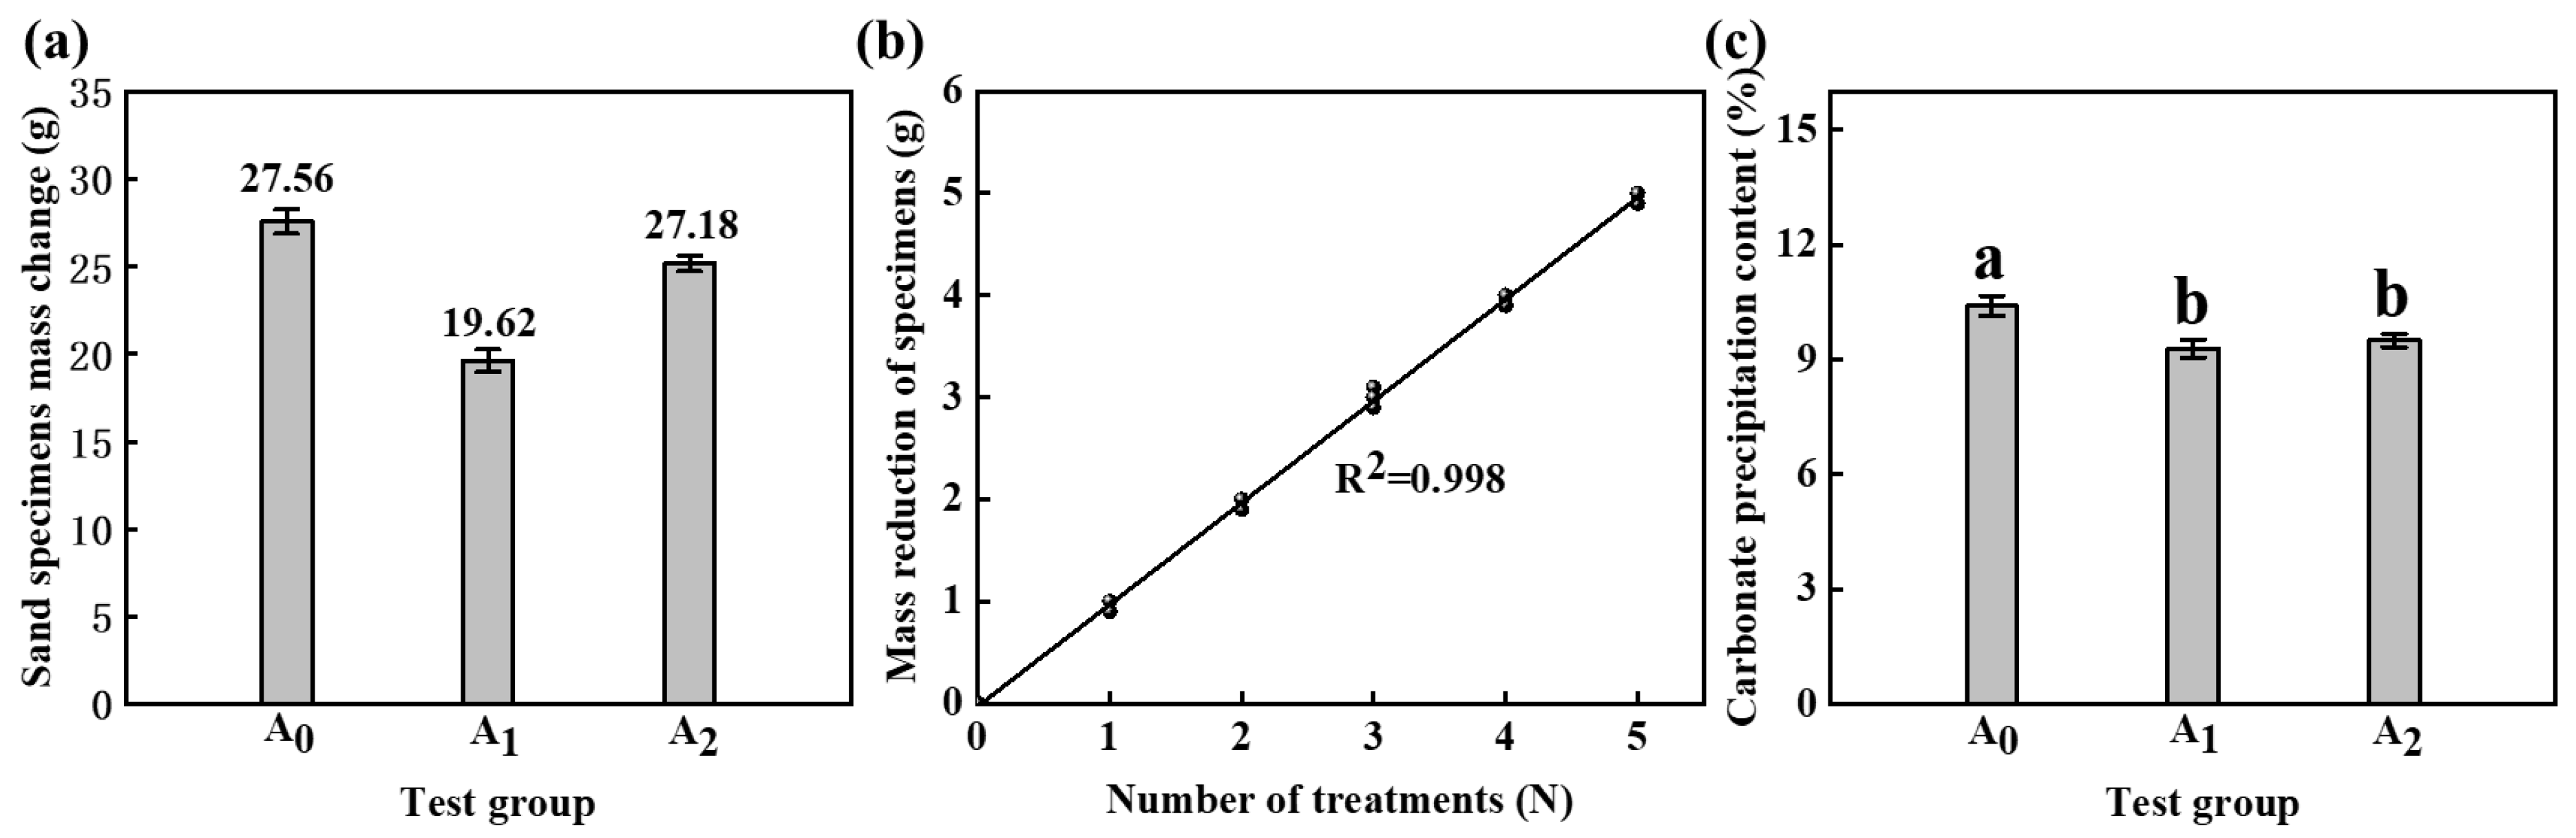
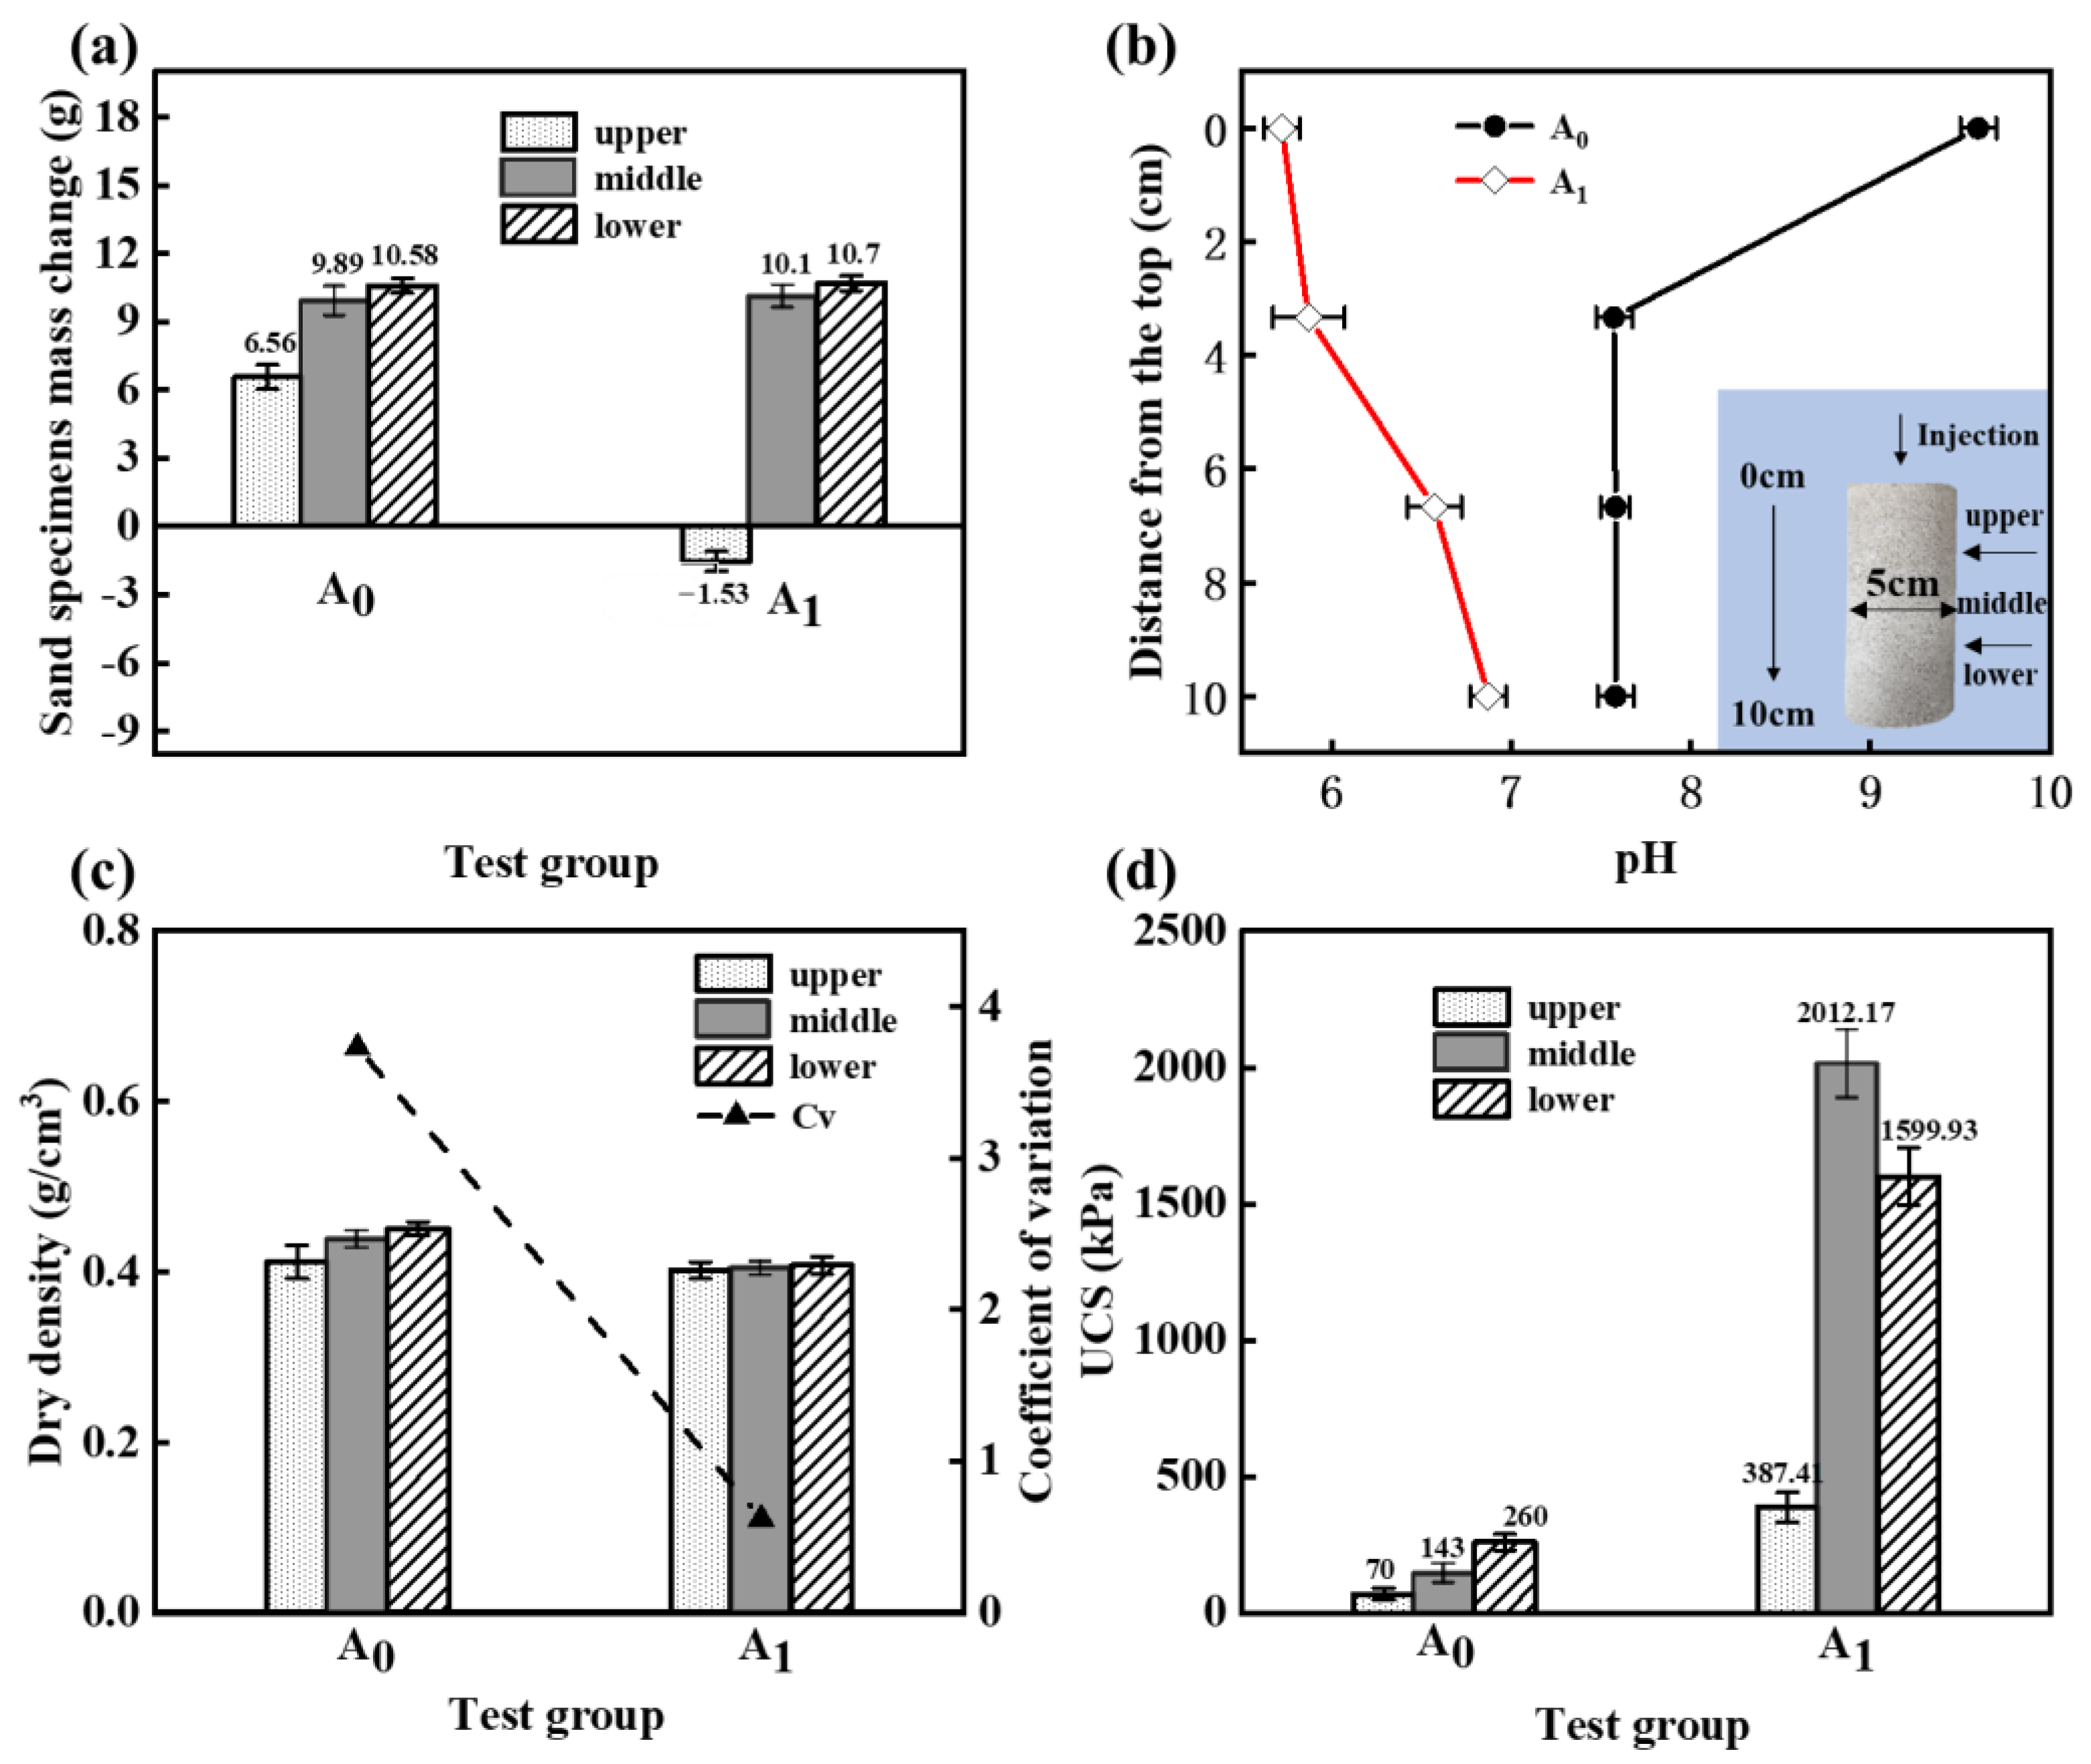
- The reaction between HCl and calcareous sand leads to insufficient reinforcement in the upper section of the specimen. However, aqueous solution tests demonstrated that MICP can still occur at a pH value of 5.63. The lower pH value within the specimen resulted in a more uniform distribution of CaCO3 within the reinforced region of the specimen.
- (3)
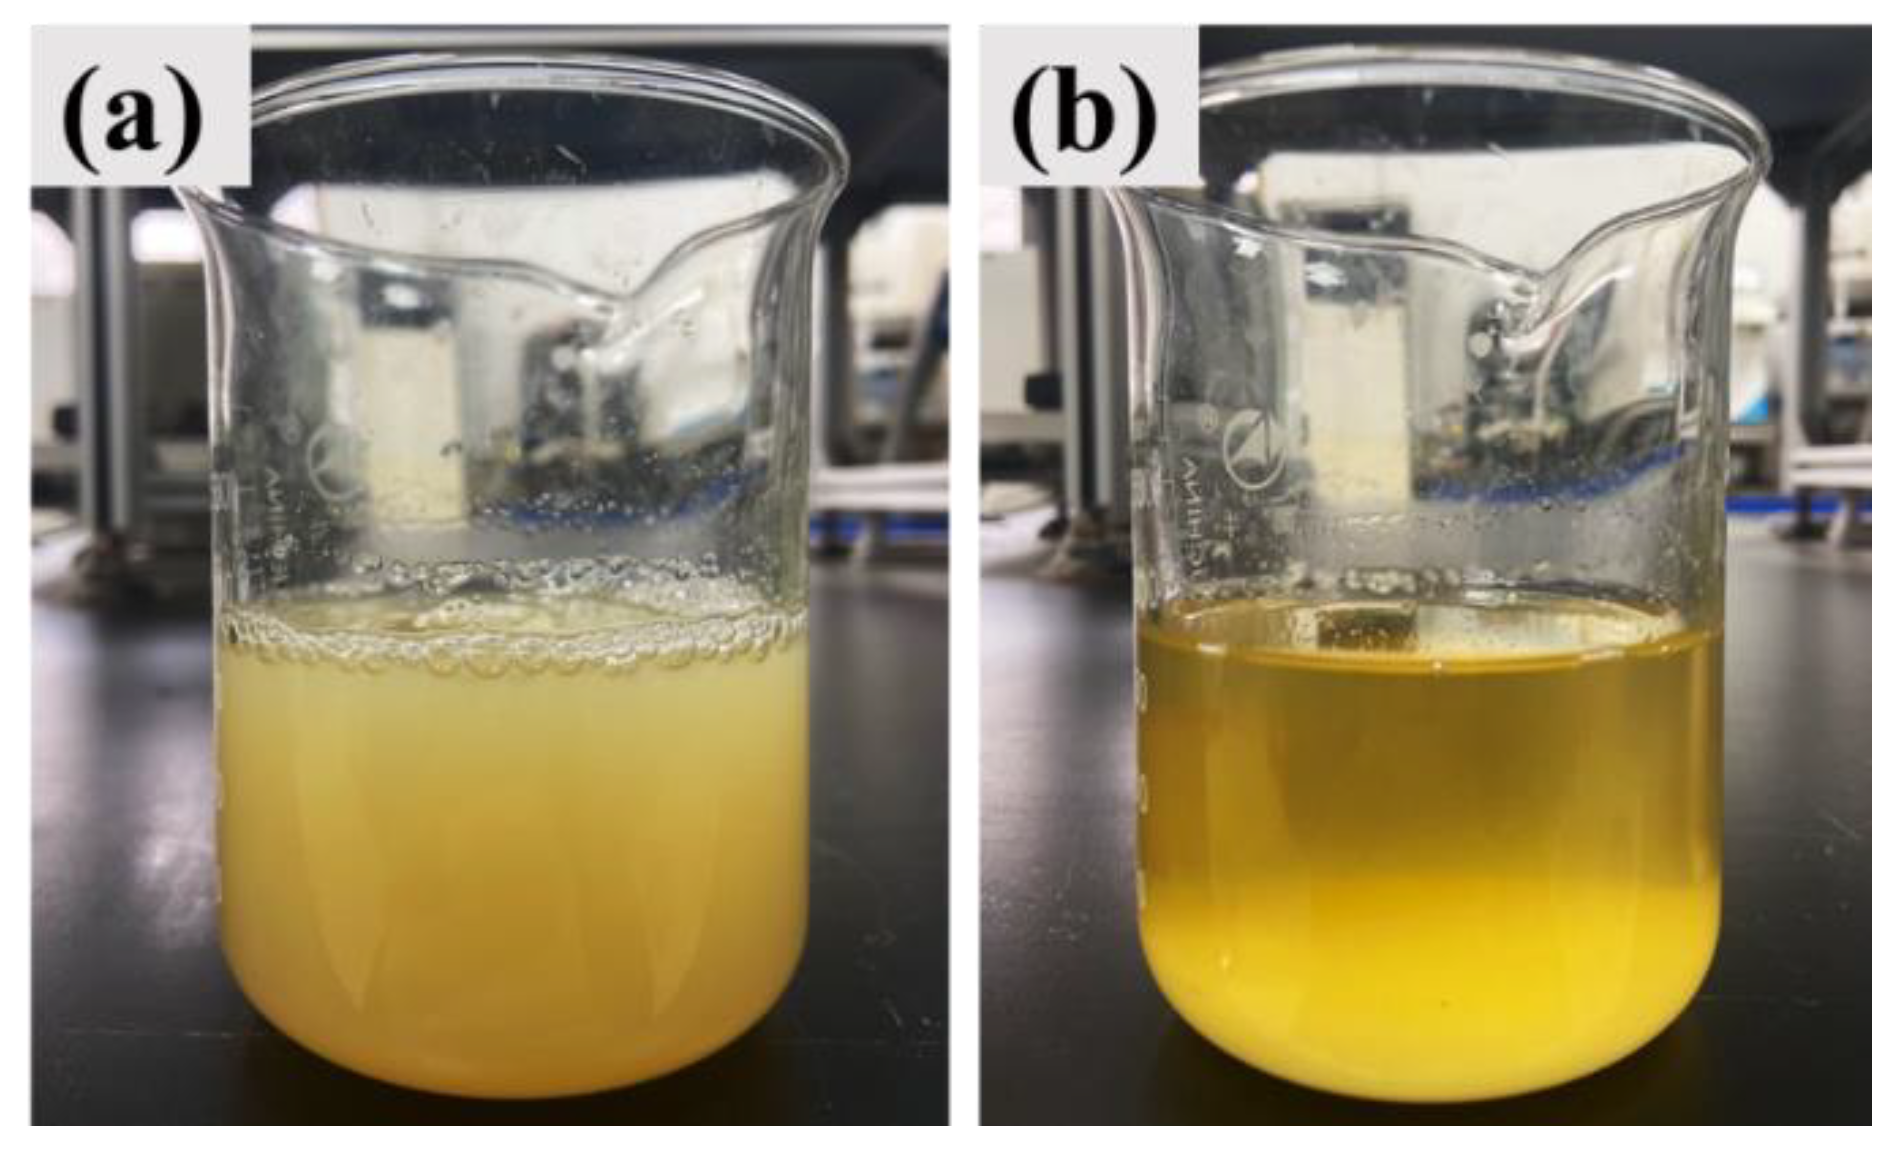
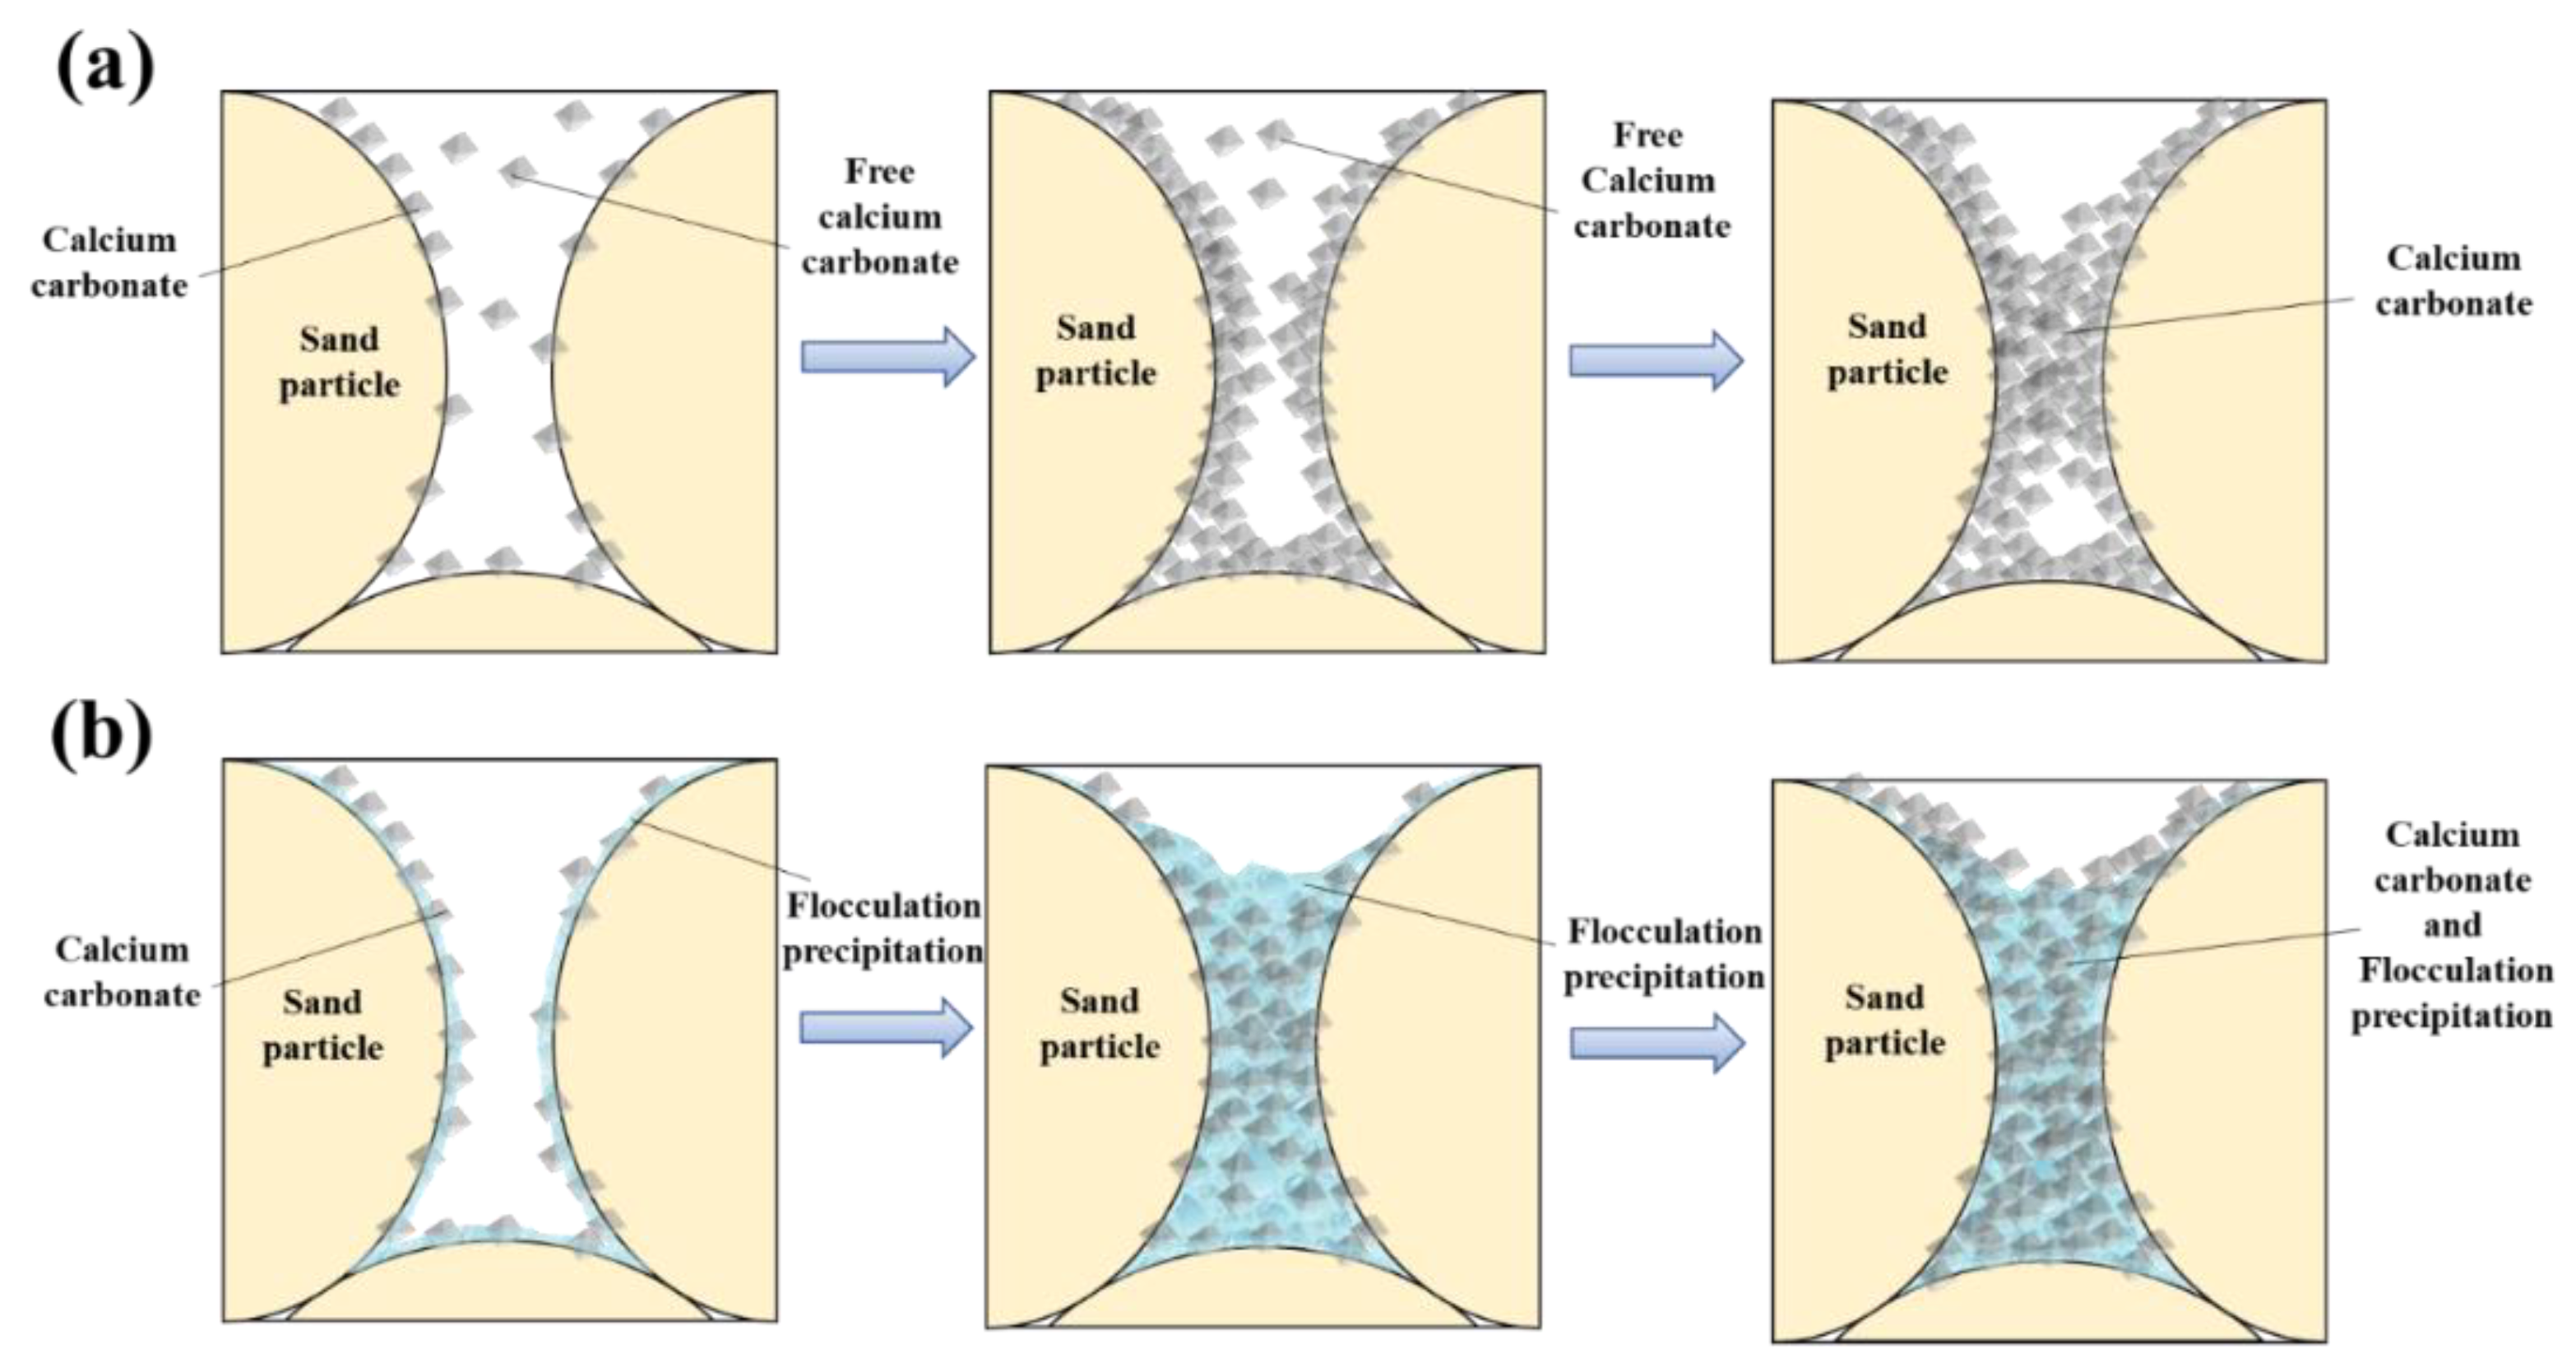
- When HCl was involved in the reaction of MICP reinforced calcareous sand, it led to the dissolution of metal ions from the calcareous sand. These metal ions were transformed into flocculated precipitates that changed the distribution pattern of calcium carbonate in the sand column specimens. As a result, the sand particles were able to bond together more quickly, resulting in a rapid reinforcement of the specimen and an increase in UCS.
Author Contributions
Funding
Institutional Review Board Statement
Informed Consent Statement
Data Availability Statement
Conflicts of Interest
References
- Dejong, J.T.; Mortensen, B.M.; Martinez, B.C.; Nelson, D.C. Bio-mediated soil improvement. Ecol. Eng. 2010, 36, 197–210. [Google Scholar] [CrossRef]
- Arpajirakul, S.; Pungrasmi, W.; Likitlersuang, S. Efficiency of microbially-induced calcite precipita -tion in natural clays for ground improvement. Constr. Build. Mater. 2021, 282, 122722. [Google Scholar] [CrossRef]
- Cheng, L.; Cord-Ruwisch, R.; Shahin, M.A. Cementation of sand soil by microbially induced calcite precipitation at various degrees of saturation. Can. Geotech. J. 2013, 50, 81–90. [Google Scholar] [CrossRef]
- Cui, M.; Zheng, J.; Zhang, R.; Lai, H.; Zhang, J. Influence of cementation level on the strength behaviour of bio-cemented sand. Acta Geotech. 2017, 12, 971–986. [Google Scholar] [CrossRef]
- Xiao, P.; Liu, H.; Xiao, Y.; Stuedlein, A.W.; Evans, T.M. Liquefaction resistance of bio-cemented calcareous sand. Soil Dyn. Earthq. Eng. 2018, 107, 9–19. [Google Scholar] [CrossRef]
- Xiao, Y.; Xiao, W.; Wu, H.; Liu, Y.; Liu, H. Fracture of Interparticle MICP Bonds under Compression. Int. J. Geomech. 2022, 23, 04022316. [Google Scholar] [CrossRef]
- Bachmeier, K.L.; Williams, A.E.; Warmington, J.R.; Bang, S.S. Urease activity in microbiologically-induced calcite precipitation. J. Biotechnol. 2002, 93, 171–181. [Google Scholar] [CrossRef]
- Mortensen, B.M.; Haber, M.J.; Dejong, J.T.; Caslake, L.F.; Nelson, D.C. Effects of environmental factors on microbial induced calcium carbonate precipitation. J. Appl. Microbiol. 2011, 111, 338–349. [Google Scholar] [CrossRef]
- Li, K.; Chen, G.; Liu, Y.; Yin, Z. Scale Effect on the Apparent Anisotropic Hydraulic Conductivity of Geomaterials. Asce-Asme J. Risk Uncertain. Eng. Syst. Part A-Civ. Eng. 2023, 9, 04023020. [Google Scholar] [CrossRef]
- Valle, C.; Camacho, B.I.; Stokoe, K.H.; Rauch, A.F. Comparison of the Dynamic Properties and Undrained Shear Strengths of Offshore Calcareous Sand and Artificially Cemented Sand. In Proceedings of the ASME 2003 22nd International Conference on Offshore Mechanics and Arctic Engineering, Cancun, Mexico, 8–13 June 2003. [Google Scholar]
- Zeng, H.; Yin, L.; Tang, C.; Zhu, C.; Cheng, Q.; Li, H.; Lv, C.; Shi, B. Tensile behavior of bio-cemented, fiber-reinforced calcareous sand from coastal zone. Eng. Geol. 2021, 294, 106390. [Google Scholar] [CrossRef]
- Wang, X.; Jiao, Y.; Wang, R.; Hu, M.; Meng, Q.; Tan, F. Engineering characteristics of the calcareous sand in Nansha Islands, South China Sea. Eng. Geol. 2011, 120, 40–47. [Google Scholar] [CrossRef]
- Lv, C.; Tang, C.; Zhang, J.; Pan, X.; Liu, H. Effects of calcium sources and magnesium ions on the mechanical behavior of MICP-treated calcareous sand: Experimental evidence and precipitated crystal insights. Acta Geotech. 2022, 18, 2703–2717. [Google Scholar] [CrossRef]
- Kuang, D.; Long, Z.; Guo, R.; Yu, P. Experimental and numerical investigation on size effect on crushing behaviors of single calcareous sand particles. Mar. Georesources Geotechnol. 2021, 39, 543–553. [Google Scholar] [CrossRef]
- Lv, Y.; Li, X.; Fan, C.; Su, Y. Effects of internal pores on the mechanical properties of marine calcareous sand particles. Acta Geotech. 2021, 16, 3209–3228. [Google Scholar] [CrossRef]
- Coop, M.R.; Sorensen, K.K.; Freitas, T.B.; Georgoutsos, G. Particle breakage during shearing of a carbonate sand. Geotechnique 2004, 54, 157–163. [Google Scholar] [CrossRef]
- Xiao, Y.; Liu, H.; Xiao, P.; Xiang, J. Fractal crushing of carbonate sands under impact loading. Geotech. Lett. 2016, 6, 199–204. [Google Scholar] [CrossRef]
- Liu, L.; Liu, H.; Stuedlein, A.W.; Evans, T.M.; Xiao, Y. Strength, stiffness, and microstructure characteristics of biocemented calcareous sand. Can. Geotech. J. 2019, 56, 1502–1513. [Google Scholar] [CrossRef]
- Khan, M.N.H.; Amarakoon, G.; Shimazaki, S.; Kawasaki, S. Coral Sand Solidification Test Based on Microbially Induced Carbonate Precipitation Using Ureolytic Bacteria. Mater. Trans. 2015, 56, 115–122. [Google Scholar] [CrossRef]
- Deng, W.; Wang, Y. Investigating the Factors Affecting the Properties of Coral Sand Treated with Microbially Induced Calcite Precipitation. Adv. Civ. Eng. 2018, 2018, 9590653. [Google Scholar] [CrossRef]
- Zheng, H.; Wu, L.; Tong, K.; Ding, D.; Zhang, Z.; Yu, Q.; He, G. Experiment on microbial grouting reinforcement of tailings under the regulation of egg white. Soils Found. 2020, 60, 962–977. [Google Scholar] [CrossRef]
- Yao, D.; Wu, J.; Niu, S.; Gu, Z.; Zheng, J.; Yan, J.; Xu, L.; Yang, M.; Yan, Y. An anionic biopolymer gamma-polyglutamate enhanced the microbially induced carbonate precipitation for soil improvement: Mechanical behaviors and underlying mechanism. Acta Geotech. 2022, 17, 4485–4496. [Google Scholar] [CrossRef]
- Zheng, J.; Wu, C.; Song, Y.; Cui, M. Study of the strength test and strength dispersion of MICP-treated calcareous sand. J. Harbin Eng. Univ. 2020, 41, 250–256. [Google Scholar]
- Lee, M.L.; Ng, W.S.; Tanaka, Y. Stress-deformation and compressibility responses of bio-mediated residual soils. Ecol. Eng. 2013, 60, 142–149. [Google Scholar] [CrossRef]
- Shan, Y.; Zhao, J.; Tong, H.; Yuan, J.; Lei, D.; Li, Y. Effects of activated carbon on liquefaction resistance of calcareous sand treated with microbially induced calcium carbonate precipitation. Soil Dyn. Earthq. Eng. 2022, 161, 107419. [Google Scholar] [CrossRef]
- Heineck, K.S.; Coop, M.R.; Consoli, N.C. Effect of microreinforcement of soils from very small to large shear strains. J. Geotech. Geoenvironmental Eng. 2005, 131, 1024–1033. [Google Scholar] [CrossRef]
- Choi, S.G.; Wang, K.; Chu, J. Properties of biocemented, fiber reinforced sand. Constr. Build. Mater. 2016, 120, 623–629. [Google Scholar] [CrossRef]
- Zhao, J.; Tong, H.; Shan, Y.; Yuan, J.; Peng, Q.; Liang, J. Effects of Different Types of Fibers on the Physical and Mechanical Properties of MICP-Treated Calcareous Sand. Materials 2021, 14, 268. [Google Scholar] [CrossRef]
- Al Imran, M.; Gowthaman, S.; Nakashima, K.; Kawasaki, S. The Influence of the Addition of Plant-Based Natural Fibers (Jute) on Biocemented Sand Using MICP Method. Materials 2020, 13, 4198. [Google Scholar] [CrossRef]
- Fang, X.; Yang, Y.; Chen, Z.; Liu, H.; Xiao, Y.; Shen, C. Influence of Fiber Content and Length on Engineering Properties of MICP-Treated Coral Sand. Geomicrobiol. J. 2020, 37, 582–594. [Google Scholar] [CrossRef]
- Chu, J.; Stabnikov, V.; Ivanov, V. Microbially Induced Calcium Carbonate Precipitation on Surface or in the Bulk of Soil. Geomicrobiol. J. 2012, 29, 544–549. [Google Scholar] [CrossRef]
- De Muynck, W.; De Belie, N.; Verstraete, W. Microbial carbonate precipitation in construction materials: A review. Ecol. Eng. 2010, 36, 118–136. [Google Scholar] [CrossRef]
- Al Qabany, A.; Soga, K.; Santamarina, C. Factors Affecting Efficiency of Microbially Induced Calcite Precipitation. J. Geotech. Geoenviron. Eng. 2012, 138, 992–1001. [Google Scholar] [CrossRef]
- Wei, R.; Peng, J.; Li, L.; Jiang, Z.; Tang, J. Accelerated Reinforcement of Calcareous sand via Biomineralization with Aluminum Ion Flocculant. Appl. Biochem. Biotechnol. 2023, in press. [CrossRef]
- Cheng, L.; Shahin, M.A.; Chu, J. Soil bio-cementation using a new one-phase low-pH injection method. Acta Geotech. 2018, 14, 615–626. [Google Scholar] [CrossRef]
- Martinez, B.C.; Dejong, J.T.; Ginn, T.R.; Montoya, B.M.; Barkouki, T.H.; Hunt, C.; Tanyu, B.; Major, D. Experimental Optimization of Microbial-Induced Carbonate Precipitation for Soil Improvement. J. Geotech. Geoenviron. Eng. 2013, 139, 587–598. [Google Scholar] [CrossRef]
- ASTM 2013; Standard Test Method for Unconfined Compressive Strength of Cohesive Soil. ASTM International: West Conshohocken, PA, USA, 2013.
- ASTM 2017; Standard Test Method for pH of Aqueous Solutions With the Glass Electrode. ASTM International: West Conshohocken, PA, USA, 2017.
- Harkes, M.P.; Van Paassen, L.A.; Booster, J.L.; Whiffin, V.S.; Van Loosdrecht, M.C.M. Fixation and distribution of bacterial activity in sand to induce carbonate precipitation for ground reinforcement. Ecol. Eng. 2010, 36, 112–117. [Google Scholar] [CrossRef]
- Whiffin, V.S. Microbial CaCO3 Precipitation for the Production of Biocement. Ph.D. Thesis, Murdoch University, Perth, Australia, 2004. [Google Scholar] [CrossRef]
- Hammes, F.; Verstraete, W. Key roles of pH and calcium metabolism in microbial carbonate precipitation. Rev. Environ. Sci. Biotechnol. 2002, 1, 3–7. [Google Scholar] [CrossRef]
- Cheng, L.; Shahin, M.A.; Cord-Ruwisch, R. Soil stabilisation by microbial-induced calcite precipitation (MICP): Investigation into some physical and environmental aspects. In Proceedings of the 7th International Congress on Environmental Geotechnics: ICEG Barton: Engineers Australia, Melbourne, Australia, 10–14 November 2014. [Google Scholar]
- Liu, L.; Liu, H.; Xiao, Y.; Chu, J.; Xiao, P.; Wang, Y. Biocementation of calcareous sand using soluble calcium derived from calcareous sand. Bull. Eng. Geol. Environ. 2018, 77, 1781–1791. [Google Scholar] [CrossRef]


| Element | C&O | Ca | Mg | Al | Si | Sr | F |
| Content (%) | 41.827 | 50.85 | 2.291 | 0.695 | 1.101 | 0.902 | 0.581 |
| Element | Na | P | S | Fe | Sm | Cl | K |
| Content (%) | 0.541 | 0.383 | 0.377 | 0.19 | 0.165 | 0.098 | 0.04 |
| Group | Treatment of Cementation Solution | Volume of Bacterial Solution/mL | Volume of Testing Solution per Injection /mL |
|---|---|---|---|
| A0 | 1 M CaCl2 + 1 M Urea | 100 | 100 |
| A1 | 1 M CaCl2 + 1 M Urea + 0.2 M HCl | ||
| A2 | The effluent obtained from the mixed solution composed of 1 M CaCl2, 1 M urea, and 0.2 M HCl as it flowed through the calcareous sand specimen |
| Group | Testing Solution | Volume of Testing Solution/mL | Volume of Bacterial Solution/mL |
|---|---|---|---|
| S0 | Deionized water | 100 | 100 |
| S1 | 0.2 M HCl | ||
| S2 | The effluent obtained from 0.2 M HCl as it flowed through the calcareous sand specimen | ||
| S3 | Deionized water at pH = 5.63 | ||
| T0 | 1 M CaCl2 + 1 M urea | 100 | 100 |
| T1 | 1 M CaCl2 + 1 M Urea + 0.2 M HCl | ||
| T2 | The effluent obtained from the mixed solution composed of 1 M CaCl2, 1 M urea, and 0.2 M HClas it flowed through the calcareous sand specimen | ||
| T3 | 1 M CaCl2 + 1 M urea at pH = 5.63 |
Disclaimer/Publisher’s Note: The statements, opinions and data contained in all publications are solely those of the individual author(s) and contributor(s) and not of MDPI and/or the editor(s). MDPI and/or the editor(s) disclaim responsibility for any injury to people or property resulting from any ideas, methods, instructions or products referred to in the content. |
© 2023 by the authors. Licensee MDPI, Basel, Switzerland. This article is an open access article distributed under the terms and conditions of the Creative Commons Attribution (CC BY) license (https://creativecommons.org/licenses/by/4.0/).
Share and Cite
Jiang, Z.; Wei, R.; Dai, D.; Li, L.; Shang, Z.; Tang, J.; Peng, J.; Li, P. Experimental Study on Bio-Reinforcement of Calcareous Sand through Hydrochloric Acid Solution Precipitation into Cementing Solution. Materials 2023, 16, 6348. https://doi.org/10.3390/ma16196348
Jiang Z, Wei R, Dai D, Li L, Shang Z, Tang J, Peng J, Li P. Experimental Study on Bio-Reinforcement of Calcareous Sand through Hydrochloric Acid Solution Precipitation into Cementing Solution. Materials. 2023; 16(19):6348. https://doi.org/10.3390/ma16196348
Chicago/Turabian StyleJiang, Zhao, Renjie Wei, Di Dai, Liangliang Li, Zhiyang Shang, Jiahui Tang, Jie Peng, and Ping Li. 2023. "Experimental Study on Bio-Reinforcement of Calcareous Sand through Hydrochloric Acid Solution Precipitation into Cementing Solution" Materials 16, no. 19: 6348. https://doi.org/10.3390/ma16196348