
Pyrolysis Kinetic Behavior and Thermodynamic Analysis of PET Nonwoven Fabric
by
 , , and
Samy Yousef
1,* ,
,
Justas Eimontas
2,
Nerijus Striūgas
2,
Alaa Mohamed
3 and
Mohammed Ali Abdelnaby
4 1
Department of Production Engineering, Faculty of Mechanical Engineering and Design, Kaunas University of Technology, LT-51424 Kaunas, Lithuania
2
Laboratory of Combustion Processes, Lithuanian Energy Institute, Breslaujos 3, LT-44403 Kaunas, Lithuania
3
Department of Production Engineering and Printing Technology, Akhbar Elyom Academy, 6th of October 12566, Egypt
4
Mechatronics Systems Engineering Department, October University for Modern Sciences and Arts-MSA, Giza 12451, Egypt
*
Author to whom correspondence should be addressed.
Materials 2023, 16(18), 6079; https://doi.org/10.3390/ma16186079
Submission received: 16 August 2023
/
Revised: 27 August 2023
/
Accepted: 31 August 2023
/
Published: 5 September 2023
(This article belongs to the Special Issue Advanced Applications of Sustainable Resins and Fibers in Polymer and Cementitious Composites)
Abstract
:This research aims to maximize polyethylene terephthalate (PET) nonwoven fabric waste and make it as a new source for benzoic acid extraction using a pyrolysis process. The treatment was performed using a thermogravimetric analyzer (TGA) and released products were characterized using FTIR spectroscopy and gas chromatography–mass spectrometry (GC–MS). The pyrolysis kinetic and thermodynamic behavior of PET fabric was also studied and simulated using different linear and nonlinear models. The results show that the PET fabric is very rich in volatile matter (80 wt.%) and can completely degrade under 490 °C with a weight loss of 84%. Meanwhile, the generated vapor was rich in the carbonylic C=O functional group (FTIR), and the GC–MS analysis concluded that benzoic acid was the major compound with an abundance of 75% that was achieved at the lowest heating rate (5 °C/min). The linear kinetic results showed that PET samples had an activation energy in the ranges of 193–256 kJ/mol (linear models) and ~161 kJ/mol (nonlinear models). The thermodynamic parameters, including enthalpy, Gibbs free energy, and entropy, were estimated in the ranges of 149–250 kJ/mol, 153–232 kJ/mol, and 256–356 J/mol K, respectively. Accordingly, pyrolysis treatment can be used to extract benzoic acid from PET fabric waste with a 134% increase in the benzoic acid abundance that can be recovered from PET bottle plastic waste.
1. Introduction
Nonwoven fabrics are a major player in the manufacture of ultrafiltration and nanofiltration membranes that are used as a porous backing to enhance their mechanical performance, durability, and allow them to work in harsh environments and under high pressure [1]. Several types of fabrics have been used for this purpose, such as carbon fiber, glass fiber, polyethylene terephthalate (PET), etc. [2,3,4]. Among the different types of support layers, PET is widely used for this propose due to its high strength, high chemical stability, low production cost, homogeneous porous structure, large pores, high compatibility, strong adhesion to the main filtration film (active layer), and large porosity that allows the target to pass through the membrane [5,6]. PET nonwoven fabric is composed of fibers distributed uniformly manufactured via wet-laying or wet-laid technology [7]. All these distinct characteristics have made it a suitable choice for many separation industries, including water treatment, gas separation, pharmaceuticals, protein extraction, adsorption of Cr(VI), etc. [8,9,10,11,12]. It has also been used with ultrafiltration and nanofiltration membranes, which have high bonding with active layers such as poly(vinylidene fluoride), polysulfone, etc. [3,6]. However, their end-of-life products pose a critical problem that needs to be seriously managed.
In fact, there is no specific technology for the recycling of PET fabrics and they are treated as plastic waste using various mechanical, chemical, and thermal processes [13,14]. Although mechanical treatment (shredding and granulation) accompanied by extrusion processes can be used to convert PET waste into granulated material that can be employed in the production of the secondary products [15], these pellets are usually contaminated with organic or inorganic and heavy metals (having different particle sizes and shapes) remaining from the separation process, which affects the quality, crystallinity, and compatibility of the obtained products [16]. These contaminants can be removed by chemical treatment, including dissolution and a leaching process [17]. However, this practice is undesirable because it consumes a lot of chemicals (solvents and acids) with high toxicity and emissions [18]. For these reasons, the biotechnology on depolymerization of PET and repolymerization of reclaimed monomers from PET is still at lab scale [19]. Therefore, thermal treatments, especially pyrolysis and gasification, are receiving a lot of attention as they are eco-friendly processes characterized by simplicity and low emissions, and do not need any kind of chemical pretreatment [20,21]. The gasification process can convert PET into a syngas product consisting of H2 and CO gases. However, this process consumes a lot of energy in the reaction, which takes place at 700 °C [22,23]. In contrast, pyrolysis treatment is performed in an oxygen-free environment with lower temperature, causing the PET molecules to decompose to high-added value chemical compounds, and these contaminations can be consumed as an autocatalyst to increase the abundance of synthesized compounds or remain in the char fraction [24].
Pyrolysis has been used to treat end-of-life thin films and their nanocomposite membranes and to study their pyrolysis kinetics [25]. There are several studies in the literature that have been developed to investigate the thermal decomposition of PET based on different viewpoints. For example, Asma Dhahak et al. (2019) studied the slow pyrolysis of PET in the ranges of 410 °C to 480 °C [26]. The results showed that the larger production of benzoic acid compound was produced at 430 °C. Pavel Straka et al. (2021) used slow pyrolysis (400 °C at 25 °C/min) to convert PET into ethylene glycol, benzoic acid, and clean fuel [27]. Yifan Liu et al. (2022) studied the effect of PET plastic bottle sheet size on the energy recovery using pyrolysis treatment [28]. The results showed that a 10 × 10 mm2 sheet size and 550 °C are the optimum conditions to achieve the maximum overall energy efficiency. The pyrolysis kinetic behavior of PET has been investigated using different approaches [29,30,31,32,33]; all these studies focused on PET plastic bottles or sheets, and bulk materials or the active layer of the membranes in which the support layer and PET fabric is still missing, as this type of fiber is characterized by a semi-crystalline structure that facilitates its decomposition process [34].
In order to encourage the PET fabric producers to invest in this technology, it is necessary to study PET’s pyrolysis properties individually, as single components, to determine its decomposition mechanism, and then study the effect of other additives including the filtration layer, and to avoid the complexity of reactions resulting from including multiple components in the reaction, as PET can usually be found in this type of application as composite waste or mixed with the main separation layer. PET nonwoven fabric is also among the most porous substrates used as a support layer in the production of ultrafiltration and nanofiltration membranes due to its large porosity and high mechanical performance. The huge demand for PET fabrics results in large amounts of waste PET fabrics without specific recycling and management processes. Within this context, this work aims to study the pyrolysis characteristics of PET fabric using a thermogravimetric analyzer (TGA) and its kinetic behavior using linear and nonlinear models, including Flynn–Wall–Ozawa (FWO), Kissinger–Akahira–Sunose (KAS), Friedman, Vyazovkin, and Cai methods [35]. The vapors generated from the thermal decomposition of PET fabric were characterized using Fourier-transform infrared spectroscopy and chromatography–mass spectrometry (GC–MS).
2. Experimental
2.1. Materials and PET Feedstock Preparation
The nonwoven support fabric polyester layer with thickness of 190 µm (PET; Novatexx 2413) used in the present study was supplied by Freudenberg Group, Weinheim, Germany. A scanning electron microscopy (SEM) was used to observe the surface morphology of the supplied PET feedstock and its SEM image is shown in Figure 1. The measured sample was coated with a very thin gold layer to increase its conductivity and avoid any reflection or deformation of the sample caused by the applied high voltage (20 kV). As shown, the fabric had a complex structure composed of intertwined fibers (in the longitudinal and transverse directions) and loosely arranged in the form of a porous structure [36]. The gases needed for TGA experiments and other analyses were supplied by the Lithuanian Energy Institute, Kaunas, Lithuania. The received PET sheet was crushed into fine particles using an electrical coffee grinder for 10 min, then exposed to a sieving process to obtain uniform PET particles (less than 200 μm) that could be used for thermal experiments using TGA. Finally, the elemental and proximate analysis of the PET fabric was determined based E1756-01, E872-82, and E1755-01 standards [37]. The measurements were made with a Perkin Elmer 2400 CHN analyzer (PerkinElmer, Hongkong, China) and the fixed oxygen and oxygen content was calculated by the difference. The measurements were taken three times to test their repeatability.
2.2. Thermogravimetric Measurements
The thermal degradation profile for the PET fabric was determined using TGA (STA449 F3; NETZSCH, Selb, Germany). The measurements were conducted on 7–11 mg from each membrane batch in nitrogen (60 mL/min) from room temperature to 900 °C. The experiments were performed at various heating rates (5, 10, 15, 20, 25, and 30 °C/min) to study the effect of heating conditions on the degeneration profiles and abundance of the GC–MS compounds. These measurements in various heating conditions are needed in the kinetic molding of the pyrolysis membrane to obtain an accurate result (activation energy). Based on the measured TGA data, DTG data were obtained through the numerical derivation of TGA measurements via Proteus software (https://www.labcenter.com/); then, a DTG profile for each sample was plotted. Based on the measured TGA data and the fitted DTG profiles, the devolatilization index (Di) of volatile matters and the heat-resistance index (THRI) parameters were estimated for each batch using Equations (1) and (2) [38].
THRI = 0.49 × [T5 + 0.6 × (T30 − T5)]
2.3. Chemical Analysis of the Generated Vapor Pyrolysis Compounds
The functional groups of the generated vapor products from decomposition of PET fabric at all the listed heating rates were examined using FTIR coupled with TGA. The chemical compounds of these vapor products were identified and quantified using thermogravimetry–gas chromatography–mass spectrometry (Shimadzu GC-2010, Kyoto, Japan) in an Automation Autoinjector™ unit (ATS Automation, Cambridge, ON, Canada). The GC analysis was conducted in the range of 30–600 m/s within the following conditions: 50 Hz; TCD and injector temperature, 70 and 90 °C, pump and inject time 20 and 30 ms; and column setting, argon, 20 psi, 95 °C, and 110 s) [39].
2.4. Pyrolysis Kinetics and Thermodynamic Analysis of PET Membranes
Pyrolysis kinetics were employed to study the activation energy (Ea) needed to decompose each sample individually and its composite, thus determining the degree of complexity of all samples and their energy consumed during the decomposition. This energy was calculated for the whole pyrolysis processes using a Kissinger model (as listed in Equation (3)), and at each conversion rate (y) [40]. There are two common approaches to calculation that can be classified as linear and nonlinear isoconversional models. The linear approaches, including Friedman, Flynn–Wall–Ozawa (FWO), and Kissinger–Akahira–Sunose (KAS) methods, are characterized by simplicity and all their formulas are listed in Equations (2)–(5) [41]. Activation energy can be estimated using the curve fitting approach, which is highly recommended for single reactions, but not multi reactions like in the present case, which investigated composite waste with several subcomponents. In contrast, the linear model, including Vyazovkin and Cai formulas (Equations (2)–(5)), is characterized by its high accuracy and is based on iteration and optimization [42]. Finally, the plotted TGA-DTG profiles of each sample were simulated using the distributed activation energy model (DAEM) and independent parallel reaction kinetic model (IPR) using Equations (6) and (7) [43], followed by determining the deviations (dev.%) between the experimental and simulated profiles using Equation (9). The definitions of all the items used in the presented formulas are shown in Table 1. Finally, the thermodynamic behavior of PET films in terms of enthalpy (ΔH), Gibbs free energy (ΔG), and entropy (ΔS) were studied at 5 and 30 °C/min using Equations (12)–(14). In these formulas, KB, Tm, and h terms are defined as Boltzmann constant (1.3819 × 10⁻²³ J/K), maximum decomposition temperature based on DTG curves, and Planck’s constant (6.6269 × 1034 J s), respectively [44].
3. Results and Discussion
3.1. Elemental and Proximate Analysis
The elemental and proximate characteristics of the received PET feedstock are listed in Table 2. The elemental analysis showed that carbon (C) was the major element in the sample with content estimated at 62.32 wt.%. This high content of the C element acts as a source of carbon precursor and can be employed to accelerate the conversion rate during the treatment. A small amount of H element (4.2–5 wt.%) was noticed. Meanwhile, the sample did not contain nitrogen (N) and sulfur (S), which reduce the potential for generation of toxic NOx and SO2 emissions during industrial scale processing via pyrolysis technology [45]. The proximate analysis showed that PET fabric is very rich in volatile matter (80 wt.%) with a smaller amount (9%) of volatile matter compared to PET plastic waste (88 wt.%) [34]. A high content of fixed carbon (17.89 wt.%) was observed in the tested sample accompanied with a small content of ash (1.9 wt.%). This high content of volatile matter indicates that all samples were rich in hydrocarbons and fixed carbon and ash content, which can help in the conversion process and yield of the recovered chemical compounds [46].
3.2. Thermogravimetric Analysis
Figure 2 shows the TGA-DTG plots of the PET fabric corresponded to pyrolysis conditions at heating rates of 5, 10, 15, 20, 25, and 30 °C/min. The TGA plots (Figure 2A) showed that the PET substrate had a high thermal stability till 382 °C with almost no weight loss (<0.4 wt.%) in eliminating moisture content in the samples. After that, two thermal decomposition zones were observed till the end of the reaction. The first zone was finished at 490 °C with weight loss of 80 wt.%, while the second degradation zone finished at 770 °C with weight loss < 4 wt.% due to ash formulation. The last degradation region refers to char devolatilization and carbon black formulation. These results match those of the thermal decomposition of PET from waste soft drink bottles [47,48]. Meanwhile, DTG results (Figure 2B) showed that the PET sample decomposed as a single sharp peak, and the intensity of this DTG peak increased with the heating rate rising due to an increase in the generated heat flux that allowed more heat exchange between the surroundings of feedstock and their internal molecules [49]. The porous structure of the tested samples greatly helped to accelerate the exchange decomposition of all organic components involved in the reaction [26]. Finally, all the pyrolysis characteristics of each sample, including melting temperature and glass transition temperature, are illustrated in Table 3. It was noted that the calculated Di value increased when raising the heating rate, which accelerated the volatilization process and inhibited the condensation reaction combined with a greater release of volatiles in the form of an endothermic process via an exothermic process for solid residue formulation [37]. Similarly, the calculated THRI values were increased once heating conditions increased from 201 to 2016 °C due to the higher heating flux and decreasing PET crystallinity [50,51].
3.3. Mechanism of PET Membrane Pyrolysis
As illustrated in the above section, the commercial PET fabric decomposed in several sequential stages. This section explains the pyrolysis mechanism of these stages in a simple way based on TGA results that achieved the highest abundance of volatiles (30 °C/min based on GC–MS results). A schematic diagram of the proposed pyrolysis mechanism for PET is shown in Figure 3. As shown, PET offers a high degradation resistance (up to 252 °C) without any weight loss, followed by a very small weight loss (<0.4 wt.%) due to the breakdown of the PET chains into smaller molecules that can easily melt under the applied temperature up to 410 °C [47]. After that, the melt began to decompose quickly (with a decrease of 80 wt.%) into released gaseous hydrocarbons and light hydrocarbons compounds in the form of pyrolysis vapors [48], followed by ash formulation and char devolatilization smoothly and slowly in the following regions till the end of the reaction [49].
As shown, PET fibers had a lower thermal stability compared to virgin PET due to its lower crystallinity and their bigger free space, which allowed the generated heat flux to penetrate this free space and break the Van der Waals bonds of the internal molecules of PET chains combined with several consecutive reactions (random chain scission, side group, and recombination), thus developing smaller molecules rich in gaseous hydrocarbon compounds [51,52]. This structure also led to changes in their chain size and this helped in the digestibility process and converting PET molecules into hydrocarbon and benzoic acid compound [48]. Accordingly, PET texture is a very important factor in improving not only its properties and performance but also its thermal conversion performance and its recyclability, and can help in speeding decomposition and releasing more gaseous hydrocarbons.
3.4. Chemical Analysis of the Synthesized Volatile Products Using TG-FTIR
Figure 4 shows TG-FTIR spectra of the generated vapors from the thermal decomposition of PET fabric in the main degradation region at all the specified heating rates (5–30 °C/min). As shown, several function groups were obtained at 1078–1356 cm−1 (aromatic C-H bonds; aromatic presence and coordination of benzoyl [53]), 1768 cm−1 (carbonylic C=O; showing the presence of aldehydes, ketones, and acids formation), 2265–2393 cm−1 (typical place for CO2), 2688–2888 cm−1 (aromatic C-H bonds (from benzene molecule in PET)), 3581 cm−1 (sharp shape of this peak represents acetylene CH≡CR group; the shape is needle-like, very sharp), and 3710 cm−1 (hydroxyl OH group; shape of the peak is wide, broad, round) [26]. It was noted that, in all samples, the intensity of these peaks increased gradually when increasing the heating rate from 5 °C/min till 30 °C/min due to increasing the heating flux and cracking rate [49]. Higher heating rates enhanced the decarboxylation reaction and secondary cracking of carbonyl (-C=O-) and carboxyl (-COOH) groups, which contribute in the formation of greater CO2 and CO [54].
3.5. Chemical Analysis of the Synthesized Chemical Compounds Using GC–MS
Figure 5 shows GC–MS spectra of the produced volatile species at all heating rates, while the volatile compounds formulated from the pyrolyzed PET samples at the listed heating rates and their intensity are illustrated in Table 4. The GC–MS spectra showed several GC compounds and benzoic acid and acetaldehyde were the major compounds with abundance (peak area) in the ranges of 60.6–74.9% and 6.07–9.89%, respectively. The high intensity of benzoic acid compound was achieved at the lowest heating rate (5 °C/min). This large abundance of benzoic acid in the produced vapor indicates that the PET fabric was converted into high-added value chemical products, which can be used in various applications such as the production of environmental radiocarbon monitoring, phenol, ointments, food, chemicals, pharmaceuticals, etc. [55,56]. Compared to the results of the catalytic pyrolysis of PET waste, which showed that 32 wt.% of the benzoic acid compound could be recovered at a temperature of 450–600 °C [57], the pyrolysis of PET fabric is very promising with a 134% increase in the benzoic acid abundance.
3.6. Kinetic and Thermodynamic Analysis of PET Fabric Pyrolysis
3.6.1. Activation Energy for the Entire Thermochemical Process
The Kissinger model was used to calculate the Ea of the complete downstream pyrolysis process of PET fabric. The fitting Kissinger relationship is shown in Figure 6A with a slope curve represented by −Ea/(R = 8.31 JK−1 mol−1). Based on the calculation and fitting curves, the entire Ea was estimated at 169 kJ/mol (PET). This value in agreement with the Ea (165.6 kJ/mol) of pyrolysis of PET water bottles, which was calculated based on the ASTM-E698 method [58]. This means the PET geometry does not significantly affect the entire Ea.
3.6.2. Calculation of Ea for Each Conversion Rate Using Linear Kinetic Methods
The complexity of pyrolysis of PET fabric in each conversion region in the conversion range of 0.1–0.9 was calculated via linear kinetic models (KAS, FWO, and Friedman). The complexity in terms of Ea was calculated in each model by plotting the curves presented in Figure 6B–D, then obtaining their slopes, which are expressed −Ea/R (KAS and Friedman), −1.0516 Ea/R (FWO). The curves showed nine straight lines representing the Ea at each conversion region; the fitted curves showed random straight lines (at lower and higher conversion regions) due to the occurrence of several reactions at these regions [38], while parallel straight lines were observed in the range of 0.2–0.8. However, in the Friedman model, curves with random distribution were the prevailing lines due to the model’s high sensitivity to noisy data [59,60]. Consequently, in the fitted curves, Ea was calculated and its values as a function of conversion rate (y) are shown in Figure 7. As shown, the Ea value increased as y rose due to involvement of several elements in the thermochemical reaction, thus increasing the reaction’s complexity [43]. Thus, the average Ea was estimated at 193.4 kJ mol−1 (KAS), 243.2 kJ mol−1 (FWO), and 255.7 kJ mol−1 (Friedman), while the coefficient of determination (R2) values of each Ea are illustrated in Table 5 with estimated R2 values for KAS (0.97), FWO (0.99), and Friedman (0.98). As shown, the KAS and FWO models had higher predictivity compared to Friedman, which means both KAS and FWO linear kinetic methods can be used to investigate the reaction mechanism of PET fabric. These results match the results obtained by Osman et al. (2020) [58].
3.6.3. Calculation of Ea for Each Conversion Rate Using Nonlinear Kinetic Methods
The Ea at each conversion zone was recalculated again using the Vyazovkin and Cai numerical integration algorithm nonlinear kinetic methods to obtain accurate Ea values and avoid the noisy results obtained from linear kinetic methods [59,60]. The algorithms were built and solved using Matlab software (https://www.mathworks.com/products/matlab.html) with a 200 kJ/mol as an initial boundary condition followed by running the algorithms several times until the Ea value became constant, thus finding the optimal value of Ea. This goal was achieved with both algorithms after four tries, as illustrated in Table 6. As shown, the Ea became constant after the third try in both algorithms with an estimated average Ea of 161 kJ/mol (Vyazovkin) and 160 kJ/mol (Cai). These values were employed in plotting Vyazovkin and Cai curves (Figure 8), and Y-axes formulas are described in Equations (15) and (16), while R2 was estimated as 0.91 for both models, as illustrated in Table 5. As shown, Vyazovkin and Cai algorithms gave similar results and the KAS model produced the values nearest those of other linear model-free models. Their calculated Ea values were quite similar to the Ea values calculated according to the ASTM-E698 method [58]. Therefore, nonlinear algorithms are the most suitable approaches to study the thermal decomposition kinetic properties of PET fabric with high accuracy.
3.6.4. Analysis of the Fitted TGA-DTG Curves Using DAEM and IPR
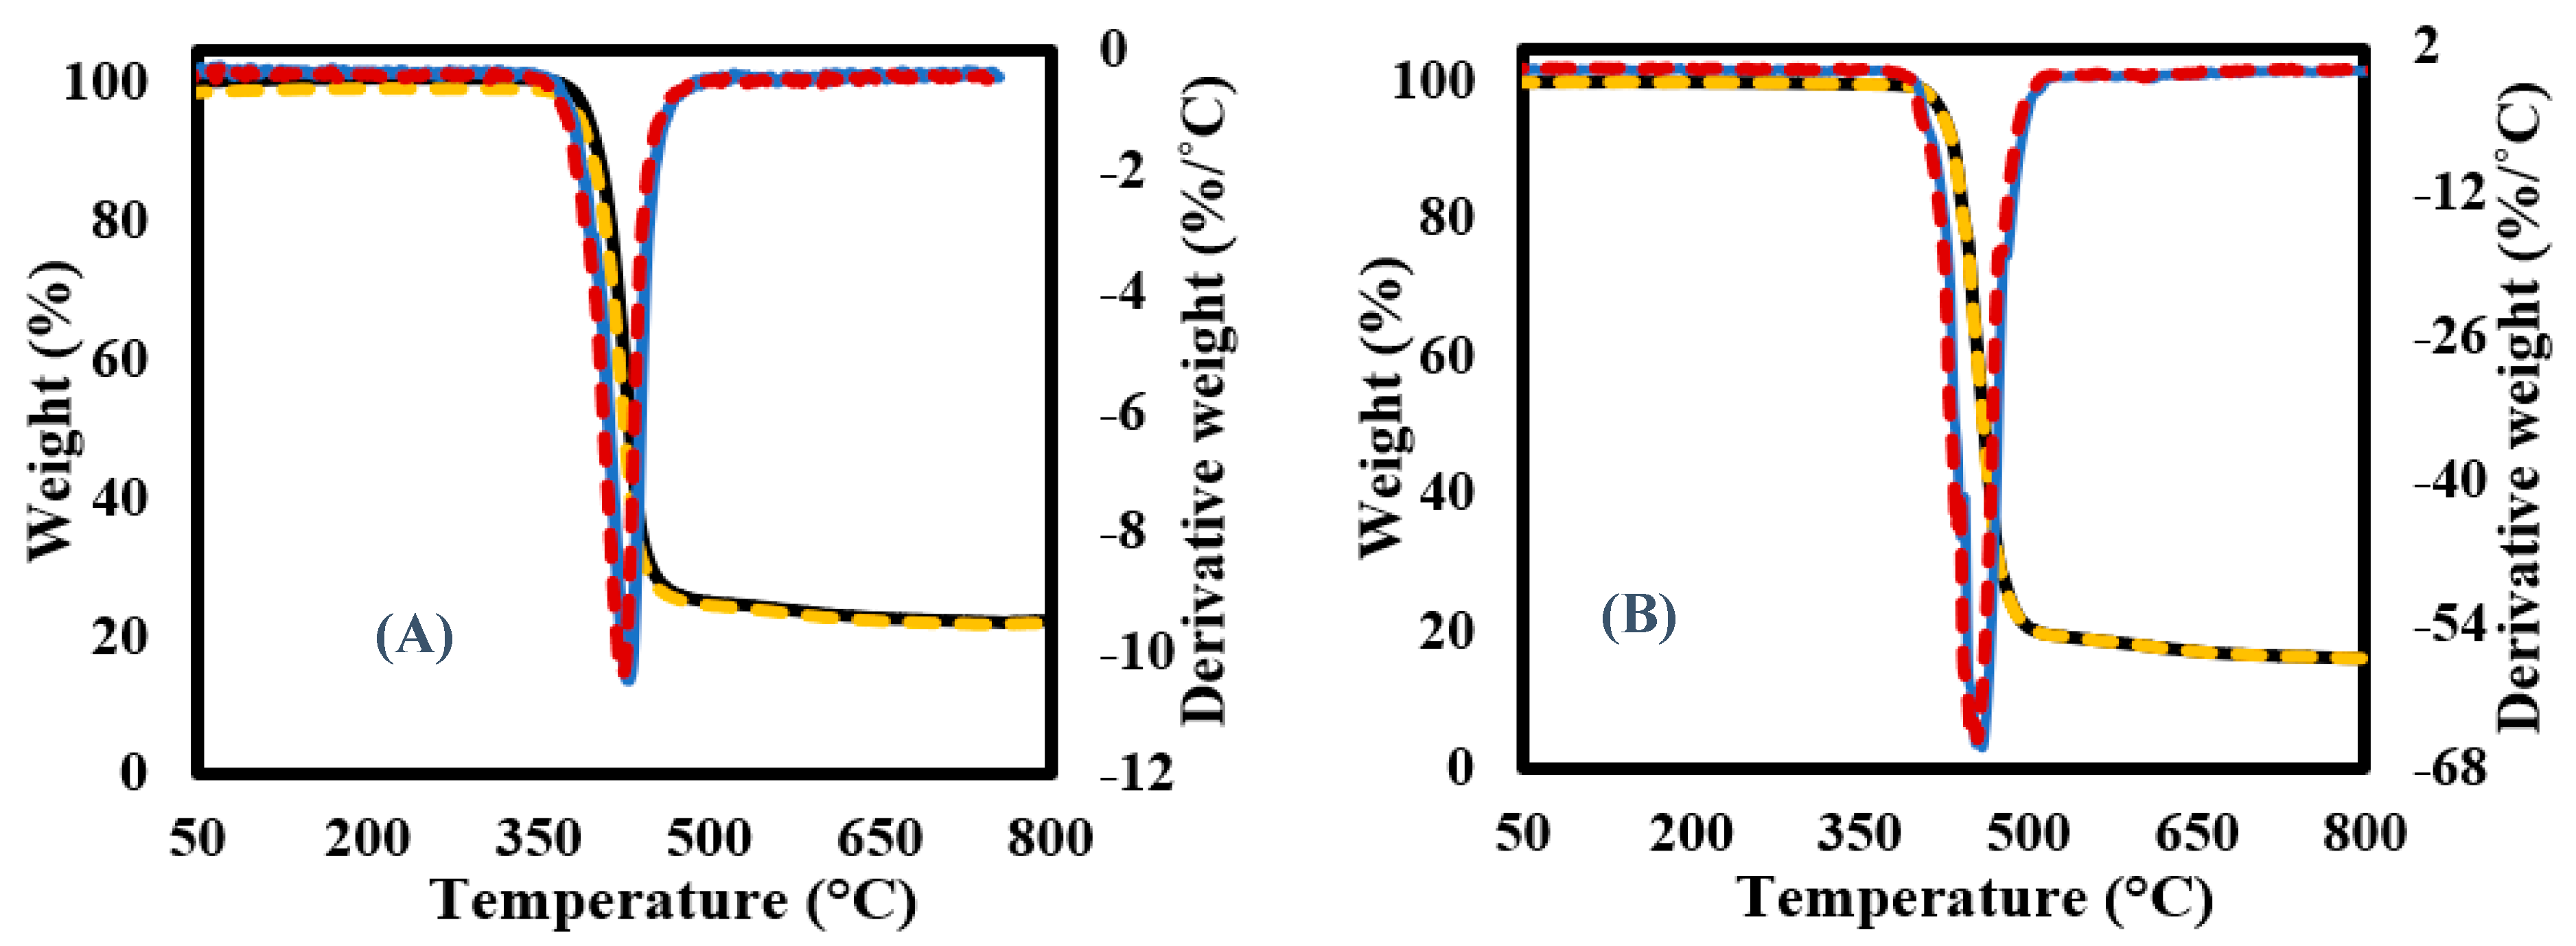
The experimental data received from TGA-DTG measurements was simulated using DAEM and IPR formulas. The experimental (solid lines) and simulated (dotted lines) TGA-DTG curves at the lowest (5 °C/min) and highest (30 °C/min) heating conditions is shown in Figure 9. As shown, both models succeeded in predicting the thermal decomposition curves of all samples with a close match between the experimental and simulated TGA-DTG curves (a deviation of less than 0.5 using Equation (11)). Finally, the optimum parameters (activation energy “E1 and E2” and pre-exponential “A1 and A2”) used in fitting of these curves are shown in Table 7.
3.6.5. Thermodynamic Analysis
The values of thermodynamic parameters (ΔH, ΔG, and ΔS) calculated based on KAS, FWO, and Friedman results at 5 °C/min and 30 °C/min are shown in Table 8 and Table 9. The calculations showed that these parameters changed with conversion rate changes due to the complex reaction of PET. The parameters were estimated in the ranges of 188–250 kJ/mol (ΔH), 154–232 kJ/mol (ΔG), and 267–356 J/mol K (ΔS) at 5 °C/min; in contrast, these parameters were estimated in the ranges of 188–250 kJ/mol (ΔH), 153–170 kJ/mol (ΔG), and 256–340 J/mol K (ΔS) at 30 °C/min. As shown, the heating rate had a significant effect on the calculated parameters; also, the calculated ΔH parameters had positive values indicating an endothermic nature [61].
4. Conclusions
The pyrolysis behavior of polyethylene terephthalate (PET) porous fabric was studied using a thermogravimetric analyzer (TGA), and the formulated vapor pyrolysis products were characterized by TG-FTIR and GC–MS. In addition, the pyrolysis kinetics were studied using linear and nonlinear fitting methods to determine the reactions’ complexity and their activation energies. The TGA results showed that PET fabric decomposed into two stages with a total mass loss of 84% and the main decomposition region was placed in the range of 408–500 °C. The activation energy obtained from linear kinetic models was located in the ranges of 193.4–255.65 kJ/mol with R2 = 0.97–0.99 vs. 160–161 kJ/mol with R2 = 0.91 in case of the nonlinear kinetics. The carbonyl group was the major functional group in the FTIR spectra of the released gases, and the volatile species were rich in benzoic acid compound, comprising 75% of the species, and synthesized at 5 °C/min. The pyrolysis mechanism of PET was also studied to understand the complexity of the reaction that occurred during the thermal degradation process. The results revealed that the radical intermediates play a pivotal role in spreading the pyrolysis chains and in the formed pyrolysis compounds as well. Based on these results, PET waste can be a new source of benzoic acid using the pyrolysis treatment as an eco-friendly emerging technology.
Author Contributions
Methodology, S.Y., A.M. and M.A.A.; Software, J.E. and M.A.A.; Formal analysis, N.S.; Investigation, J.E., N.S. and A.M.; Data curation, M.A.A.; Writing—original draft, S.Y. and A.M.; Writing—review & editing, S.Y. and A.M.; Supervision, S.Y. All authors have read and agreed to the published version of the manuscript.
Funding
This project has received funding from the Research Council of Lithuania (LMTLT), agreement No. S-MIP-23-118.
Conflicts of Interest
The authors declare no conflict of interest.
References
- Wang, L.; Kahrizi, M.; Lu, P.; Wei, Y.; Yang, H.; Yu, Y.; Wang, L.; Li, Y.; Zhao, S. Enhancing water permeability and antifouling performance of thin–film composite membrane by tailoring the support layer. Desalination 2021, 516, 115193. [Google Scholar] [CrossRef]
- Yousef, S.; Subadra, S.P.; Tuckute, S.; Baltušnikas, A.; Lukošiūtė, S.-I.; Arafa, E.L.; Mohamed, A. Finite element analysis of fibreglass and carbon fabrics reinforced polyethersulfone membranes. Mater. Today Commun. 2022, 31, 103682. [Google Scholar] [CrossRef]
- Wang, S.; Li, T.; Chen, C.; Chen, S.; Liu, B.; Crittenden, J. Non-woven PET fabric reinforced and enhanced the performance of ultrafiltration membranes composed of PVDF blended with PVDF-g-PEGMA for industrial applications. Appl. Surf. Sci. 2018, 435, 1072–1079. [Google Scholar] [CrossRef]
- Ursino, C.; Ounifi, I.; Di Nicolò, E.; Cheng, X.; Shao, L.; Zhang, Y.; Drioli, E.; Criscuoli, A.; Figoli, A. Development of non-woven fabric-based ECTFE membranes for direct contact membrane distillation application. Desalination 2021, 500, 114879. [Google Scholar] [CrossRef]
- El-Badawy, T.; Othman, M.H.D.; Adam, M.R.; Ismail, A.; Rahman, M.A.; Jaafar, J.; Usman, J.; Mamah, S.C.; Raji, Y.O. The influence of pretreatment step on hollow braided PET fabric as a potential membrane substrate. Mater. Today Proc. 2020, 46, 1990–1997. [Google Scholar] [CrossRef]
- Wu, H.; Zhao, H.; Lin, Y.; Liu, X.; Yao, H.; Yu, L.; Wang, H.; Wang, X. Fabrication of polysulfone membrane with sponge-like structure by using different non-woven fabrics. Sep. Purif. Technol. 2022, 297, 121553. [Google Scholar] [CrossRef]
- Xia, L.; Zhang, Q.; Zhuang, X.; Zhang, S.; Duan, C.; Wang, X.; Cheng, B. Hot-Pressed Wet-Laid Polyethylene Terephthalate Nonwoven as Support for Separation Membranes. Polymers 2019, 11, 1547. [Google Scholar] [CrossRef]
- Kamakshi; Kumar, R.; Saraswat, V.K.; Kumar, M.; Awasthi, K.; Stamm, M. Hydrogen gas separation with controlled selectivity via efficient and cost effective block copolymer coated PET membranes. Int. J. Hydrogen Energy 2017, 42, 19977–19983. [Google Scholar] [CrossRef]
- Xiong, Q.; Chen, H.; Tian, Q.; Yue, X.; Qiu, F.; Zhang, T.; Wang, A.-B. Waste PET derived Janus fibrous membrane for efficient oil/water emulsions separation. J. Environ. Chem. Eng. 2022, 10, 108459. [Google Scholar] [CrossRef]
- Yi, K.; Huang, J.; Li, X.; Li, S.; Pang, H.; Liu, Z.; Zhang, W.; Liu, S.; Liu, C.; Shu, W. Long-term impacts of polyethylene terephthalate (PET) microplastics in membrane bioreactor. J. Environ. Manag. 2022, 323, 116234. [Google Scholar] [CrossRef]
- Jin, X.; Wang, H.; Jin, X.; Wang, H.; Chen, L.; Wang, W.; Lin, T.; Zhu, Z. Preparation of keratin/PET nanofiber membrane and its high adsorption performance of Cr(VI). Sci. Total. Environ. 2020, 710, 135546. [Google Scholar] [CrossRef] [PubMed]
- Petit, C.; Delouya, G.; Taussky, D.; Barkati, M.; Lambert, C.; Beauchemin, M.-C.; Clavel, S.; Mok, G.; Paré, A.-S.G.; Nguyen, T.-V.; et al. PSMA-PET/CT-Guided Intensification of Radiation Therapy for Prostate Cancer (PSMAgRT): Findings of Detection Rate, Effect on Cancer Management, and Early Toxicity from a Phase 2 Randomized Controlled Trial. Int. J. Radiat. Oncol. 2023, 116, 779–787. [Google Scholar] [CrossRef] [PubMed]
- Qureshi, M.S.; Oasmaa, A.; Pihkola, H.; Deviatkin, I.; Tenhunen, A.; Mannila, J.; Minkkinen, H.; Pohjakallio, M.; Laine-Ylijoki, J. Pyrolysis of plastic waste: Opportunities and challenges. J. Anal. Appl. Pyrolysis 2020, 152, 104804. [Google Scholar] [CrossRef]
- Huysveld, S.; Ragaert, K.; Demets, R.; Nhu, T.; Civancik-Uslu, D.; Kusenberg, M.; Van Geem, K.; De Meester, S.; Dewulf, J. Technical and market substitutability of recycled materials: Calculating the environmental benefits of mechanical and chemical recycling of plastic packaging waste. Waste Manag. 2022, 152, 69–79. [Google Scholar] [CrossRef]
- Ragaert, K.; Delva, L.; Van Geem, K. Mechanical and chemical recycling of solid plastic waste. Waste Manag. 2017, 69, 24–58. [Google Scholar] [CrossRef] [PubMed]
- Chawla, S.; Varghese, B.S.; Chithra, A.; Hussain, C.G.; Keçili, R.; Hussain, C.M. Environmental impacts of post-consumer plastic wastes: Treatment technologies towards eco-sustainability and circular economy. Chemosphere 2022, 308, 135867. [Google Scholar] [CrossRef]
- Yousef, S.; Eimontas, J.; Striūgas, N.; Abdelnaby, M.A. Effect of aluminum leaching pretreatment on catalytic pyrolysis of metallised food packaging plastics and its linear and nonlinear kinetic behaviour. Sci. Total. Environ. 2022, 844, 157150. [Google Scholar] [CrossRef]
- Lin, S.; Ali, M.U.; Zheng, C.; Cai, Z.; Wong, M.H. Toxic chemicals from uncontrolled e-waste recycling: Exposure, body burden, health impact. J. Hazard. Mater. 2022, 426, 127792. [Google Scholar] [CrossRef]
- Kim, N.-K.; Lee, S.-H.; Park, H.-D. Current biotechnologies on depolymerization of polyethylene terephthalate (PET) and repolymerization of reclaimed monomers from PET for bio-upcycling: A critical review. Bioresour. Technol. 2022, 363, 127931. [Google Scholar] [CrossRef]
- Yousef, S.; Eimontas, J.; Zakarauskas, K.; Striūgas, N. A new sustainable strategy for oil, CH4 and aluminum recovery from metallised food packaging plastics waste using catalytic pyrolysis over ZSM-5 zeolite catalyst. Thermochim. Acta 2022, 713, 179223. [Google Scholar] [CrossRef]
- Yousef, S.; Eimontas, J.; Zakarauskas, K.; Jančauskas, A.; Striūgas, N. An eco-friendly strategy for recovery of H2-CH4-rich syngas, benzene-rich tar and carbon nanoparticles from surgical mask waste using an updraft gasifier system. Energy Sources Part A Recover. Util. Environ. Eff. 2023, 45, 5063–5080. [Google Scholar] [CrossRef]
- Guan, M.; Zhao, S.; Shi, J.; Jin, H.; Wei, W. Experimental study on the gasification characteristics of polyethylene terephthalate (PET) microplastics in supercritical H2O/CO2 environment. J. Clean. Prod. 2023, 385, 135661. [Google Scholar] [CrossRef]
- Choi, M.-J.; Jeong, Y.-S.; Kim, J.-S. Air gasification of polyethylene terephthalate using a two-stage gasifier with active carbon for the production of H2 and CO. Energy 2021, 223, 120122. [Google Scholar] [CrossRef]
- Atashi, F.; Gholizadeh, M.; Ataei, F. Pyrolysis analysis of polyethylene terephthalate: Effects of carrier gases (N2, He, and Ar) and zeolite catalyst (A4) on yield. J. Chem. Technol. Biotechnol. 2022, 97, 3395–3405. [Google Scholar] [CrossRef]
- Yousef, S.; Eimontas, J.; Striūgas, N.; Mohamed, A.; Abdelnaby, M.A. Pyrolysis kinetic behavior and TG-FTIR-GC–MS analysis of end-life ultrafiltration polymer nanocomposite membranes. Chem. Eng. J. 2022, 428, 131181. [Google Scholar] [CrossRef]
- Dhahak, A.; Hild, G.; Rouaud, M.; Mauviel, G.; Burkle-Vitzthum, V. Slow pyrolysis of polyethylene terephthalate: Online monitoring of gas production and quantitative analysis of waxy products. J. Anal. Appl. Pyrolysis 2019, 142, 104664. [Google Scholar] [CrossRef]
- Straka, P.; Bičáková, O.; Šupová, M. Slow pyrolysis of waste polyethylene terephthalate yielding paraldehyde, ethylene glycol, benzoic acid and clean fuel. Polym. Degrad. Stab. 2022, 198, 109900. [Google Scholar] [CrossRef]
- Liu, Y.; Fu, W.; Liu, T.; Zhang, Y.; Li, B. Microwave pyrolysis of polyethylene terephthalate (PET) plastic bottle sheets for energy recovery. J. Anal. Appl. Pyrolysis 2022, 161, 105414. [Google Scholar] [CrossRef]
- Niksiar, A.; Faramarzi, A.H.; Sohrabi, M. Kinetic study of polyethylene terephthalate (PET) pyrolysis in a spouted bed reactor. J. Anal. Appl. Pyrolysis 2015, 113, 419–425. [Google Scholar] [CrossRef]
- Kaban, A.P.S.; Rahmat, N.G.; Fatriansyah, J.F. Kinetics of catalytic pyrolysis of polyethylene terephthalate (PET) plastic polymer with zeolite. AIP Conf. Proc. 2020, 2262, 050007. [Google Scholar] [CrossRef]
- Al-Salem, S.M.; Lettieri, P. Kinetics of polyethylene terephthalate (PET) and polystyrene (PS) dynamic pyrolysis. Int. J. Chem. Mol. Eng. 2010, 4, 402–410. [Google Scholar]
- Brems, A.; Baeyens, J.; Beerlandt, J.; Dewil, R. Thermogravimetric pyrolysis of waste polyethylene-terephthalate and polystyrene: A critical assessment of kinetics modelling. Resour. Conserv. Recycl. 2011, 55, 772–781. [Google Scholar] [CrossRef]
- Dubdub, I.; Alhulaybi, Z. Catalytic Pyrolysis of PET Polymer Using Nonisothermal Thermogravimetric Analysis Data: Kinetics and Artificial Neural Networks Studies. Polymers 2022, 15, 70. [Google Scholar] [CrossRef]
- Ramamoorthy, M.; Pisal, A.A.; Rengasamy, R.S.; Rao, A.V. In-situ synthesis of silica aerogel in polyethylene terephthalate fibre nonwovens and their composite properties on acoustical absorption behavior. J. Porous Mater. 2018, 25, 179–187. [Google Scholar] [CrossRef]
- Yousef, S.; Eimontas, J.; Striūgas, N.; Praspaliauskas, M.; Abdelnaby, M.A. Pyrolysis Kinetic Behaviour of Glass Fibre-Reinforced Epoxy Resin Composites Using Linear and Nonlinear Isoconversional Methods. Polymers 2021, 13, 1543. [Google Scholar] [CrossRef]
- Yousef, S.; Tonkonogovas, A.; Mohamed, A. Performance of sponge and finger-like structures of PSF/PET membranes in hydrogen separation industry. J. Ind. Eng. Chem. 2023, 125, 232–241. [Google Scholar] [CrossRef]
- Yousef, S.; Eimontas, J.; Zakarauskas, K.; Striūgas, N. Recovery of styrene-rich oil and glass fibres from fibres-reinforced unsaturated polyester resin end-of-life wind turbine blades using pyrolysis technology. J. Anal. Appl. Pyrolysis 2023, 173, 106100. [Google Scholar] [CrossRef]
- Yousef, S.; Kiminaitė, I.; Eimontas, J.; Striūgas, N.; Abdelnaby, M.A. Recovery of phenol and acetic acid from glass fibre reinforced thermoplastic resin using catalytic pyrolysis process on ZSM-5 zeolite catalyst and its kinetic behaviour. Thermochim. Acta 2022, 715, 179293. [Google Scholar] [CrossRef]
- Yousef, S.; Kiminaitė, I.; Eimontas, J.; Striūgas, N.; Abdelnaby, M.A. Catalytic pyrolysis kinetic behaviour of glass fibre-reinforced epoxy resin composites over ZSM-5 zeolite catalyst. Fuel 2022, 315, 123235. [Google Scholar] [CrossRef]
- Yousef, S.; Eimontas, J.; Striūgas, N.; Praspaliauskas, M.; Abdelnaby, M.A. Pyrolysis kinetic behaviour, TG-FTIR, and GC/MS analysis of cigarette butts and their components. Biomass Convers. Biorefinery 2022. [Google Scholar] [CrossRef]
- Yousef, S.; Eimontas, J.; Striūgas, N.; Abdelnaby, M.A. Pyrolysis kinetic behaviour and TG-FTIR-GC–MS analysis of Coronavirus Face Masks. J. Anal. Appl. Pyrolysis 2021, 156, 105118. [Google Scholar] [CrossRef] [PubMed]
- Yousef, S.; Eimontas, J.; Striūgas, N.; Abdelnaby, M.A. Thermal decomposition of CNTs and graphene-reinforced glass fibers/epoxy and their kinetics. Biomass Convers. Biorefinery 2022. [Google Scholar] [CrossRef]
- Yousef, S.; Eimontas, J.; Striūgas, N.; Abdelnaby, M.A. Influence of carbon black filler on pyrolysis kinetic behaviour and TG-FTIR-GC–MS analysis of glass fibre reinforced polymer composites. Energy 2021, 233, 121167. [Google Scholar] [CrossRef]
- Yousef, S.; Eimontas, J.; Striūgas, N.; Abdelnaby, M.A. Pyrolysis kinetic behaviour and thermodynamic analysis of waste wind turbine blades (carbon fibres/unsaturated polyester resin). Energy Sources Part A Recover. Util. Environ. Eff. 2023, 45, 10505–10522. [Google Scholar] [CrossRef]
- Duan, Y.; Duan, L.; Wang, J.; Anthony, E.J. Observation of simultaneously low CO, NOx and SO2 emission during oxy-coal combustion in a pressurized fluidized bed. Fuel 2019, 242, 374–381. [Google Scholar] [CrossRef]
- Huang, X.; Yin, H.; Zhang, H.; Mei, N.; Mu, L. Pyrolysis characteristics, gas products, volatiles, and thermo–kinetics of industrial lignin via TG/DTG–FTIR/MS and in–situ Py–PI–TOF/MS. Energy 2022, 259, 125062. [Google Scholar] [CrossRef]
- Saha, B.; Ghoshal, A. Thermal degradation kinetics of poly(ethylene terephthalate) from waste soft drinks bottles. Chem. Eng. J. 2005, 111, 39–43. [Google Scholar] [CrossRef]
- Martín-Gullón, I.; Esperanza, M.; Font, R. Kinetic model for the pyrolysis and combustion of poly-(ethylene terephthalate) (PET). J. Anal. Appl. Pyrolysis 2001, 58–59, 635–650. [Google Scholar] [CrossRef]
- Alongi, J.; Camino, G.; Malucelli, G. Heating rate effect on char yield from cotton, poly(ethylene terephthalate) and blend fabrics. Carbohydr. Polym. 2013, 92, 1327–1334. [Google Scholar] [CrossRef]
- Huang, J.; Meng, H.; Luo, X.; Mu, X.; Xu, W.; Jin, L.; Lai, B. Insights into the thermal degradation mechanisms of polyethylene terephthalate dimer using DFT method. Chemosphere 2022, 291, 133112. [Google Scholar] [CrossRef]
- Nasution, F.; Husin, H.; Mahidin; Abnisa, F.; Yani, F.T.; Maulinda, L.; Ahmadi. Conversion of pyrolysis vapors derived from non-biodegradable waste plastics (PET) into valuable fuels using nickel-impregnated HZSM5-70 catalysts. Energy Convers. Manag. 2022, 273, 116440. [Google Scholar] [CrossRef]
- Feng, B.; Zhao, C.; Chen, B.; Zhuo, W.; Liu, Y.; Wang, L.; He, L.; Tang, F. Application of synthetic benzoic acid technology in environmental radiocarbon monitoring. J. Environ. Radioact. 2020, 216, 106188. [Google Scholar] [CrossRef] [PubMed]
- Hernández-Fuentes, C.; Ruiz-Guerrero, R.; Morales-Ramírez, A.d.J.; Molina-Maldonado, P.; Medina-Velazquez, D.Y. New Mononuclear Complex of Europium(III) and Benzoic Acid: From Synthesis and Crystal Structure Solution to Luminescence Emission. Crystals 2020, 10, 674. [Google Scholar] [CrossRef]
- Volli, V.; Varma, R.; Pradhan, D.; Panda, A.K.; Singh, R.K.; Shu, C.-M. Thermal degradation behaviour, kinetics, and thermodynamics of Bombax Malabarica seeds through TG-FTIR and Py-GC/MS analysis. Sustain. Energy Technol. Assess. 2023, 57, 103150. [Google Scholar] [CrossRef]
- Jia, W.; Wang, X.; Shi, L. Endogenous benzoic acid interferes with the signatures of amino acids and thiol compounds through perturbing N-methyltransferase, glutamate-cysteine ligase, and glutathione S-transferase activity in dairy products. Food Res. Int. 2022, 161, 111857. [Google Scholar] [CrossRef]
- Park, S.-Y.; Yoo, M.-Y.; Paik, H.-D.; Lim, S.-D. Production of benzoic acid as a natural compound in fermented skim milk using commercial cheese starter. J. Dairy Sci. 2017, 100, 4269–4275. [Google Scholar] [CrossRef]
- Diaz-Silvarrey, L.S.; McMahon, A.; Phan, A.N. Benzoic acid recovery via waste poly(ethylene terephthalate) (PET) catalytic pyrolysis using sulphated zirconia catalyst. J. Anal. Appl. Pyrolysis 2018, 134, 621–631. [Google Scholar] [CrossRef]
- Osman, A.I.; Farrell, C.; Al-Muhtaseb, A.H.; Al-Fatesh, A.S.; Harrison, J.; Rooney, D.W. Pyrolysis kinetic modelling of abundant plastic waste (PET) and in-situ emission monitoring. Environ. Sci. Eur. 2020, 32, 112. [Google Scholar] [CrossRef]
- Vyazovkin, S. Modern Isoconversional Kinetics: From Misconceptions to Advances. In Handbook of Thermal Analysis and Calorimetry; Elsevier: Amsterdam, The Netherlands, 2018. [Google Scholar] [CrossRef]
- Cai, J.; Chen, S. A new iterative linear integral isoconversional method for the determination of the activation energy varying with the conversion degree. J. Comput. Chem. 2009, 30, 1986–1991. [Google Scholar] [CrossRef]
- Gajera, B.; Tyagi, U.; Sarma, A.K.; Jha, M.K. Pyrolysis of cattle manure: Kinetics and thermodynamic analysis using TGA and artificial neural network. Biomass Convers. Biorefinery 2023. [Google Scholar] [CrossRef]
Figure 1.
Surface morphology of PET fabric [36].
Figure 1.
Surface morphology of PET fabric [36].
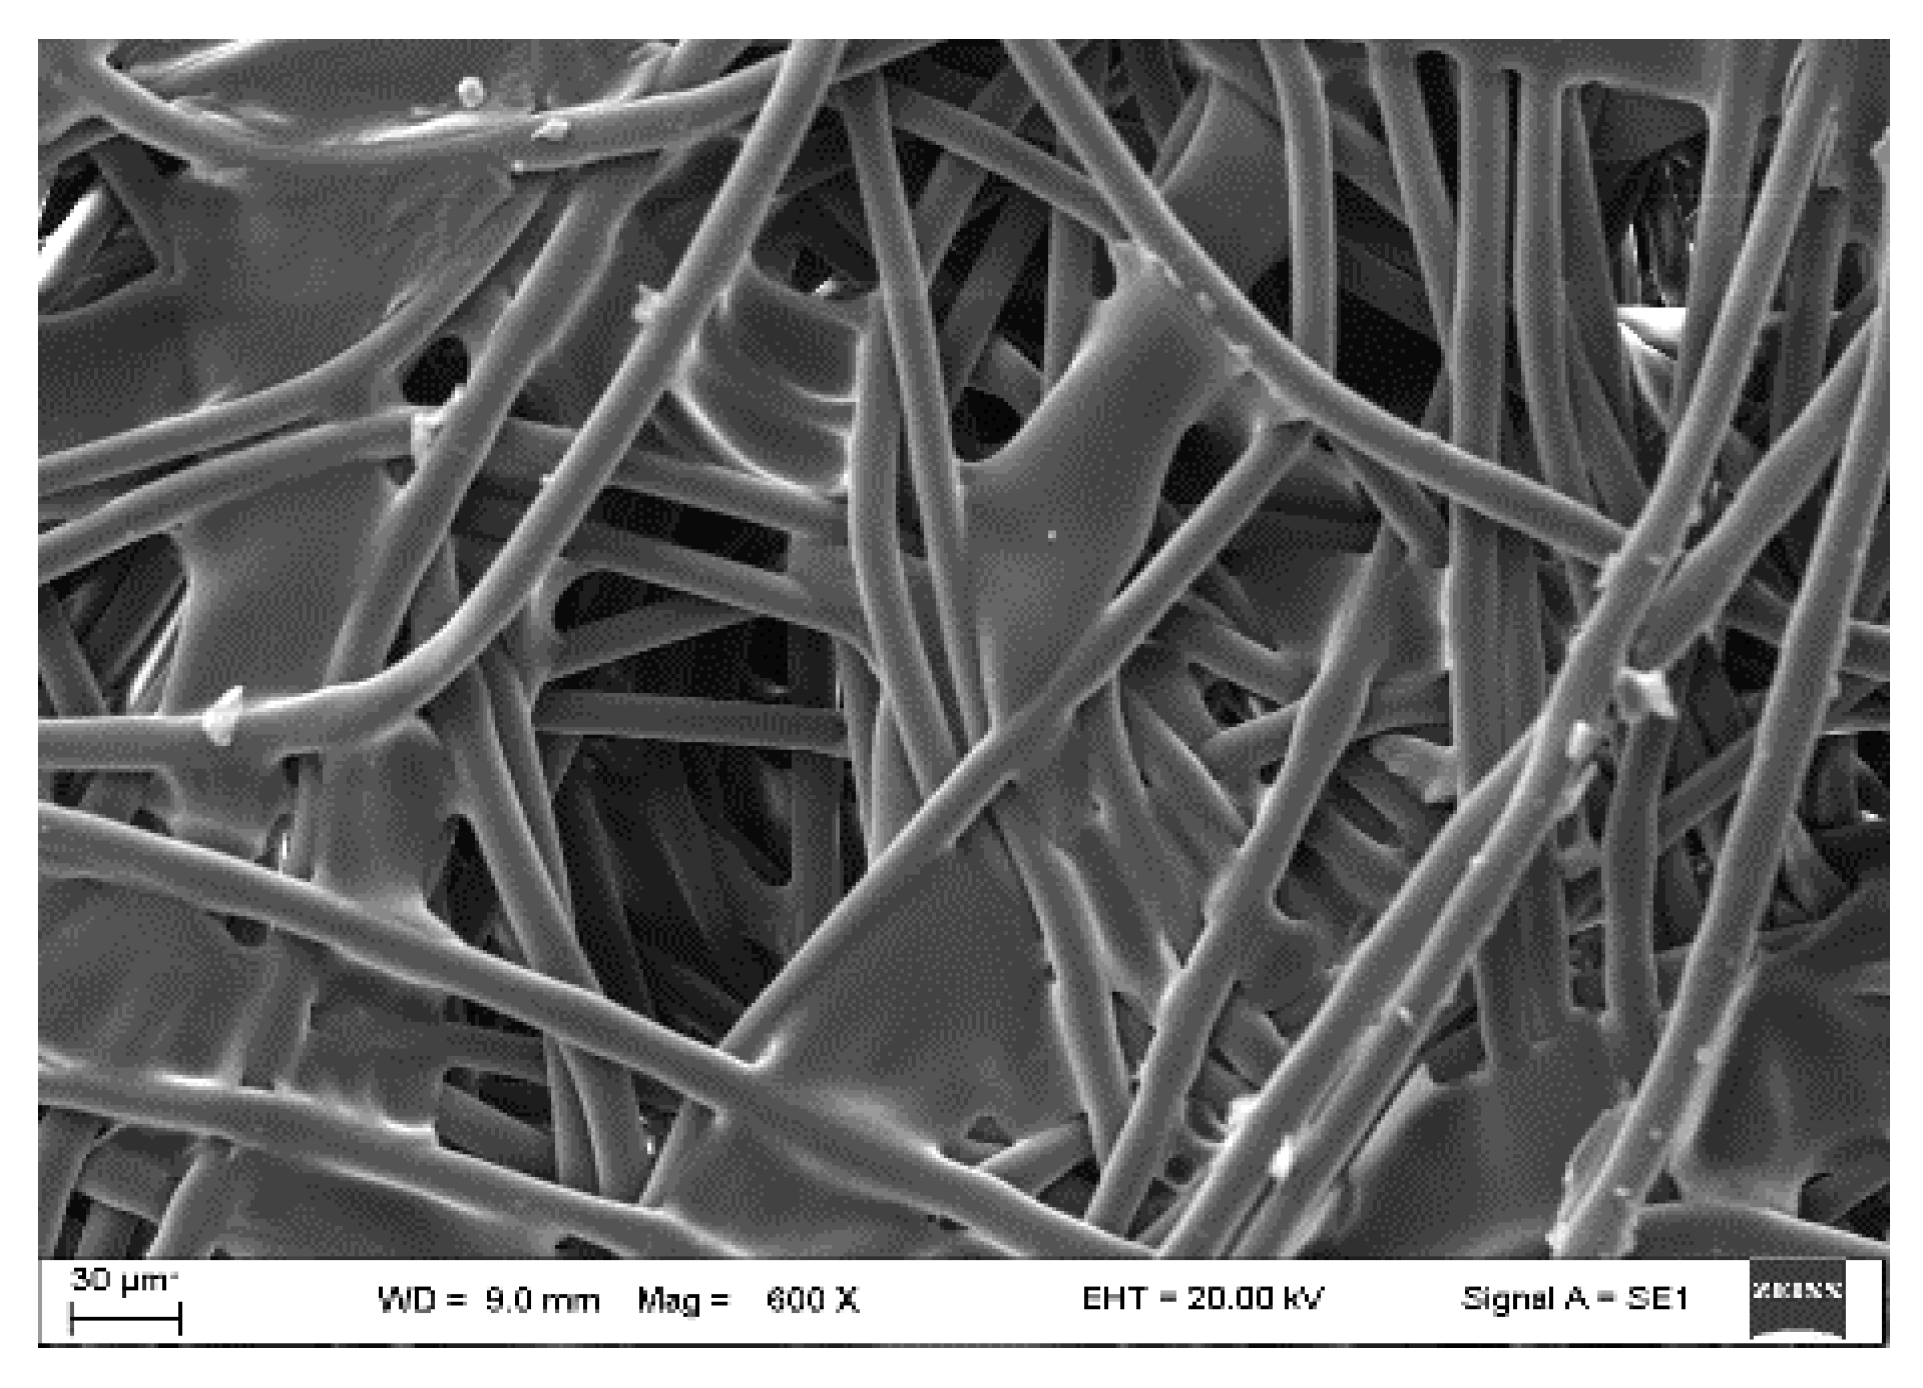
Figure 2.
(A) TGA and (B) DTG curves of PET fabric.
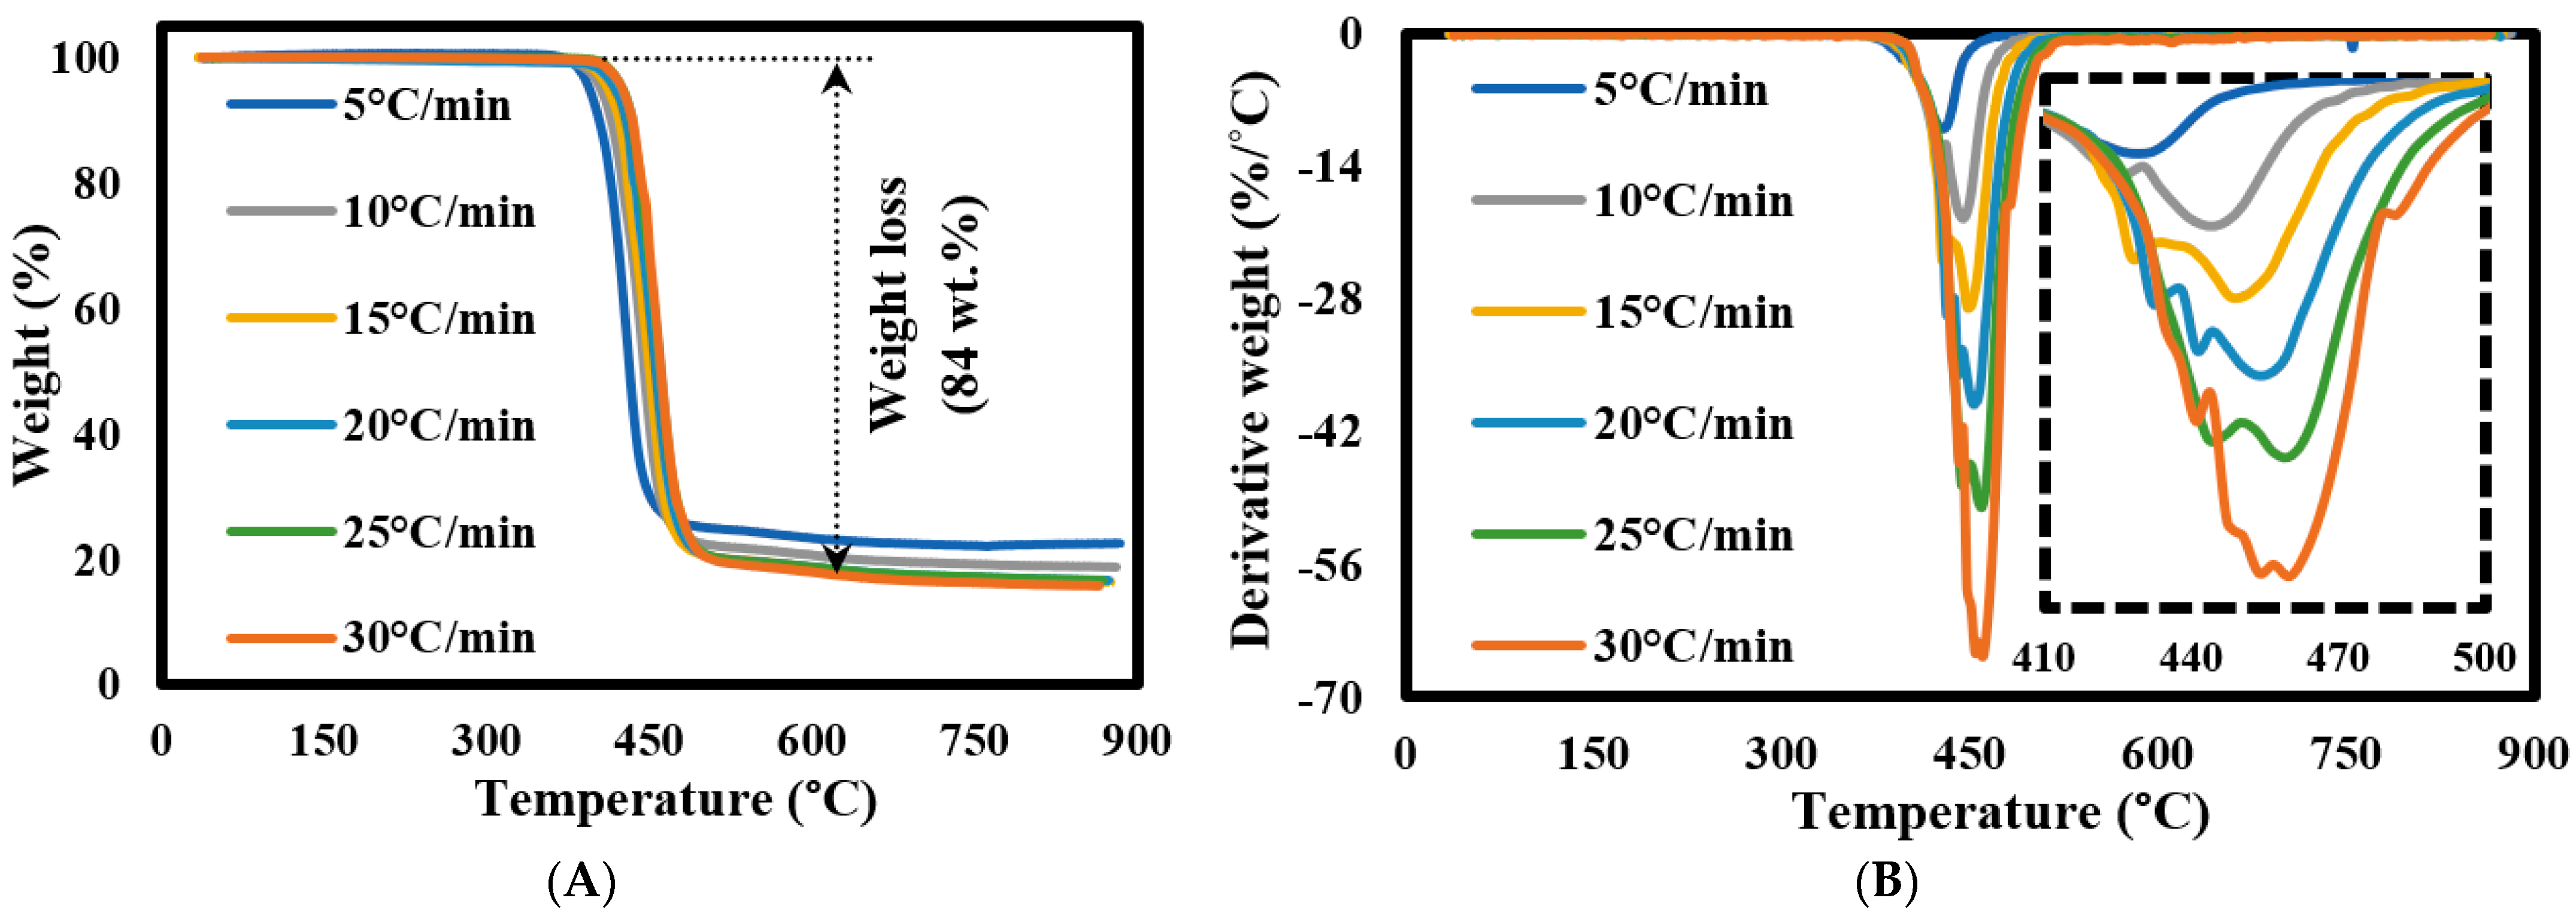
Figure 3.
Mechanism of PET fabric pyrolysis.
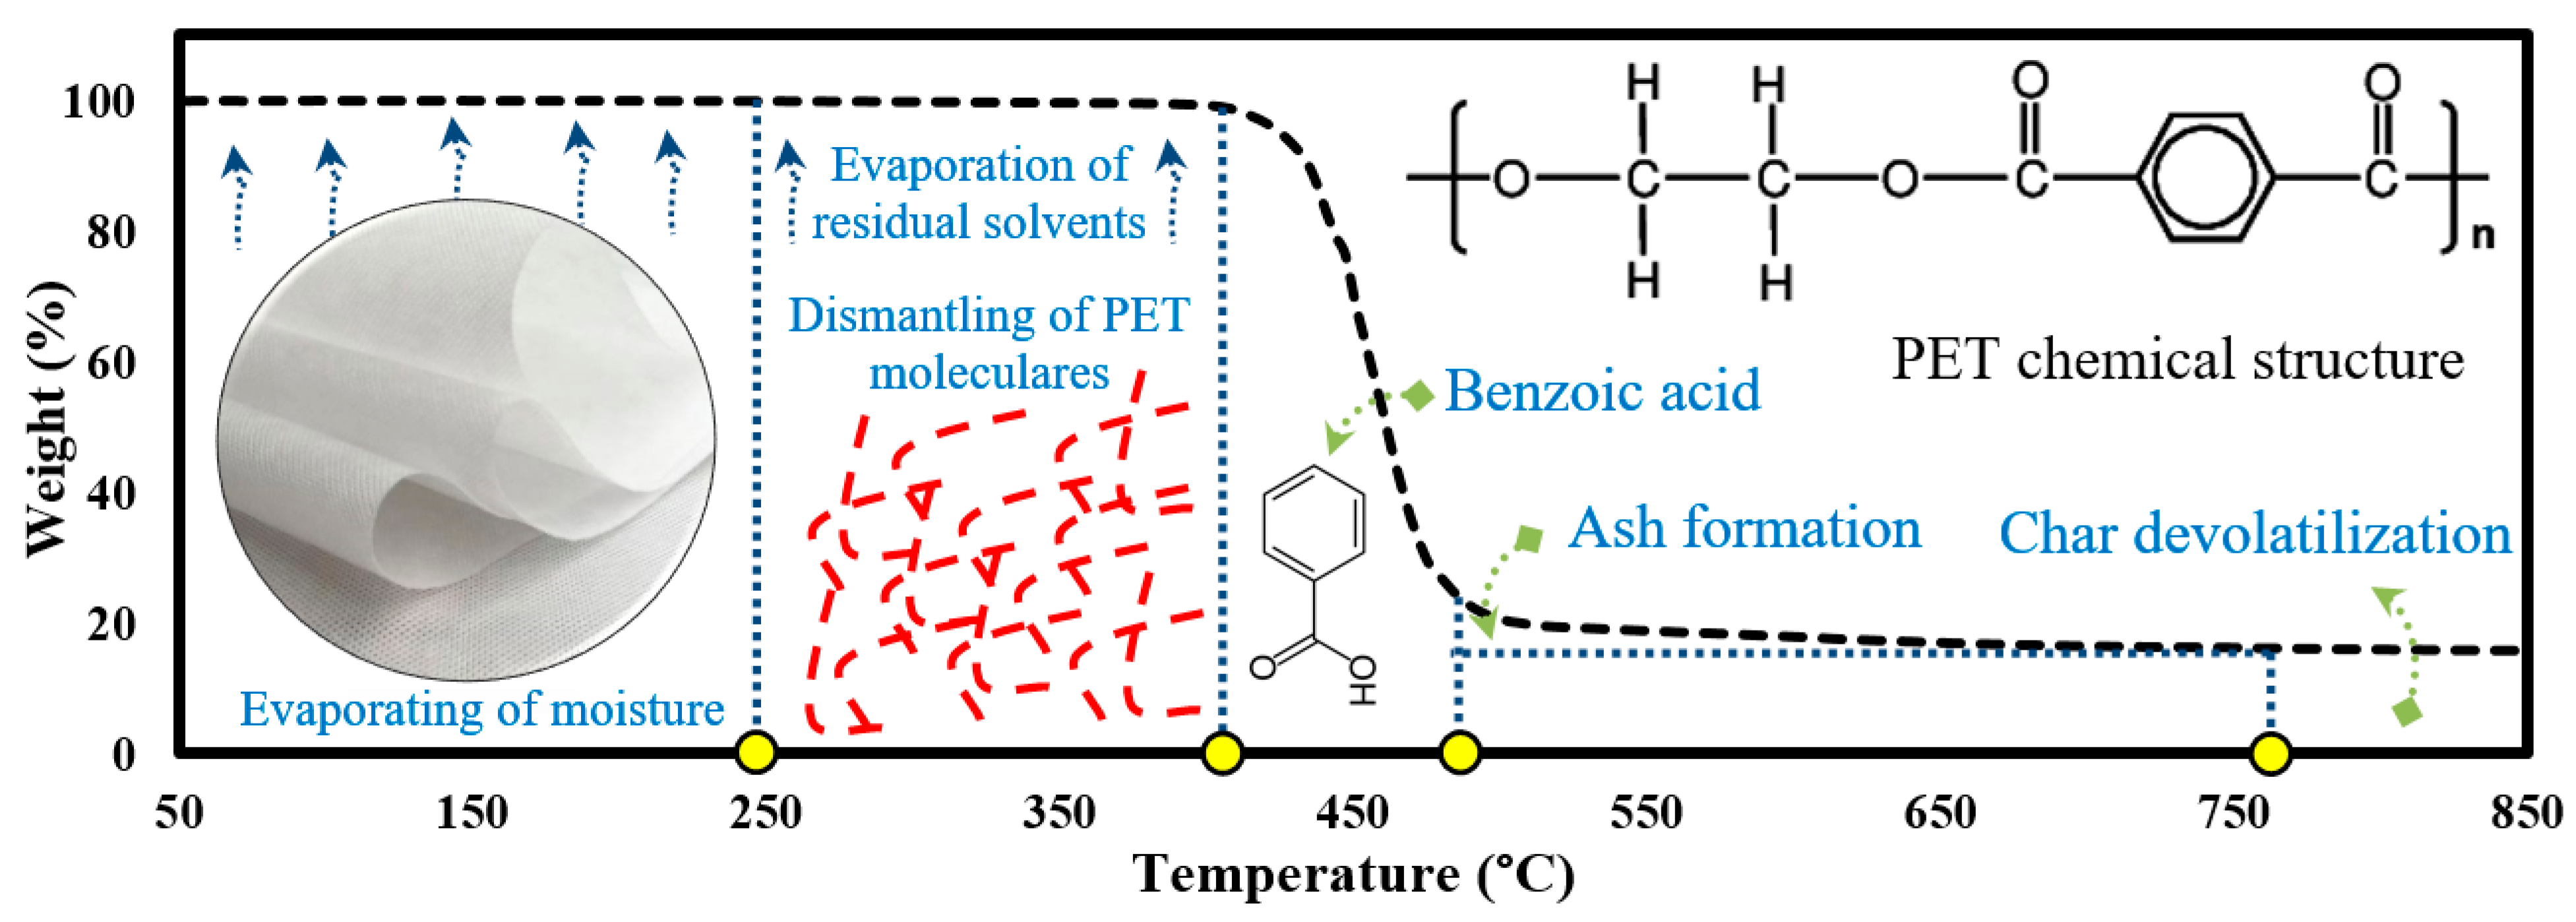
Figure 4.
Two- and three-dimensional FTIR spectra of the decomposed PET fabric.
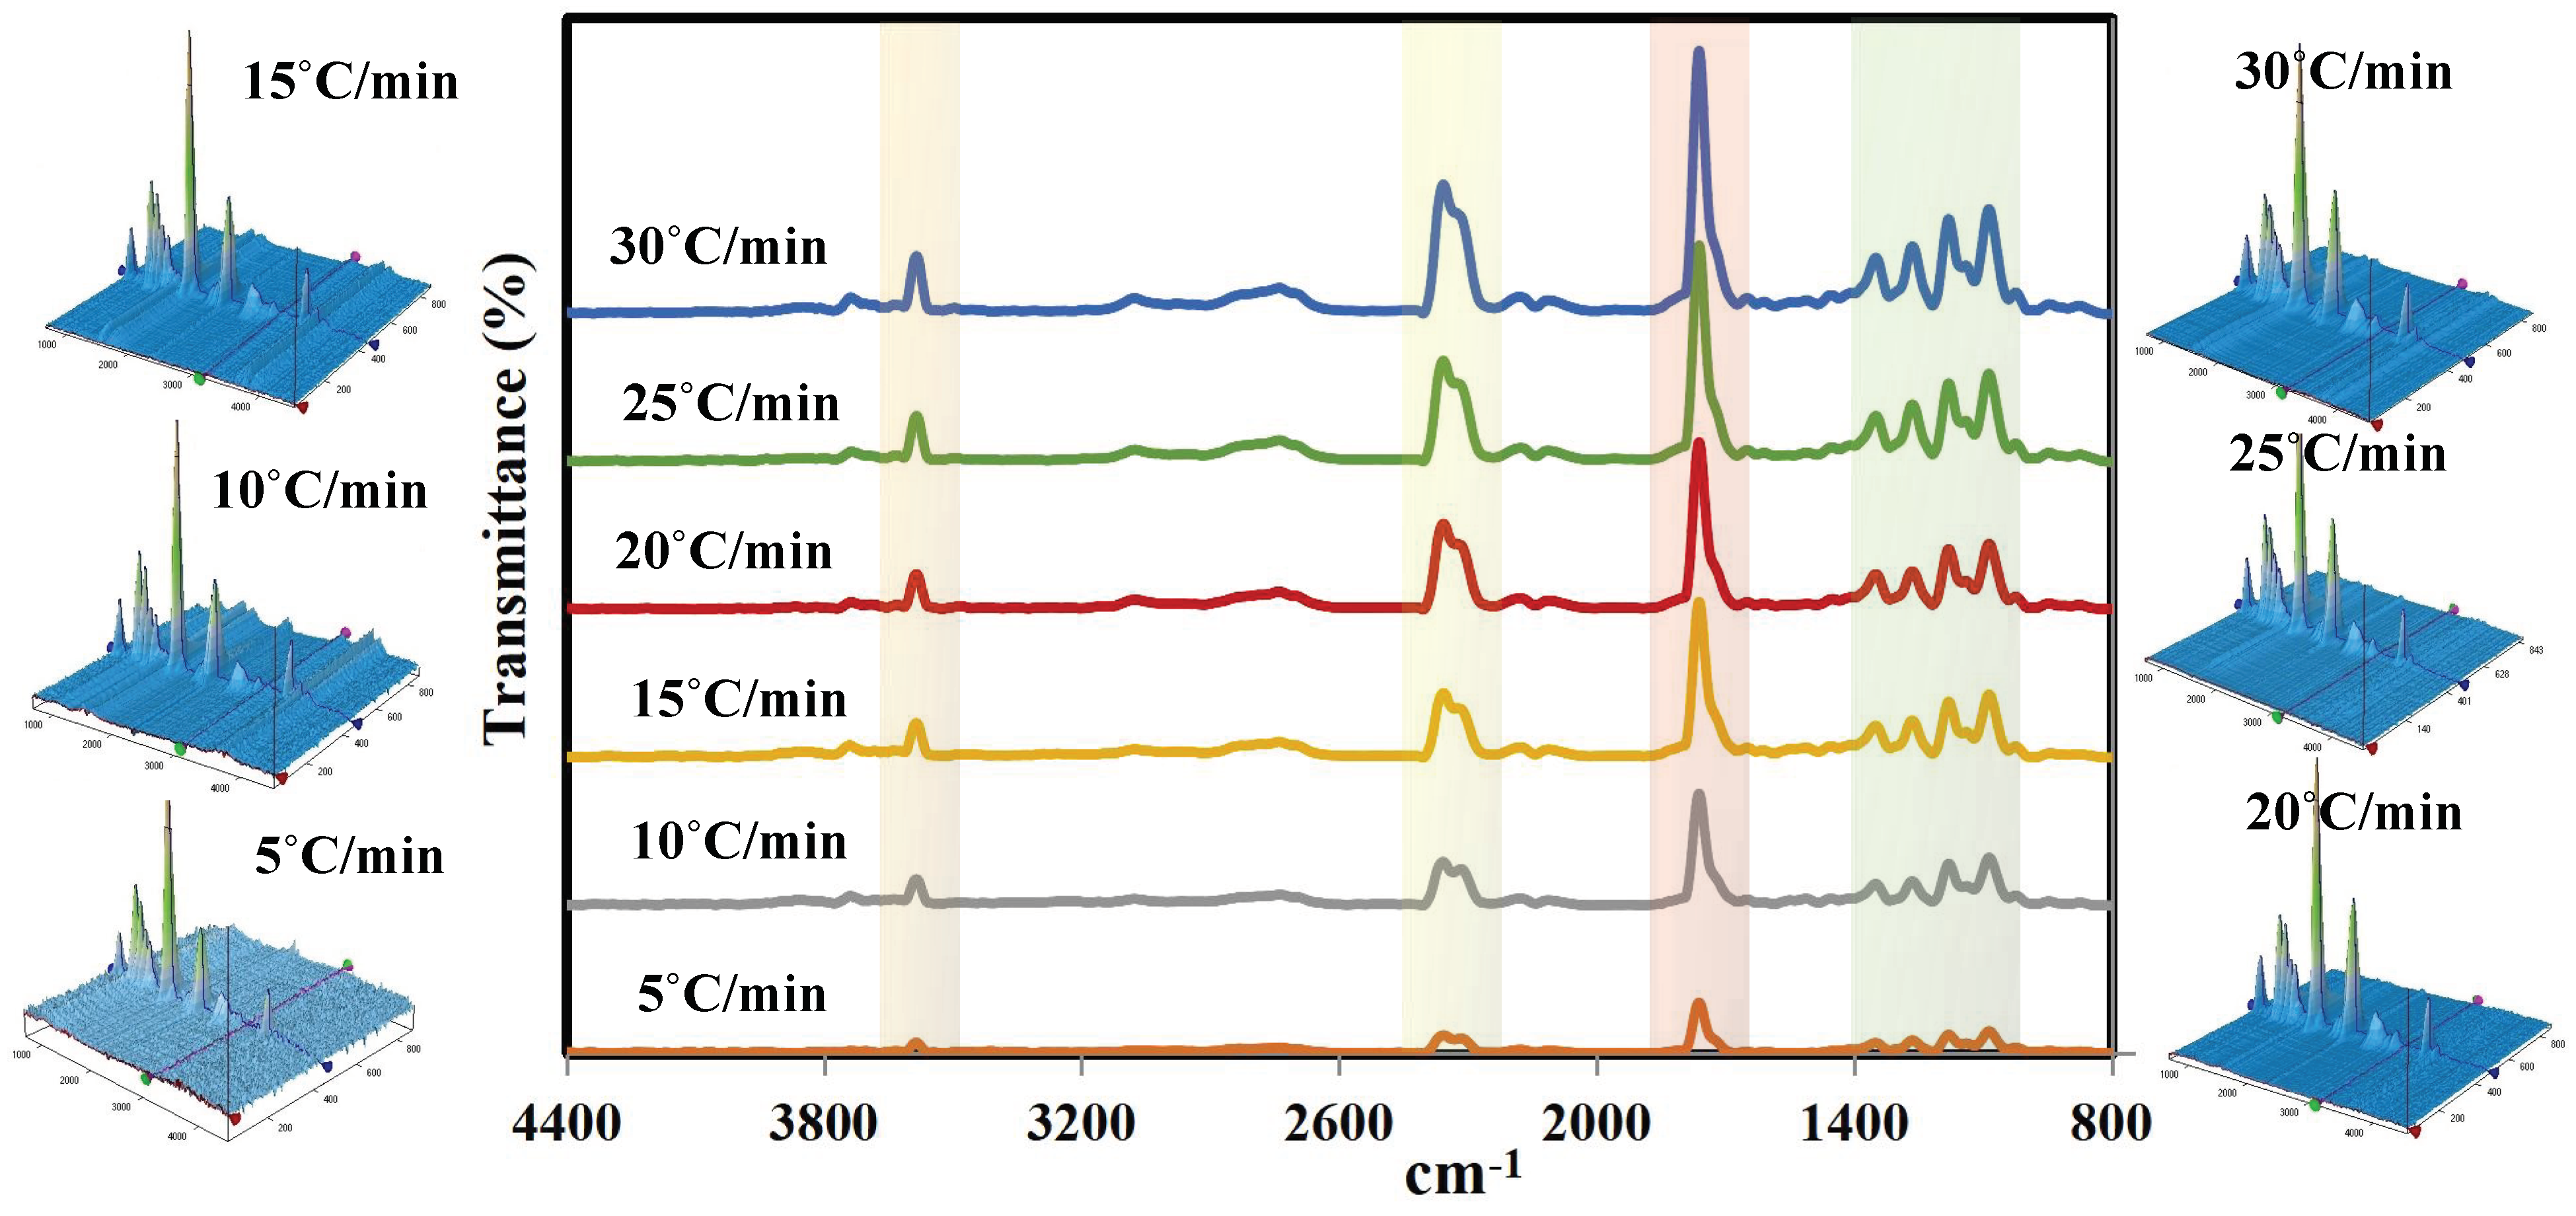
Figure 5.
GC–MS analysis of the decomposed PET samples at 5–30 °C/min.

Figure 6.
(A) Kissinger, (B) KAS, (C) FWO, and (D) Friedman plots of PET samples.

Figure 7.
Activation energies–conversion rate curves of PET.

Figure 8.
(A) Vyazovkin and (B) Cai fitting relationships of PET fabric.
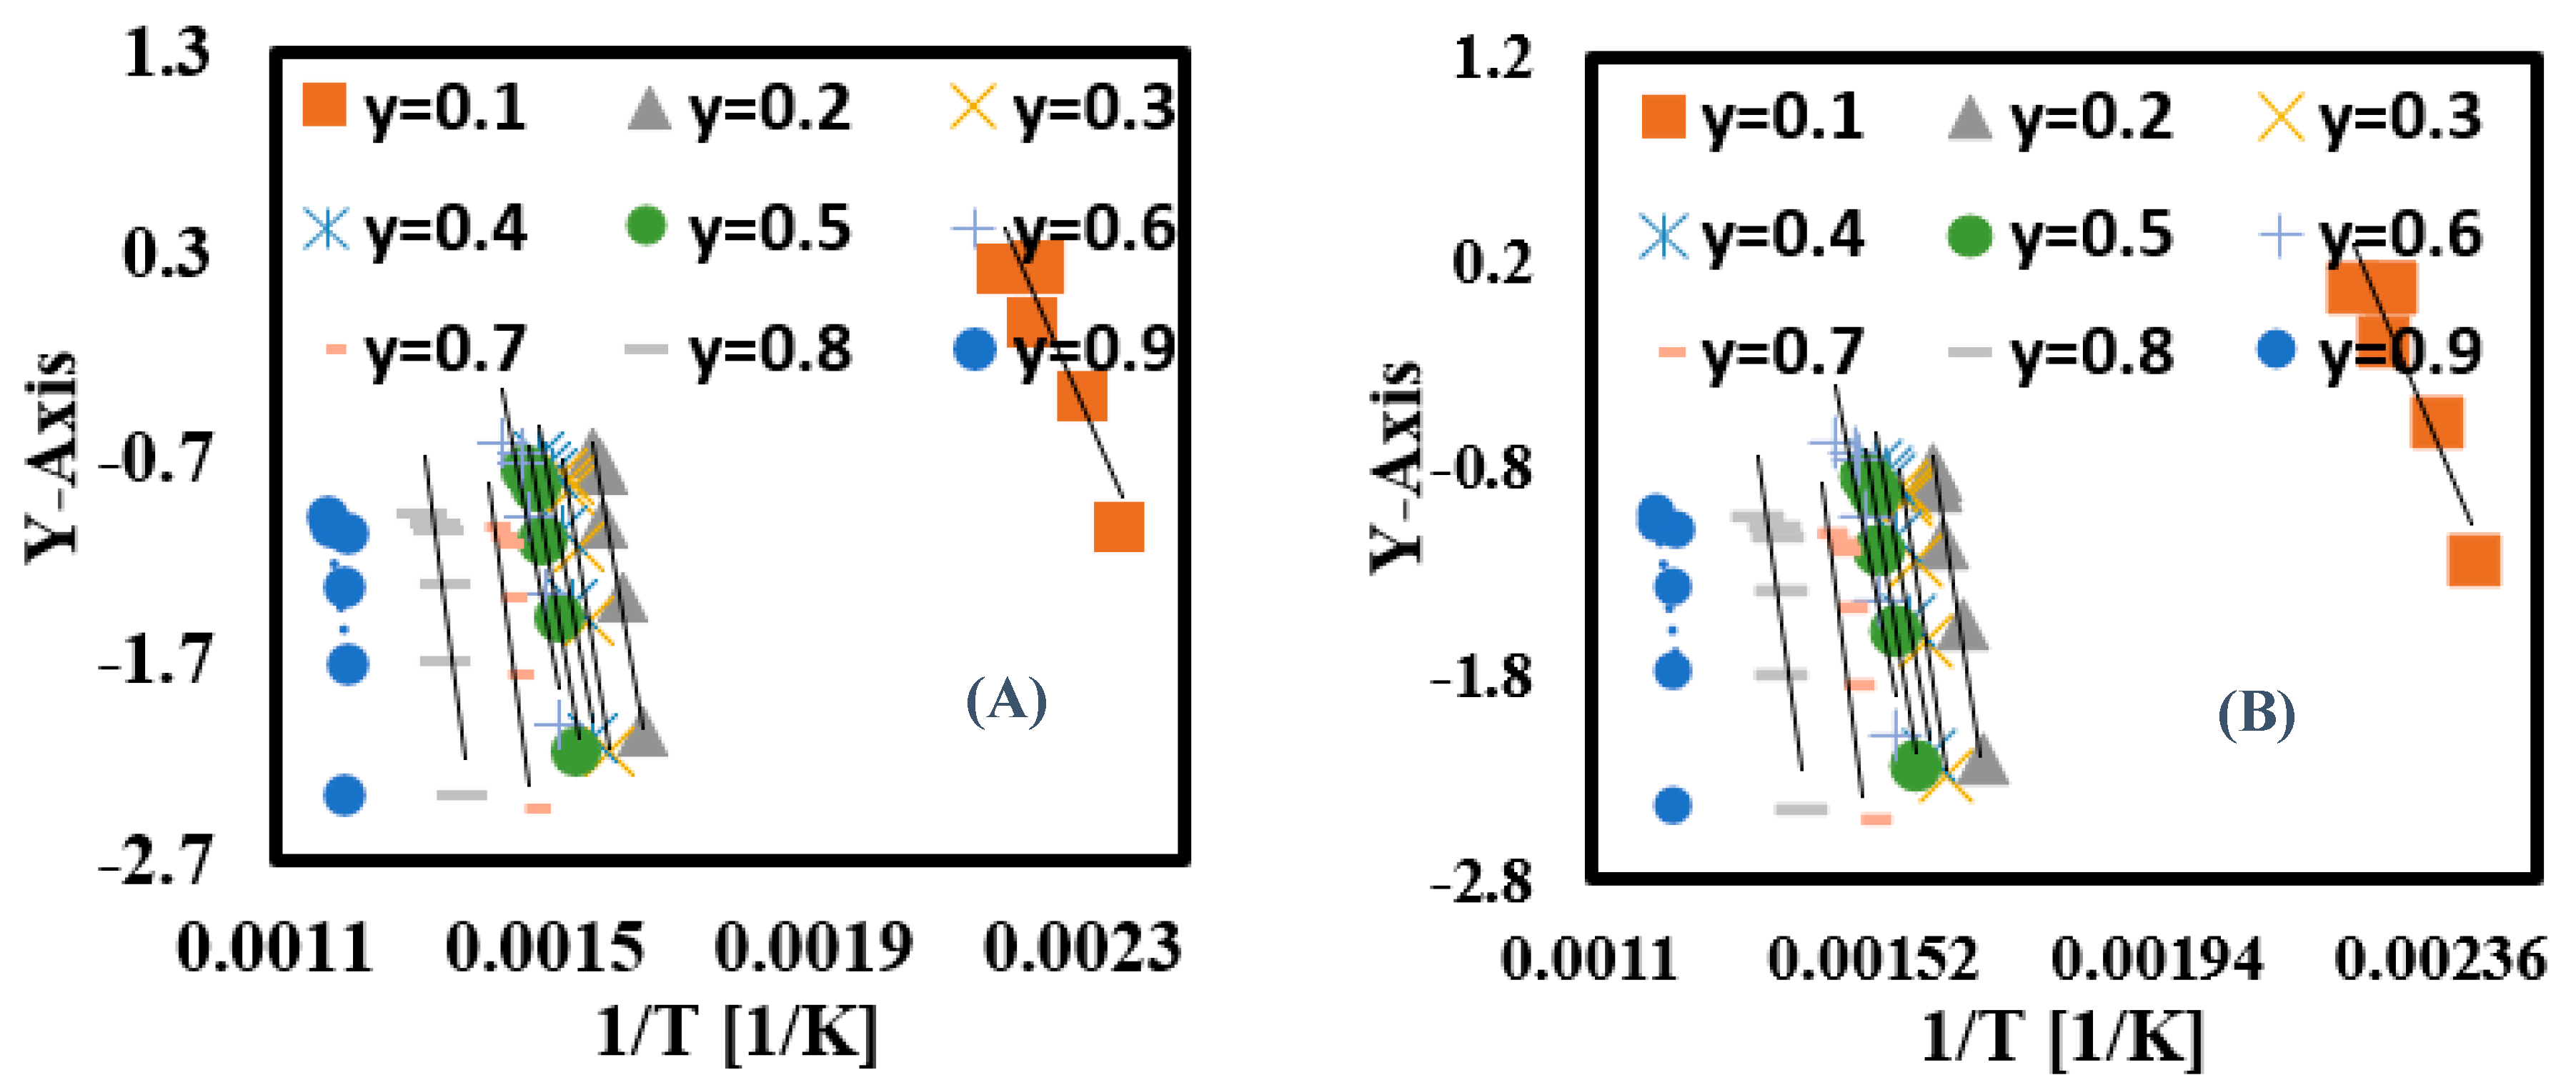
Figure 9.
Plots of TGA-DTG curves of PET samples at (A) 5 °C/min and (B) 30 °C/min.

| Equation No. | Method | Expressions |
|---|---|---|
| (3) | Kissinger | = − |
| (4) | KAS | = − |
| (5) | FWO | = − 5.335 − |
| (6) | Friedman | = |
| (7) | Vyazovkin | |
| (8) | Cai | |
| (9) | DAEM | = − |
| (10) | IPR | |
| (11) | Dev.% | (%) = |
| (12) | ΔH | ΔH = Ea RTm |
| (13) | ΔG | ΔG = Ea + RTm |
| (14) | ΔS | ΔS = |
Table 2.
Elemental and proximate analysis of PET samples.
| Elemental Analysis (wt.%) | Proximate Analysis (wt.%) | ||
|---|---|---|---|
| Nitrogen (N) | <0.01 | Moisture | 0.27 ± 0.04 |
| Carbon (C) | 62.318 ± 0.035 | Volatiles | 79.92 ± 0.28 |
| Hydrogen (H) | 4.221 ± 0.024 | Fixed Carbon | 17.89 ± 0.12 |
| Sulfur (S) | <0.01 | Ash | 1.92 ± 0.01 |
| Oxygen (O) | 33.46 ± 0.021 | ||
Table 3.
The pyrolysis characteristics of the decomposed PET samples.
| Pyrolysis Parameters | 5 °C/min | 10 °C/min | 15 °C/min | 20 °C/min | 25 °C/min | 30 °C/min |
|---|---|---|---|---|---|---|
| Ti (°C) | 362 | 367 | 375 | 385 | 394 | 396 |
| Tm (°C) | 429 | 445 | 451 | 453 | 456 | 460 |
| Tf (°C) | 484 | 498 | 510 | 516 | 519 | 521 |
| Rmax (%/min) | 10 | 19.4 | 28.9 | 39.2 | 50 | 65.9 |
| Di (% min−1 °C−3) | 1.95 × 10⁻⁶ | 3.05 × 10⁻⁶ | 4.27 × 10⁻⁶ | 5.35 × 10⁻⁶ | 6.63 × 10⁻⁶ | 8.82 × 10⁻⁶ |
| 33 | 39 | 40 | 42 | 42 | 41 | |
| T5 | 393.3 | 413.2 | 404.9 | 416.5 | 423.7 | 424.7 |
| T30 | 420.9 | 436.6 | 433.5 | 444.1 | 446.7 | 450.5 |
| THRI | 200.8 | 209.3 | 206.8 | 212.2 | 214.4 | 215.7 |
Table 4.
GC–MS compounds generated from the pyrolysis of PET fabric.
| 5 °C/min | 10 °C/min | 15 °C/min | 20 °C/min | 25 °C/min | 30 °C/min | ||||||||||||
|---|---|---|---|---|---|---|---|---|---|---|---|---|---|---|---|---|---|
| Time (min.) | GC Compounds | Area (%) | Time (min.) | GC Compounds | Area (%) | Time (min.) | GC Compounds | Area (%) | Time (min.) | GC Compounds | Area (%) | Time (min.) | GC Compounds | Area (%) | Time (min.) | GC Compounds | Area (%) |
| 1.181 | Carbon dioxide | 2.12 | 1.187 | Carbon dioxide | 2.17 | 1.187 | Carbon dioxide | 2.59 | 1.181 | Carbon dioxide | 1.90 | 1.194 | Carbon dioxide | 3.21 | 1.187 | Carbon dioxide | 3.66 |
| 1.239 | Acetaldehyde | 7.40 | 1.245 | Acetaldehyde | 8.46 | 1.239 | Acetaldehyde | 9.46 | 1.239 | Acetaldehyde | 6.07 | 1.246 | Acetaldehyde | 9.89 | 1.239 | Acetaldehyde | 9.60 |
| 12.177 | Benzoic acid | 74.90 | 11.628 | N-[5-(m-Tolyl)-1,3,4-thiadiazol-2-1326yl]benzimidic acid | 1.02 | 2.158 | Benzene | 0.67 | 11.531 | Vinyl benzoate | 2.70 | 2.164 | Benzene | 0.81 | 2.151 | Benzene | 0.85 |
| 15.030 | 2-n-Propoxyamphetamine | 1.32 | 12.190 | Benzoic acid | 71.82 | 11.602 | Benzenebutanoic acid, .gamma.-oxo- | 1.84 | 12.197 | Benzoic acid | 60.60 | 11.602 | Vinyl benzoate | 4.40 | 11.556 | Vinyl benzoate | 5.63 |
| 17.514 | 2,4-Dimethylamphetamine | 0.60 | 14.965 | 2-n-Propoxyamphetamine | 0.98 | 12.203 | Benzoic acid | 73.40 | 14.894 | 4-Ethylbenzoic acid | 2.28 | 12.223 | Benzoic acid | 68.88 | 12.216 | Benzoic acid | 62.53 |
| 19.176 | Acetic acid, 2-(1-methyl-2-oxohydrazino)-, N′-[(E)-(2-hydroxyphenyl) methylidene]hydrazide, N-oxide | 0.39 | 17.488 | (3,4,5,6-Tetrahydro-2H-[2,3′]bipyridinyl-1-yl)acetic acid hydrazide | 1.79 | 14.965 | 4-Ethylbenzoic acid | 1.26 | 17.424 | 4-Methyl-2,6-dihydroxyquinoline | 1.66 | 14.959 | 4-Ethylbenzoic acid | 1.60 | 17.449 | 2-t-Butyl-1-methyl-3-phenyl-imidazolidin-4-one | 4.18 |
| 21.046 | 2-Fluorenamine | 0.60 | 18.523 | Phthalic acid, 2-hexyl ester | 0.93 | 17.482 | 2-t-Butyl-1-methyl-3-phenyl-imidazolidin-4-one | 1.90 | 21.150 | Octadecanal | 3.72 | 17.456 | Hydantoin, 5-ethyl-5-phenyl-, (.+/-.)- | 3.99 | 19.028 | Cyclododecene, 1-methyl- | 1.93 |
| 22.527 | N-Dodecylmethylamine | 1.20 | 21.039 | 9-Methyl-9H-carbazole | 0.91 | 18.530 | Terephthalic monohydroxamic acid | 0.72 | 21.777 | Cyclononasiloxane, octadecamethyl- | 2.05 | 17.986 | Terephthalic monohydroxamic acid | 2.39 | 20.127 | 16-Octadecenal | 1.58 |
| 23.581 | Benzoic acid, 2-propenyl ester | 9.48 | 22.514 | L-Alanine-4-nitroanilide | 0.96 | 19.054 | Benzyl alcohol, .alpha.-(1-aminoethyl)-m-hydroxy-, (-)- | 0.42 | 22.152 | Oxirane, heptadecyl- | 2.45 | 23.556 | Benzamide, N-hydroxy-N-(2-hydroxy-3-phenoxypropyl)- | 2.81 | 20.237 | 1,1,1,5,7,7,7-Heptamethyl-3,3-bis(trimethylsiloxy)tetrasiloxane | 0.85 |
| 24.222 | Phenol, 2-[(N,N-dimethylamino)methyl]-3,5-dimethyl- | 0.40 | 23.569 | Benzoic acid, 3,3,5-trimethyl-6-oxo-2-phenyl-3,6-dihydro-2H-pyran-4-yl ester | 7.35 | 19.992 | Phosphinic fluoride, diphenyl- | 0.39 | 22.469 | 4,4′-(Hexafluoroisopropylidene)diphenol | 8.48 | 26.092 | Benzonitrile, m-phenethyl- | 1.29 | 21.169 | Hexadecanal | 1.67 |
| 26.085 | 2-Amino-1-(o-methoxyphenyl)propane | 1.60 | 26.091 | Azetidine, 1-benzyl-3,3-dimethyl-2-phenyl- | 2.38 | 21.046 | Dimethyl-(2-thioxo-[1,2,3]dioxaphosphinan-2-yl)-amine | 0.55 | 23.097 | Oleyl alcohol, methyl ether | 2.26 | 27.340 | Tetrasiloxane, decamethyl- | 0.74 | 22.159 | Hexadecanal | 0.97 |
| 27.340 | 1-Propene, 3-(2-cyclopentenyl)-2-methyl-1,1-diphenyl- | 1.23 | 22.527 | 1-Methyl-2-phenoxyethylamine | 0.77 | 23.194 | Cyclodecasiloxane, eicosamethyl- | 1.71 | 22.495 | 4,4′-(Hexafluoroisopropylidene)diphenol | 2.59 | ||||||
| 23.575 | Butanedioic acid, 2,3-bis(benzoyloxy)-, [S-(R*,R*)]- | 3.68 | 24.009 | Oxirane, hexadecyl- | 1.44 | 23.109 | Oxirane, heptadecyl- | 1.16 | |||||||||
| 26.091 | Benzonitrile, m-phenethyl- | 1.60 | 24.481 | Hexasiloxane, tetradecamethyl- | 1.64 | 23.543 | 1,2-Ethanediol, dibenzoate | 1.78 | |||||||||
| 27.340 | 1H-Indole, 5-methyl-2-phenyl- | 0.75 | 25.729 | Cyclononasiloxane, octadecamethyl- | 1.05 | 26.091 | Azetidine, 1-benzyl-3,3-dimethyl-2-phenyl- | 1.00 | |||||||||
Table 5.
The estimated activation energy of decomposed PET fabric at different conversion rates.
| KAS | FWO | Friedman | Vyazovkin | Cai | |||||||||
|---|---|---|---|---|---|---|---|---|---|---|---|---|---|
| Ea (KJ/mol) | R2 | A (1/s) | Ea (KJ/mol) | R2 | A (1/s) | Ea (KJ/mol) | R2 | A (1/s) | Ea (kJ/mol) | R2 | Ea (KJ/mol) | R2 | |
| 0.1 | 153.19 | 0.95 | 8 × 10⁸ | 209.51 | 1.00 | 1.65 × 10¹⁸ | 237.09 | 0.99 | 7.63 × 10²⁰ | 64.35 | 0.89 | 64.83 | 0.86 |
| 0.2 | 201.87 | 0.97 | 4 × 10¹¹ | 256.76 | 1.00 | 6.03 × 10²⁰ | 305.76 | 1.00 | 3.23 × 1025 | 162.31 | 0.98 | 163.88 | 0.98 |
| 0.3 | 190.31 | 0.96 | 2 × 10¹⁰ | 244.48 | 1.00 | 2.35 × 10¹⁹ | 288.20 | 0.99 | 4.81 × 10²³ | 172.97 | 0.99 | 173.58 | 0.99 |
| 0.4 | 198.31 | 0.98 | 3 × 10¹⁰ | 250.98 | 0.99 | 2.72 × 10¹⁹ | 254.06 | 0.96 | 4.72 × 10²¹ | 154.16 | 0.97 | 153.98 | 0.97 |
| 0.5 | 189.29 | 0.98 | 3 × 10⁹ | 241.40 | 0.99 | 3 × 10¹⁸ | 246.86 | 0.98 | 1.03 × 10²⁰ | 161.89 | 0.97 | 161.32 | 0.97 |
| 0.6 | 201.33 | 0.98 | 1 × 10¹⁰ | 254.89 | 0.99 | 1.34 × 10¹⁹ | 244.86 | 0.99 | 3.98 × 10¹⁹ | 138.67 | 0.89 | 138.57 | 0.87 |
| 0.7 | 222.50 | 0.98 | 2 × 10¹¹ | 242.81 | 0.99 | 1.08 × 10¹⁸ | 242.71 | 0.98 | 1.39 × 10¹⁹ | 207.41 | 0.92 | 206.92 | 0.91 |
| 0.8 | 195.03 | 1.00 | 2 × 10⁹ | 244.97 | 0.98 | 8.94 × 10¹⁷ | 223.43 | 0.95 | 2.27 × 10¹⁷ | 191.77 | 0.82 | 191.29 | 0.81 |
| 0.9 | 188.80 | 0.96 | 3 × 10⁸ | 242.84 | 0.99 | 2.7 × 10¹⁷ | 257.90 | 0.98 | 8.42 × 10¹⁸ | 194.42 | 0.80 | 186.18 | 0.81 |
| Avg. | 193.40 | 0.97 | 8 × 10¹⁰ | 243.18 | 0.99 | 7.49 × 10¹⁹ | 255.65 | 0.98 | 3.64 × 1024 | 160.88 | 0.91 | 160.06 | 0.91 |
Table 6.
The determined activation energy at different number of iterations using Vyazovkin and Cai models.
Table 6.
The determined activation energy at different number of iterations using Vyazovkin and Cai models.
| y | The Activation Energy (kJ/mol) | The Activation Energy (kJ/mol) | |||||||
|---|---|---|---|---|---|---|---|---|---|
| Vyazovkin | Cai | ||||||||
| Initial Value | First Iteration | Second Iteration | Third Iteration | Fourth Iteration | First Iteration | Second Iteration | Third Iteration | Fourth Iteration | |
| 0.1 | 200 | 62.24 | 62.19 | 64.35 | 64.35 | 64.93 | 64.35 | 64.83 | 64.83 |
| 0.2 | 200 | 156.91 | 156.39 | 162.31 | 162.31 | 162.36 | 161.82 | 163.88 | 163.88 |
| 0.3 | 200 | 166.59 | 166.70 | 172.97 | 172.97 | 172.37 | 172.48 | 173.58 | 173.58 |
| 0.4 | 200 | 149.04 | 148.72 | 154.16 | 154.16 | 154.21 | 153.88 | 153.98 | 153.98 |
| 0.5 | 200 | 156.50 | 156.13 | 161.89 | 161.89 | 161.93 | 161.55 | 161.32 | 161.32 |
| 0.6 | 200 | 133.93 | 133.84 | 138.67 | 138.67 | 138.58 | 138.48 | 138.57 | 138.57 |
| 0.7 | 200 | 200.40 | 199.73 | 207.41 | 207.41 | 207.35 | 206.66 | 206.92 | 206.92 |
| 0.8 | 200 | 185.36 | 184.87 | 191.77 | 191.77 | 191.79 | 191.29 | 191.29 | 191.29 |
| 0.9 | 200 | 179.83 | 179.35 | 194.42 | 194.42 | 186.07 | 185.57 | 186.18 | 186.18 |
| Avg. | 200 | 154.53 | 154.21 | 160.88 | 160.88 | 159.95 | 159.56 | 160.06 | 160.06 |
Table 7.
The optimum parameters used in DAEM and IPR models.
| Model | DAEM | IPR |
|---|---|---|
| E1 | 243.15 | 222.17 |
| A1 | 4.20 × 10¹⁶ | 1.66 × 10¹² |
| E2 | 301.51 | 284.76 |
| A2 | 4.62 × 10¹⁶ | 1.77 × 10¹³ |
Table 8.
Thermodynamic parameters for PET pyrolysis at 5 °C/min.
| KAS | FWO | Friedman | |||||||
|---|---|---|---|---|---|---|---|---|---|
| ΔH (kJ/mol) | ΔG (kJ/mol) | ΔS (J/mol K) | ΔH (kJ/mol) | ΔG (kJ/mol) | ΔS (J/mol K) | ΔH (kJ/mol) | ΔG (kJ/mol) | ΔS (J/mol K) | |
| 0.1 | 151 | 176 | 214.7 | 207 | 183 | 294.9 | 231 | 133 | 329.2 |
| 0.2 | 196 | 223 | 278.9 | 251 | 154 | 357.2 | 300 | 140 | 427.0 |
| 0.3 | 184 | 229 | 262.5 | 239 | 161 | 339.7 | 282 | 147 | 402.0 |
| 0.4 | 192 | 234 | 273.8 | 245 | 167 | 349.0 | 248 | 140 | 353.4 |
| 0.5 | 183 | 239 | 261.0 | 236 | 170 | 335.3 | 241 | 155 | 343.1 |
| 0.6 | 195 | 244 | 278.1 | 249 | 175 | 354.5 | 239 | 158 | 340.3 |
| 0.7 | 217 | 248 | 308.3 | 237 | 177 | 337.3 | 237 | 162 | 337.2 |
| 0.8 | 189 | 247 | 269.2 | 239 | 181 | 340.4 | 218 | 167 | 309.7 |
| 0.9 | 183 | 252 | 260.3 | 237 | 186 | 337.3 | 252 | 180 | 358.8 |
| Avg. | 188 | 232 | 267.4 | 238 | 173 | 338.4 | 250 | 154 | 355.6 |
Table 9.
Thermodynamic parameters for PET pyrolysis at 30 °C/min.
| KAS | FWO | Friedman | |||||||
|---|---|---|---|---|---|---|---|---|---|
| ΔH (kJ/mol) | ΔG (kJ/mol) | ΔS (J/mol K) | ΔH (kJ/mol) | ΔG (kJ/mol) | ΔS (J/mol K) | ΔH (kJ/mol) | ΔG (kJ/mol) | ΔS (J/mol K) | |
| 0.1 | 151 | 130 | 205.6 | 207 | 182 | 282.3 | 231 | 129 | 315.0 |
| 0.2 | 196 | 180 | 266.8 | 251 | 150 | 341.8 | 300 | 133 | 408.6 |
| 0.3 | 184 | 150 | 251.1 | 238 | 158 | 325.0 | 282 | 141 | 384.7 |
| 0.4 | 192 | 160 | 262.0 | 245 | 163 | 333.9 | 248 | 135 | 338.1 |
| 0.5 | 183 | 137 | 249.7 | 235 | 167 | 320.8 | 241 | 151 | 328.3 |
| 0.6 | 195 | 157 | 266.1 | 249 | 171 | 339.2 | 239 | 155 | 325.5 |
| 0.7 | 216 | 196 | 295.0 | 237 | 175 | 322.7 | 237 | 159 | 322.6 |
| 0.8 | 189 | 141 | 257.6 | 239 | 178 | 325.6 | 217 | 165 | 296.3 |
| 0.9 | 183 | 123 | 249.1 | 237 | 183 | 322.7 | 252 | 177 | 343.3 |
| Avg. | 188 | 153 | 255.9 | 238 | 170 | 323.8 | 250 | 149 | 340.3 |
Disclaimer/Publisher’s Note: The statements, opinions and data contained in all publications are solely those of the individual author(s) and contributor(s) and not of MDPI and/or the editor(s). MDPI and/or the editor(s) disclaim responsibility for any injury to people or property resulting from any ideas, methods, instructions or products referred to in the content. |
© 2023 by the authors. Licensee MDPI, Basel, Switzerland. This article is an open access article distributed under the terms and conditions of the Creative Commons Attribution (CC BY) license (https://creativecommons.org/licenses/by/4.0/).
Share and Cite
MDPI and ACS Style
Yousef, S.; Eimontas, J.; Striūgas, N.; Mohamed, A.; Ali Abdelnaby, M. Pyrolysis Kinetic Behavior and Thermodynamic Analysis of PET Nonwoven Fabric. Materials 2023, 16, 6079. https://doi.org/10.3390/ma16186079
AMA Style
Yousef S, Eimontas J, Striūgas N, Mohamed A, Ali Abdelnaby M. Pyrolysis Kinetic Behavior and Thermodynamic Analysis of PET Nonwoven Fabric. Materials. 2023; 16(18):6079. https://doi.org/10.3390/ma16186079
Chicago/Turabian StyleYousef, Samy, Justas Eimontas, Nerijus Striūgas, Alaa Mohamed, and Mohammed Ali Abdelnaby. 2023. "Pyrolysis Kinetic Behavior and Thermodynamic Analysis of PET Nonwoven Fabric" Materials 16, no. 18: 6079. https://doi.org/10.3390/ma16186079
Note that from the first issue of 2016, this journal uses article numbers instead of page numbers. See further details here.