
Engineering Characteristics and Microscopic Mechanism of Soil–Cement–Bentonite (SCB) Cut-Off Wall Backfills with a Fixed Fluidity


Abstract
:1. Introduction
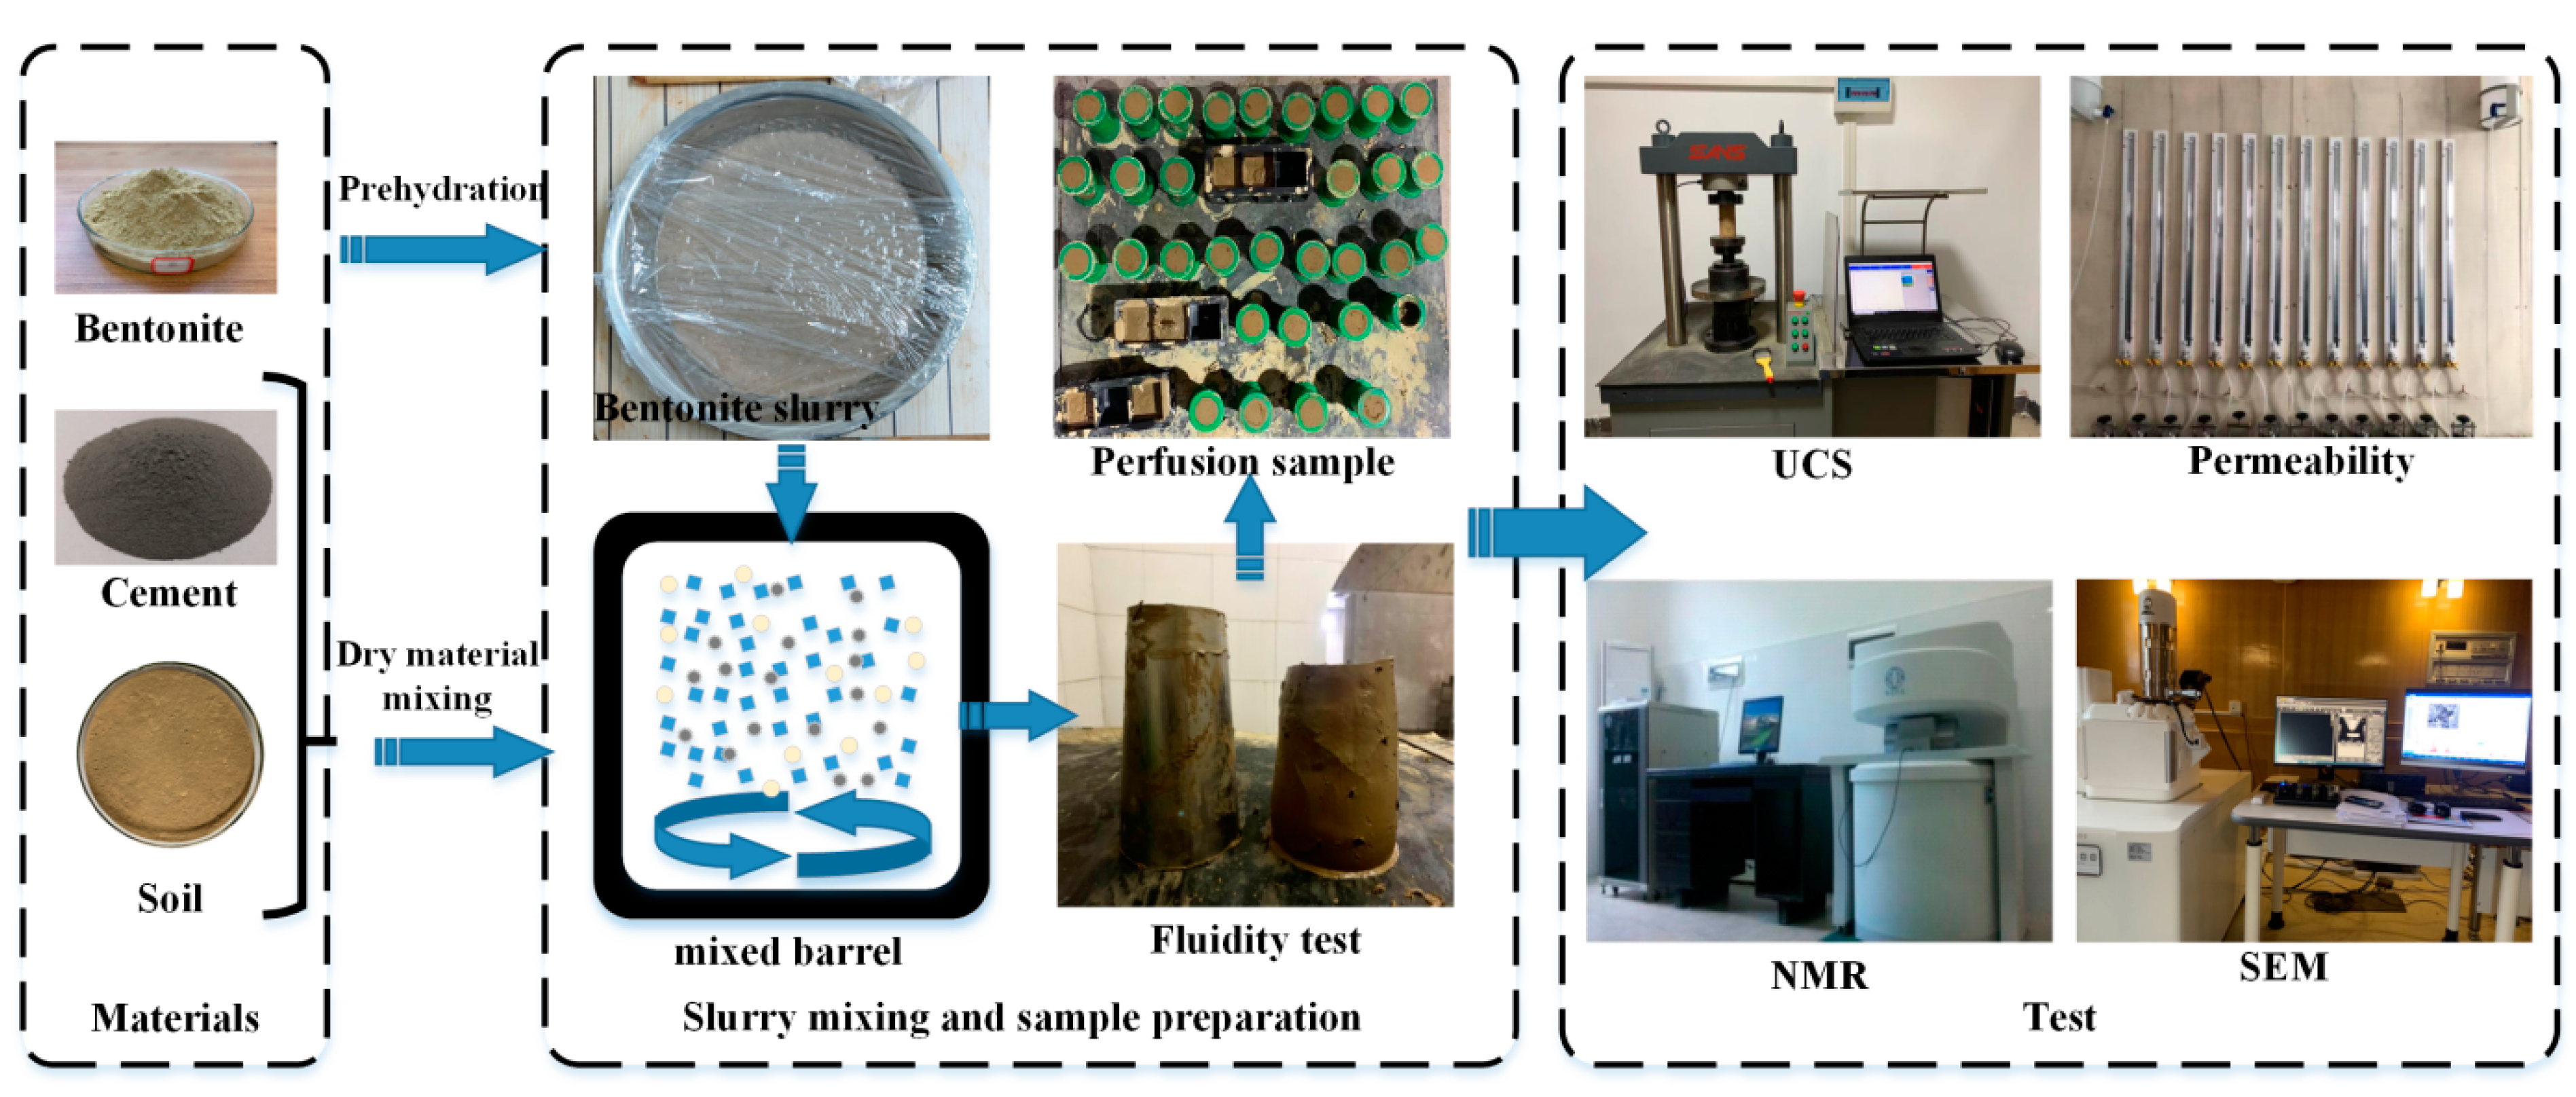
2. Experimental Program
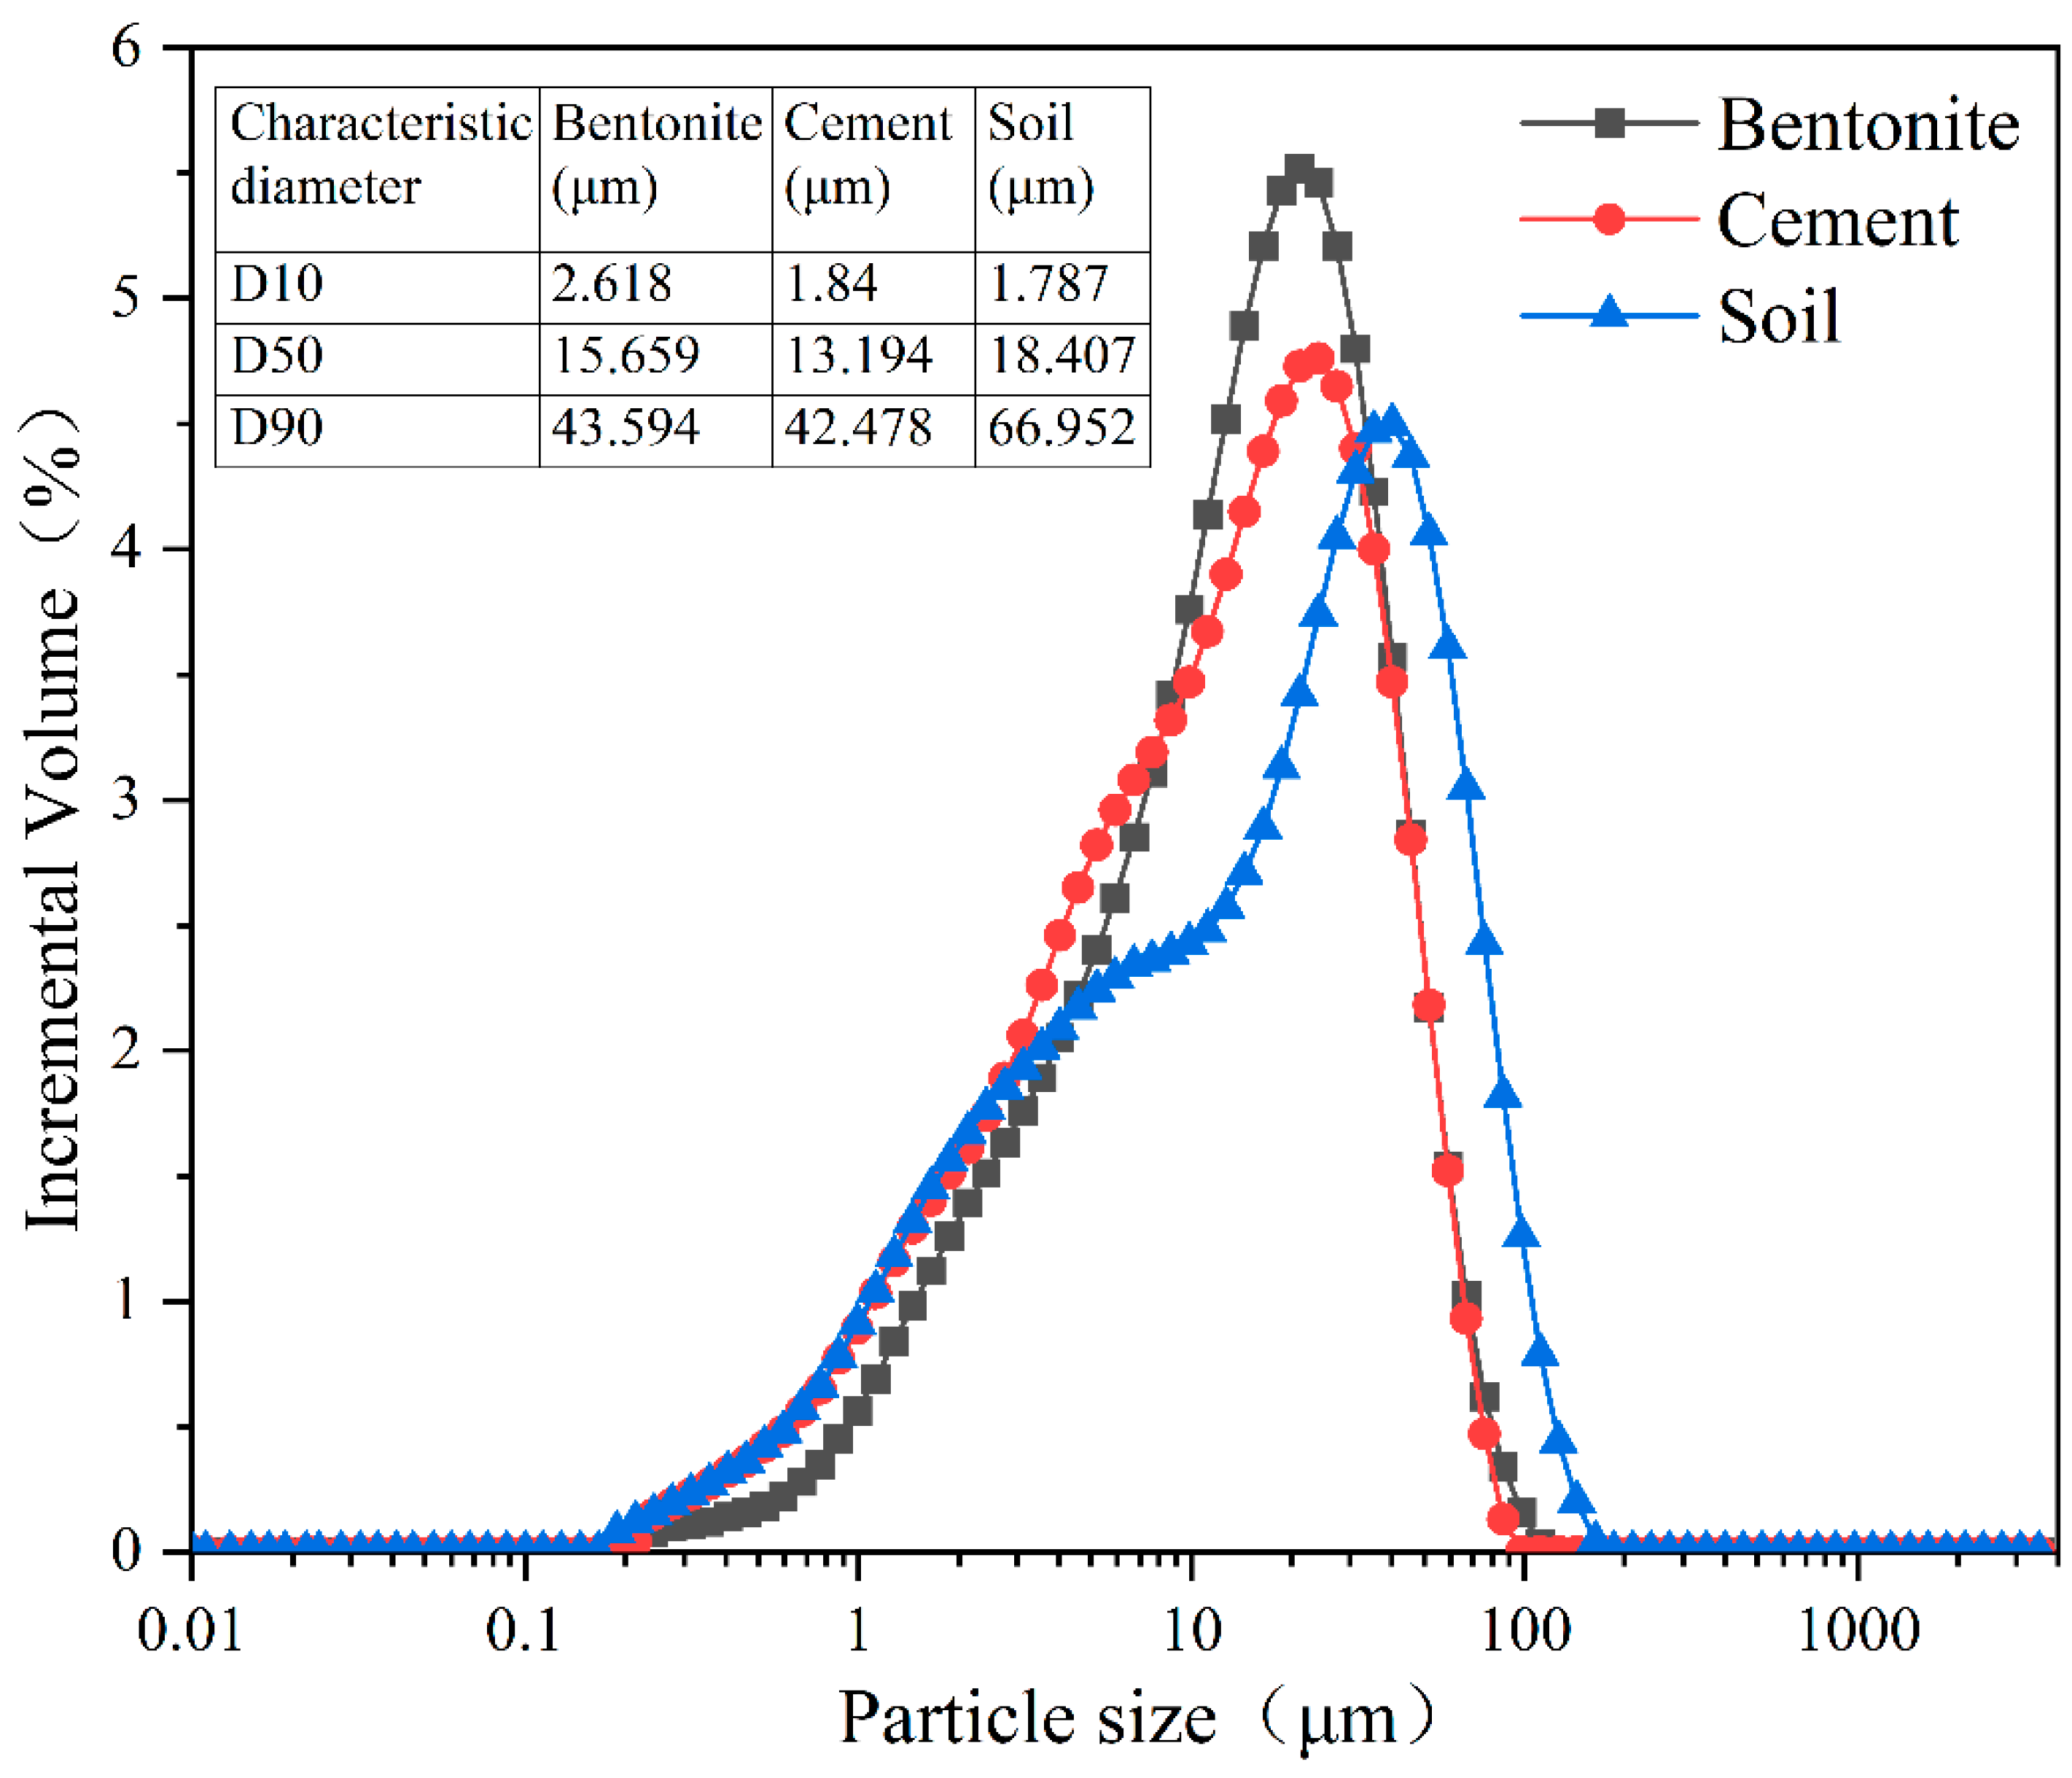
2.1. Materials
2.2. Specimen Preparation and Backfill Mix Design
2.3. Experimental Test
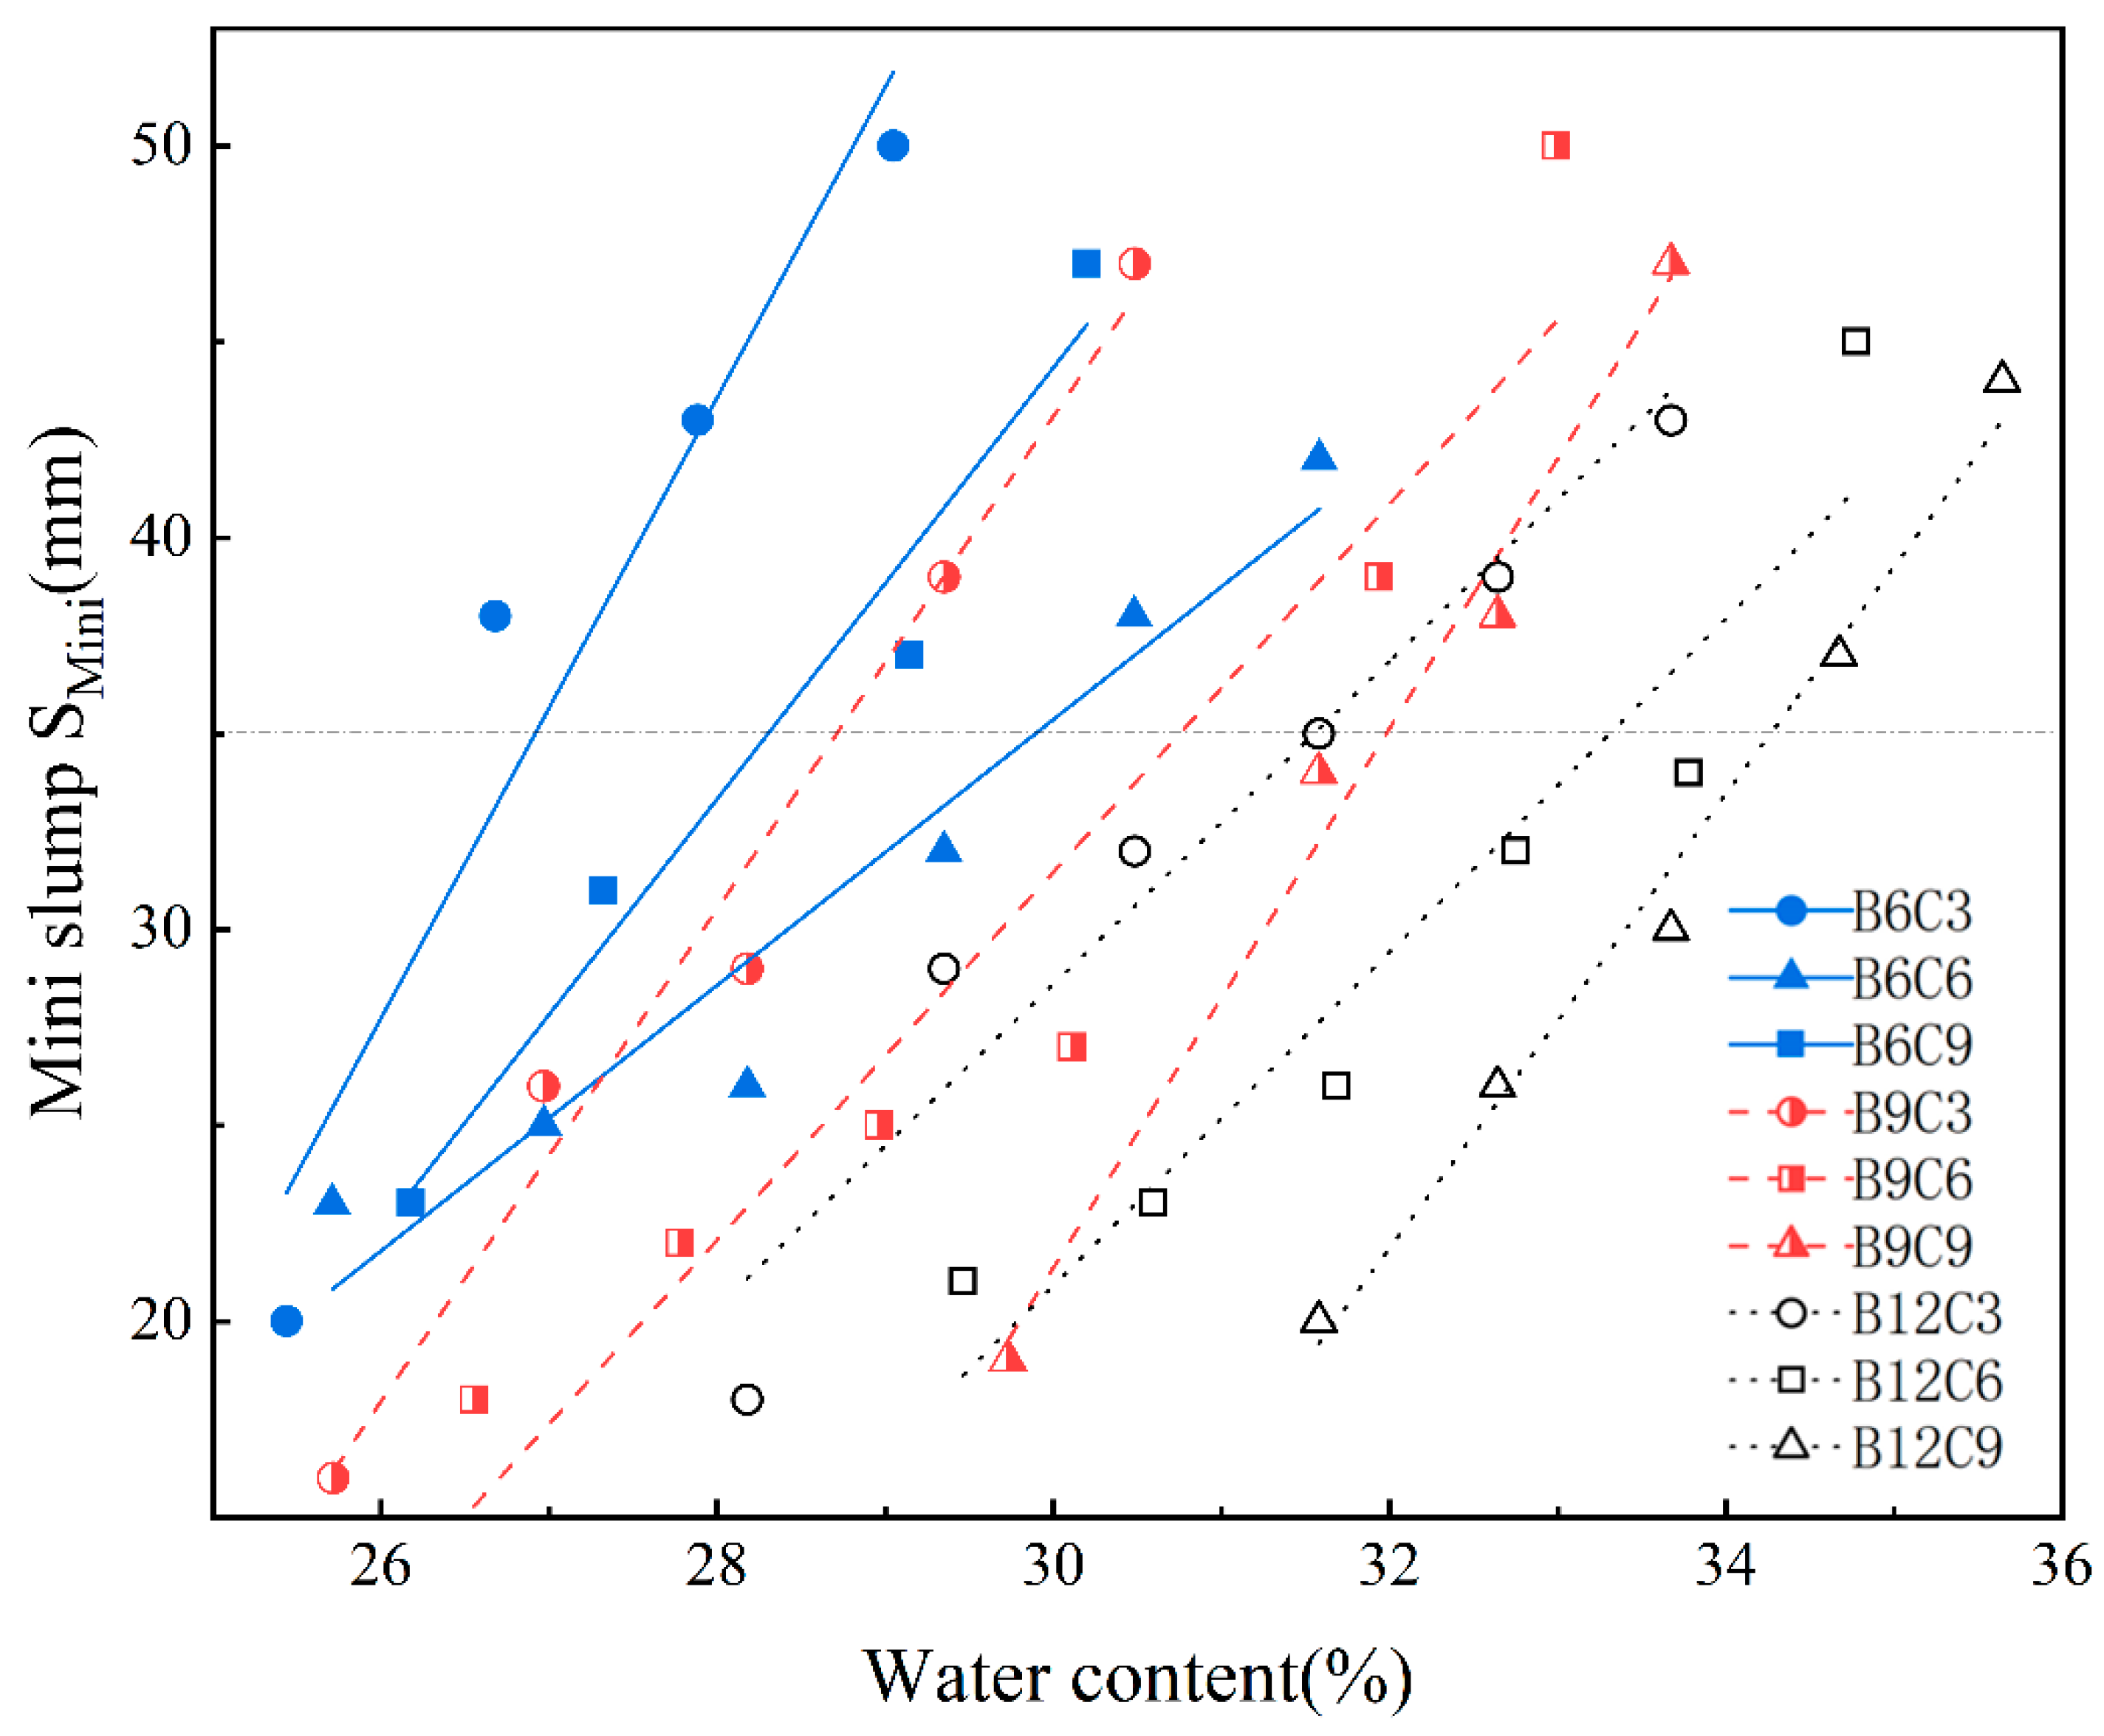
2.3.1. Fluidity Test
2.3.2. UCS Test
2.3.3. Permeability Test
2.3.4. NMR Test
2.3.5. SEM Test
3. Results
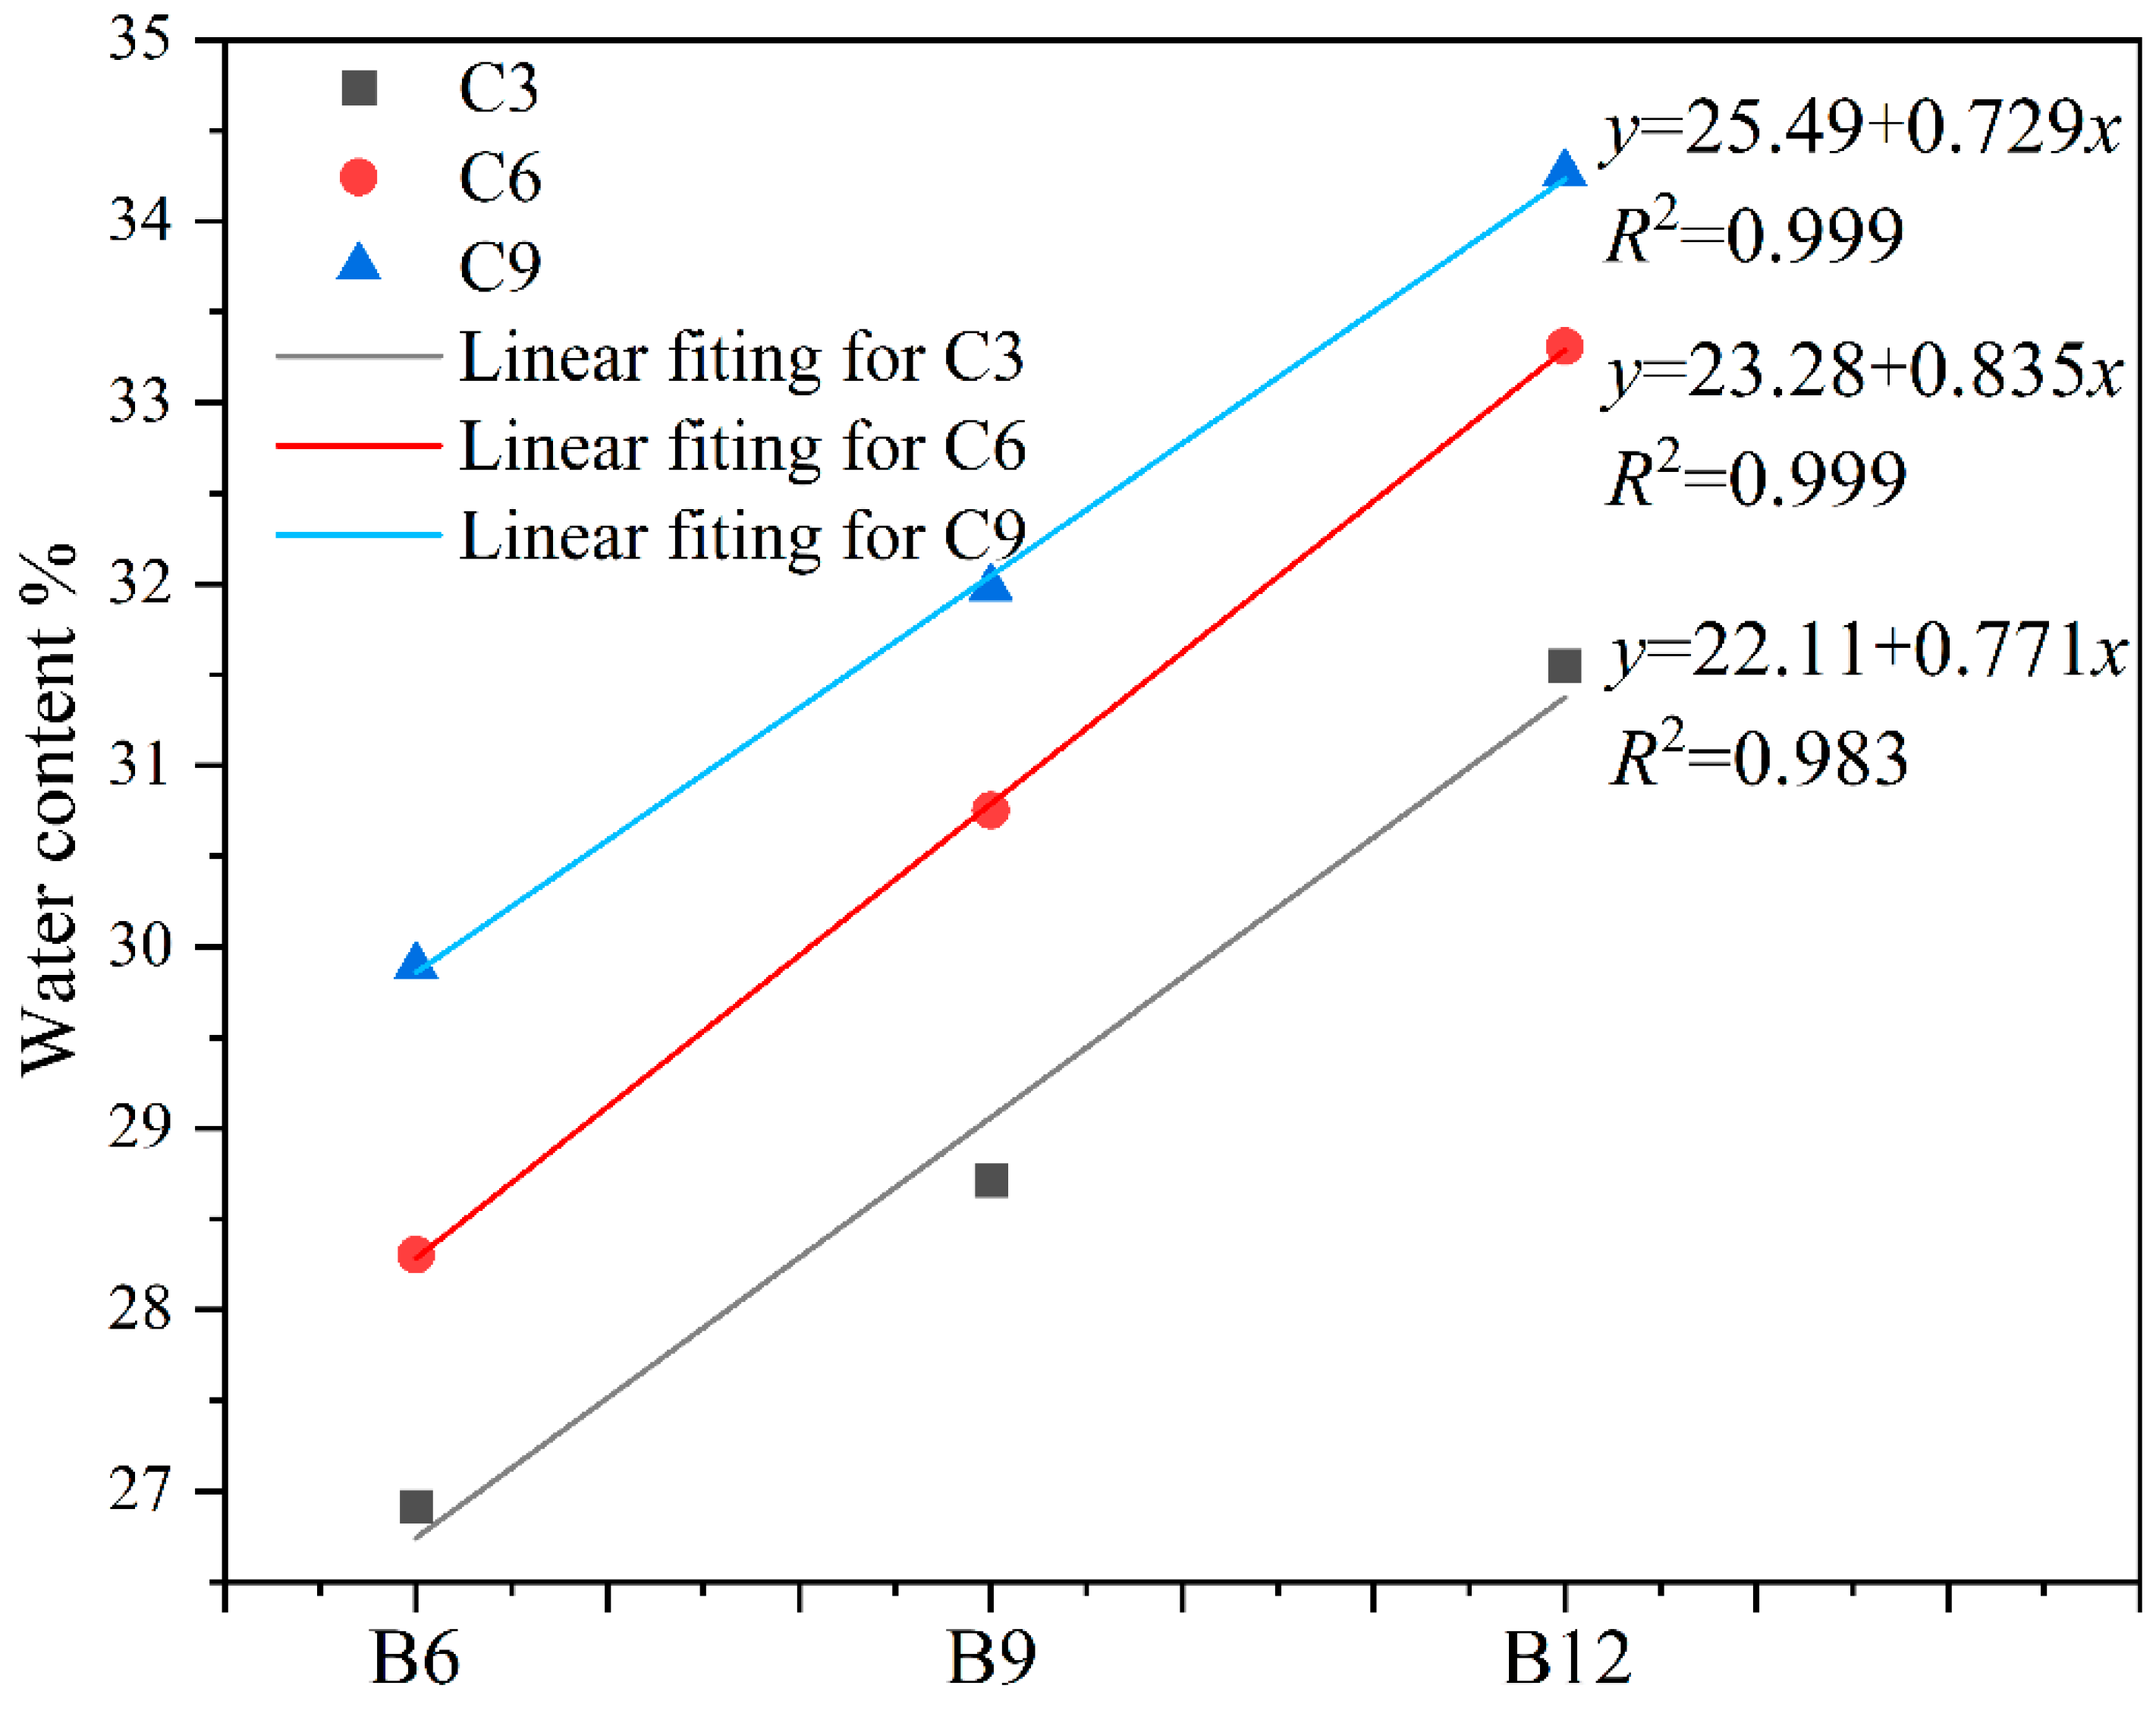
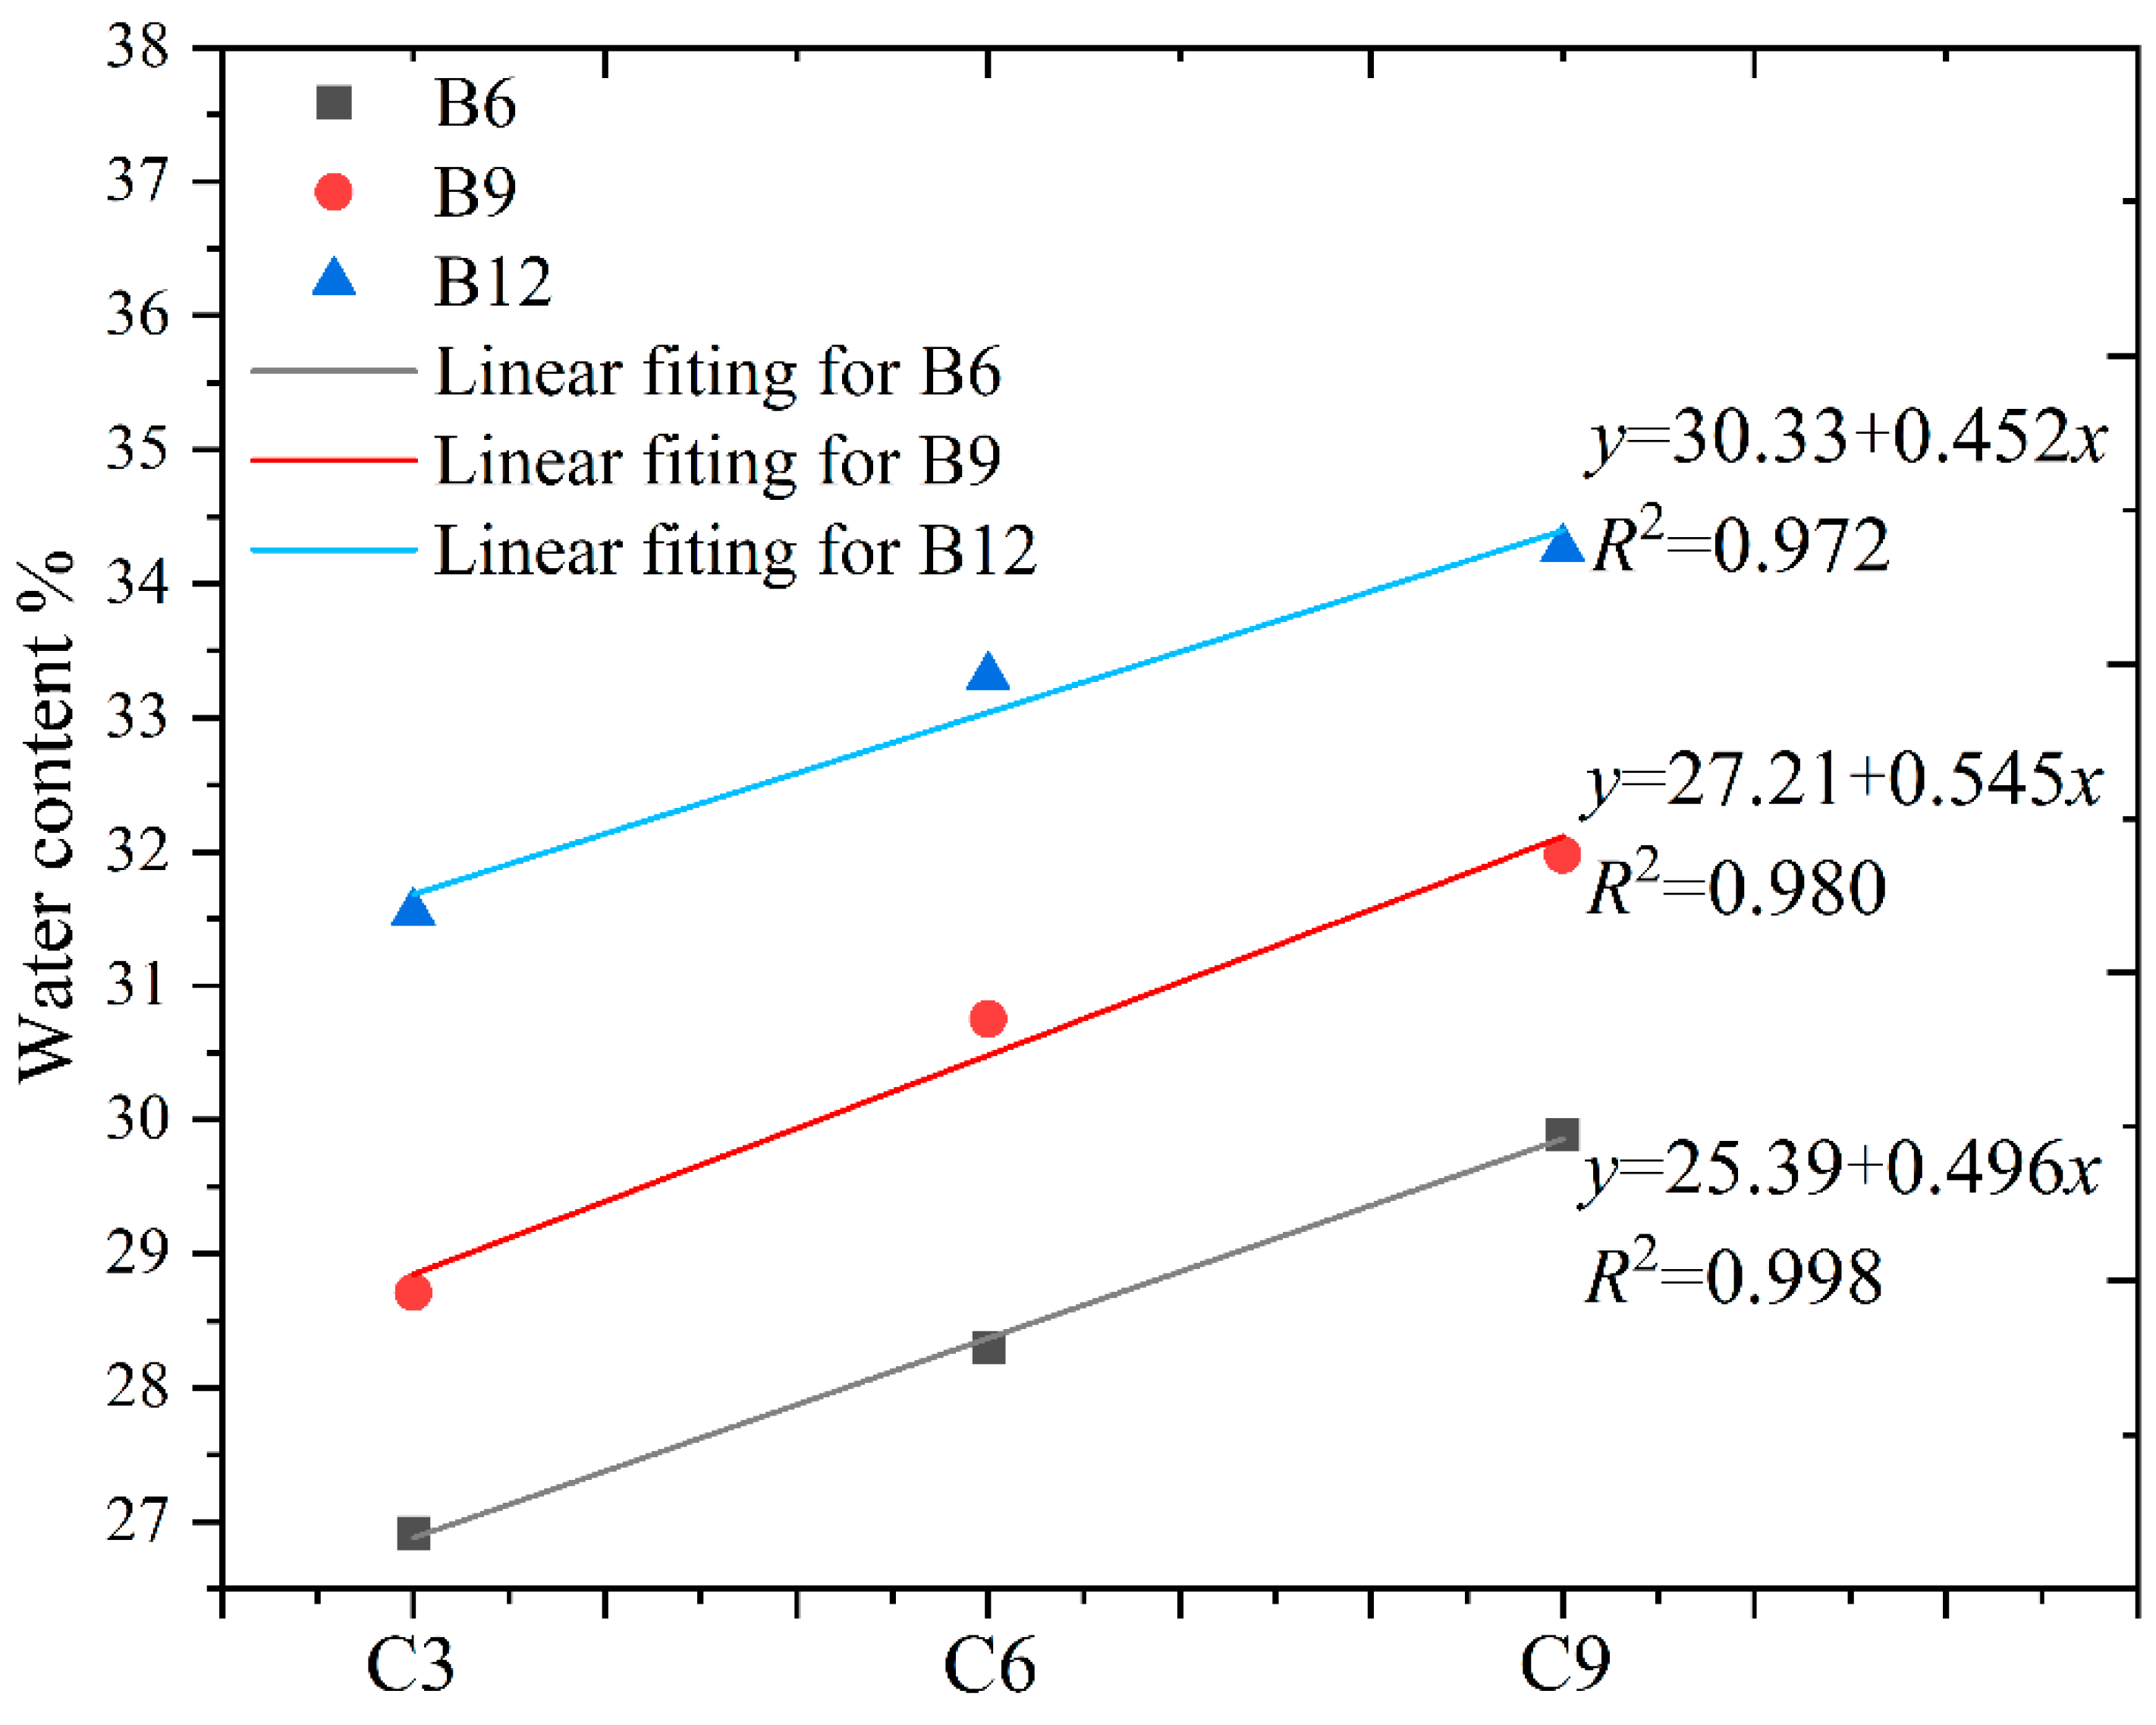
3.1. Effect of Bentonite and Cement on Slurry Water Content
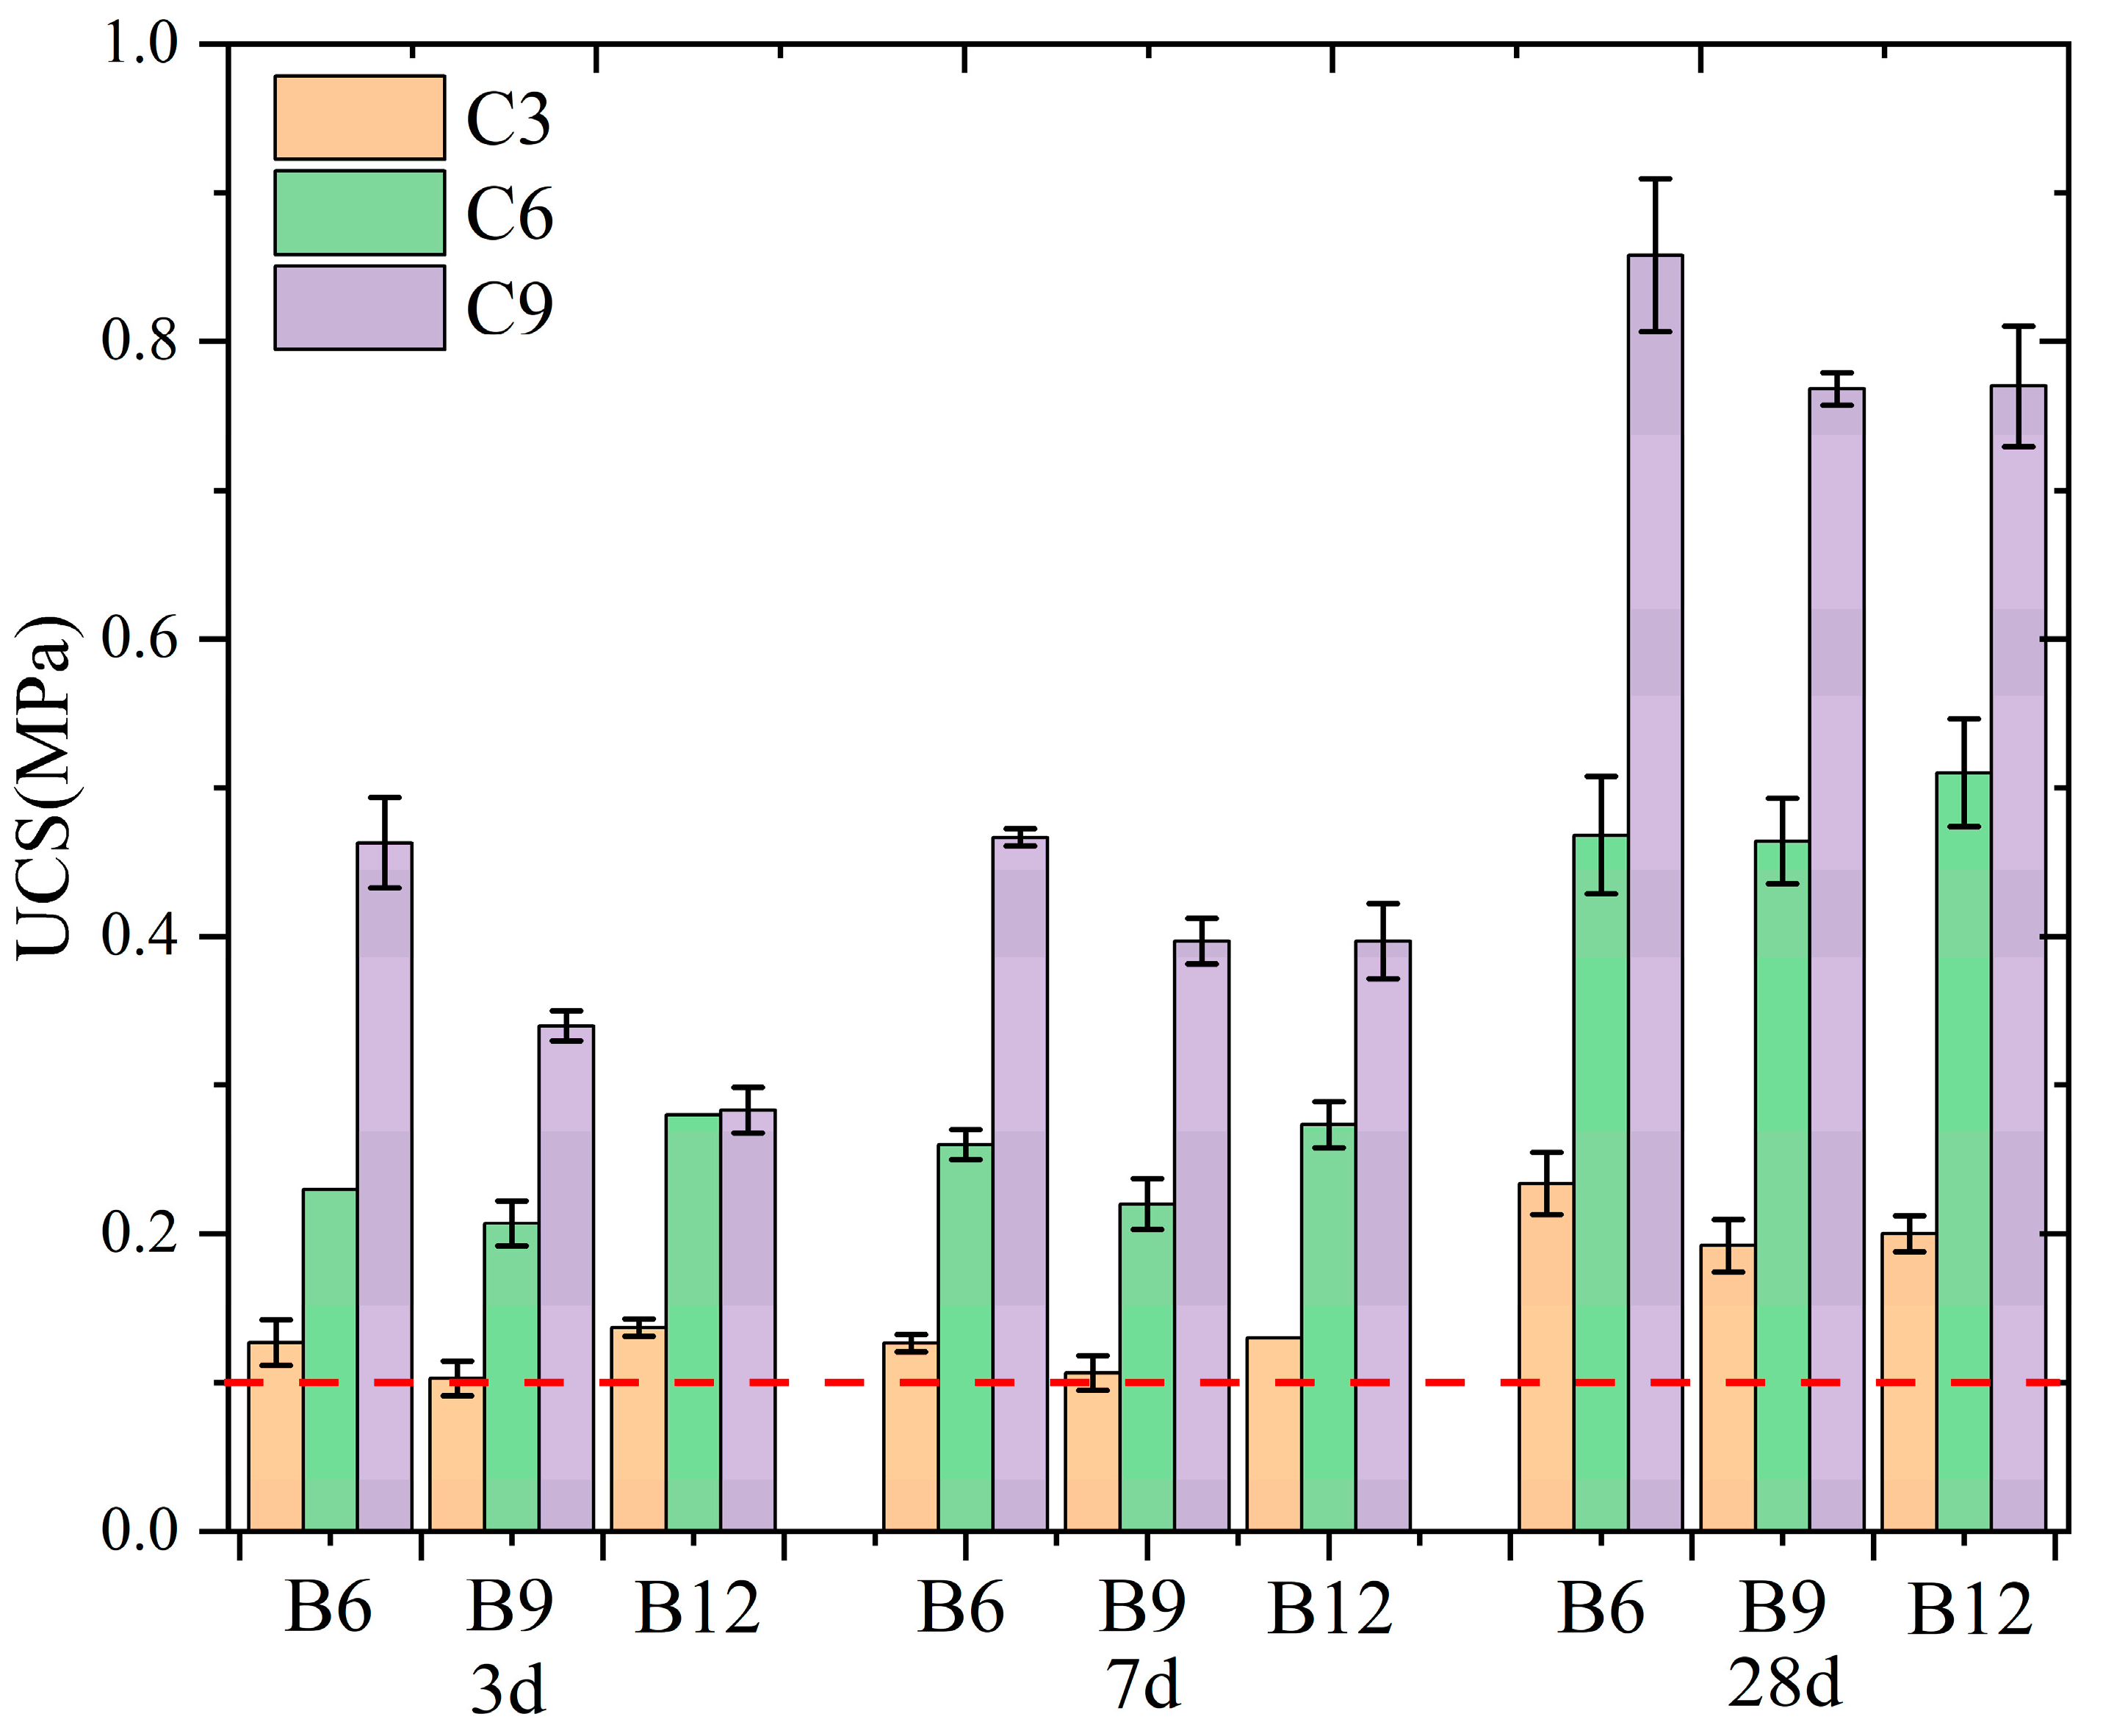
3.2. Strength Properties
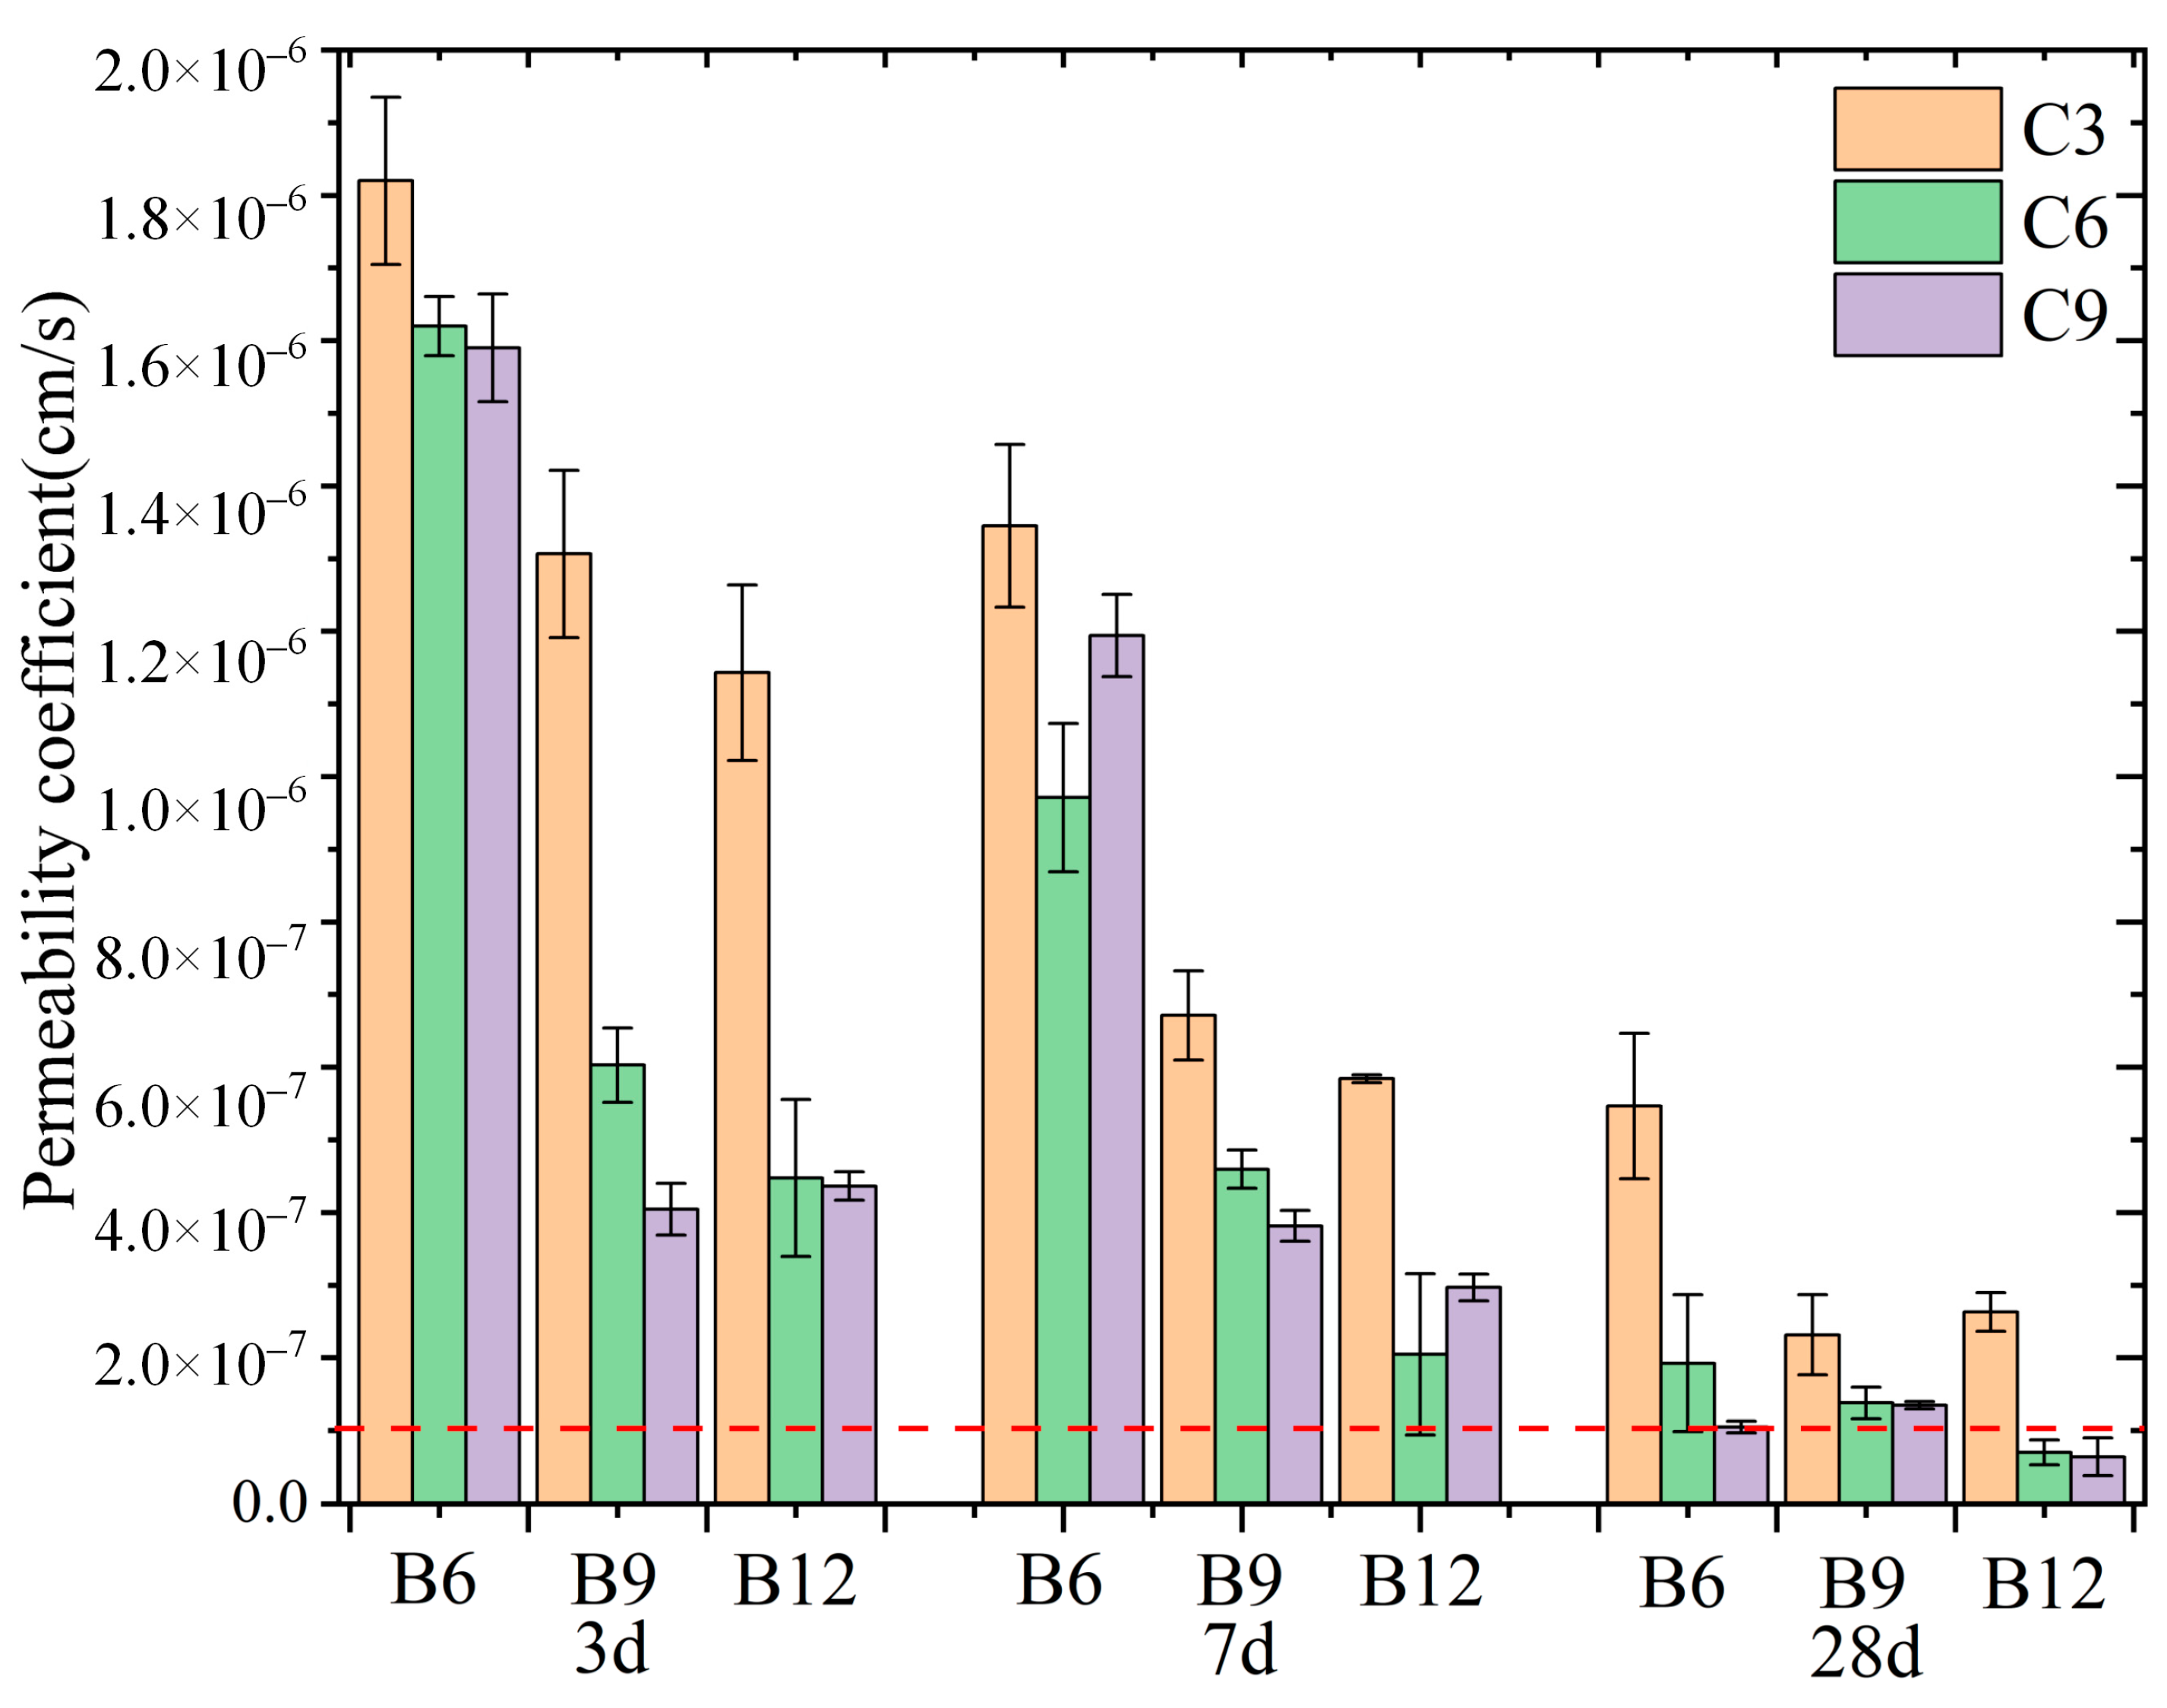
3.3. Permeability
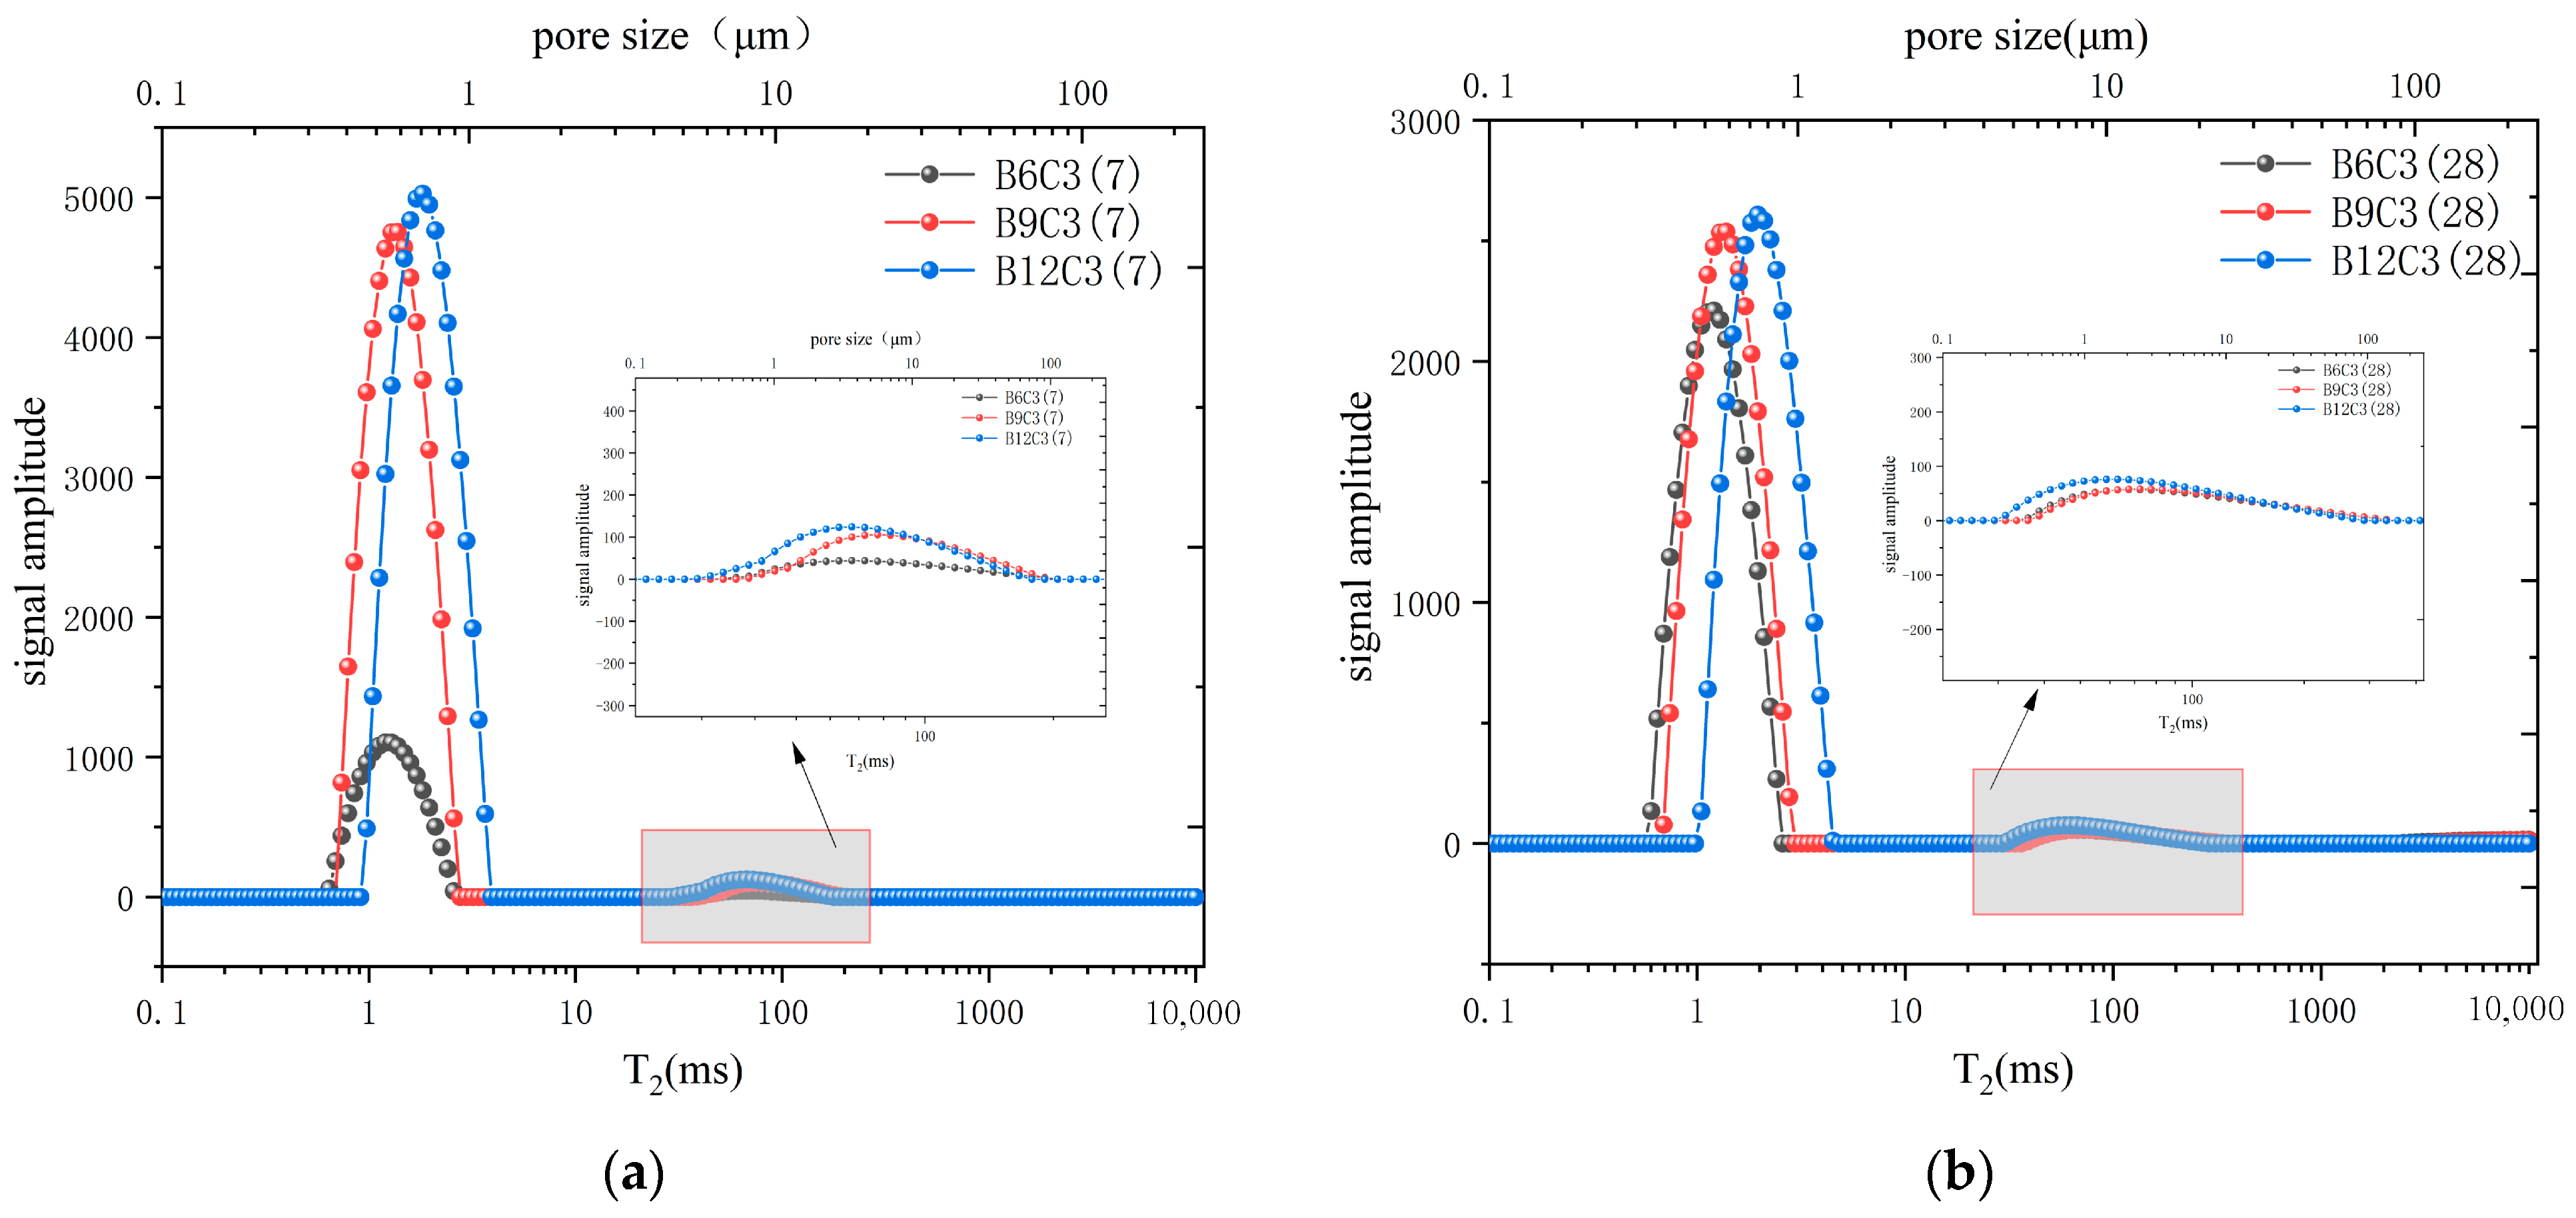
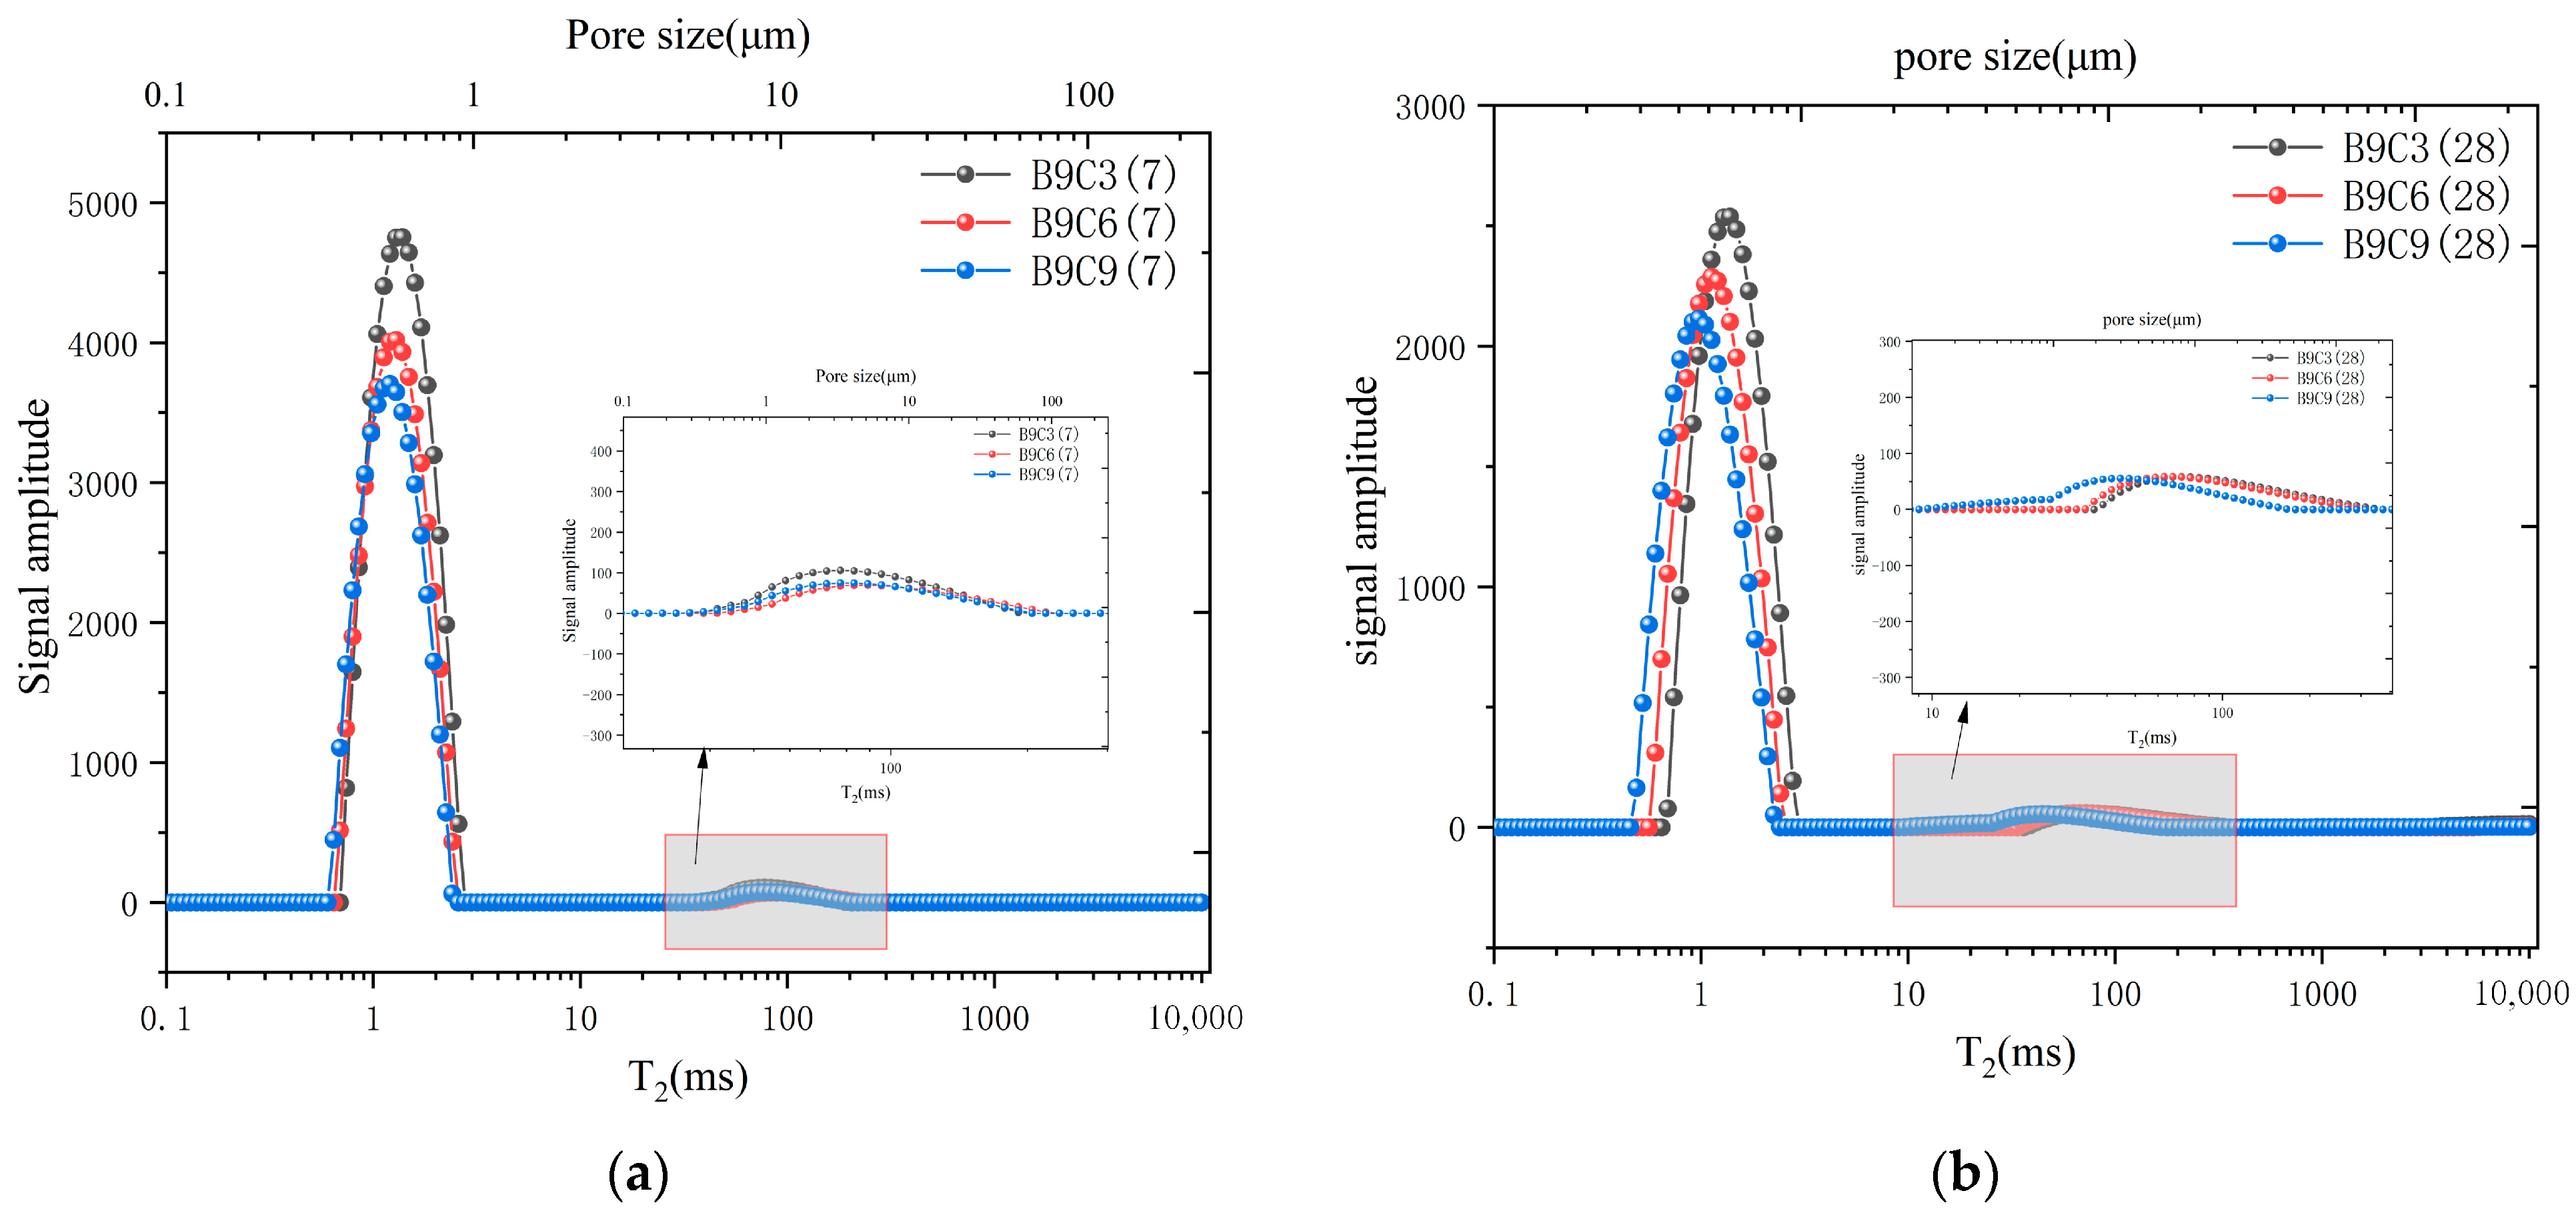
3.4. NMR Test
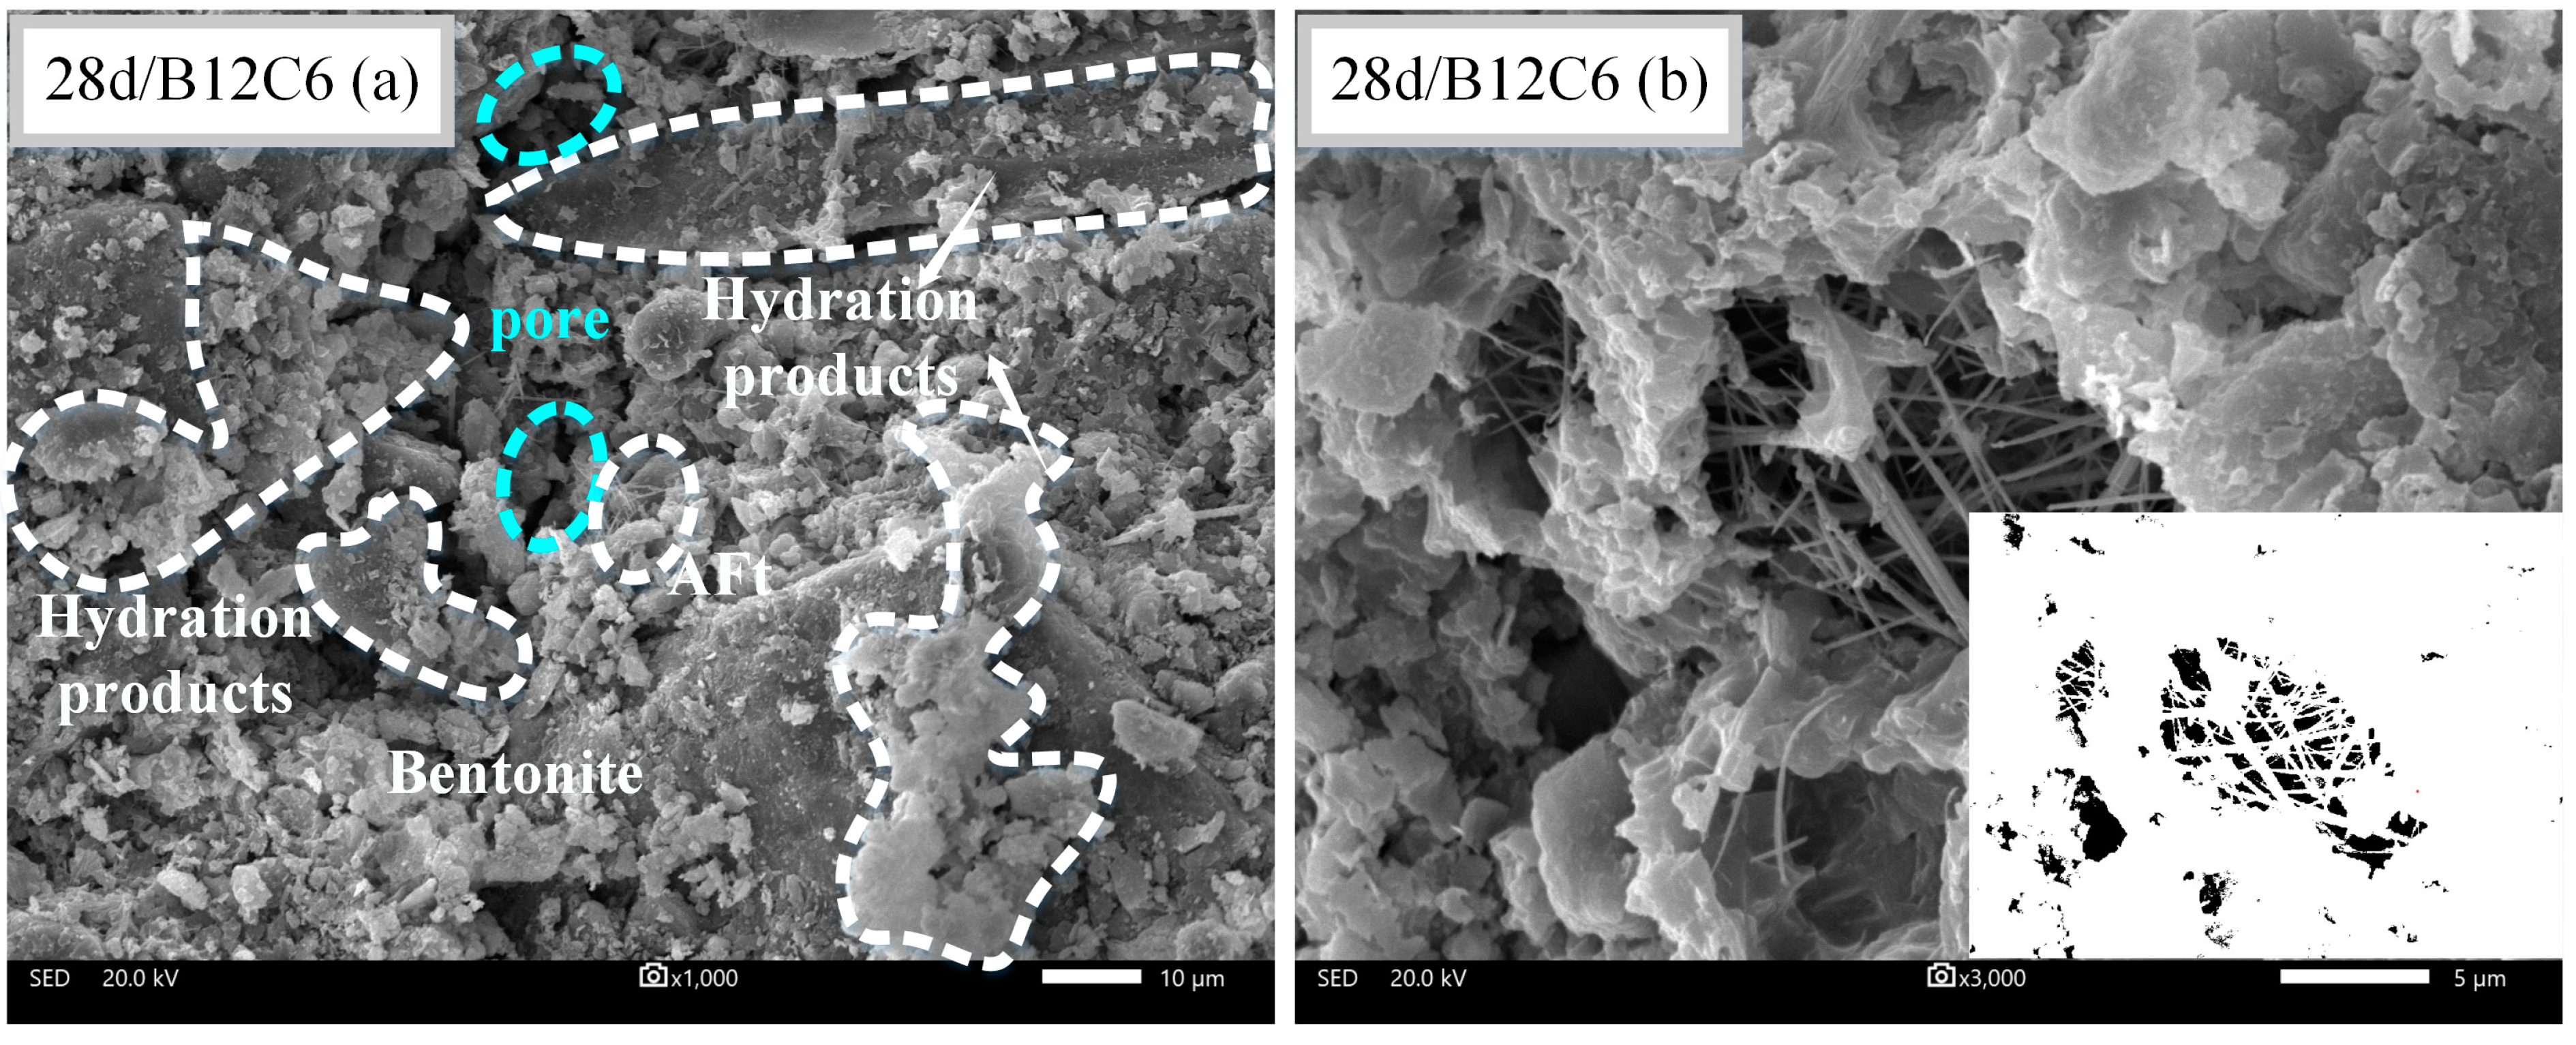
3.5. SEM Observation
4. Analysis and Discussion
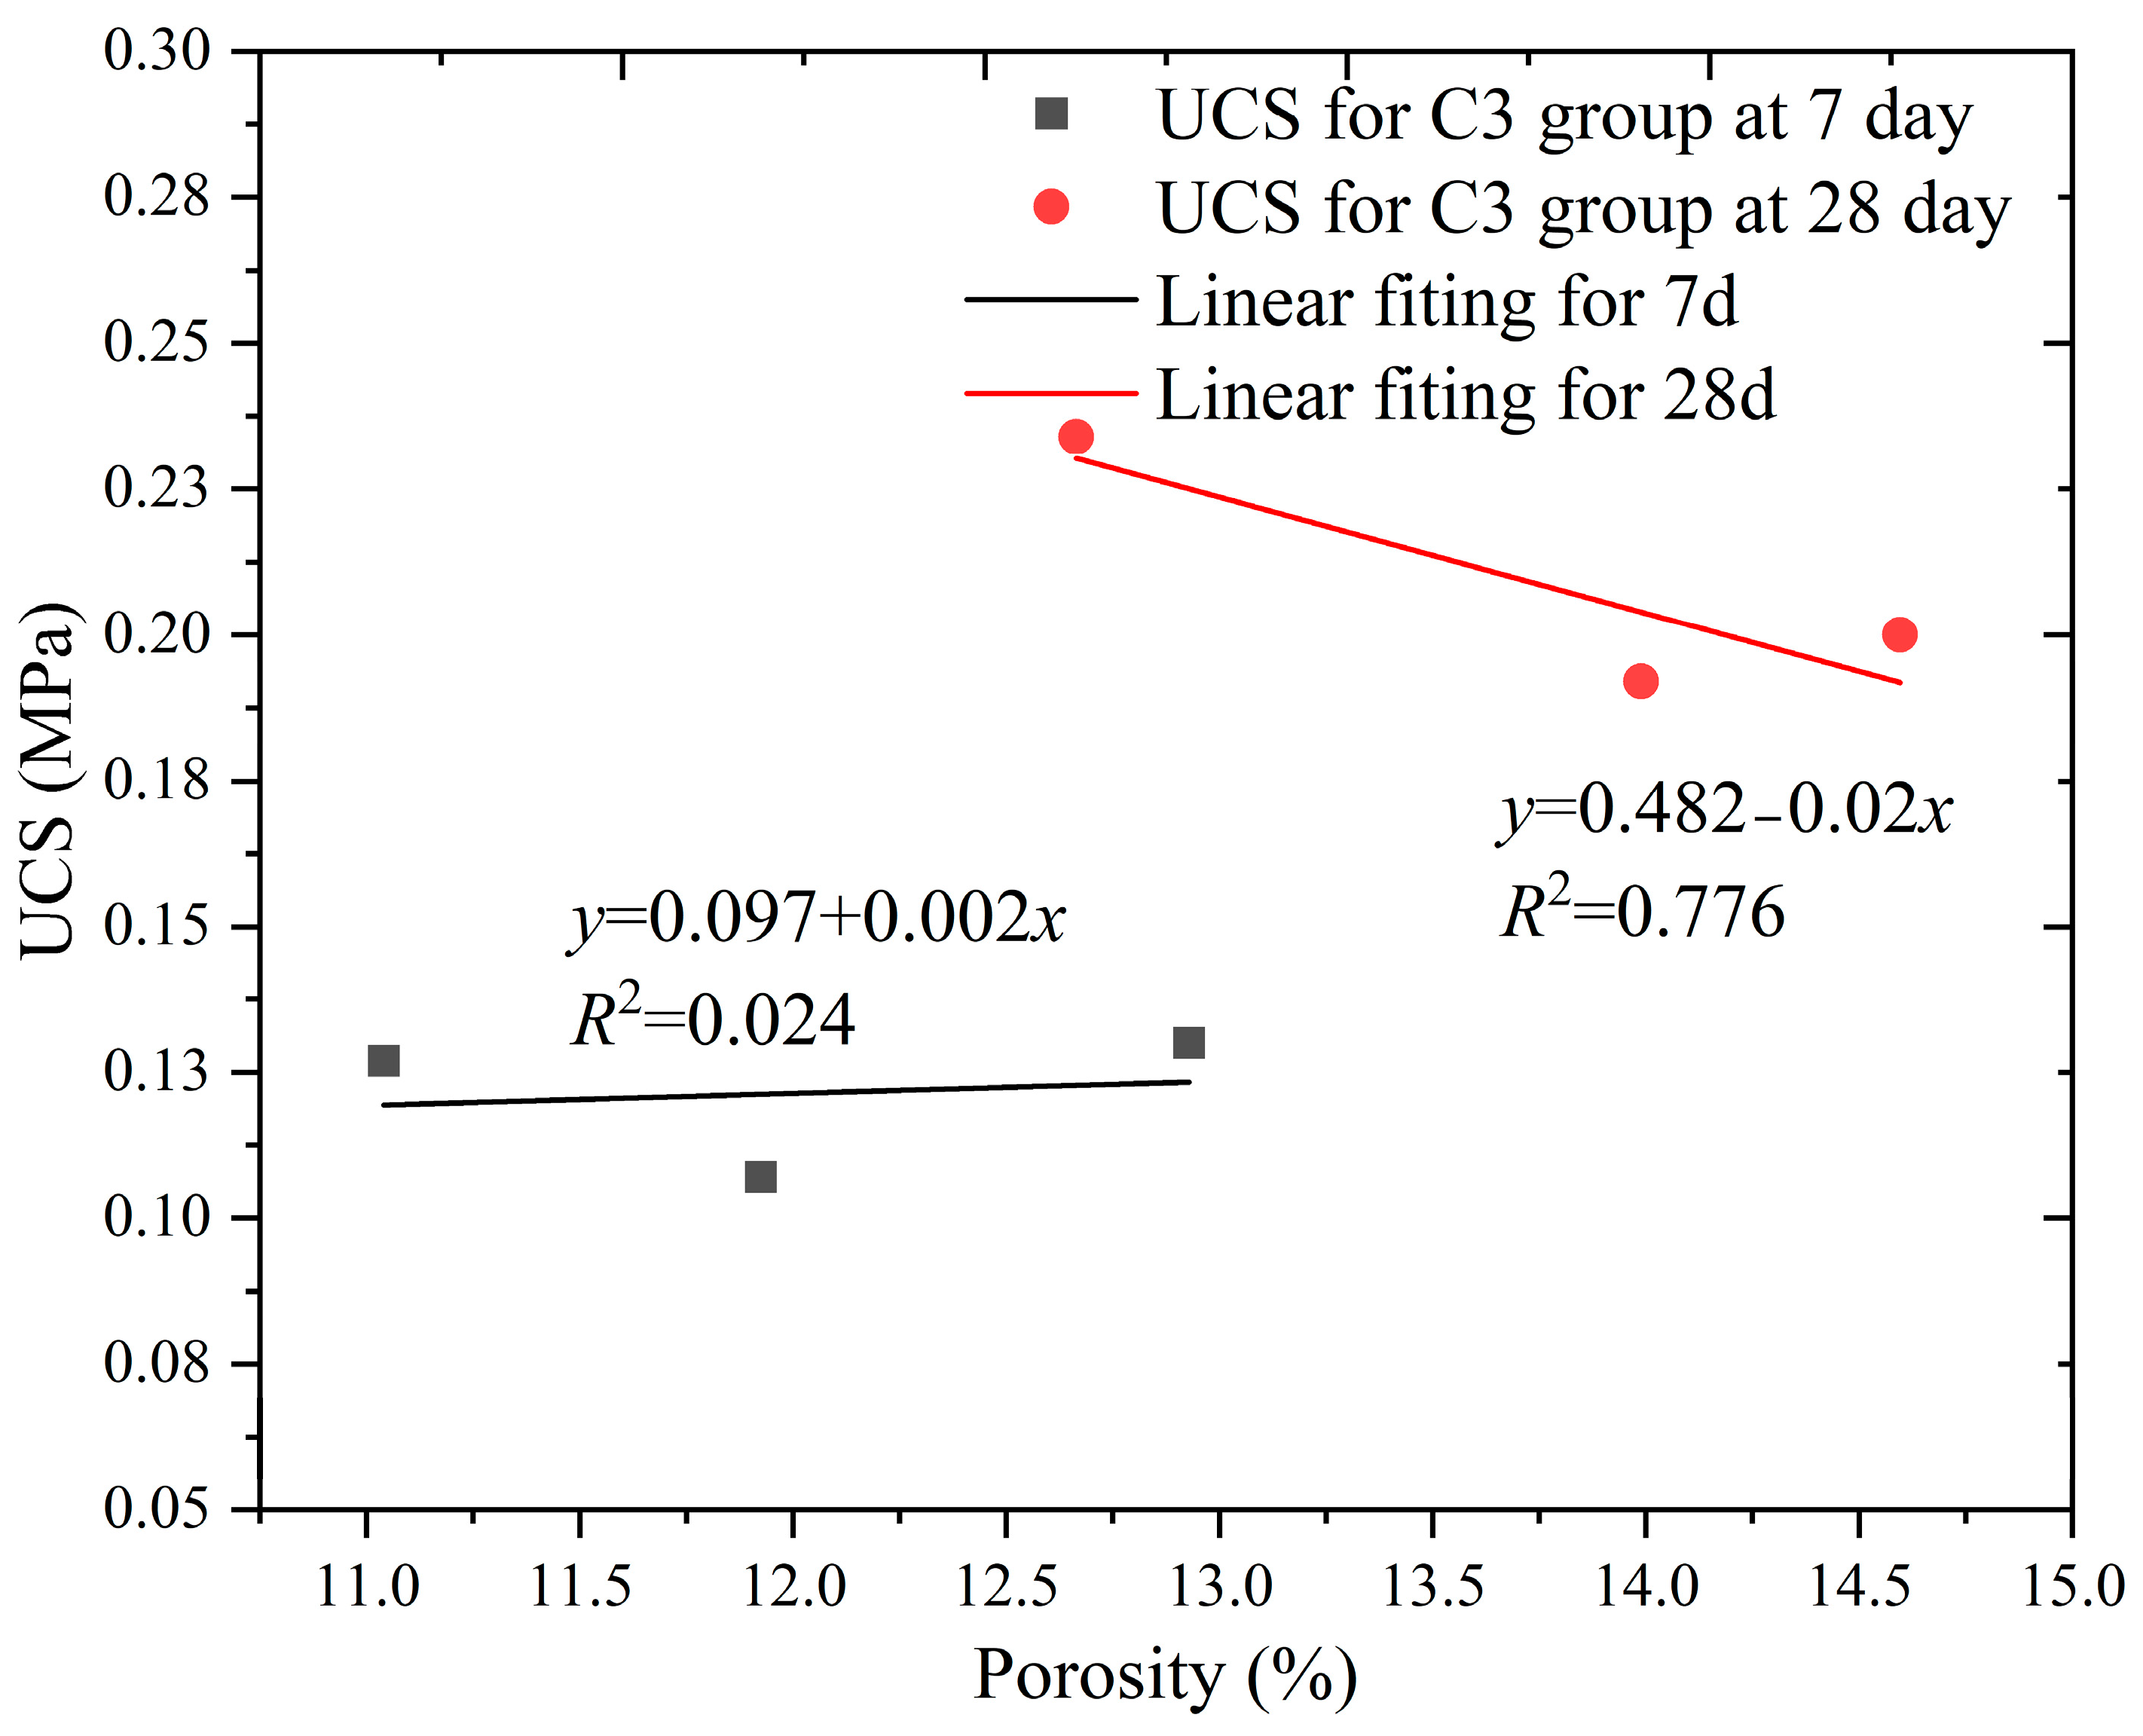
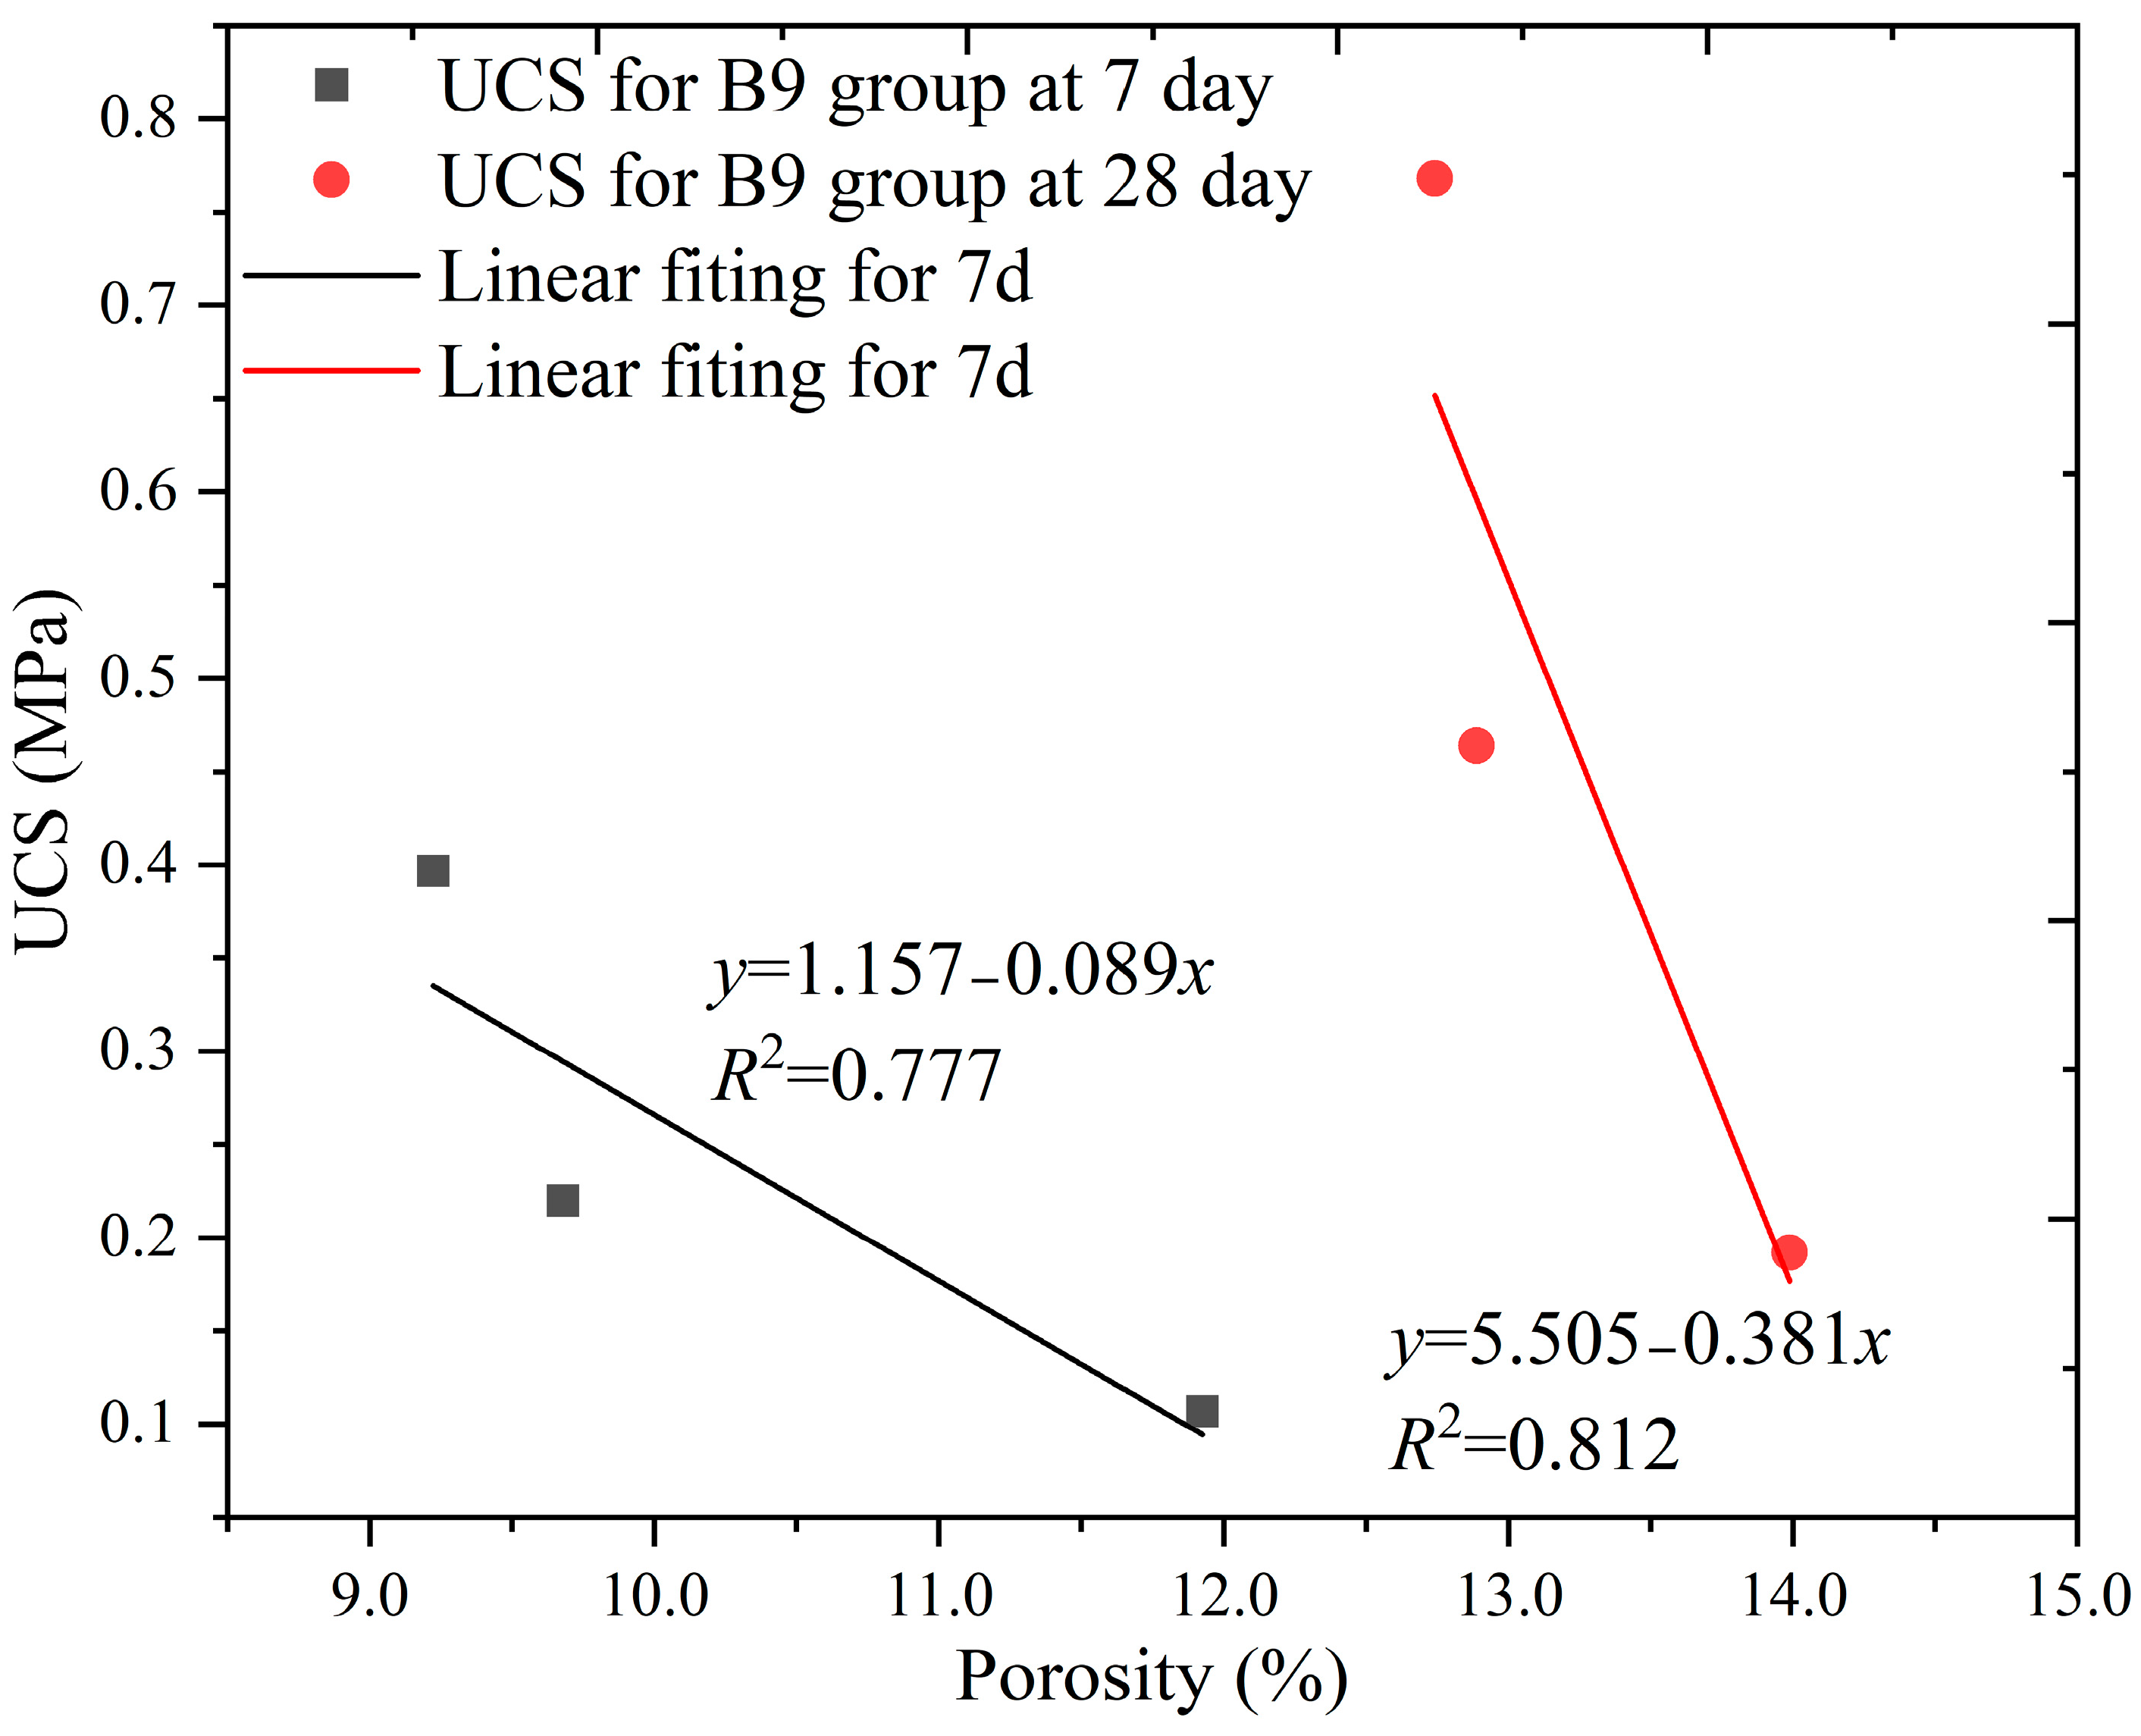
4.1. Relationship between Strength and Porosity
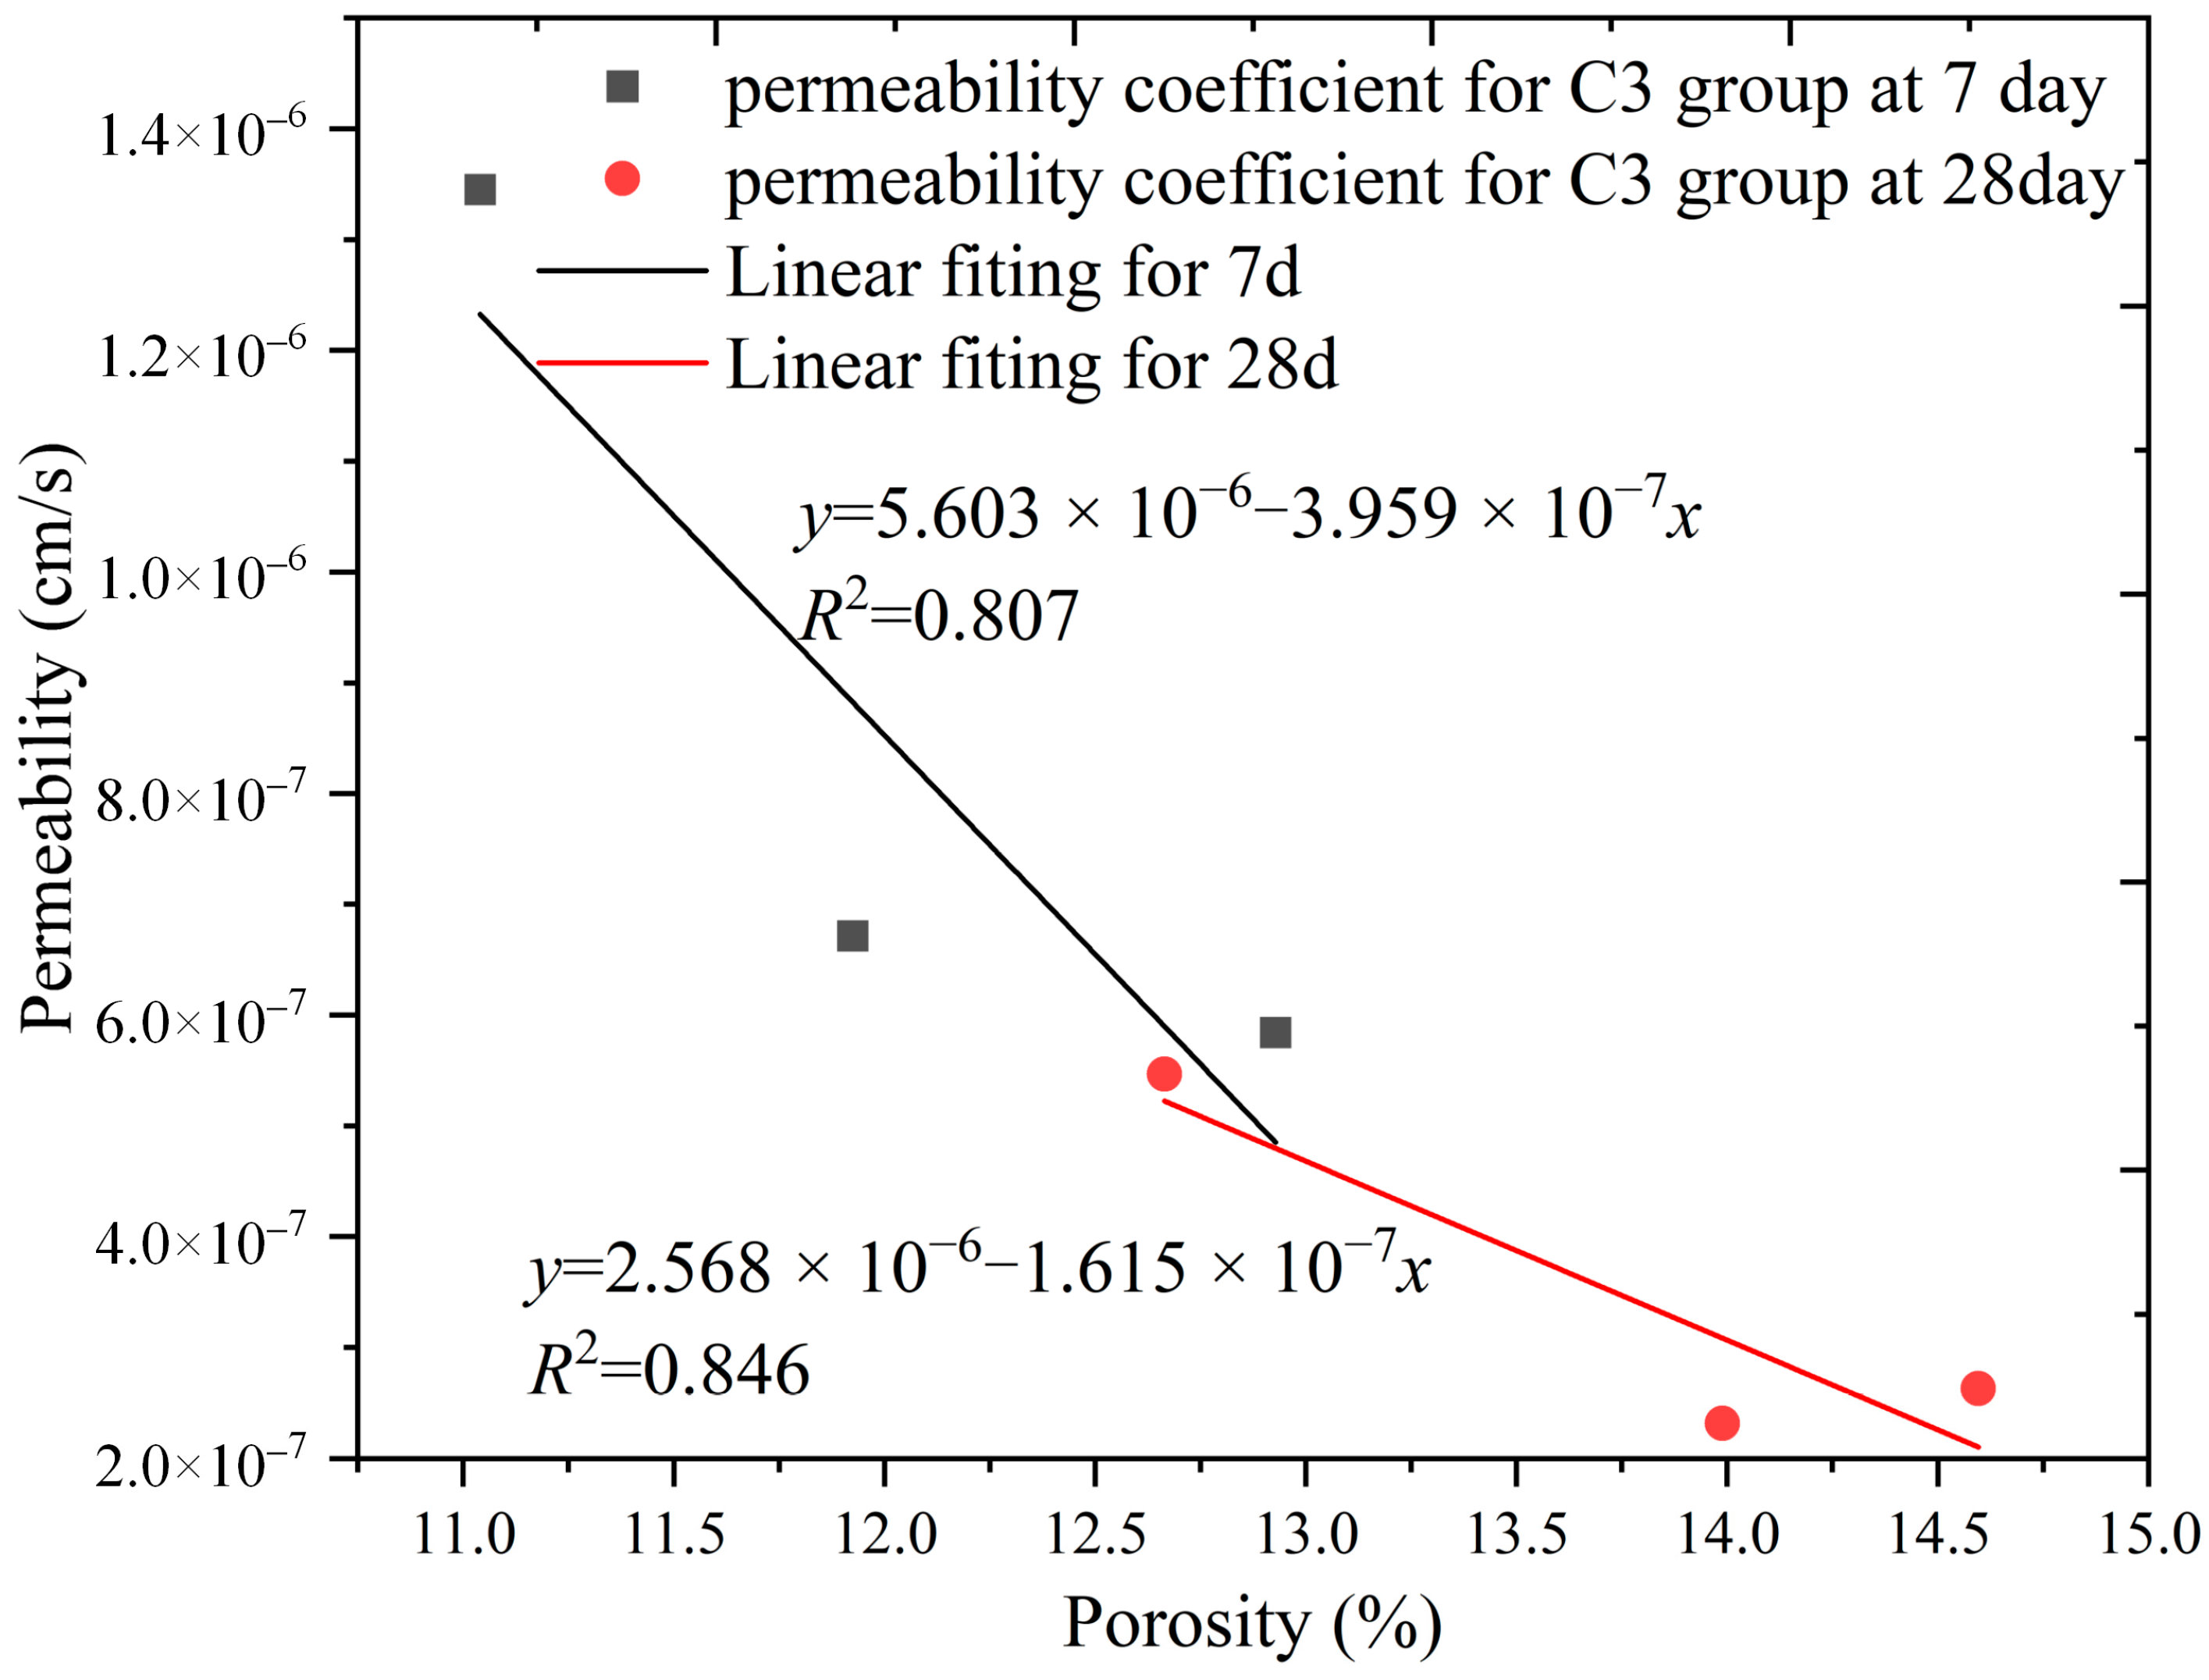
4.2. Relationship between Permeability and Porosity
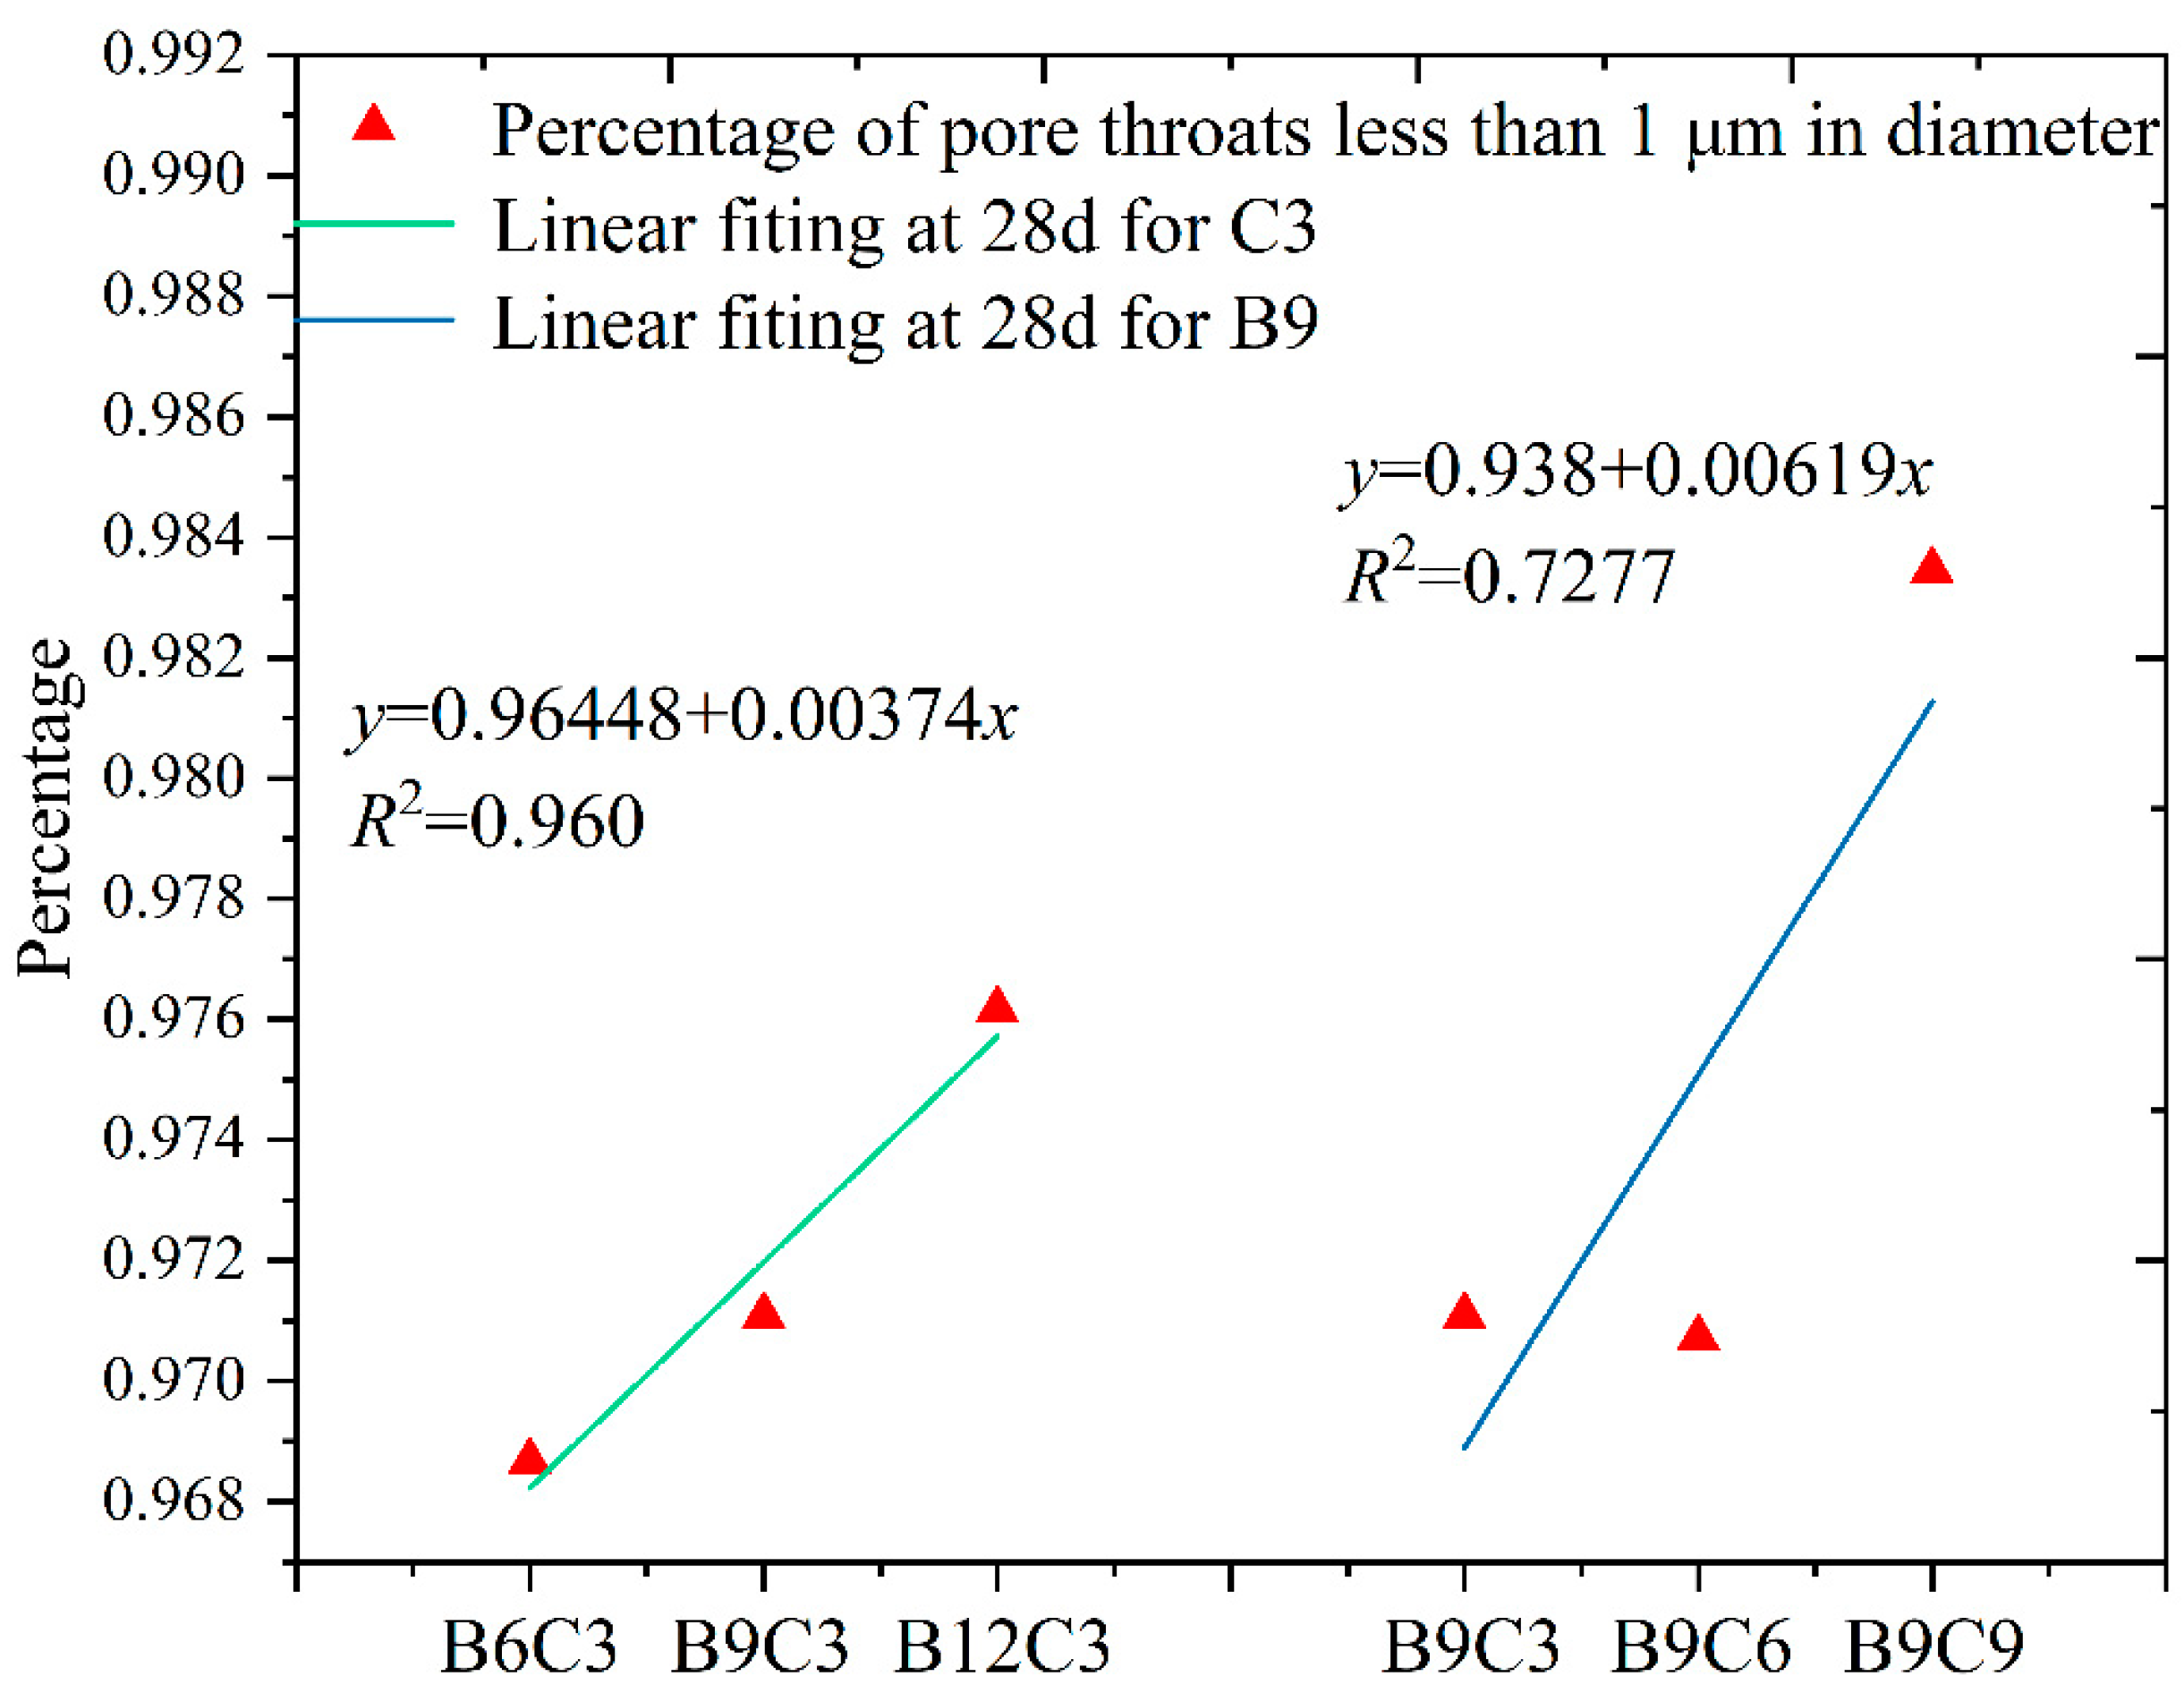
4.3. Pore Throat Analysis
4.4. Engineering Advice
5. Conclusions
- The initial water content of the material increases with the increase in bentonite and cement content. Taking group B9 as an example, under similar fluidity, when the cement content increased from 3% to 9%, the water content of the slurry increased from 28.71% to 31.98%. Similarly, taking group C3 as an example, when the bentonite content increased from 6% to 12%, the water content of the slurry increased from 26.92% to 31.55%. By comparison, it can be seen that bentonite has a greater impact on the initial water content.
- The strength of backfill soil increased with the increase in cement content. When the cement content increased from 3% to 6%, the increase in strength was greater than that from 6% to 9%. Taking group B12 as an example, the average ucs of groups C6 and C9 were 123.2% and 32.4% higher than those of groups C3 and C6, respectively. With the increase in bentonite content, the strength of backfill soil did not increase significantly. With the increase in cement and bentonite content, the permeability of SCB backfill showed a downward trend, which decreased faster at first and then becomes slower. Generally speaking, due to the interaction between cement and bentonite in the curing process of backfill soil, the change in engineering performance was not proportional to the increase in dosage. Based on the criteria of the strength and permeability coefficient (UCS > 100 kPa, 28 days permeability coefficient <1 × 10⁻⁷ cm/s), group B12C9 was found to be more suitable for practical engineering applications.
- When the fluidity was maintained at a constant, the increase in bentonite expanded the pore size distribution range of the large pores in the SCB backfill, reduced the pore size of the large pores, and increased the number of small pores. An increase in the cement content reduced the number of large and small pores and their diameters.
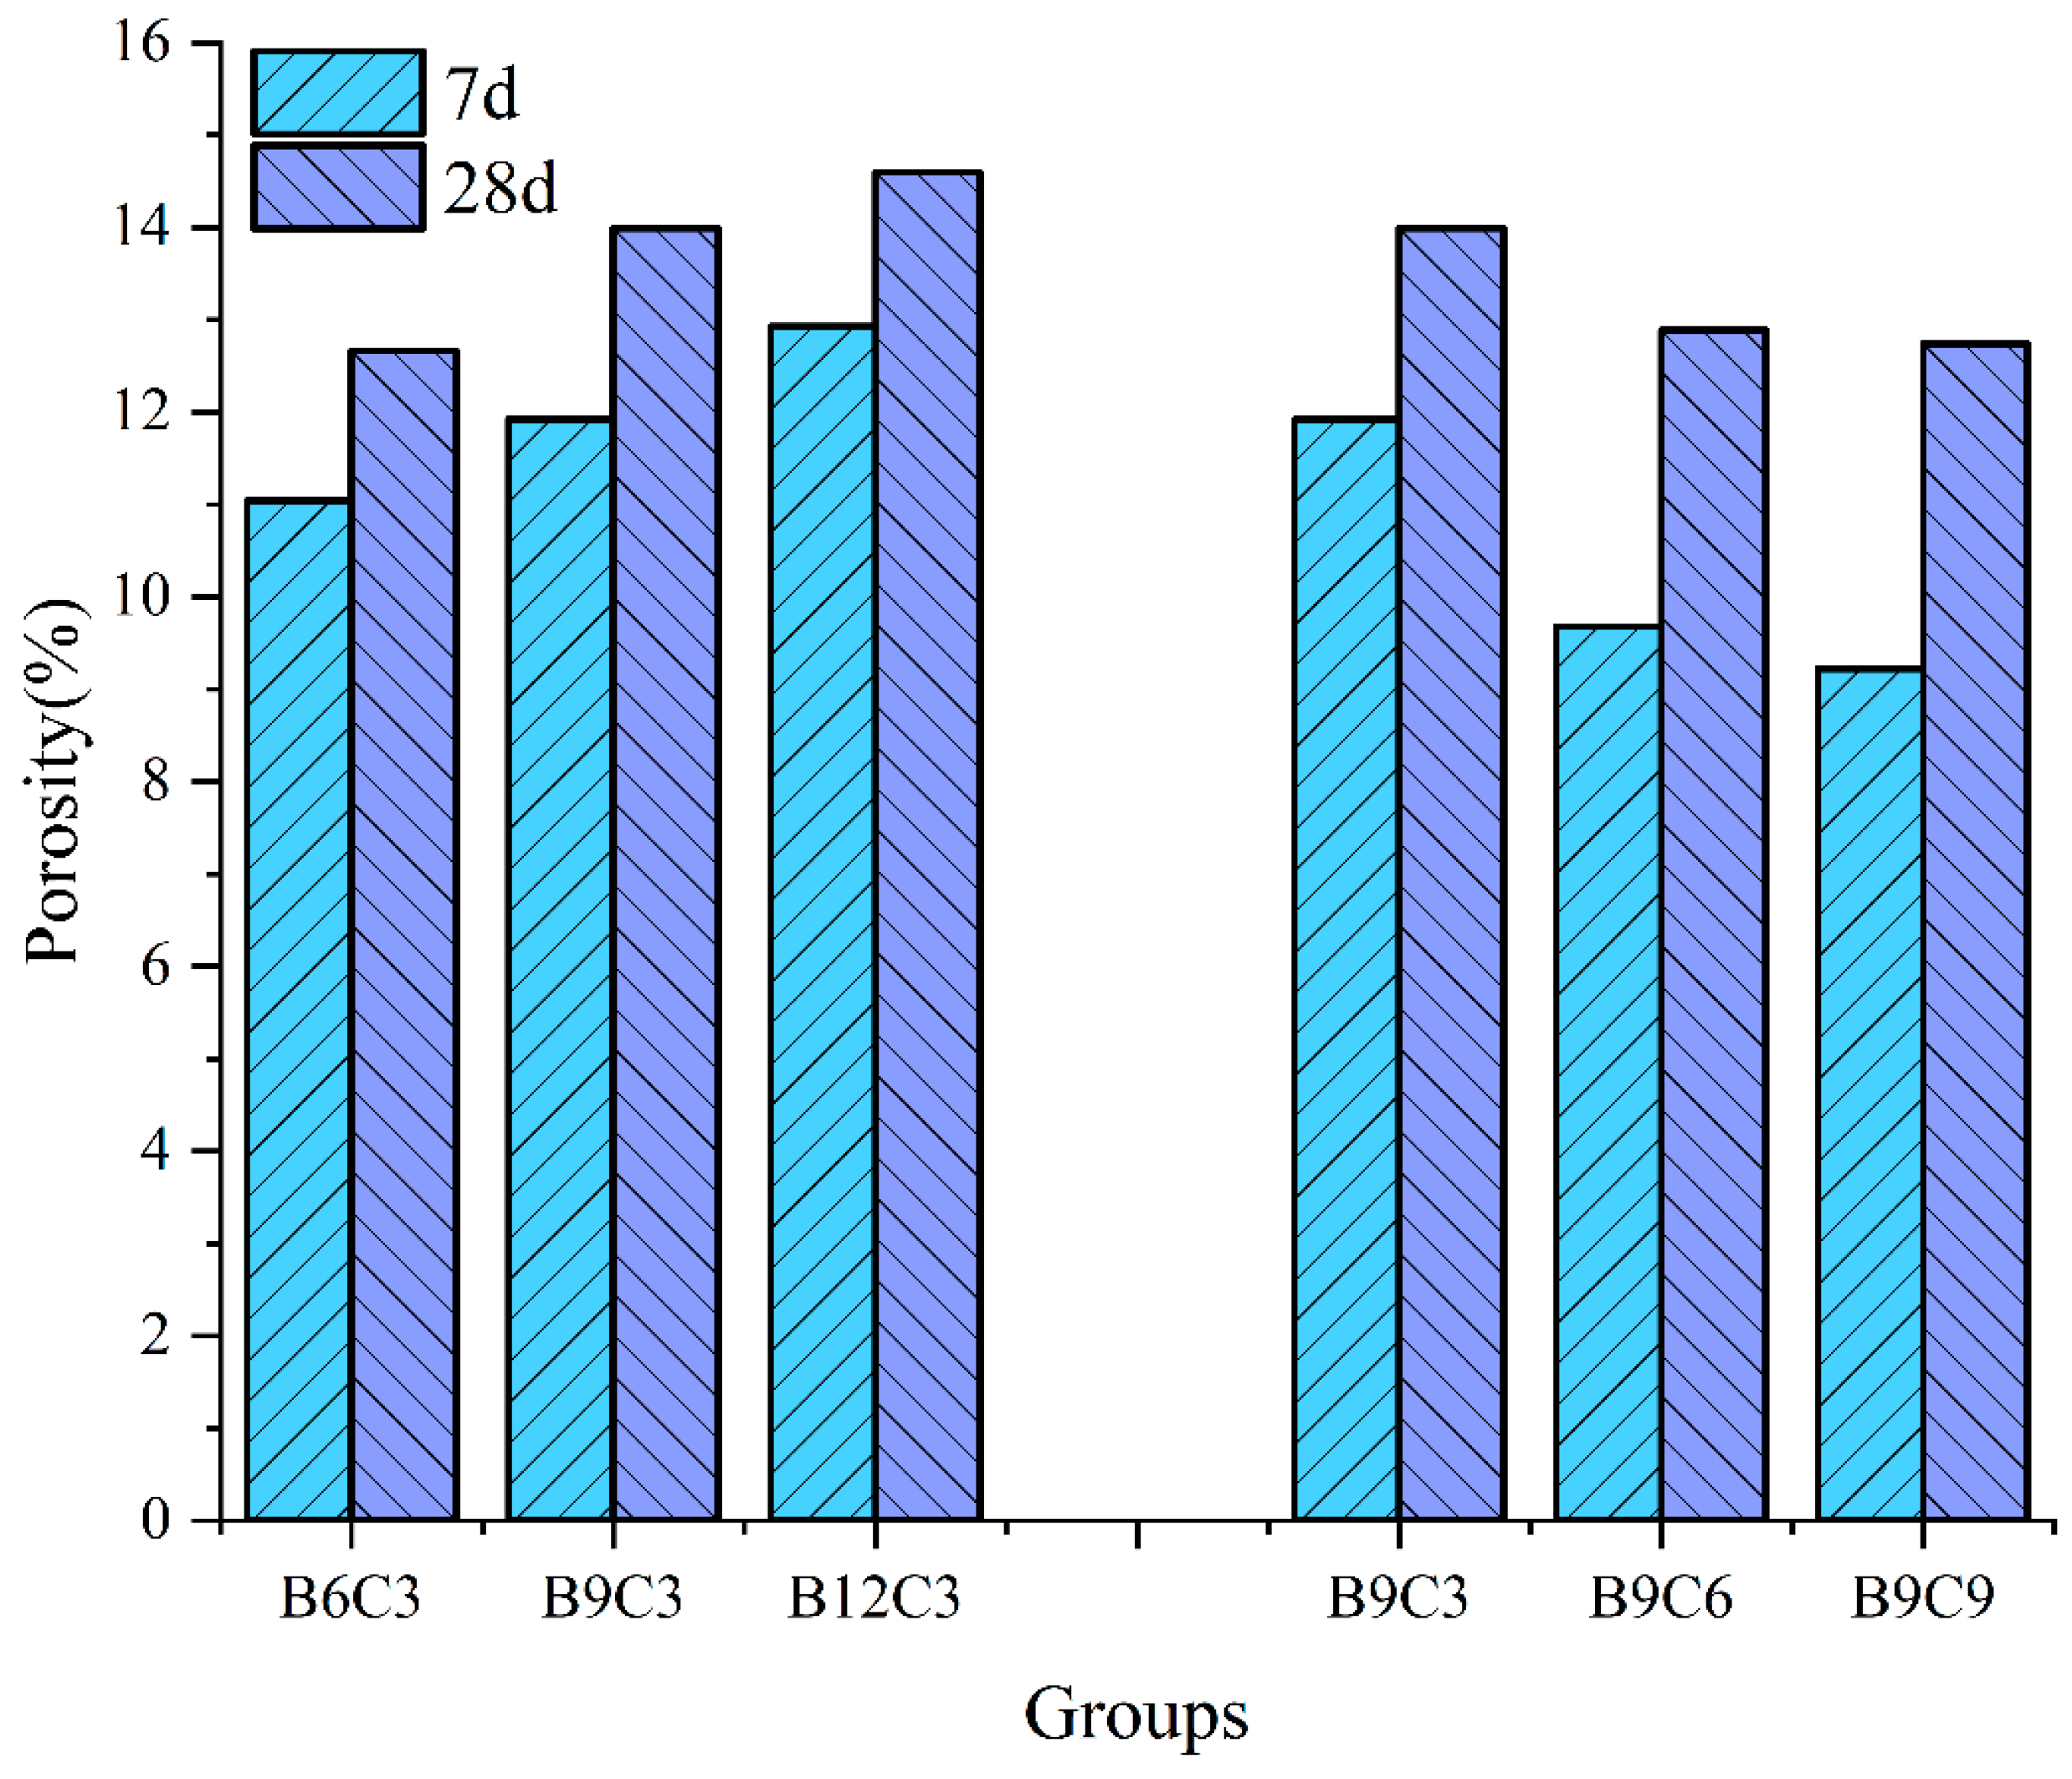
- The bentonite and cement had opposite effects on the porosity of the SCB backfill. The addition of bentonite promoted an increase in the porosity of the SCB backfill because the initial water content of the SCB backfill with a higher bentonite content was higher. A higher initial water content increased the initial porosity of the backfill, whereas the competition for water at the high content of bentonite reduced the hydration of cement and adversely affected the porosity. The addition of cement promoted a reduction in the porosity of the SCB backfill, which is similar to the porosity performance of general cementitious materials.
- The strength of the SCB backfill decreased with increasing porosity; however, the C3 group did not perform as well as the B9 group. This shows that most bentonites only play the role of filling pores but do not solidify the backfill structure, whereas cement can fill pores and solidify the structure in the backfill. Furthermore, the porosity of the SCB backfill did not have a general rule for characterizing the permeability. The backfill porosity was inversely proportional to the permeability coefficient when the bentonite content was increased, and the backfill porosity was positively proportional to the permeability coefficient when the cement content was increased.
- Statistical analyses of the micro- and small-pore throats (<1 μm) in the SCB backfill revealed a positive correlation between the percentage of the number of micro- and small-pore throats and the contents of bentonite and cement in the SCB backfill. It was observed that an increase in the cement and bentonite contents led to a decrease in the pore passage of the SCB backfill, which explains the microscopic phenomenon of increasing porosity and the decreasing permeability coefficient in group C3 backfill. Therefore, the effective method to reduce the permeability of backfill is to add the correct proportion of micro- and small-pore throats.
Author Contributions
Funding
Institutional Review Board Statement
Informed Consent Statement
Data Availability Statement
Acknowledgments
Conflicts of Interest
References
- Jiang, Z.; Guo, Z.; Peng, C.; Liu, X.; Zhou, Z.; Xiao, X. Heavy metals in soils around non-ferrous smelteries in China: Status, health risks and control measures. Environ. Pollut. 2021, 282, 117038. [Google Scholar] [CrossRef] [PubMed]
- Xu, D.; Fu, R.; Liu, H.; Guo, X. Current knowledge from heavy metal pollution in Chinese smelter contaminated soils, health risk implications and associated remediation progress in recent decades: A critical review. J. Clean. Prod. 2021, 286, 124989. [Google Scholar] [CrossRef]
- Zeng, J.; Li, C.; Wang, J.; Tang, L.; Wu, C.; Xue, S. Pollution simulation and remediation strategy of a zinc smelting site based on multi-source information. J. Hazard. Mater. 2022, 433, 128774. [Google Scholar] [CrossRef] [PubMed]
- He, Y.; Hu, G.; Wu, D.; Zhu, K.; Zhang, K. Contaminant migration and the retention behavior of a laterite–bentonite mixture engineered barrier in a landfill. J. Environ. Manag. 2022, 304, 114338. [Google Scholar] [CrossRef]
- Chen, Y.; Xie, H.; Zhang, C. Review on penetration of barriers by contaminants and technologies for groundwater and soil contamination control. Adv. Sci. Technol. Water Resour. 2016, 36, 1–10. [Google Scholar]
- Carreto, J.M.R.; Caldeira, L.; das Neves, E. Hydromechanical Characterization of Cement-Bentonite Slurries in the Context of Cutoff Wall Applications. J. Mater. Civ. Eng. 2016, 28, 04015093. [Google Scholar] [CrossRef]
- Huang, X.; Li, J.; Xue, Q.; Chen, Z.; Du, Y.; Wan, Y.; Liu, L.; Poon, C.S. Use of self-hardening slurry for trench cutoff wall: A review. Constr. Build. Mater. 2021, 286, 122959. [Google Scholar] [CrossRef]
- Liu, L.; Li, W.; Song, W.; Guo, M. Remediation techniques for heavy metal-contaminated soils: Principles and applicability. Sci. Total Environ. 2018, 633, 206–219. [Google Scholar] [CrossRef]
- Huang, X.; Li, J.-S.; Guo, M.; Xue, Q.; Du, Y.-J.; Wan, Y.; Liu, L.; Poon, C.S. Using MgO activated slag and calcium bentonite slurry to produce a novel vertical barrier material: Performances and mechanisms. Constr. Build. Mater. 2021, 291, 123365. [Google Scholar] [CrossRef]
- Yang, Y.L.; Du, Y.J.; Reddy, K.R.; Fan, R.D. Phosphate-amended sand/Ca-bentonite mixtures as slurry trench wall backfills: Assessment of workability, compressibility and hydraulic conductivity. Appl. Clay Sci. 2017, 142, 120–127. [Google Scholar] [CrossRef]
- He, Y.; Wang, M.M.; Wu, D.Y.; Zhang, K.N.; Chen, Y.G.; Ye, W.M. Effects of chemical solutions on the hydromechanical behavior of a laterite/bentonite mixture used as an engineered barrier. Bull. Eng. Geol. Environ. 2021, 80, 1169–1180. [Google Scholar] [CrossRef]
- Rowe, R.K.; AbdelRazek, A.Y. Effect of interface transmissivity and hydraulic conductivity on contaminant migration through composite liners with wrinkles or failed seams. Can. Geotech. J. 2019, 56, 1650–1667. [Google Scholar] [CrossRef]
- Yang, Y.L.; Reddy, K.R.; Du, Y.J.; Fan, R.D. Short-Term Hydraulic Conductivity and Consolidation Properties of Soil-Bentonite Backfills Exposed to CCR-Impacted Groundwater. J. Geotech. Geoenviron. Eng. 2018, 144, 04018025. [Google Scholar] [CrossRef]
- Zhang, C.; Li, J.Z.; He, Y. Impact of the loading rate on the unsaturated mechanical behavior of compacted red clay used as an engineered barrier. Environ. Earth Sci. 2021, 80, 135. [Google Scholar] [CrossRef]
- Morandini, T.L.C.; Leite, A.D.L. Characterization and hydraulic conductivity of tropical soils and bentonite mixtures for CCL purposes. Eng. Geol. 2015, 196, 251–267. [Google Scholar] [CrossRef]
- Fan, R.D.; Du, Y.J.; Reddy, K.R.; Liu, S.Y.; Yang, Y.L. Compressibility and hydraulic conductivity of clayey soil mixed with calcium bentonite for slurry wall backfill: Initial assessment. Appl. Clay Sci. 2014, 101, 119–127. [Google Scholar] [CrossRef]
- Li, Q.; Zhao, Y.; Qu, D.; Wang, H.; Chen, J.; Zhou, R. Preparation of Ag-MnFe2O4-bentonite Magnetic Composite for Pb(II)/Cd(II) Adsorption Removal and Bacterial Inactivation in Wastewater. Chem. Res. Chin. Univ. 2018, 34, 808–816. [Google Scholar] [CrossRef]
- Wu, H.; Jin, F.; Zhou, A.; Du, Y. The engineering properties and reaction mechanism of MgO-activated slag cement-clayey sand-bentonite (MSB) cutoff wall backfills. Constr. Build. Mater. 2021, 271, 121890. [Google Scholar] [CrossRef]
- Liu, G.; Wu, L.; Ye, C.; Liu, Y.; Huang, Q.; Wen, M.; Liao, B.; Lu, T.; He, T. Study on controlling of cadmium pollution with fly ash-bentonite blocking wall. Chemosphere 2019, 228, 656–667. [Google Scholar] [CrossRef]
- Wroth, C.P.; Wood, D.M. The correlation of index properties with some basic engineering properties of soils. Can. Geotech. J. 1978, 15, 137–145. [Google Scholar] [CrossRef]
- Baxter, D.Y. Mechanical Behavior of Soil-Bentonite Cutoff Walls; Virginia Polytechnic Institute and State University: Blacksburg, VA, USA, 2000. [Google Scholar]
- Ryan, C.R.; Spaulding, C.A. Strength and Permeability of a Deep Soil Bentonite Slurry Wall. In GeoCongress 2008: Geotechnics of Waste Management and Remediation; American Society of Civil Engineers: Reston, VA, USA, 2008; pp. 644–651. [Google Scholar]
- Liang, H.; Chao, X.; Fang, W. Experimental Study on Mechanical Properties of Cement-bentonite Slurry. Site Investig. Sci. Technol. 2009, 06, 3–8. [Google Scholar]
- Jefferis, S. Cement-Bentonite Slurry Systems. In Proceedings of the International Conference on Grouting & Deep Mixing, New Orleans, LA, USA, 15–18 February 2012. [Google Scholar]
- Pisheh, Y.P.; Hosseini, M.M.M. Experimental Investigation of Mechanical Behavior of Plastic Concrete in Cutoff Walls. J. Mater. Civ. Eng. 2019, 31, 04018355. [Google Scholar] [CrossRef]
- Ruffing, D.G.; Evans, J.C. Case Study: Construction and In Situ Hydraulic Conductivity Evaluation of a Deep Soil-Cement-Bentonite Cutoff Wall. In Geo-Congress; American Society of Civil Engineers: Reston, VA, USA, 2014. [Google Scholar]
- Ata, A.A.; Salem, T.N.; Elkhawas, N.M. Properties of soil–bentonite–cement bypass mixture for cutoff walls. Constr. Build. Mater. 2015, 93, 950–956. [Google Scholar] [CrossRef]
- Opdyke, S.M.; Evans, J.C. Slag-cement-bentonite slurry walls. J. Geotech. Geoenviron. Eng. 2005, 131, 673–681. [Google Scholar] [CrossRef]
- Lazorenko, G.; Kasprzhitskii, A.; Shaikh, F.; Krishna, R.S.; Mishra, J. Utilization potential of mine tailings in geopolymers: Physicochemical and environmental aspects. Process Saf. Environ. Prot. 2021, 147, 559–577. [Google Scholar] [CrossRef]
- Hui, X.; Wan, Y.; He, X.; Li, J.-S.; Huang, X.; Liu, L.; Xue, Q. Using alkali-activated dredge sludge ash-bentonite for low permeability cutoff walls: The engineering properties and micromechanism. Environ. Technol. Innov. 2023, 30, 103060. [Google Scholar] [CrossRef]
- Talefirouz, D.; Cokca, E.; Omer, J. Use of granulated blast furnace slag and lime in cement-bentonite slurry wall construction. Int. J. Geotech. Eng. 2016, 10, 81–85. [Google Scholar] [CrossRef]
- Wu, H.; Jin, F.; Du, Y. Influence of wet-dry cycles on vertical cutoff walls made of reactive magnesia-slag-bentonite-soil mixtures. J. Zhejiang Univ.-Sci. A 2019, 20, 948–960. [Google Scholar] [CrossRef]
- Li, Q. Study on Containment Performance and Chemical Compatibility of Bentonite/Cement/Clay Based In-Situ Barrier Materials for Groundwater Pollution; Jilin University: Changchun, China, 2020. [Google Scholar]
- Wu, H. Development of High-Performance Vertical Cutoff Wall Materials Based on MgO-GGBS-Bentonite and Engineering Cementitious Composite; Southeast University: Nanjing, China, 2019. [Google Scholar]
- Fan, R.; Du, Y.; Liu, S.; Yang, Y.; Mei, D. Compressibility and hydraulic conductivity of soil/Ca-bentonite backfills for vertical slurry cutoff wall. J. Hydraul. Eng. 2015, 46, 255–262. [Google Scholar]
- ASTM D2166/D2166M-16; Standard Test Method for Unconfined Compressive Strength of Cohesive Soil. ASTM International: West Conshohocken, PA, USA, 2016.
- GB/T50123-2019; Standard for Geotechnical Testing Method. China Renewable Energy Engineering Institute. Nanjing Hydraulic Research Institute: Beijing, China, 2019.
- Hu, J.; Zhao, F.; Kuang, Y.; Yang, D.; Zheng, M.; Zhao, L. Microscopic characteristics of the action of an air entraining agent on cemented paste backfill pores. Alex. Eng. J. 2020, 59, 1583–1593. [Google Scholar] [CrossRef]
- Moghal, A.A.B.; Ashfaq, M.; Al-Obaid, A.A.K.H.; Abbas, M.F.; Al-Mahbashi, A.M.; Shaker, A.A. Compaction delay and its effect on the geotechnical properties of lime treated semi-arid soils. Road Mater. Pavement Des. 2021, 22, 2626–2640. [Google Scholar] [CrossRef]
- Chittoori, B.C.S.; Moghal, A.A.B.; Pedarla, A.; Al-Mahbashi, A.M. Effect of Unit Weight on Porosity and Consolidation Characteristics of Expansive Clays. J. Test. Eval. 2017, 45, 94–104. [Google Scholar] [CrossRef]
- Hu, J.; Kuang, Y.; Zhou, T.; Zhao, F. Influence of Air Entraining Agent on Strength and Microstructure Properties of Cemented Paste Backfill. IEEE Access 2019, 7, 140899–140907. [Google Scholar] [CrossRef]
- Huan, C.; Zhu, C.; Liu, L.; Wang, M.; Zhao, Y.; Zhang, B.; Zhang, X. Pore Structure Characteristics and Its Effect on Mechanical Performance of Cemented Paste Backfill. Front. Mater. 2021, 8, 700917. [Google Scholar] [CrossRef]
- Maddalena, R.; Roberts, J.J.; Hamilton, A. Can Portland cement be replaced by low-carbon alternative materials? A study on the thermal properties and carbon emissions of innovative cements. J. Clean. Prod. 2018, 186, 933–942. [Google Scholar] [CrossRef]
- Daniel, D.; Koerner, R. Vertical Cutoff Walls. In Geotechnical Practice for Waste Disposal; Springer: Boston, MA, USA, 2015. [Google Scholar]
- Wu, H.-L.; Jin, F.; Ni, J.; Du, Y.-J. Engineering Properties of Vertical Cutoff Walls Consisting of Reactive Magnesia-Activated Slag and Bentonite: Workability, Strength, and Hydraulic Conductivity. J. Mater. Civ. Eng. 2019, 31, 04019263. [Google Scholar] [CrossRef] [Green Version]
- Devarangadi, M.; Uma Shankar, M. Use of ground granulated blast furnace slag blended with bentonite and cement mixtures as a liner in a landfill to retain diesel oil contaminants. J. Environ. Chem. Eng. 2019, 7, 103360. [Google Scholar] [CrossRef]
- Hu, J.; Ren, Q.; Yang, D.; Ma, S.; Shang, J.; Ding, X.; Luo, Z. Cross-scale characteristics of backfill material using NMR and fractal theory. Trans. Nonferrous Met. Soc. China 2020, 30, 1347–1363. [Google Scholar] [CrossRef]
- Hu, J.; Ren, Q.; Jiang, Q.; Gao, R.; Zhang, L.; Luo, Z. Strength Characteristics and the Reaction Mechanism of Stone Powder Cement Tailings Backfill. Adv. Mater. Sci. Eng. 2018, 2018, 8651239. [Google Scholar] [CrossRef] [Green Version]
- Junlin, S.; Wenxin, D.; Pingya, L.; Xianguang, X.; Jinjun, H. Quantitative test and analysis of clay surface hydration water based on low-field nuclear magnetic resonance technology. Acta Pet. Sin. 2019, 40, 468–474. [Google Scholar]
- Liu, L.; Fang, Z.; Qi, C.; Zhang, B.; Guo, L.; Song, K. Experimental investigation on the relationship between pore characteristics and unconfined compressive strength of cemented paste backfill. Constr. Build. Mater. 2018, 179, 254–264. [Google Scholar] [CrossRef]
- Zhong, X.; Liu, L.; Wang, H.; Xu, Z.; Chen, H.; Wang, X.; Zhu, Y. Characteristics and origins of the modal pore throat structure in weakly cemented sandy conglomerate reservoirs. J. Pet. Sci. Eng. 2022, 208, 109470. [Google Scholar] [CrossRef]


| Class | Bentonite | Cement | Soil |
|---|---|---|---|
| Calcite (%) | 3.3 | 12.7 | 13.2 |
| Albite (%) | — | — | 13.0 |
| Chlorite (%) | — | — | 26.5 |
| Quartz (%) | 18.3 | 2.2 | 26.2 |
| Amphibole (%) | — | — | 4.1 |
| Mica (%) | 17.3 | — | 9.1 |
| Plagioclase (%) | — | — | 3.7 |
| Dolomite (%) | — | — | 4.3 |
| Calcium silicate (%) | — | 48.5 | — |
| Larnite (%) | — | 14.6 | — |
| Gypsum (%) | — | 1.0 | — |
| Anhydrous gypsum (%) | — | 5.1 | — |
| Brownmillerite (%) | — | 15.5 | — |
| Montmorillonite (%) | 43.2 | — | — |
| Feldspar (%) | 17.9 | — | — |
| Test Number | Bentonite (wt%) | Cement (wt%) | Soil (wt%) |
|---|---|---|---|
| B6C3 | 6% | 3% | 91% |
| B6C6 | 6% | 88% | |
| B6C9 | 9% | 85% | |
| B9C3 | 9% | 3% | 88% |
| B9C6 | 6% | 85% | |
| B9C9 | 9% | 82% | |
| B12C3 | 12% | 3% | 85% |
| B12C6 | 6% | 82% | |
| B12C9 | 9% | 79% |
| Test Number | Water Content (wt%) | Mini Slump (mm) |
|---|---|---|
| B6C3 | 26.92 | 35.8 |
| B6C6 | 28.30 | 34.5 |
| B6C9 | 29.89 | 35.3 |
| B9C3 | 28.71 | 36.1 |
| B9C6 | 30.75 | 34.0 |
| B9C9 | 31.98 | 36.0 |
| B12C3 | 31.55 | 35.2 |
| B12C6 | 33.31 | 34.3 |
| B12C9 | 34.26 | 34.8 |
Disclaimer/Publisher’s Note: The statements, opinions and data contained in all publications are solely those of the individual author(s) and contributor(s) and not of MDPI and/or the editor(s). MDPI and/or the editor(s) disclaim responsibility for any injury to people or property resulting from any ideas, methods, instructions or products referred to in the content. |
© 2023 by the authors. Licensee MDPI, Basel, Switzerland. This article is an open access article distributed under the terms and conditions of the Creative Commons Attribution (CC BY) license (https://creativecommons.org/licenses/by/4.0/).
Share and Cite
Zhou, T.; Hu, J.; Liu, T.; Zhao, F.; Yin, Y.; Guo, M. Engineering Characteristics and Microscopic Mechanism of Soil–Cement–Bentonite (SCB) Cut-Off Wall Backfills with a Fixed Fluidity. Materials 2023, 16, 4971. https://doi.org/10.3390/ma16144971
Zhou T, Hu J, Liu T, Zhao F, Yin Y, Guo M. Engineering Characteristics and Microscopic Mechanism of Soil–Cement–Bentonite (SCB) Cut-Off Wall Backfills with a Fixed Fluidity. Materials. 2023; 16(14):4971. https://doi.org/10.3390/ma16144971
Chicago/Turabian StyleZhou, Tan, Jianhua Hu, Taoying Liu, Fengwen Zhao, Yanjun Yin, and Mengmeng Guo. 2023. "Engineering Characteristics and Microscopic Mechanism of Soil–Cement–Bentonite (SCB) Cut-Off Wall Backfills with a Fixed Fluidity" Materials 16, no. 14: 4971. https://doi.org/10.3390/ma16144971