
Experimental Study on the Axial Compression Performance of an Underwater Concrete Pier Strengthened by Self-Stressed Anti-Washout Concrete and Segments


Abstract
:1. Introduction
2. IPCSAM
2.1. SSAWC Preparation
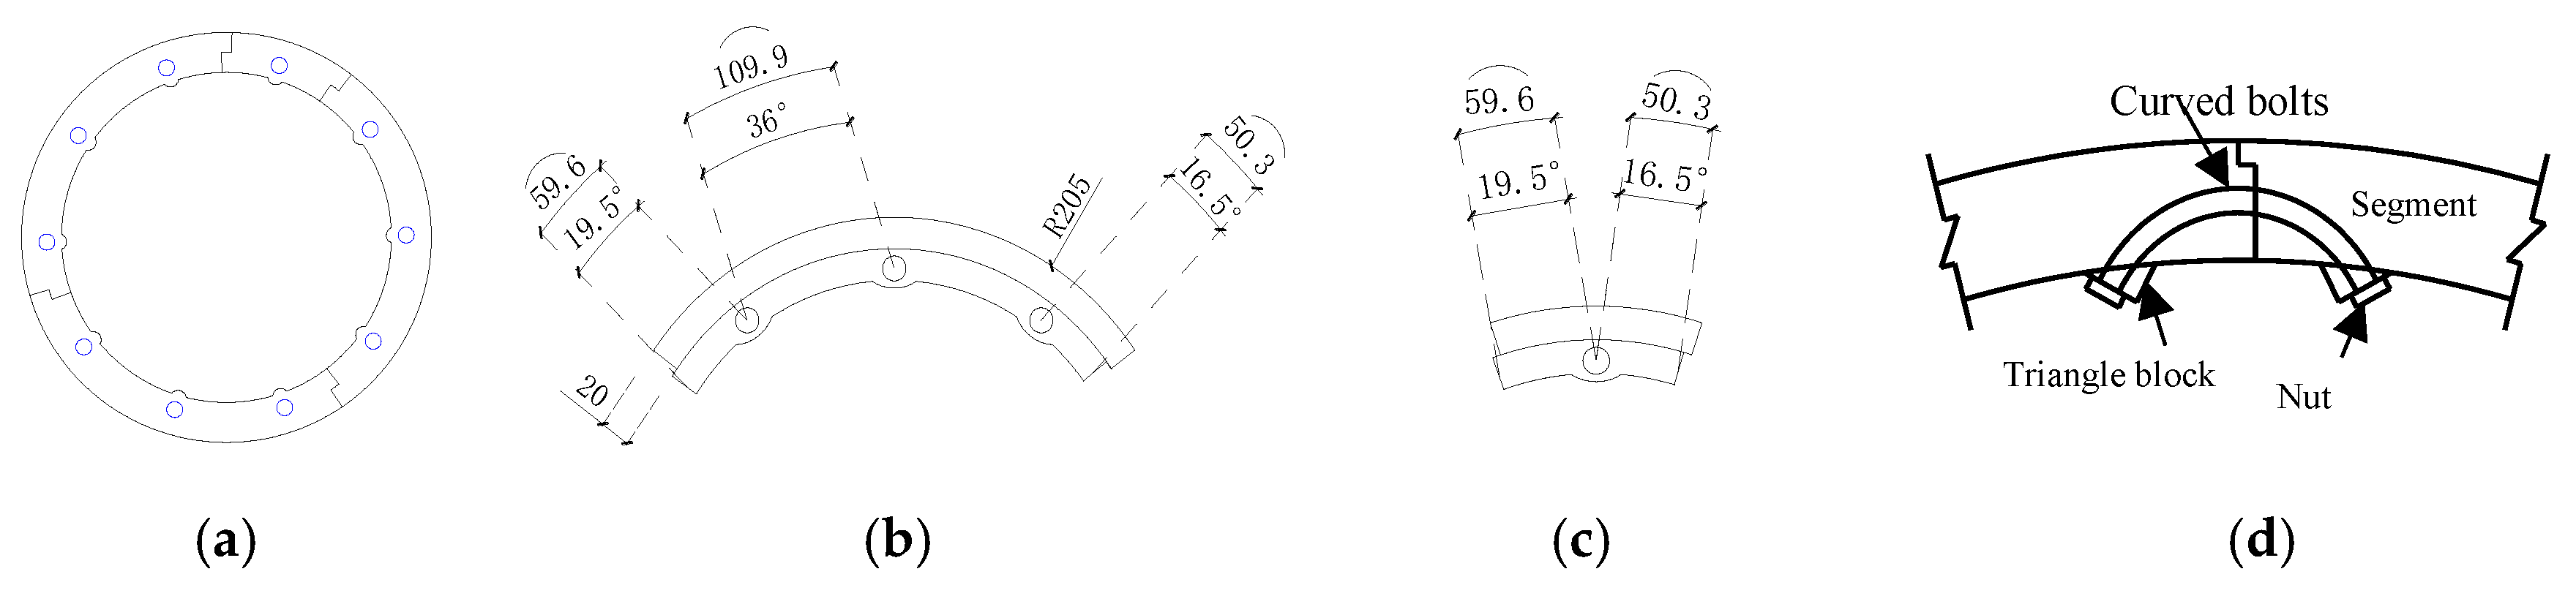
2.2. LCSS Preparation
3. Experimental Procedures
3.1. Experimental Design
3.1.1. Specimens Design
- (1)
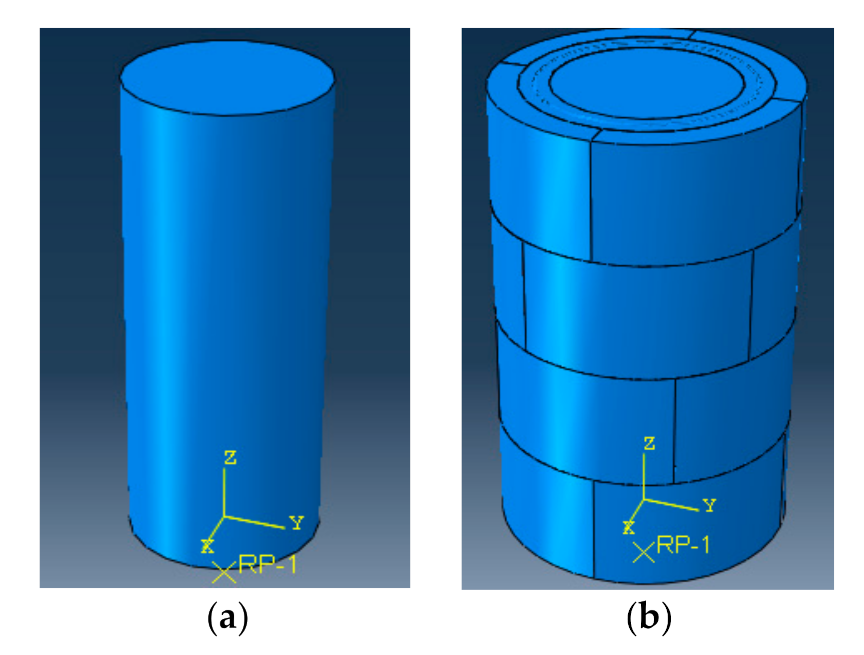
- Dimensions of the specimens: The strengthened specimens were composed of three parts: the lining concrete segment sleeve (LCSS), the unreinforced column, and the filled concrete (SSAWC). Referring to the specimen designs found in relevant studies [17,23], 1/5 model proportions were adopted to avoid difficulties in preparation and deviation of the test results due to the small size. The dimensions of the unreinforced columns were as follows: diameters of 250 mm and 200 mm, height of 750 mm.
- (2)
- Representativeness and number of test specimens: The control variables of the test specimens selected in this paper were the diameter of the unreinforced column, axial compressive strength, thickness, self-stress, and axial compressive strength of the LCSS. In order to investigate the influence of the above variables and ensure the specimens were representative, the initial values of the control variables were determined by the code in [24], involving existing pier-strengthening technologies and the design parameters of ordinary piers. The diameter of the unreinforced column was 250 mm as a result of the 1/5 scale, the axial compressive strength of the filled concrete was 21.7 MPa, the thickness was 40 mm as a result of the 1/5 scale, and the axial compressive strength of the segment concrete was 20.9 MPa. Because it took a lot of time to prepare the reinforced test specimens, time and funds were limited when three specimens were prepared under the same parameter conditions. For the sake of speeding up the test process, the following strategy was adopted. According to reference [9], it was known that the errors for three specimens with the same parameters are generally within 10%. Therefore, only one specimen with the same parameters was prepared in this paper. In order to ensure the rationality and accuracy of the test data, the finite element model with the same parameters was established and the parametric analysis was performed. Based on the above principles, as well as the premise of each variable with a control group, a total of 6 test specimens were prepared in this paper, as shown in Table 3.
- (3)
- Specimen grouping: The specimens were divided into three groups according to the objectives of this test. Table 3 shows the details. (1) The unreinforced group (UG) had two specimens with diameters of 200 mm and 250 mm respectively, which were used for comparison with the corresponding strengthened specimens to verify the strengthening effect. (2) The ordinary reinforced group (ORG) was a specimen strengthened with AWC, which was used for comparison with specimens in the other group to verify the influence of the SSAWC and the LCSS on the strengthening effect. (3) The self-stressed reinforced group (SRG) was composed of specimens filled with SSAWC, among which the concrete strength of the LCSS of specimen S1-SS was reduced to verify the influence of the strength of the sleeve concrete on the bearing capacity of the strengthened specimens, while the thickness of the filled concrete of specimen S2-S was increased to verify the effect of the thickness of the filled concrete on the bearing capacity of the strengthened specimens.
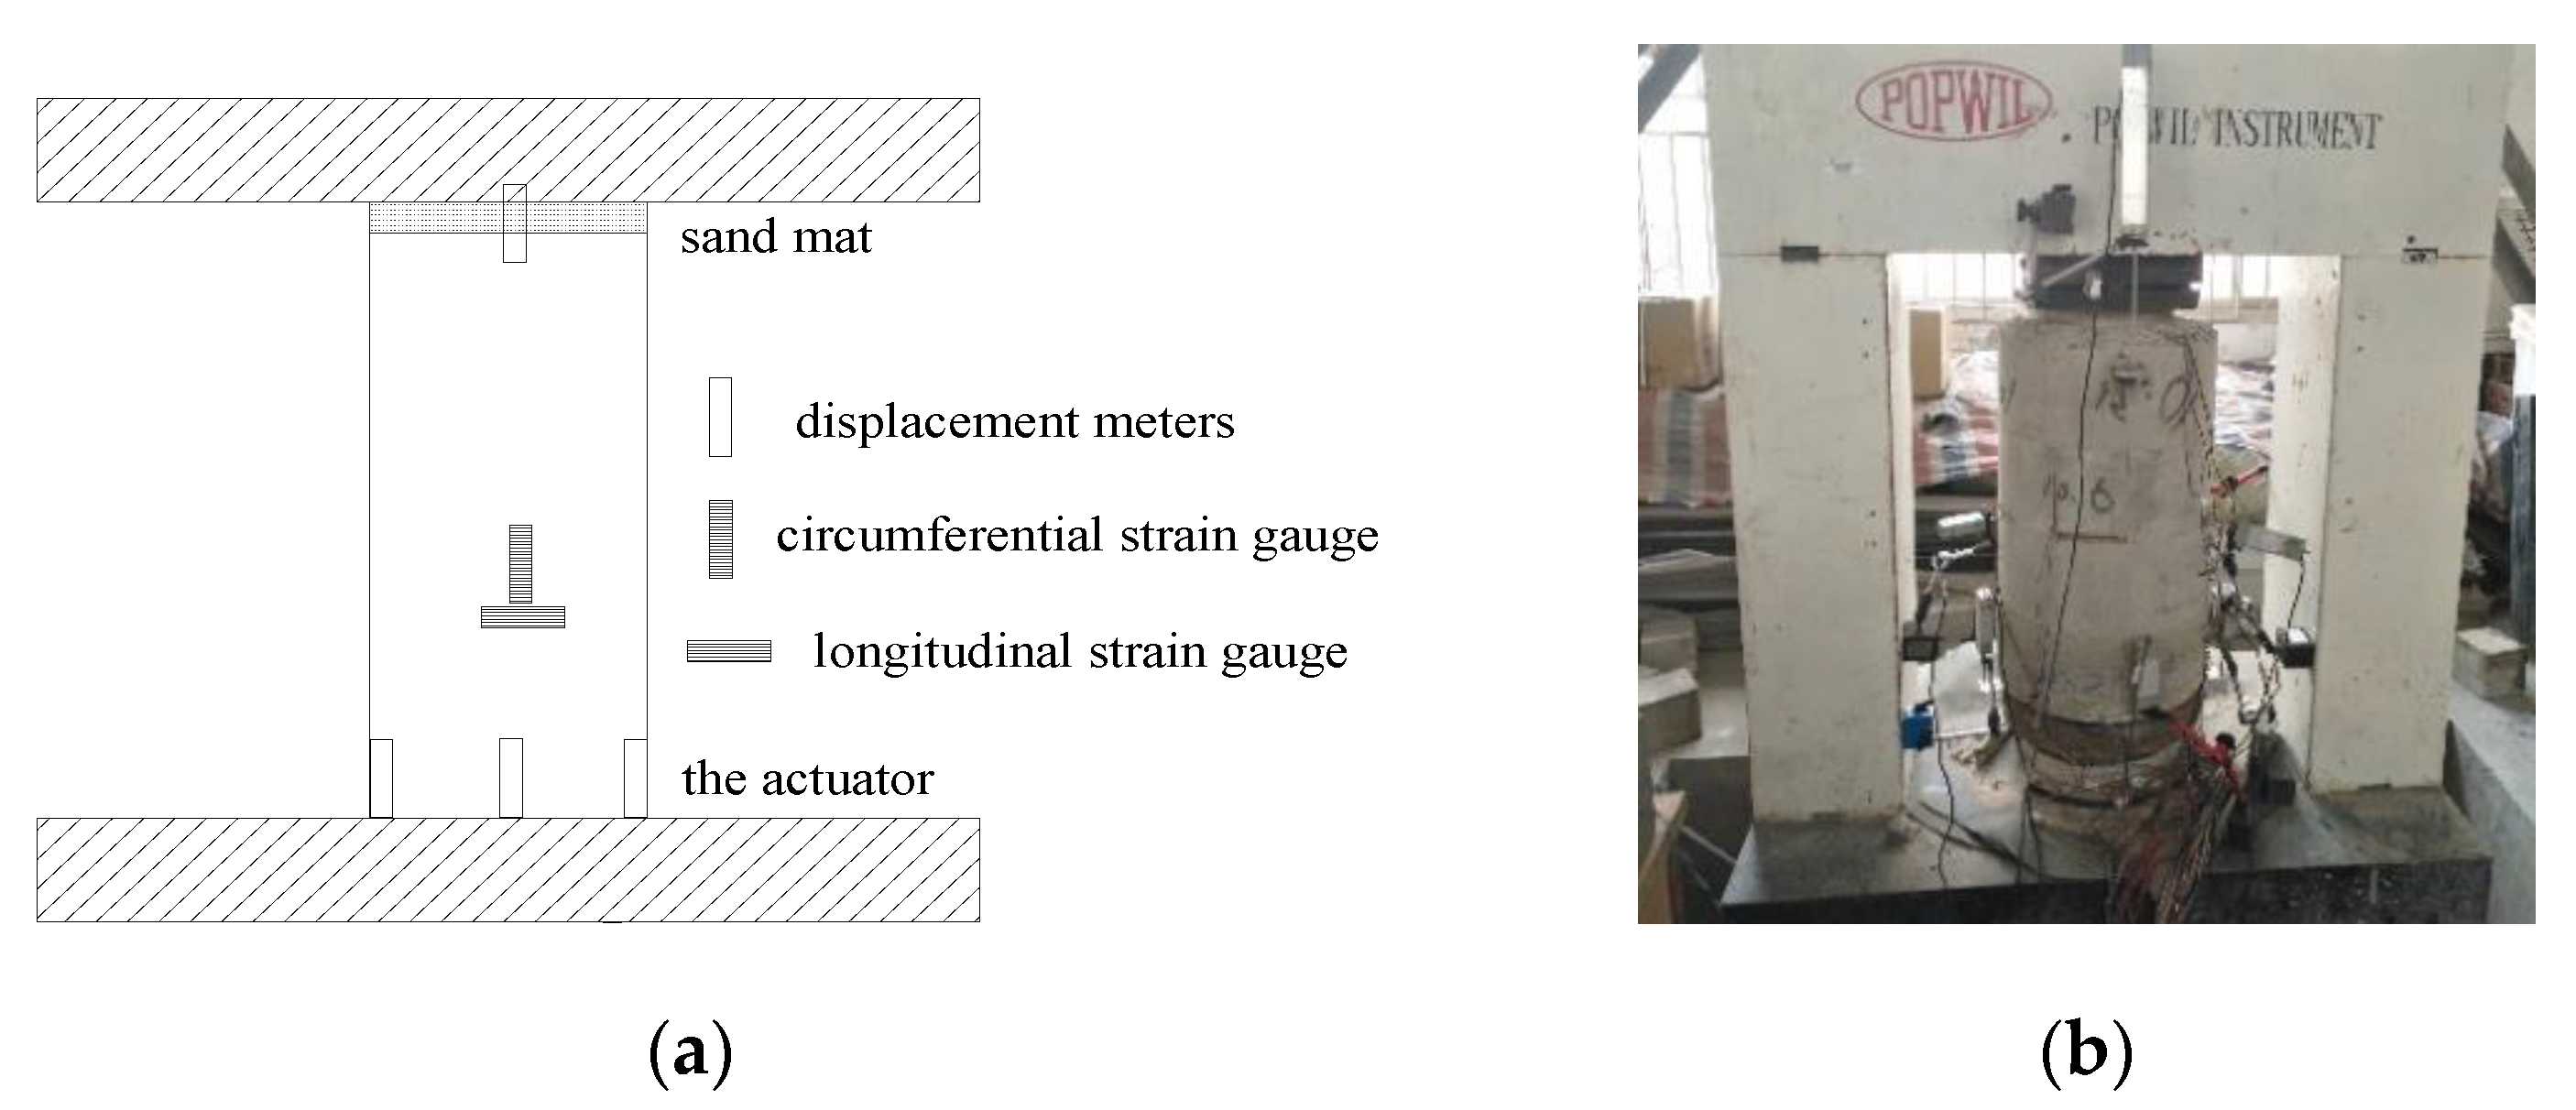
3.1.2. Meter Placement Design
3.1.3. Loading Design
3.2. Specimens Preparation
3.2.1. Materials and Properties
- (1)
- Concrete: The materials, mix ratio, and properties of the SSAWC are shown in Section 2.1. The materials and mix ratio of the AWC were the same as those of the SSAWC, although the expansive agent was replaced by cement equivalently. The common concrete was composed of the same raw material as the SSAWC, while the two strength grades of segment concrete were C30 and C20, respectively, and the concrete strength grade of the unreinforced column was C30. The mix ratio of the AWC and common concrete are shown in Table 4 and the performance is shown in Table 5. The axial compressive strength of the concrete was taken as the concrete strength. For different production times, the concrete strength levels of the segments and unreinforced columns were slightly different.
- (2)
- Steel: In order to improve the durability of the segment [16], the equivalent substitution method was adopted to replace the structural reinforcement with welded steel wire mesh with a diameter of 1.2 mm as the structural reinforcement for the segment. The properties of the welded wire mesh, circumferential bolts, and longitudinal bolts are shown in Table 5.
3.2.2. Production Process
- (1)
- Unreinforced specimens: As shown in Figure 5, unreinforced columns were made with a steel mold.
- (2)
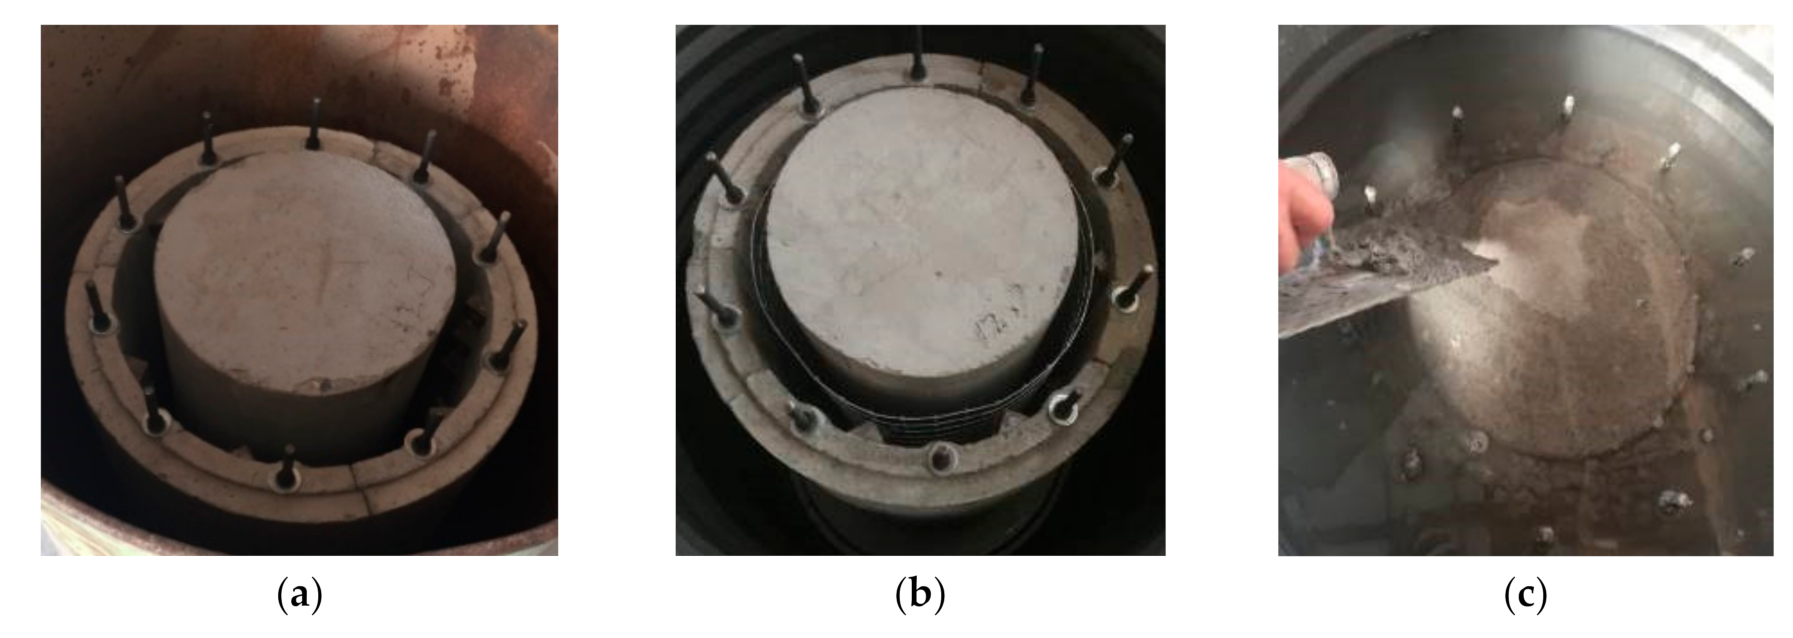
- Strengthened specimens: A bucket with a diameter of 600 mm and a height of 950 mm filled with water was used to simulate the underwater environment. The production procedure is shown in Figure 6 and was as follows: (a) prepare the LCSS and unreinforced column; (b) place the reinforcement mesh between the LCSS and column; (c) fill water into the bucket, pour the SSAWC and cure the concrete. It is noted that the concrete surface of the unreinforced columns should be chiseled manually before pouring concrete to increase the bond strength. In order to simulate the actual working state of the strengthened specimens and decrease the test errors caused by unbalanced loading, the areas with lengths measuring 35 mm were reserved without strengthening at the top and bottom of the specimens.
3.3. Failure Process and Modes
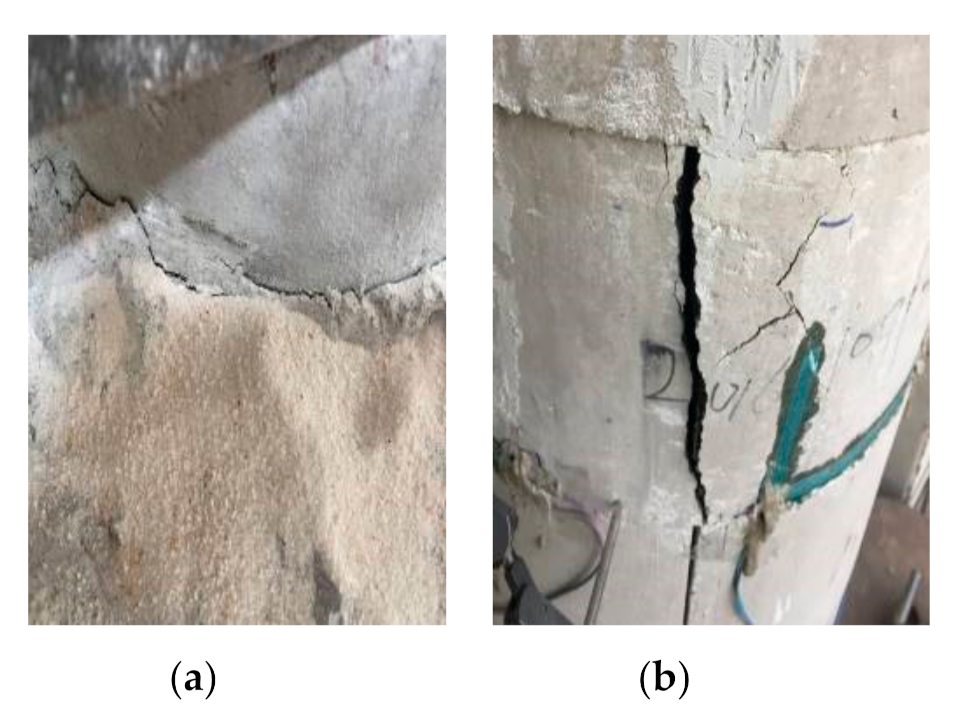
- (1)
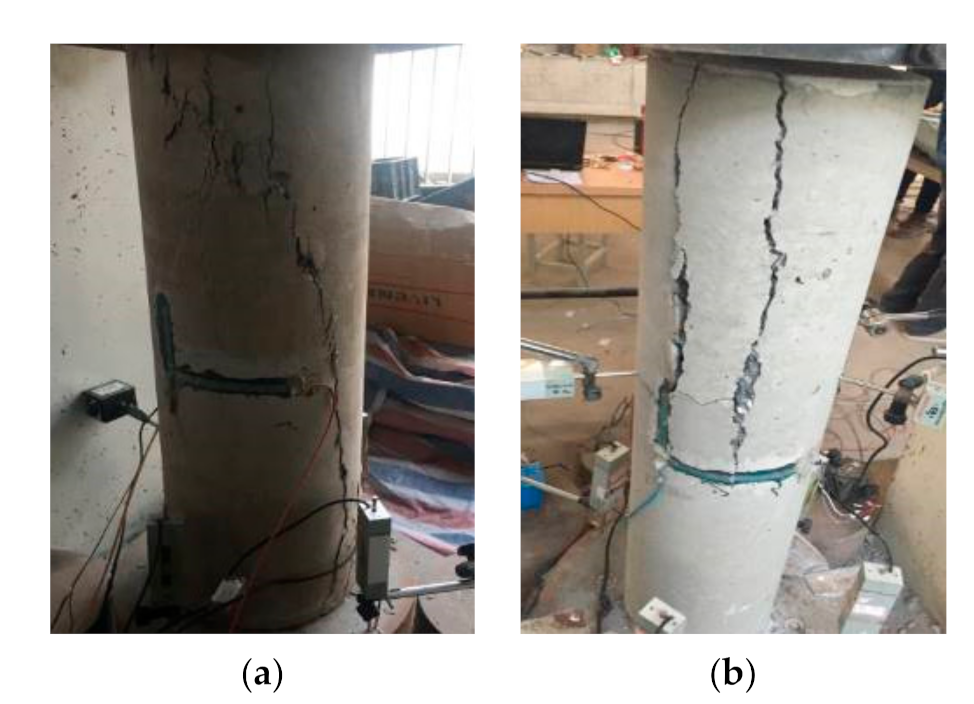
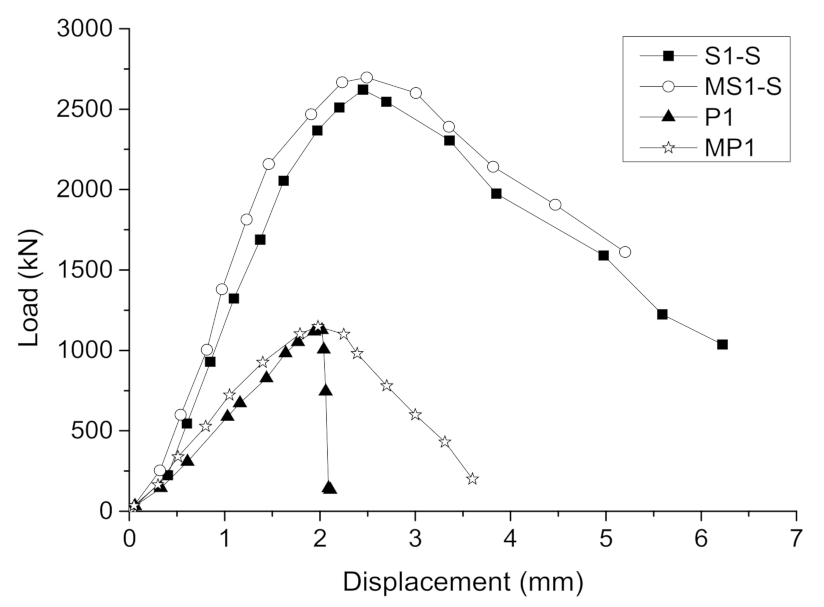
- Unreinforced specimens: As shown in Figure 7, the failure processes for P1 and P2 were similar. For specimen P1, the first crack in the concrete appeared when the load was close to 800 kN, which expanded with the loading. When the load was close to 1100 kN, some of the cracks were connected together to form a long and oblique crack. As a result, the bearing capacity of P1 reached the peak value. Then, the load dropped rapidly and specimen P1 reached failure. For specimen P2, the first crack in the concrete appeared when the load was close to 500 kN, which turned into a penetrating crack when the load was close to 800 kN. As a result, the bearing capacity of specimen P2 reached the peak.
- (2)
- Ordinary strengthened specimen: Figure 8 shows the failure of specimen S1-A. Under the load of 1760 kN, the first concrete crack appeared at the interface between the filled concrete and the column. Then, with the increase in the load, the concrete crack gradually developed towards the segment sleeve and crisp sound could be heard, which was judged to be the fracture of the welded steel wire mesh. When the load was close to 2147 kN, several segments fractured and the bearing capacity of S1-A reached its peak, then the bearing capacity dropped until the failure of S1-A. The cracks were concentrated in the concrete cover of the longitudinal bolt, as well as the joint of the LCSS and the interface between the filled concrete and the column. It should be noted that all bolts remained unbroken.
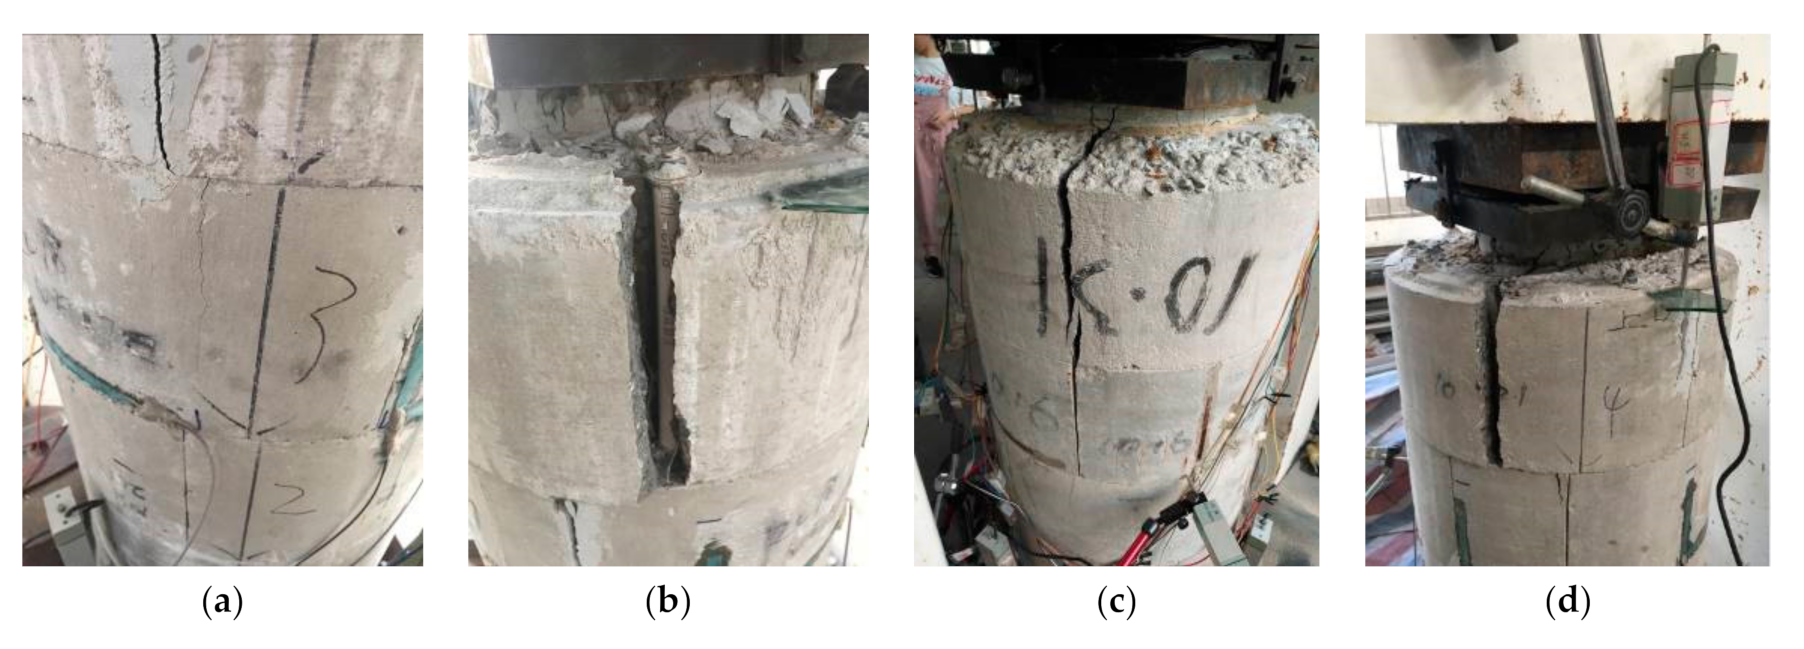
- (3)
- Self-stressed strengthened specimens: The failure process and modes of the three strengthened specimens were similar, as shown in Figure 9. When the load was close to 2000 kN, the first crack appeared in specimen S1-S, then the crack developed with the increases in load, making a cracking sound in the process. When the load reached 2600 kN, several segments broke and the bearing capacity of specimen S1-S reached the peak and stabilized for a period of time. Then, the bearing capacity dropped and the cracks appeared at the interface between the filled concrete and the column when the bearing capacity dropped to 2250 kN. Finally, as the load decreased continuously, multiple cracks penetrated and the specimen failed. When specimen S1-SS was loaded to 1730 kN, cracks of concrete appeared in the segment concrete. When the load was close to 1850 kN, interface cracks appeared and developed toward the segments. When the load was close to 2150 kN, the segments at the top of the specimen almost failed and the bearing capacity reached the peak, then bearing capacity continued to decrease with long penetrating cracks appearing in many places until the specimen failed. When specimen S2-S was loaded to 1500 kN, concrete cracks appeared in the segment. When it was loaded to 1920 kN, fractures occurred in the segment due to the penetration of the cracks and the bearing capacity reaching the peak. Then, the bearing capacity decreased with the appearance of long penetrating cracks and the specimen finally failed. In this group, the cracks were concentrated on the concrete cover of the longitudinal bolt and the segment joints and none of the bolts were broken. Through testing and calculation, the self-stress values of the reinforced specimens could be obtained, as shown in Table 6.
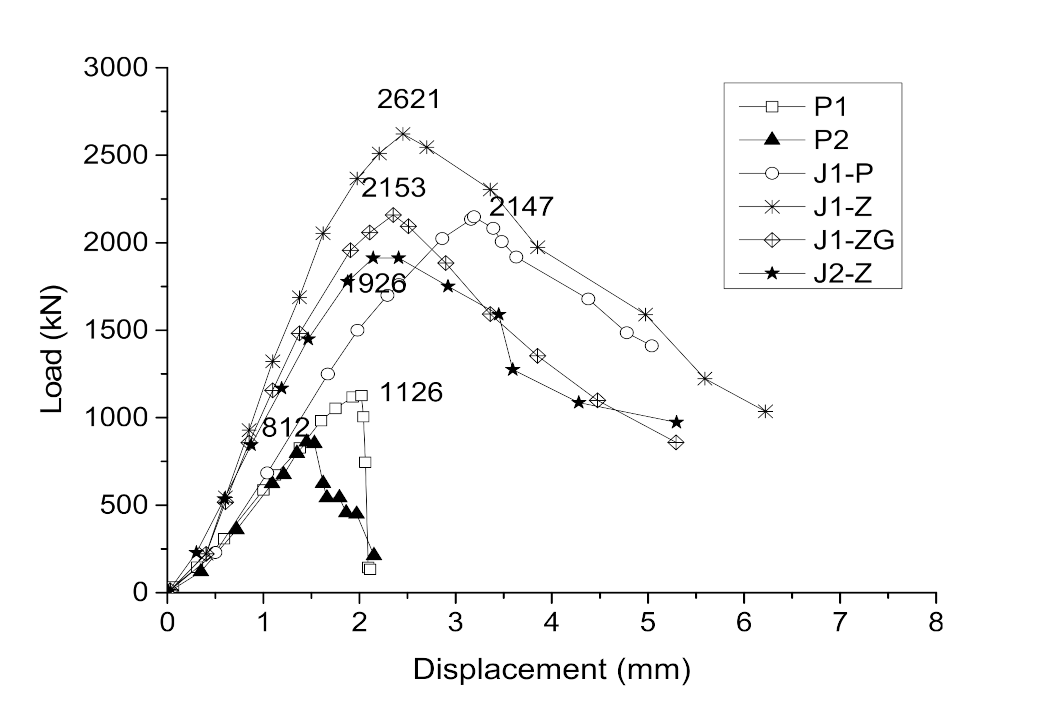
3.4. Load–Displacement Curves
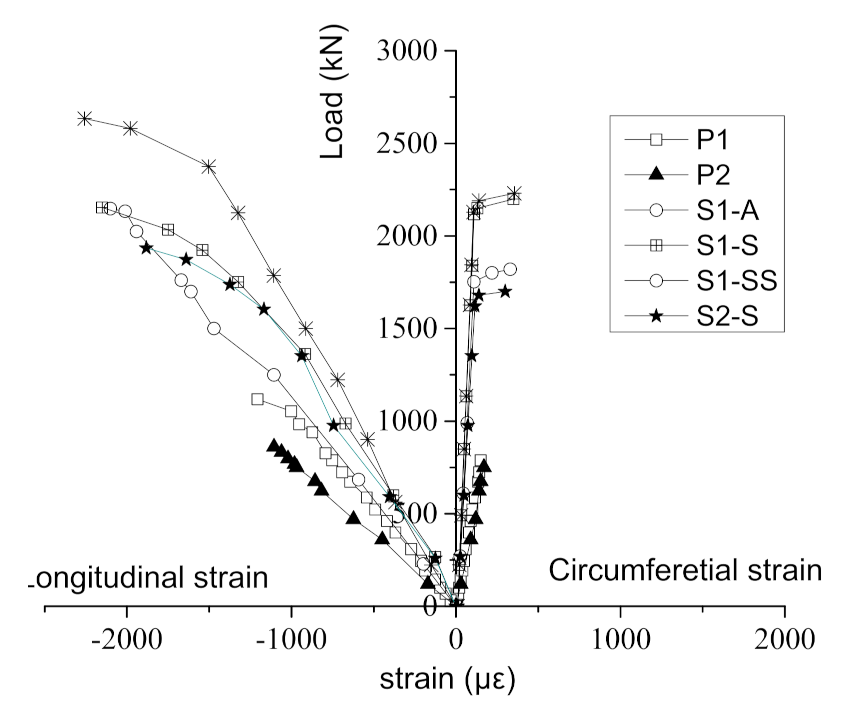
3.5. Load–Strain Curves
3.6. Results and Discussion
- (1)
- The strengthening effect of the IPCSAM: The comparison of the test results showed that the peak loads of strengthened specimens S1-A, S1-S, S1-SS, and S2-S2 increased by 91%, 132%, 73%, and 137%, respectively, while the peak strains increased by 58%, 32%, 27%, and 61%, respectively. This meant the bearing capacity and ductility of the strengthened specimens had been significantly improved when compared with the unreinforced specimens, while the strengthening effect of the IPCSAM was remarkable.
- (2)
- The influence of the LCSS on the strengthening effect: Since the existing relevant research results are very limited, the results from this paper were only compared with [9]. The comparison of specimen S1-A with the specimen YZ-SS strengthened by the PCSAM [9] showed that for S1-A, the ratio of the cross-sectional area before and after strengthening was A1a = 2.69, the ratio of the bearing capacity before and after strengthening was B1a = 1.91, and the strengthening efficiency was E1p= B1a/A1a= 0.71; for YZ-SS, the ratio of the cross-sectional area before and after strengthening was Ass = 1.96, the ratio of the bearing capacity before and after strengthening was Bss = 1.28, and the strengthening efficiency was Ess = Bss/Ass = 0.65. In other words, the strengthening efficiency increased by 9% using the LCSS instead of the sleeve formed by wire ropes. At the same time, the peak strain of S1-A was also larger than that of YZ-SS, showing the better ductility of S1-A than that of YZ-SS.
- (3)
- The influence of the SSAWC on the strengthening effect: The comparison between the two specimens S1-A and S1-S showed that the self-stress increased the bearing capacity by 41%. For S1-S, the ratio of the bearing capacity before and after strengthening was A1s = 2.69, the ratio of the bearing capacity before and after strengthening was B1z = 2.32, and the strengthening efficiency was E1z = 0.86. In other words, the strengthening efficiency increased by 21% using the SSAWC as filled concrete. The reason was that the self-stress produced by SSAWC caused the column to be compressed in three directions, improving the bearing capacity and stiffness. At the same time, the first crack appeared on the interface between the filled concrete, the column of S1-A, and the segment of S1-S specimen. This indicated that self-stress could compensate for the shrinkage of the filled concrete and also contributed to the initial stress on the interface between the filled concrete and adjacent components, improving the bond strength as well as delaying the occurrence of interfacial cracks. Therefore, the SSAWC had significant effects on improving not only the bearing capacity and rigidity of the specimen but also the bond strength.
- (4)
- The influence of the strength of the LCSS concrete on the strengthening effect: It was observed from the comparison of S1-S and S1-SS that the reduction of the LCSS concrete strength would directly affect the bearing capacity and peak strain of the strengthened specimen. This was because the LCSS was a component of the strengthened specimen; as the concrete strength of the LCSS was reduced, the load borne by the LCSS was also decreased. At the same time, the lower the concrete strength of the LCSS, the easier the sleeve failed. As such, the self-stress would be reduced due to the loss of the restriction provided by the sleeve, finally leading to the decreased bearing capacity.
- (5)
- The influence of the thickness of the filled concrete on the strengthening effect: By comparing S1-S with S2-S, it was clear that the cross-sectional areas of these two strengthened specimens were the same, although the larger the thickness of filled concrete, the lower the bearing capacity of the specimen. The bearing capacity was borne by the filled concrete of the strengthened specimens, which complied with the code in [24], while the utilization factor of the filled concrete was 0.8 compared with the column; hence, for S2-S, the thickness of the filled concrete was larger than S1-S, so the bearing capacity was lower than S1-S.
4. Axial Compression Bearing Capacity
4.1. Extended Parameter Analysis
4.1.1. Numerical Model
- (1)
- The material parameters of the concrete, bolts, and welded wire mesh were adopted according to the measured values, as shown in Table 2 and Table 5. The solid element was used to simulate for concrete and the plasticity damage model implemented in ABAQUS was used as the constitutive relationship of concrete in the elastoplastic stage. Damage factors of the damage plasticity model were calculated according to the code [26]. The bolts and welded wire mesh were simulated with the wire element and the double broken line model was used as the constitutive relation of steel;
- (2)
- Referring to [9], the connection between segments was simulated by hard contact, meaning the contact surface was only under compression. The connections between bolts and the segment concrete were simulated using the embedded connection. According to the working characteristics of the interface and referring to the study by Zhao [9] and Zhou [27], the binding connection was used to simulate the connection between the filled concrete and its adjacent members and the Coulomb friction model was adopted;
- (3)
- The unreinforced parts of the specimens were not simulated. The top and bottom surfaces of the specimens were simplified and coupled into one point. Constraints were set on each direction of the point obtained from the top coupling and on the point obtained from the bottom coupling, except in the Z direction;
- (4)
- Displacement loading was adopted and the initial stress was used to simulate self-stress.
4.1.2. Parameter Extended Analysis
- (1)
- The influence of self-stress on the bearing capacity: Table 7 and Table 8 show that when the self-stress value was between 0 and 1.2 MPa, the peak load of the strengthened specimens increased with the increase in the self-stress. When the self-stress increased by 0.2 MPa, the bearing capacity increased by about 100 kN. However, as the self-stress value increased, the growth rate of the peak load decreased. The reason for this was that after the stress increased, the LCSS was easily damaged and the restraint effect on column was reduced, resulting in the decrease in the bearing capacity.
- (2)
- The influence of the strength of the SSAWC on bearing capacity: It can be seen from Table 7 and Table 8 that the peak load of the strengthened specimens increased with the increase in strength of the filled concrete. When the concrete strength increased by 1 MPa, the bearing capacity of the strengthened specimens increased by 35 to 45 kN. However, the higher the strength of the filled concrete, the lower the growth rate of the bearing capacity of the strengthened specimens. This was because after the strength of the filled concrete increased, the LCSS failed first, resulting in a reduction of the increase in the bearing capacity.
- (3)
- The influence of the concrete strength of the LCSS on the bearing capacity: Table 7 and Table 8 show that the peak load of the specimens increased with the increase in concrete strength of the segment. When the concrete strength of the LCSS increased by 1 MPa, the bearing capacity of the strengthened increased by 35 to 60 kN. However, the higher the strength of the segment concrete, the smaller the growth rate of the peak load. The reason was similar to that of the strength of the filled concrete.
4.2. Bearing Capacity Calculation Model
- (1)
- The bearing capacity of the strengthened specimens was composed of three parts: the bearing capacity of the unreinforced column and the filled concrete, the bearing capacity improved by the confinement provided by the sleeve and the filled concrete, and the bearing capacity improved by self-stress;
- (2)
- The bearing capacity of the column and the filled concrete was calculated according to the calculation method of the code in [24]. In [24], the bearing capacity of strengthened components was equal to the axial compression bearing capacity of the column plus 80% of the axial compression bearing capacity of the filled concrete. In this test, the larger the filled concrete, the greater the error, so the utilization coefficient of the filled concrete needed to be adjusted. The contribution of the LCSS on the bearing capacity of the specimens was neglected to simplify the calculation;
- (3)
- According to the calculation method in [29], the improved bearing capacity of the sleeve and filled concrete constraints was calculated. As a result, the confinement coefficient was used to consider the improvement of the bearing capacity of the axial compression;
- (4)
- According to [28], the calculation method used to improve the bearing capacity through self-stress and the relationship between the improved bearing capacity and the self-stress level (the ratio of the self-stress value to the strength of the SSAWC) involved cubic equations. According to this method, the tensile stress generated by the self-stress shall be less than the tensile bearing capacity of the sleeve concrete, so the self-stress shall not be greater than 2 MPa;
- (5)
- According to the design data for previous bridges, the concrete strength grade of the substructure mostly did not exceed C30, so it was assumed that the concrete strength grade of the columns was not greater than C30. At the same time, the substructures constructed years ago had low reinforcement ratios and there were issues related to bar exposure and corrosion. Therefore, the reinforcement of the columns was ignored.
4.3. Determination of Parameters
- (1)
- (2)
- (3)
- (4)
4.4. Formula Verification
5. Conclusions
- (1)
- The IPCSAM has good strengthening effects on underwater pier strengthening structures without causing undraining. Compared with the unreinforced column, the axial compression bearing capacity and peak strain of specimens strengthened by the IPCSAM increased by 90–130% and 30–60%, respectively. This indicates that the bearing capacity and ductility of the strengthened specimens were considerably improved;
- (2)
- As the filling material, the SSAWC can reduce losses in underwater strength in concrete and can produce expansion and self-stress. The self-stress not only improves the bond strength between the filled concrete and the adjacent member, but also provides a preloading effect on the column, which can improve the strength and ultimate strain of the concrete. Compared with the specimen strengthened by AWC, the bearing capacity of the specimen strengthened by the SSAWC increased by 18% and the strengthening efficiency increased from 0.71 to 0.86;
- (3)
- The LCSS improvement caused by the shield lining showed reliable connection performance, which remained in good condition when the specimen was broken. In the test, the LCSS showed good integrity and confinement, which could increase the bearing capacity of a specimen. Compared with the PCSAM, the strengthening efficiency of the specimen strengthened by the IPCSAM increased from 0.65 to 0.71;
- (4)
- The strength of the filled concrete, the strength of the LCSS concrete, and the self-stress were the key parameters affecting the bearing capacity of the specimens. With the increase in filled concrete strength, the LCSS strength, self-stress, and bearing capacity increased accordingly;
- (5)
- The calculation formula for the bearing capacity of the strengthened components has been proposed. The findings from this study show that the formula has good applicability and provides a theoretical design basis for the application of the IPCSAM.
Author Contributions
Funding
Acknowledgments
Conflicts of Interest
References
- Wei, R.; Sneed, L.H. Test Results and Nonlinear Analysis of RC T-beams Strengthened by Bonded Steel Plates. Int. J. Concr. Struct. Mater. 2015, 9, 133–143. [Google Scholar]
- Lehman, D.E.; Gookin, S.E. Repair of earthquake-damaged bridge columns. ACI Struct. J. 2001, 98, 233–242. [Google Scholar]
- Hamdy, M.; Mohamed, M.Z.; Afifi, B.B. Performance Evaluation of Concrete Columns Reinforced Longitudinally with FRP Bars and Confined with FRP Hoops and Spirals under Axial Load. J. Bridge Eng. 2014, 19, 04014020. [Google Scholar]
- Saeed, H.Z.; Ahmed, A.; Ali, S.M.; Iqbal, M. Experimental and finite element investigation of strengthened LSC bridge piers under Quasi-Static Cyclic Load Test. Compos. Struct. 2015, 131, 556–564. [Google Scholar] [CrossRef]
- Ai, J.; Shi, L.Y. Discussion of design and construction method on extraneous prestressed strengthening technique for bridge. J. Southeast Univ. 2002, 32, 771–774. [Google Scholar]
- Fatmir, M.; Hadi, B. Rehabilitation of Deteriorated Timber Piles with Fiber Reinforced Polymer Composites—IABSE Symposium Report; International Association for Bridge and Structural Engineering: Vancouver, BC, Canada, 2017; pp. 381–388. [Google Scholar]
- Yi, N.H.; Nam, J.W. Evaluation of material and structural performances of developed Aqua-Advanced-FRP for retrofitting of underwater concrete structural members. Constr. Build. Mater. 2010, 24, 566–576. [Google Scholar] [CrossRef]
- Sen, R.; Mullins, G. Application of FRP composites for underwater piles repair. Compos. Part B Eng. 2007, 38, 751–758. [Google Scholar] [CrossRef]
- Zhao, B. The Study on Underwater Pier Reinforcement Technology by Precast Concrete Segment Assembled Quickly. Master’s Thesis, Southeast University, Nanjing, China, 2015. (In Chinese). [Google Scholar]
- Wu, S.F.; Jiang, S.F.; Shen, S.; Wu, Z. The Mix Ratio Study of Self-Stressed Anti-Washout Underwater Concrete Used in Nondrainage Strengthening. Materials 2019, 12, 324. [Google Scholar] [CrossRef] [Green Version]
- Qu, X.S.; Liu, Q. Bond strength between steel and self-compacting lower expansion concrete in composite columns. J. Constr. Steel Res. 2017, 139, 176–187. [Google Scholar] [CrossRef]
- Calvo, J.G.; Revuelta, D.; Carballosa, P.; Gutiérrez, J.P. Comparison between the performance of expansive SCC and expansive conventional concretes in different expansion and curing conditions. Concr. Constr. Build. Mater. 2017, 136, 277–285. [Google Scholar] [CrossRef]
- Lu, Y.; Liu, Z.; Li, S.; Li, N. Bond behavior of steel fibers reinforced self-stressing and self-compacting concrete filled steel tube columns. Constr. Build. Mater. 2018, 158, 894–909. [Google Scholar] [CrossRef]
- Huang, J.C. The Study on Prefabrication Technology of Reinforced Concrete Shield Segment. Master’s Thesis, Tongji University, Shanghai, China, 2007. (In Chinese). [Google Scholar]
- Liu, X.; Bai, Y.; Yuan, Y.; Mang, H.A. Experimental investigation of the ultimate bearing capacity of continuously jointed segmental tunnel linings. Struct. Infrastruct. Eng. 2016, 12, 1364–1379. [Google Scholar] [CrossRef]
- Meng, G.; Gao, B.; Zhou, J.; Cao, G.; Zhang, Q. Experimental investigation of the mechanical behavior of the steel fiber reinforced concrete tunnel segment. Constr. Build. Mater. 2016, 126, 98–107. [Google Scholar] [CrossRef]
- Fakharifar, M.; Chen, G.; Wu, G.; Shamsabadi, A.; ElGawady, M.A.; Dalvand, A. Rapid Repair of Earthquake-Damaged RC Columns with Prestressed Steel Jackets. J. Bridge Eng. 2016, 21, 04015075. [Google Scholar] [CrossRef]
- Wang, X. Experimental Investigation on the Seismic Behaviors of Sever Earthquake-Damaged RC Bridge Piers Repaired with Wrapped CFRP Sheets. Master’s Thesis, Dalian University of Technology, Dalian, China, 2015. (In Chinese). [Google Scholar]
- Seible, F.; Priestley, M.J.N.; Hegemier, G.A.; Innamorato, D. Seismic retrofit of RC columns with continuous carbon fiber jackets. J. Compos. Constr. 1997, 1, 52–62. [Google Scholar] [CrossRef]
- Tang, Y.; Wu, G.; Sun, Z. Numerical Study on Seismic Behavior of Underwater Bridge Columns Strengthened with Prestressed Precast Concrete Panels and Fiber-Reinforced Polymer Reinforcements. Int. J. Polym. Sci. 2018, 2018, 7438694. [Google Scholar] [CrossRef]
- Kamal, H.K. Effects of anti-washout admixtures on fresh concrete properties. ACI Mater. J. 1995, 92, 164–171. [Google Scholar]
- Oliveira, M.J.; Ribeiro, A.B.; Branco, F.G. Combined effect of expansive and shrinkage reducing admixtures to control autogenous shrinkage in self-compacting. Concr. Constr. Build. Mater. 2014, 52, 267–275. [Google Scholar] [CrossRef]
- Shim, C.; Koem, C.; Song, H.; Park, S. Seismic performance of repaired severely damaged precast columns with high-fiber reinforced cementitious composites. KSEC J. Civ. Eng. 2018, 22, 736–746. [Google Scholar] [CrossRef]
- China Architecture & Building Press. GB50367-2013 Design Code for Strengthening Concrete Structures; China Architecture & Building Press: Beijing, China, 2013. (In Chinese) [Google Scholar]
- Yang, F.L. Experimental Study on Basic Mechanical Properties Short of Columns with Strengthened Style Hoop. Master’s Thesis, Shandong University of Science and Technology, Qingdao, China, 2010. (In Chinese). [Google Scholar]
- China Architecture & Building Press. GB50010-2015 Code for Design of Concrete Structures; China Architecture & Building Press: Beijing, China, 2010. (In Chinese) [Google Scholar]
- Zhou, X.H.; Yan, B.; Liu, J.P. Axial load behavior of circular tubed reinforced concrete columns with different length-to-diameter ratios. J. Build. Struct. 2018, 39, 11–21. (In Chinese) [Google Scholar]
- Xu, L.; Wu, M.; Zhou, P.; Gu, Y.S.; Xu, M.Y. Experimental Investigation on High-strength Self-stressing and Self-compacting Concrete Filled Steel Tube Columns Subjected to Uniaxial Compression. Eng. Mech. 2017, 34, 93–100. (In Chinese) [Google Scholar]
- China Architecture & Building Press. GB50936-2014 Technical Code for Concrete Filled Steel Tubular Structures; China Architecture & Building Press: Beijing, China, 2014. (In Chinese) [Google Scholar]
- Huang, L.; Zhuo, W.; Shangguan, P.; Huang, X. An improved formula for shear strength of bonding interface between new and old concrete. Ind. Constr. 2018, 48, 202–207, 212. (In Chinese) [Google Scholar]


| Cement | Expansive Agent | Anti-Dispersion Agent | Sand | Stone | Water-Reducing Agent | Water |
|---|---|---|---|---|---|---|
| 433.3 | 48.14 | 12.03 | 692 | 995 | 4.81 | 207 |
| Slump (mm) | Slump Flow (mm) | Restrained Expansion Rate at 14 Days (%) | pH Value | Elastic Modulus (GPa) | Underwater Strength at 28 Days (MPa) | Strength at 28 Days (MPa) | Strength Ratio |
|---|---|---|---|---|---|---|---|
| 240 | 435 | 0.040 | 10.9 | 30.2 | 32.4 | 38.8 | 0.835 |
| Specimen | Group | D × H *1 (mm) | ACSC *2 of Unreinforced Specimen (MPa) | Filled Concrete | ACSC of LCSS (MPa) | ||
|---|---|---|---|---|---|---|---|
| ACSC (MPa) | Thickness (mm) | Self-Stress (MPa) | |||||
| P1 | UG | 250 × 750 | 20.1 | 21.7 | 0 | 0 | 20.9 |
| P2 | 200 × 750 | 20.1 | 21.7 | 0 | 0 | 20.9 | |
| S1-A | ORG | 250 × 750 | 20.1 | 19.8 | 40 | 0 | 20.9 |
| S1-S | SRG | 250 × 750 | 20.1 | 21.7 | 40 | 1 | 20.9 |
| S1-SS | 250 × 750 | 20.1 | 21.7 | 40 | 0.8 | 13.6 | |
| S2-S | 200 × 750 | 20.1 | 21.7 | 65 | 0.6 | 20.9 | |
| Strength Grade | Cement | Expansive Agent | Anti-Dispersion Agent | Sand | Stone | Water-Reducing Agent | Water |
|---|---|---|---|---|---|---|---|
| C30 (AWC) | 481.4 | 0 | 12.03 | 692 | 995 | 4.81 | 207 |
| C30 | 405 | 0 | 0 | 661 | 1174 | 4.05 | 175 |
| C20 | 321 | 0 | 0 | 758 | 1138 | 0 | 183 |
| Material | Elastic Modulus of Concrete (GPa) | ACSC (MPa) | Axial Tensile/Yield Strength of Steel (MPa) | Poisson’s Ration | Area (mm2) |
|---|---|---|---|---|---|
| C30 concrete in column | 30.0 | 20.1 | 2.01 | 0.2 | |
| C30 AWC | 30.7 | 21.2 | 2.10 | 0.2 | |
| C30 concrete in segments | 30.3 | 20.9 | 2.06 | 0.2 | |
| C20 concrete in segments | 26.1 | 13.6 | 1.58 | 0.2 | |
| Welded wire mesh | 180 | 210 | 0.3 | 1.13 | |
| Circumferential/longitudinal bolts | 206 | 640 | 0.3 | 28.26/50.24 |
| Specimen | Circumferential Strain (με) | Longitudinal Strain (με) | Circumferential Stress (MPa) | Longitudinal Stress (MPa) |
|---|---|---|---|---|
| S1-S | 14 | 62 | 0.20 | 0.99 |
| S1-SS | 11 | 52 | 0.16 | 0.83 |
| S2-S | 11 | 39 | 0.14 | 0.63 |
| Specimen | Peak Load (kN) | Peak Displacement (mm) | Peak Strain | Peak Load Increased Ratio | Peak Strain Increased Ratio |
|---|---|---|---|---|---|
| P1 | 1126 | 1.97 | 0.0026 | - | - |
| P2 | 812 | 1.45 | 0.0016 | ||
| S1-A | 2147 | 3.15 | 0.0042 | 91% | 58% |
| S1-S | 2621 | 2.63 | 0.0035 | 132% | 32% |
| S1-SS | 2153 | 2.48 | 0.0033 | 73% | 27% |
| S2-S | 1926 | 2.33 | 0.0031 | 137% | 61% |
| Name | Filled Concrete Strength (MPa) | Longitudinal Stress (MPa) | Segment Concrete Strength (MPa) | Peak Load (kN) |
|---|---|---|---|---|
| M-1 | 21.7 | 0.8 | 20.9 | 2578 |
| M-2 | 21.7 | 1 | 20.9 | 2695 |
| M-3 | 21.7 | 1.2 | 20.9 | 2802 |
| M-4 | 21.7 | 1 | 23.4 | 2810 |
| M-5 | 21.7 | 1 | 26.8 | 2876 |
| M-6 | 21.7 | 1 | 32.4 | 2992 |
| M-7 | 23.4 | 1 | 20.9 | 2771 |
| M-8 | 26.8 | 1 | 20.9 | 2859 |
| M-9 | 32.4 | 1 | 20.9 | 2955 |
| Name | BCT(S) *1 (kN) | ACSC of Column fco (MPa) | Filled Concrete Strength fsc (MPa) | Concrete Strength of LCSS fgc (MPa) | Self-Stress q (MPa) | Confinement Coefficient θ | Self-Stress Level η | BCC *2 (kN) | Difference |
|---|---|---|---|---|---|---|---|---|---|
| S1-A | 2147 | 20.1 | 19.8 | 20.9 | 0 | 0.176 | 0 | 2035 | −5.20% |
| S1-S | 2621 | 20.1 | 21.7 | 20.9 | 0.99 | 0.177 | 0.046 | 2565 | −2.12% |
| S1-SS | 2153 | 20.1 | 21.7 | 13.4 | 0.83 | 0.147 | 0.038 | 2243 | 4.19% |
| S2-S | 1926 | 20.1 | 21.7 | 20.9 | 0.63 | 0.250 | 0.031 | 2116 | 9.89% |
| M-1 | 2578 | 20.1 | 21.7 | 20.9 | 0.8 | 0.177 | 0.037 | 2507 | −2.77% |
| M-2 | 2695 | 20.1 | 21.7 | 20.9 | 1 | 0.177 | 0.046 | 2568 | −4.71% |
| M-3 | 2802 | 20.1 | 21.7 | 20.9 | 1 | 0.177 | 0.055 | 2615 | −6.67% |
| M-4 | 2810 | 20.1 | 21.7 | 23.4 | 1 | 0.182 | 0.046 | 2648 | −5.78% |
| M-5 | 2876 | 20.1 | 21.7 | 26.8 | 1 | 0.192 | 0.046 | 2769 | −3.71% |
| M-6 | 2992 | 20.1 | 21.7 | 32.4 | 1 | 0.204 | 0.046 | 2960 | −1.06% |
| M-7 | 2771 | 20.1 | 23.4 | 20.9 | 1 | 0.180 | 0.043 | 2633 | −4.99% |
| M-8 | 2859 | 20.1 | 26.8 | 20.9 | 1 | 0.187 | 0.037 | 2774 | −2.96% |
| M-9 | 2955 | 20.1 | 32.4 | 20.9 | 1 | 0.196 | 0.031 | 3004 | 1.66% |
| YZSS1 *3 | 3578 | 39.8 | 17.9 | 44.2 | 0 | 0.075 | 0 | 3470 | −3.03% |
| YZSS2 *3 | 3220 | 39.8 | 17.9 | 44.2 | 0 | 0.075 | 0 | 3470 | 7.76% |
| YZSS3 *3 | 3984 | 39.8 | 17.9 | 44.2 | 0 | 0.075 | 0 | 3470 | −12.90% |
| YZFS1 *3 | 4640 | 39.8 | 17.9 | 44.2 | 0 | 0.125 | 0 | 4060 | −12.51% |
| YZFS3 *3 | 4524 | 39.8 | 17.9 | 44.2 | 0 | 0.125 | 0 | 4060 | −10.26% |
| ZMW1 *4 | 1120 | 20.1 | 32.8 | 0 | 0 | 0.155 | 0 | 991 | 5.87% |
| ZMW2 *4 | 936 | 20.1 | 32.8 | 0 | 0 | 0.155 | 0 | 991 | −11.52% |
| ZRW1 *4 | 1027 | 20.1 | 45.5 | 0 | 0 | 0.128 | 0 | 1153 | 12.25% |
| ZRW2 *4 | 1071 | 20.1 | 45.5 | 0 | 0 | 0.128 | 0 | 1153 | 7.66% |
| ZRW3 *4 | 1113 | 20.1 | 45.5 | 0 | 0 | 0.128 | 0 | 1153 | 3.59% |
Publisher’s Note: MDPI stays neutral with regard to jurisdictional claims in published maps and institutional affiliations. |
© 2021 by the authors. Licensee MDPI, Basel, Switzerland. This article is an open access article distributed under the terms and conditions of the Creative Commons Attribution (CC BY) license (https://creativecommons.org/licenses/by/4.0/).
Share and Cite
Wu, S.; Ge, Y.; Jiang, S.; Shen, S.; Zhang, H. Experimental Study on the Axial Compression Performance of an Underwater Concrete Pier Strengthened by Self-Stressed Anti-Washout Concrete and Segments. Materials 2021, 14, 6567. https://doi.org/10.3390/ma14216567
Wu S, Ge Y, Jiang S, Shen S, Zhang H. Experimental Study on the Axial Compression Performance of an Underwater Concrete Pier Strengthened by Self-Stressed Anti-Washout Concrete and Segments. Materials. 2021; 14(21):6567. https://doi.org/10.3390/ma14216567
Chicago/Turabian StyleWu, Shaofeng, Yijun Ge, Shaofei Jiang, Sheng Shen, and Heng Zhang. 2021. "Experimental Study on the Axial Compression Performance of an Underwater Concrete Pier Strengthened by Self-Stressed Anti-Washout Concrete and Segments" Materials 14, no. 21: 6567. https://doi.org/10.3390/ma14216567