3.1. Adsorbent Characterization
The particle size distribution analysis of the Bathurst burr powder (
Supplementary Material, Figure S1) shows that 82.15% of the particles have an average size bellow 0.5 mm and 50% of them are smaller than 0.348 mm.
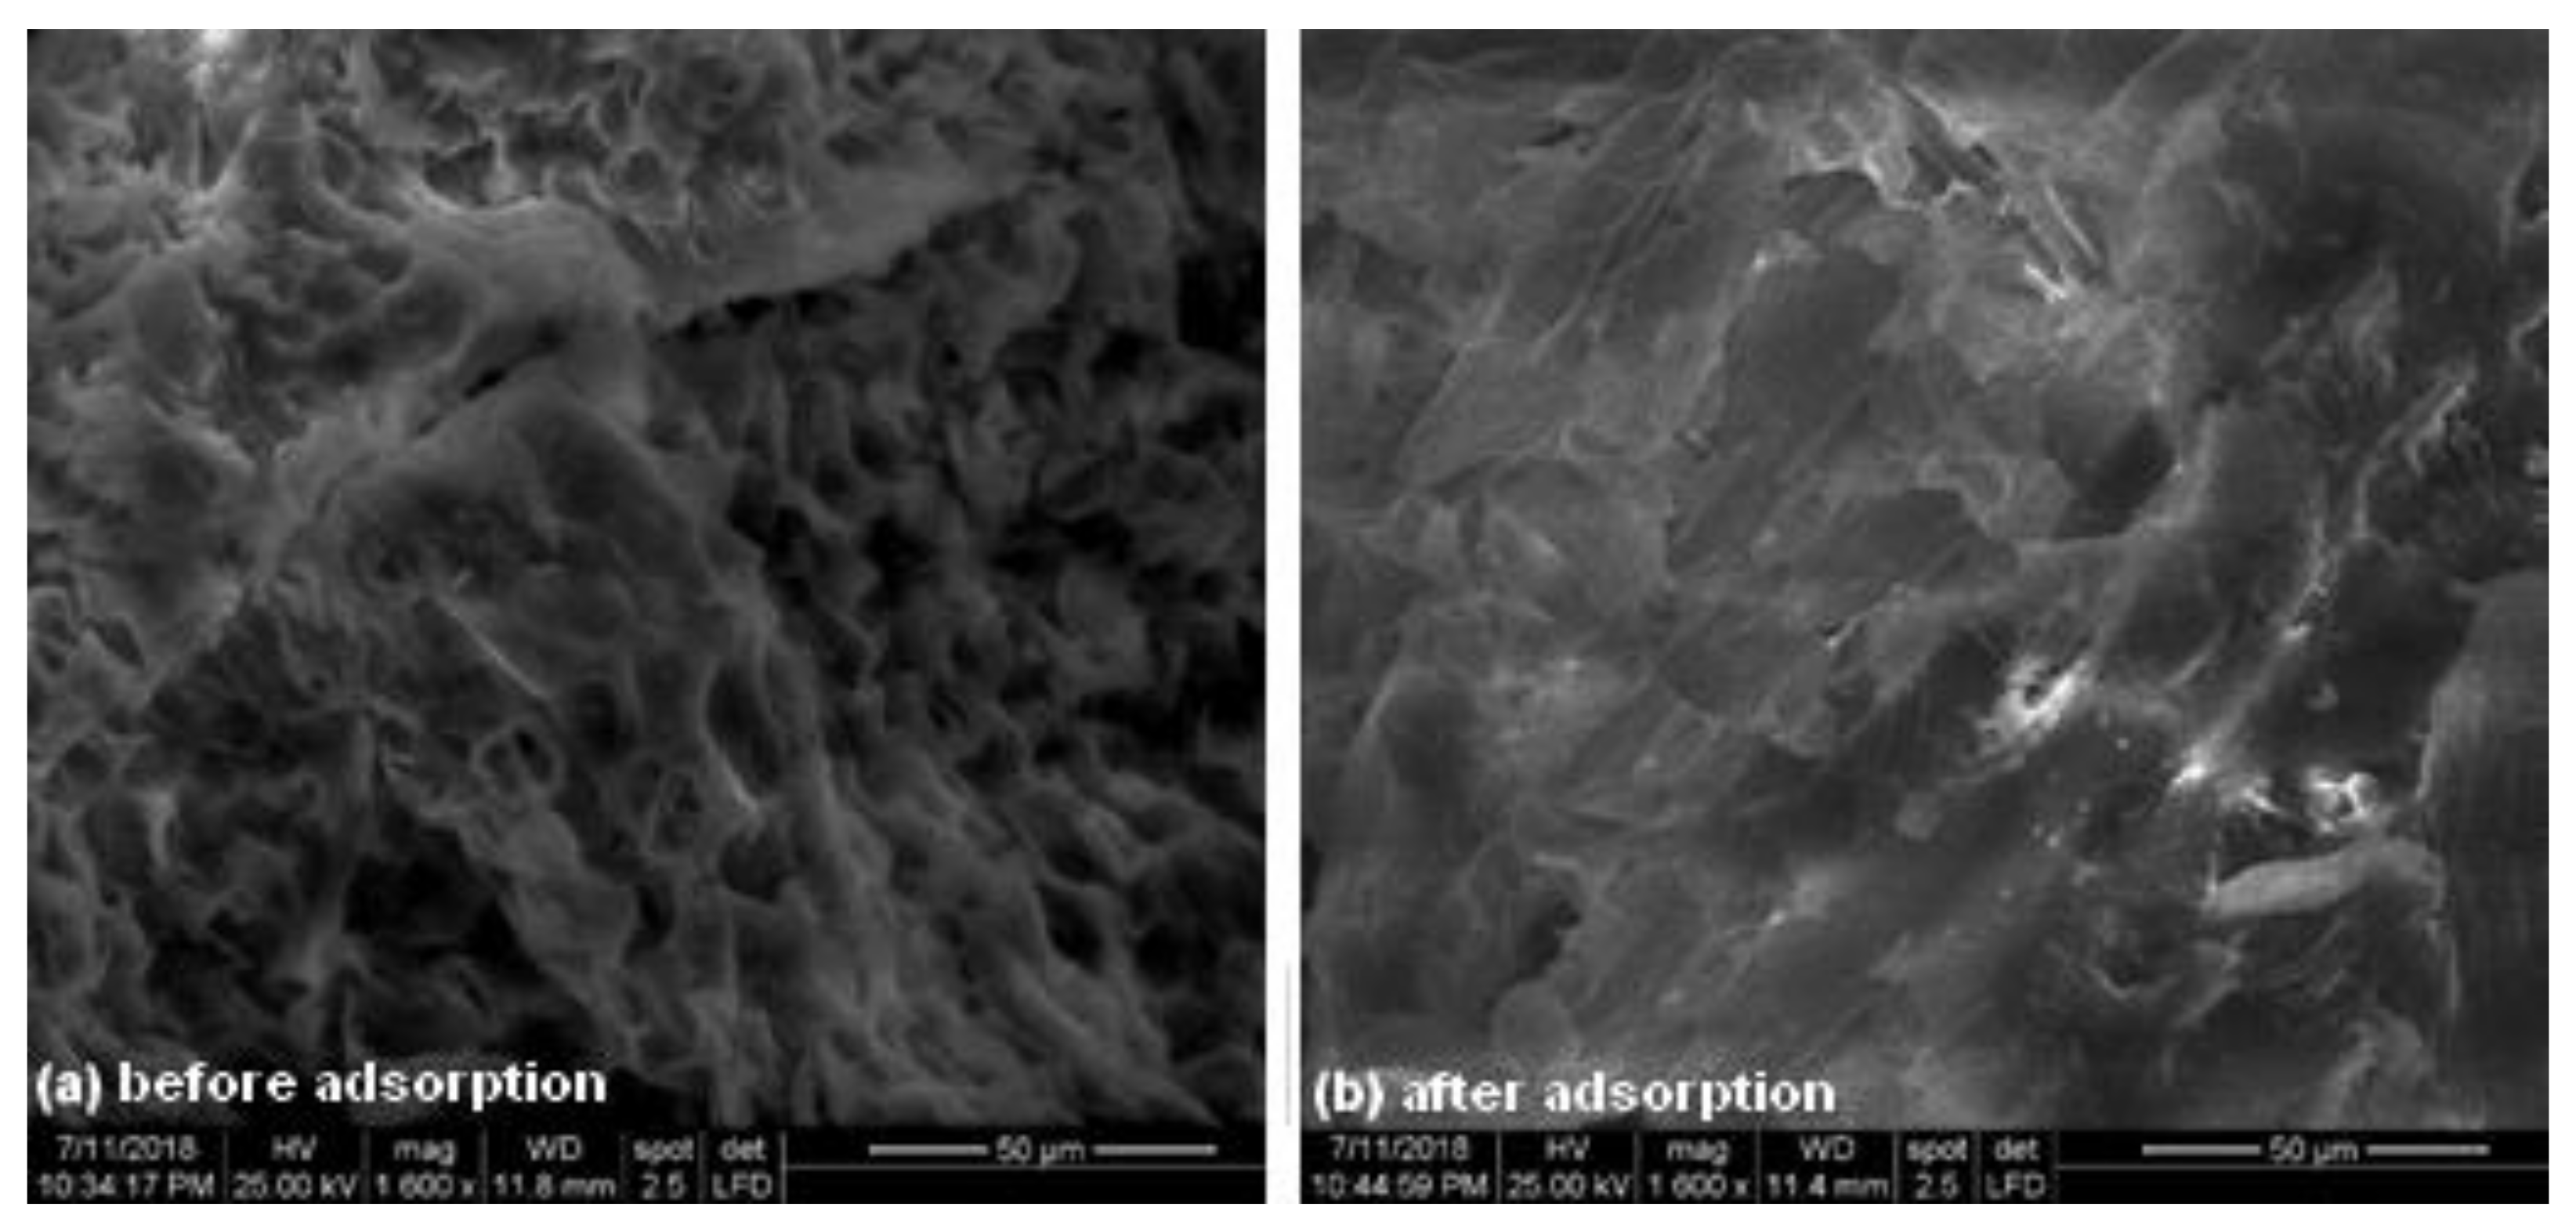
Figure 1 shows the morphology of the adsorbent before and after adsorption. Before adsorption, the surface had many pores that provided a large adsorption surface and a large number of sites available for retaining dye molecules (
Figure 1a). After adsorption, the surface of the adsorbent was saturated and covered with crystal violet molecules, which filled the pores and cavities during the process (
Figure 1b).
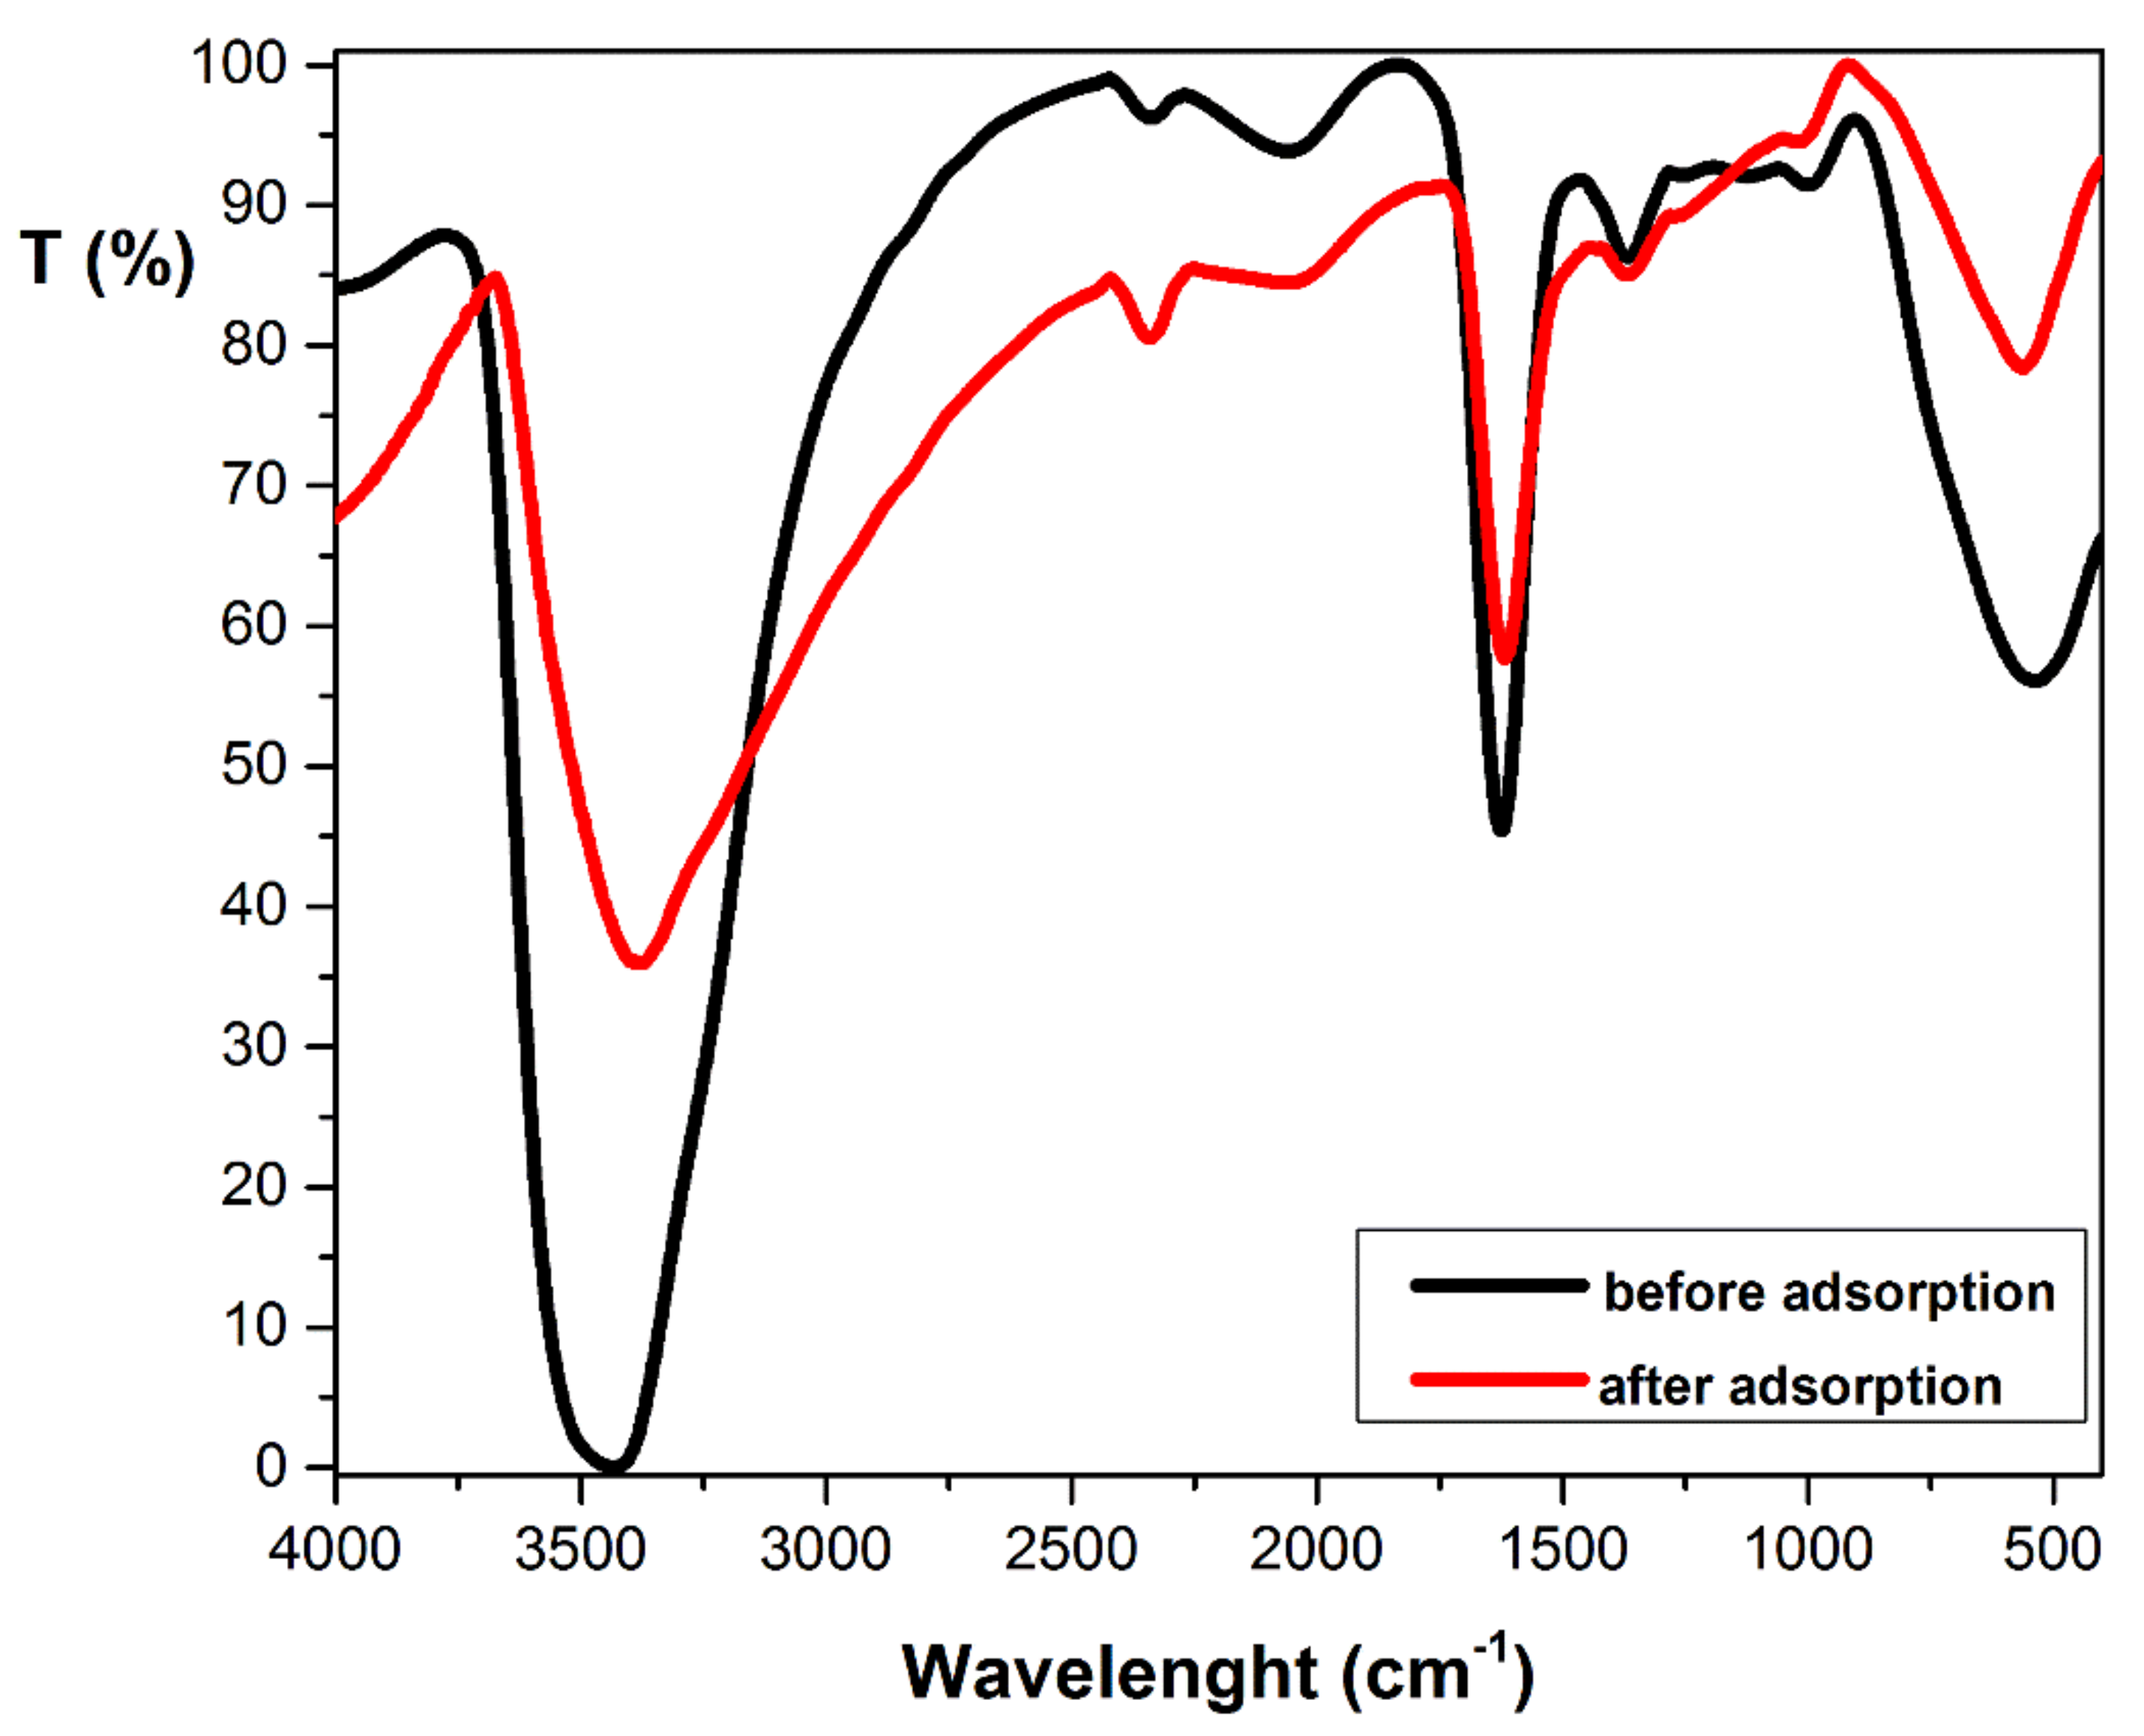
The FTIR spectra of adsorbent before and after adsorption (
Figure 2) indicate different bands specific for main functional group existing in cellulose (3448 cm
−1, 2340 cm
−1, 1630 cm
−1, 1368 cm
−1, and 1000 cm
−1) [
33,
34,
35,
36,
37] and hemicellulose (3448 cm
−1, 1368 cm
−1) [
36,
38,
39,
40]. These assignments are shown in
Table 2. After adsorption, the appearance or disappearance of any band was not found. It only presents small changes of the wavenumber, suggesting that the physical interaction or ion exchange can intervene in the adsorption mechanism [
41].
3.2. Effect of pH and Ionic Strength on Crystal Violet Adsorption
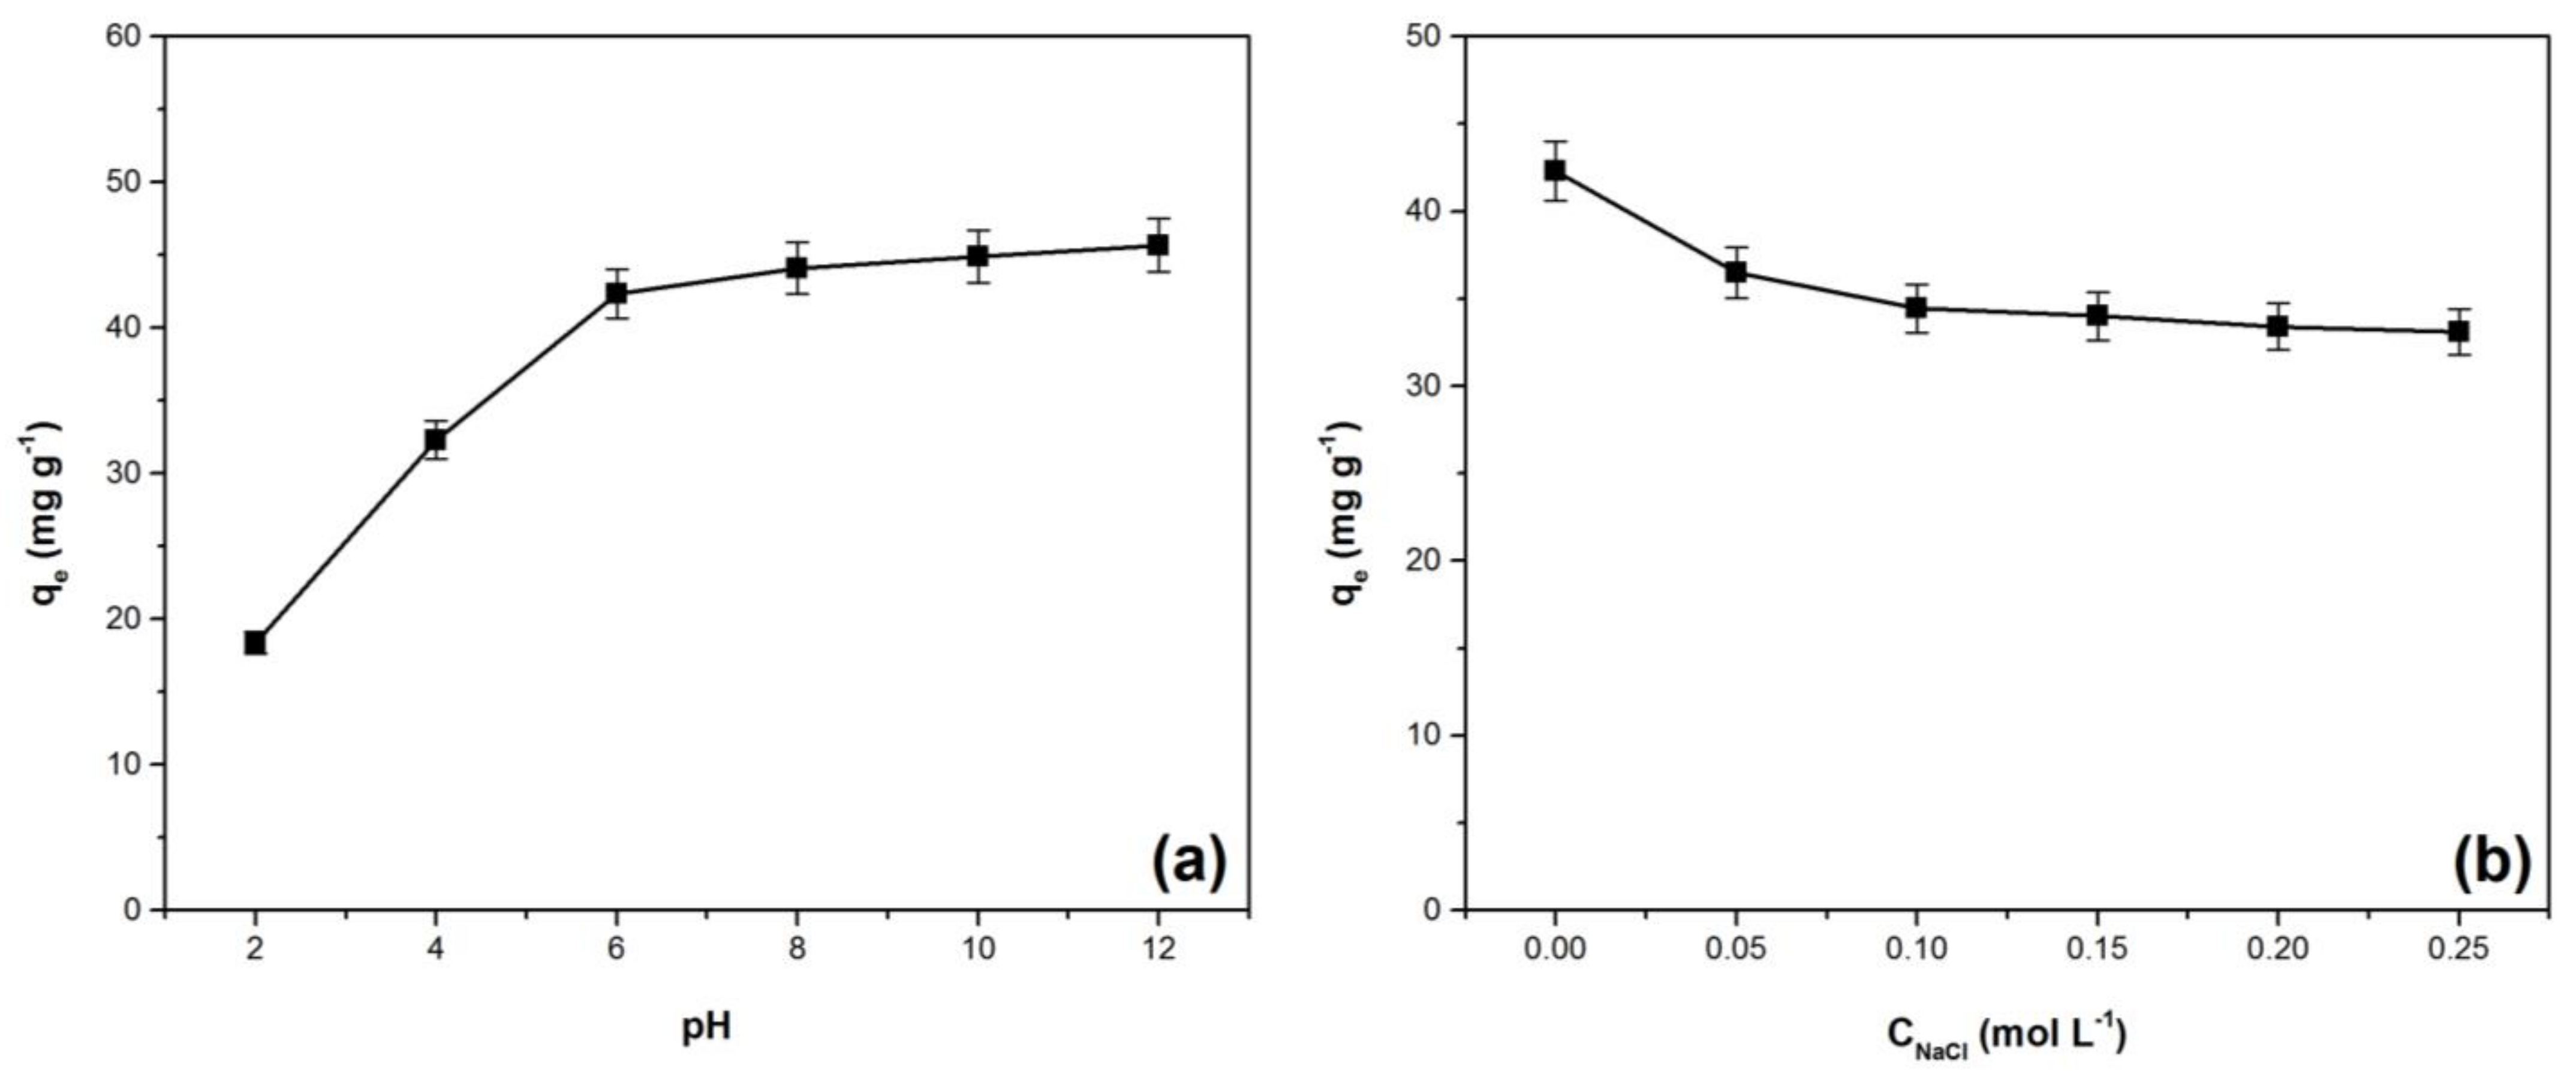
pH is an important parameter that affects the adsorbent surface charge [
42]. The influence of this parameter on the adsorption capacity was followed in the pH range 2–12 (
Figure 3a). The adsorption capacity increases with pH, reaching the highest values at basic conditions. A similar phenomenon was observed in other similar studies regarding the adsorption of crystal violet on low-cost adsorbents [
8,
9,
43,
44]. The adsorbent materials have different functional groups on the surface. At lower pH these groups will be protonated and the charge on the adsorbent surface will be predominantly positive, therefore, the adsorption process will be more difficult due to electrostatic repulsion with cationic dye molecules. For higher pH values, these functional groups will be deprotonated and the charge on the adsorbent surface will be predominantly negative. This phenomenon favors the adsorption process because there is a strong electrostatic attraction between negatively charged adsorbent surface and the dye cations [
18,
22,
45]. The adsorption capacity on the pH range 8–12 remains practically constant, suggesting that other mechanisms besides electrostatic attraction may be involved in the adsorption process [
46,
47].
Another important factor that can influence the adsorption process is the ionic strength. The effect of this factor on the adsorption capacity is presented in
Figure 3b. The decrease of adsorption capacity as the ionic strength increases is based on the competitive effect between the dye and sodium ions in occupying the available adsorption sites on the adsorbent surface [
45,
46]. A similar influence of ionic strength on the crystal violet adsorption process has been reported in other previous scientific articles [
43,
48,
49].
3.3. Effect of Adsorbent Dose and Initial Dye Concentration on Crystal Violet Adsorption
Figure 4a illustrates the adsorbent dose effect on the crystal violet adsorption process. The increase of adsorbent amount has a positive effect on the dye removal efficiency and a negative effect on the adsorption capacity. A similar phenomenon has been reported for this dye adsorbed using: eggshells [
4],
Ocotea puberula bark powder [
5], pinus bark powder [
14], lemongrass leaf combined with cellulose acetate [
42], functionalized multi-walled carbon nanotubes [
50], and inactive biomass of
Diaporthe schini [
51]. The increase of the adsorbent material dose leads to an increase of adsorption surface; therefore, removal efficiency of the dye will be higher [
11,
14,
18,
50]. The reported decrease of the adsorption capacity (q
e) can be explained based on the assumption that even if the adsorption sites number increases, many of them remain unsaturated. Other phenomenon such as agglomeration of adsorbent material particles may also occur [
4,
23,
50,
51].
The adsorption capacity increases and the removal efficiency decreases as initial dye concentration increases, as shown in
Figure 4b. Similar effects were mentioned for other adsorbents used to retain crystal violet: eggshells [
4],
Ananas comosus (pineapple) leaf powder [
18], and corn stalk [
23]. The increase of the adsorption capacity can be attributed to the fact that a high initial dye concentration leads to an increase of the concentration gradient between the dye solution and the adsorbent surface, leading to an increase of the driving force that favors the external mass transfer [
4,
11,
18,
51,
52]. At the same time, the number of collisions between dye molecules and adsorbent particles material are favored, intensifying adsorption [
53]. The unfavorable effect of increasing initial dye concentration upon removal efficiency derives from the fact that the active adsorption sites become saturated with the dye molecules accumulated during the process [
4,
18,
50,
54].
3.4. Equilibrum Study
Adsorption isotherms are used to describe the interactions between adsorbate and adsorbent that take place in the process. The calculated parameters using these isotherms provide information about the properties and affinities of the adsorbent material surface as well as about the adsorption mechanism [
1,
11,
52].
Based on the data presented in
Figure 4b (experimental results and working conditions), Langmuir and Freundlich isotherms, in the form of non-linear equations [
7,
8,
43,
55,
56,
57], were used for this purpose:
where:
qm is the maximum absorption capacity (mg·g
−1),
KL and
KF are the Langmuir and Freundlich constants, respectively, and
1/nF is an empirical constant indicating the intensity of adsorption.
In order to establish the best equations that describe the adsorption process, values of determination coefficient (R
2), sum of square error (SSE), chi-square (χ
2) and average relative error (ARE) were considered [
57]. The criterion for their applicability was the higher value for
R2 and the lower values for
SSE,
χ2, and
ARE. These parameters were determined with equations (5)−(8) [
57].
where:
yi,exp is the experimental value,
yi,mod is the modeled value,
is the mean values, and
n is the total amount of information.
The values of (R
2), (SSE), (χ
2) and (ARE) are summarized in
Table 3. It can be concluded that Langmuir isotherm best describes the adsorption process.
The
RL separation coefficient can be used to predict whether an adsorption system is favorable or unfavorable. It can be calculated using the following equation:
where:
KL is the Langmuir constant, and C
0 is the initial dye concentration (mg·L
−1) [
10,
11,
22].
The calculated value for RL (0.29) indicates a favorable adsorption.
The value of the maximum adsorption capacity obtained for Bathurst burr powder, 164.10 (mg·g
−1), is higher than other similar adsorbents previously reported in the literature.
Table 4 shows the values for the maximum adsorption capacities of several similar adsorbents used for the adsorption of crystal violet dye.
3.5. Kinetic and Thermodynamic Studies
The adsorption kinetics study provides information on the operating conditions and the kinetic parameters. These are the basis for predicting the adsorption rate and designing the adsorption processes [
52,
59].
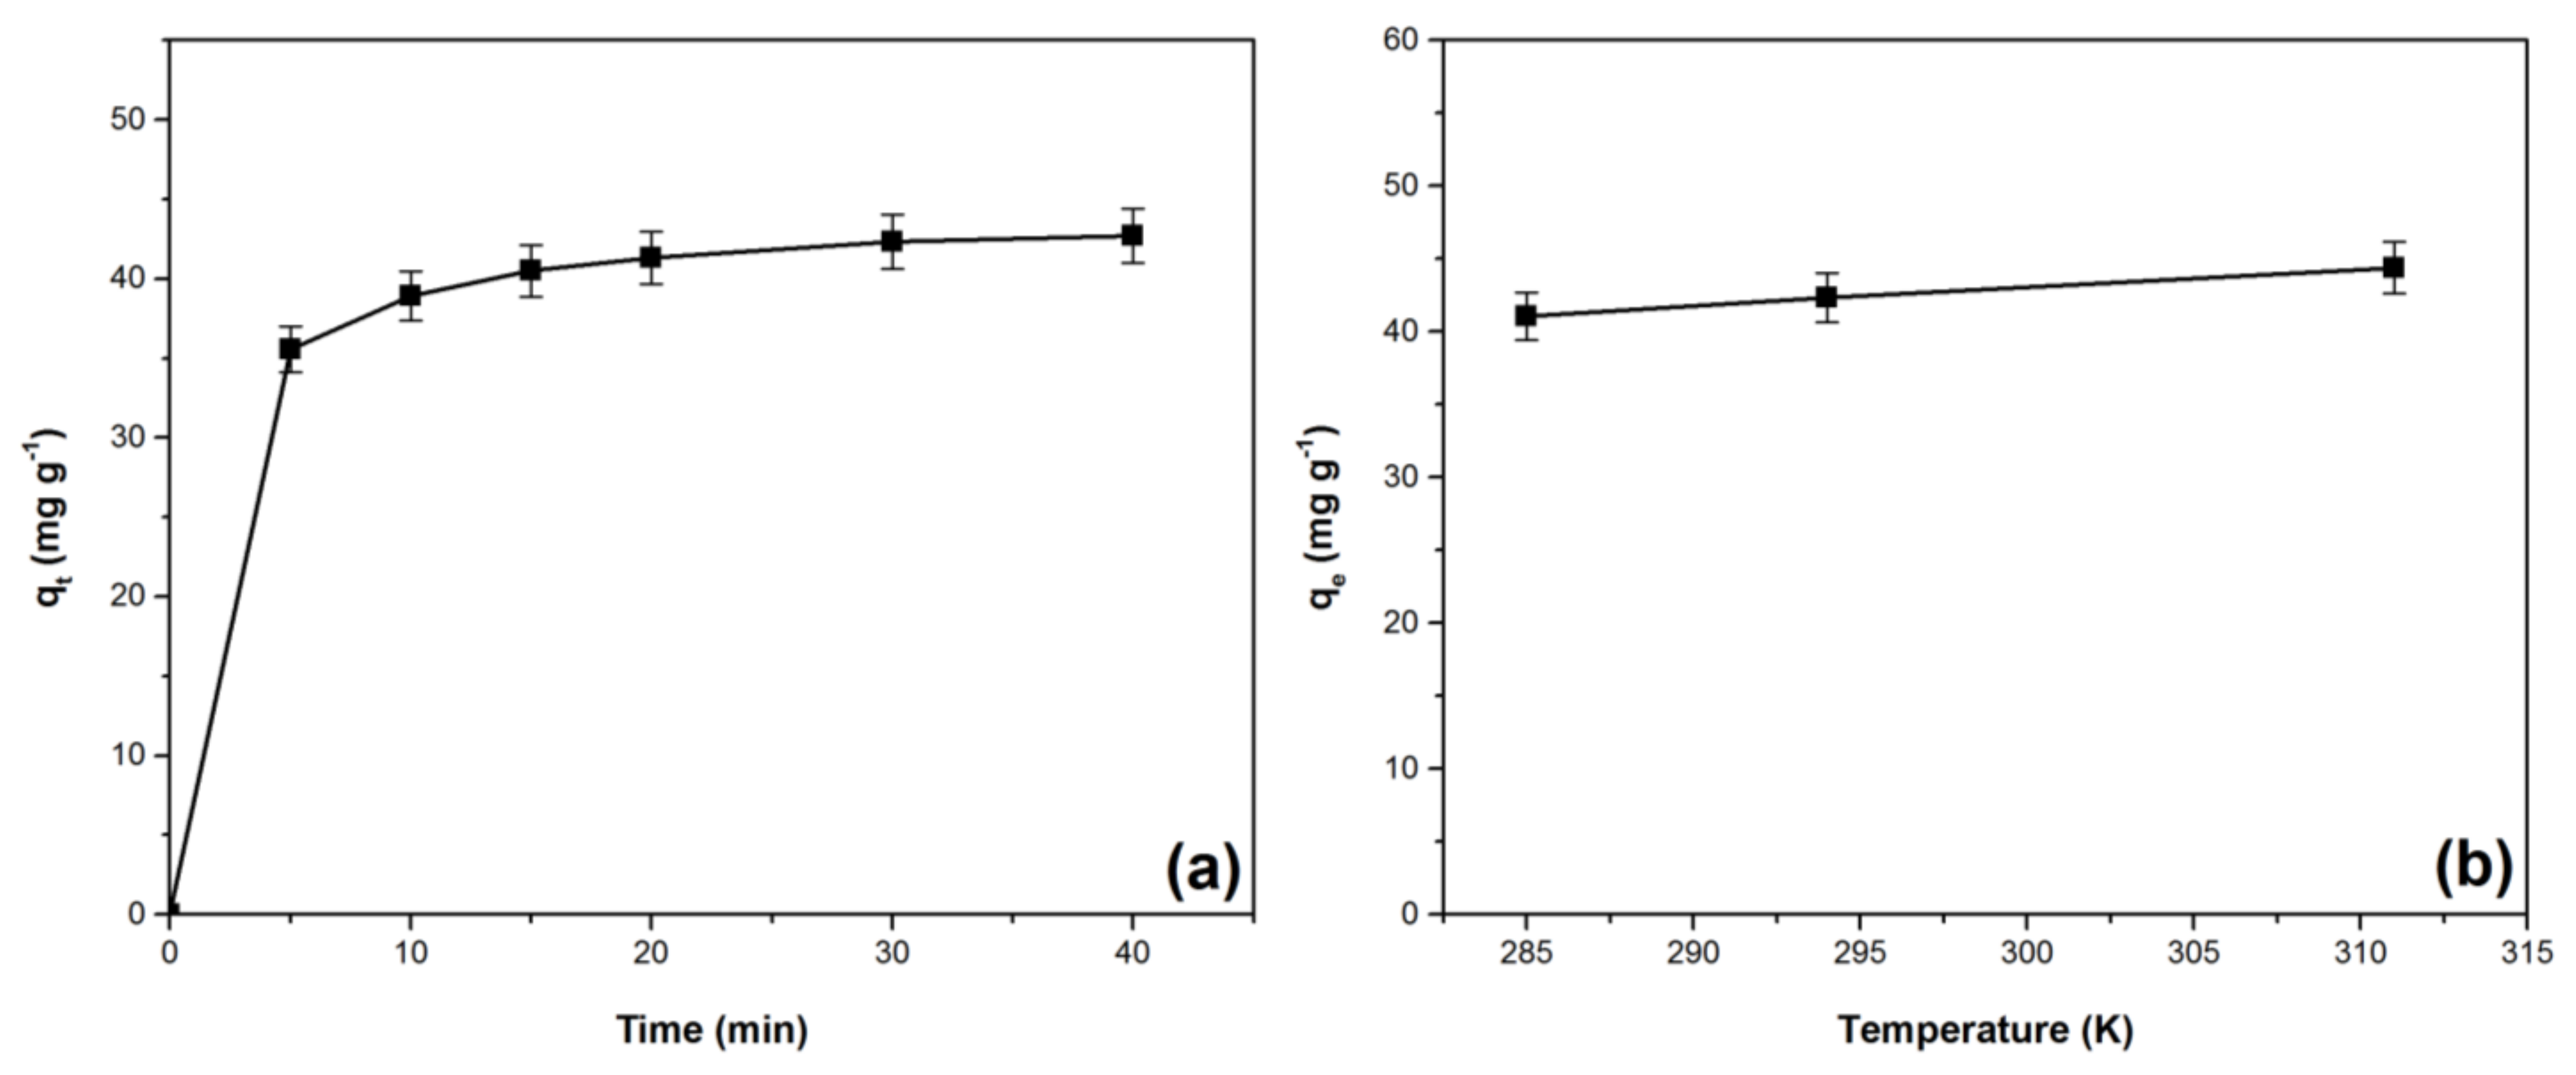
The effect of contact time on crystal violet adsorption is shown in
Figure 5a. The adsorption capacity increases with the contact time between the dye solution and the adsorbent material. After 30 min, the equilibrium is reached and the value of this parameter remains practically constant. In the first 15 min the increase is more pronounced because at the beginning of the process many free adsorption sites on the surface of the adsorbent are available to retain the dye, [
8,
9,
24,
42,
49]. After 15 min the adsorption capacity increases more slowly, because more and more free sites on the adsorbent surface are occupied by dye molecules and repulsive forces between adsorbed and liquid phase molecules may occur [
8,
9,
45,
50]. The increase of the adsorption capacity stops when the equilibrium is reached, the whole adsorbent surface becomes saturated with dye, and the adsorption sites are all occupied [
8,
9,
47].
The equilibrium times, reported in scientific literature, for different crystal violet adsorbents, were: 15 min for pecan pericarp [
3]; 30 min for
Artocarpus odoratissimus leaf-based cellulose [
43] and graphene oxide intercalated montmorillonite nanocomposite [
60]; 45 min for functionalized multi-walled carbon nanotubes [
50]; 60 min for
Moringa oleifera pod husk [
24]; 90 min for NaOH-modified rice husk [
45]; 120 min
for Ocotea puberula bark powder [
5],
Terminalia arjuna sawdust [
9], and pinus bark powder [
14]; 150 min for yeast-treated peat [
44]; 180 min for
Eragrostis plana nees [
7]; 240 min for lemongrass leaf combined with cellulose acetate [
42]; and 420 min for crosslinked grafted xanthan gum [
48].
The pseudo-first-order and pseudo-second-order models, in the form of non-linear equations [
7,
8,
43,
55,
56,
57] were employed to study the adsorption kinetics:
where:
qt is the crystal violet amount adsorbed at time
t (mg·g
−1), and
k1 and
k2 are the rate constants of pseudo-first-order kinetic model and the pseudo-second-order kinetic model, respectively.
The pseudo-second-order kinetic model had the highest value for the determination coefficient (R
2) and the lowest values for sum of square error (SSE), chi-square (χ
2), and average relative error (ARE), (
Table 5). Therefore, this model is the most suitable to characterize the process. A similar observation has been reported in other previous scientific articles [
7,
11,
14,
16,
18,
19,
25].
Figure 5b illustrates the effect of temperature on the adsorption capacity, indicating that the adsorption process is endothermic in nature [
61,
62]. A similar aspect has been reported in other previous studies regarding crystal violet absorption [
44,
54]. The increase of the adsorption capacity can be explained based on the increasing mobility of the dye molecules due to the viscosity decrease with temperature [
44,
47,
54,
62].
Standard Gibbs free energy change, standard enthalpy change, and standard entropy change were calculated from experimental data obtained at temperatures of 285, 294, and 311 K using the equations described in literature [
7,
56]:
where:
R is the universal gas constant,
KL is the Langmuir constant, and
T is the absolute temperature.
Thermodynamic parameters (
Table 6) were determined from the slope and the intercept of ln K
L versus 1/T plot (see
Supplementary Material, Figure S4). The data analysis show that the adsorption process is endothermic, spontaneous, and favorable (ΔH
0 > 0, ΔG
0 < 0). The affinity of adsorbent for crystal violet and the increased randomness at the solid–solute interface (the degrees of freedom of the adsorbed species) are indicated by the positive value of ΔS
0 [
1,
25,
56]. Similar results were obtained by other researchers on low-cost adsorbent materials [
7,
14,
25]. The physisorption is involved in the process (ΔH
0 < 40 kJ mol
−1) [
25,
44] and van der Waals interaction plays an important role in the physical adsorption (ΔH
0 < 20 kJ mol
−1) [
63]. When standard Gibbs free energy change (ΔG
0) ranges from −20 to −80 (kJ mol
−1) the process is physisorption, intensified by the chemical effect [
49].
3.6. Optimization Parameters of Adsorption Process Using Taguchi Approach
The Taguchi method was used to determine the optimal experimental conditions for obtaining the highest efficiency of dye removal from water, using a minimized number of experiments. According to this method, the experimental results are converted into a signal-to-noise (S/N) ratio, which is an indicator that describes at the same time the level of dispersion and degree of optimization, in relation to the desired value. Depending on the number of controllable parameters and their levels, the Taguchi method uses the proper and most representative orthogonal array that distributes the variables in a balanced way [
30,
31,
32]. For six controllable factors at three levels, the classical full factorial design must use more experiments (3
6 = 729) to establish optimal conditions. In this case, the proper Taguchi orthogonal array is L
27, which reduce the number of experiments to 27.
The obtained results for dye removal efficiency and the S/N ratios for each run are presented in
Supplementary Material, Table S1. The S/N ratio rank was used to establish the order of the controllable factors’ significance (
Table 7). The factor that had the least influence on the process was the temperature, while the factor with the greatest influence was the pH. The optimal conditions to obtain the highest efficiency of crystal violet removal are highlighted in
Table 7. ANOVA results for signal-to-noise S/N ratios certify the same order of influence for the controllable factor. The percentage contribution of each factor is shown in
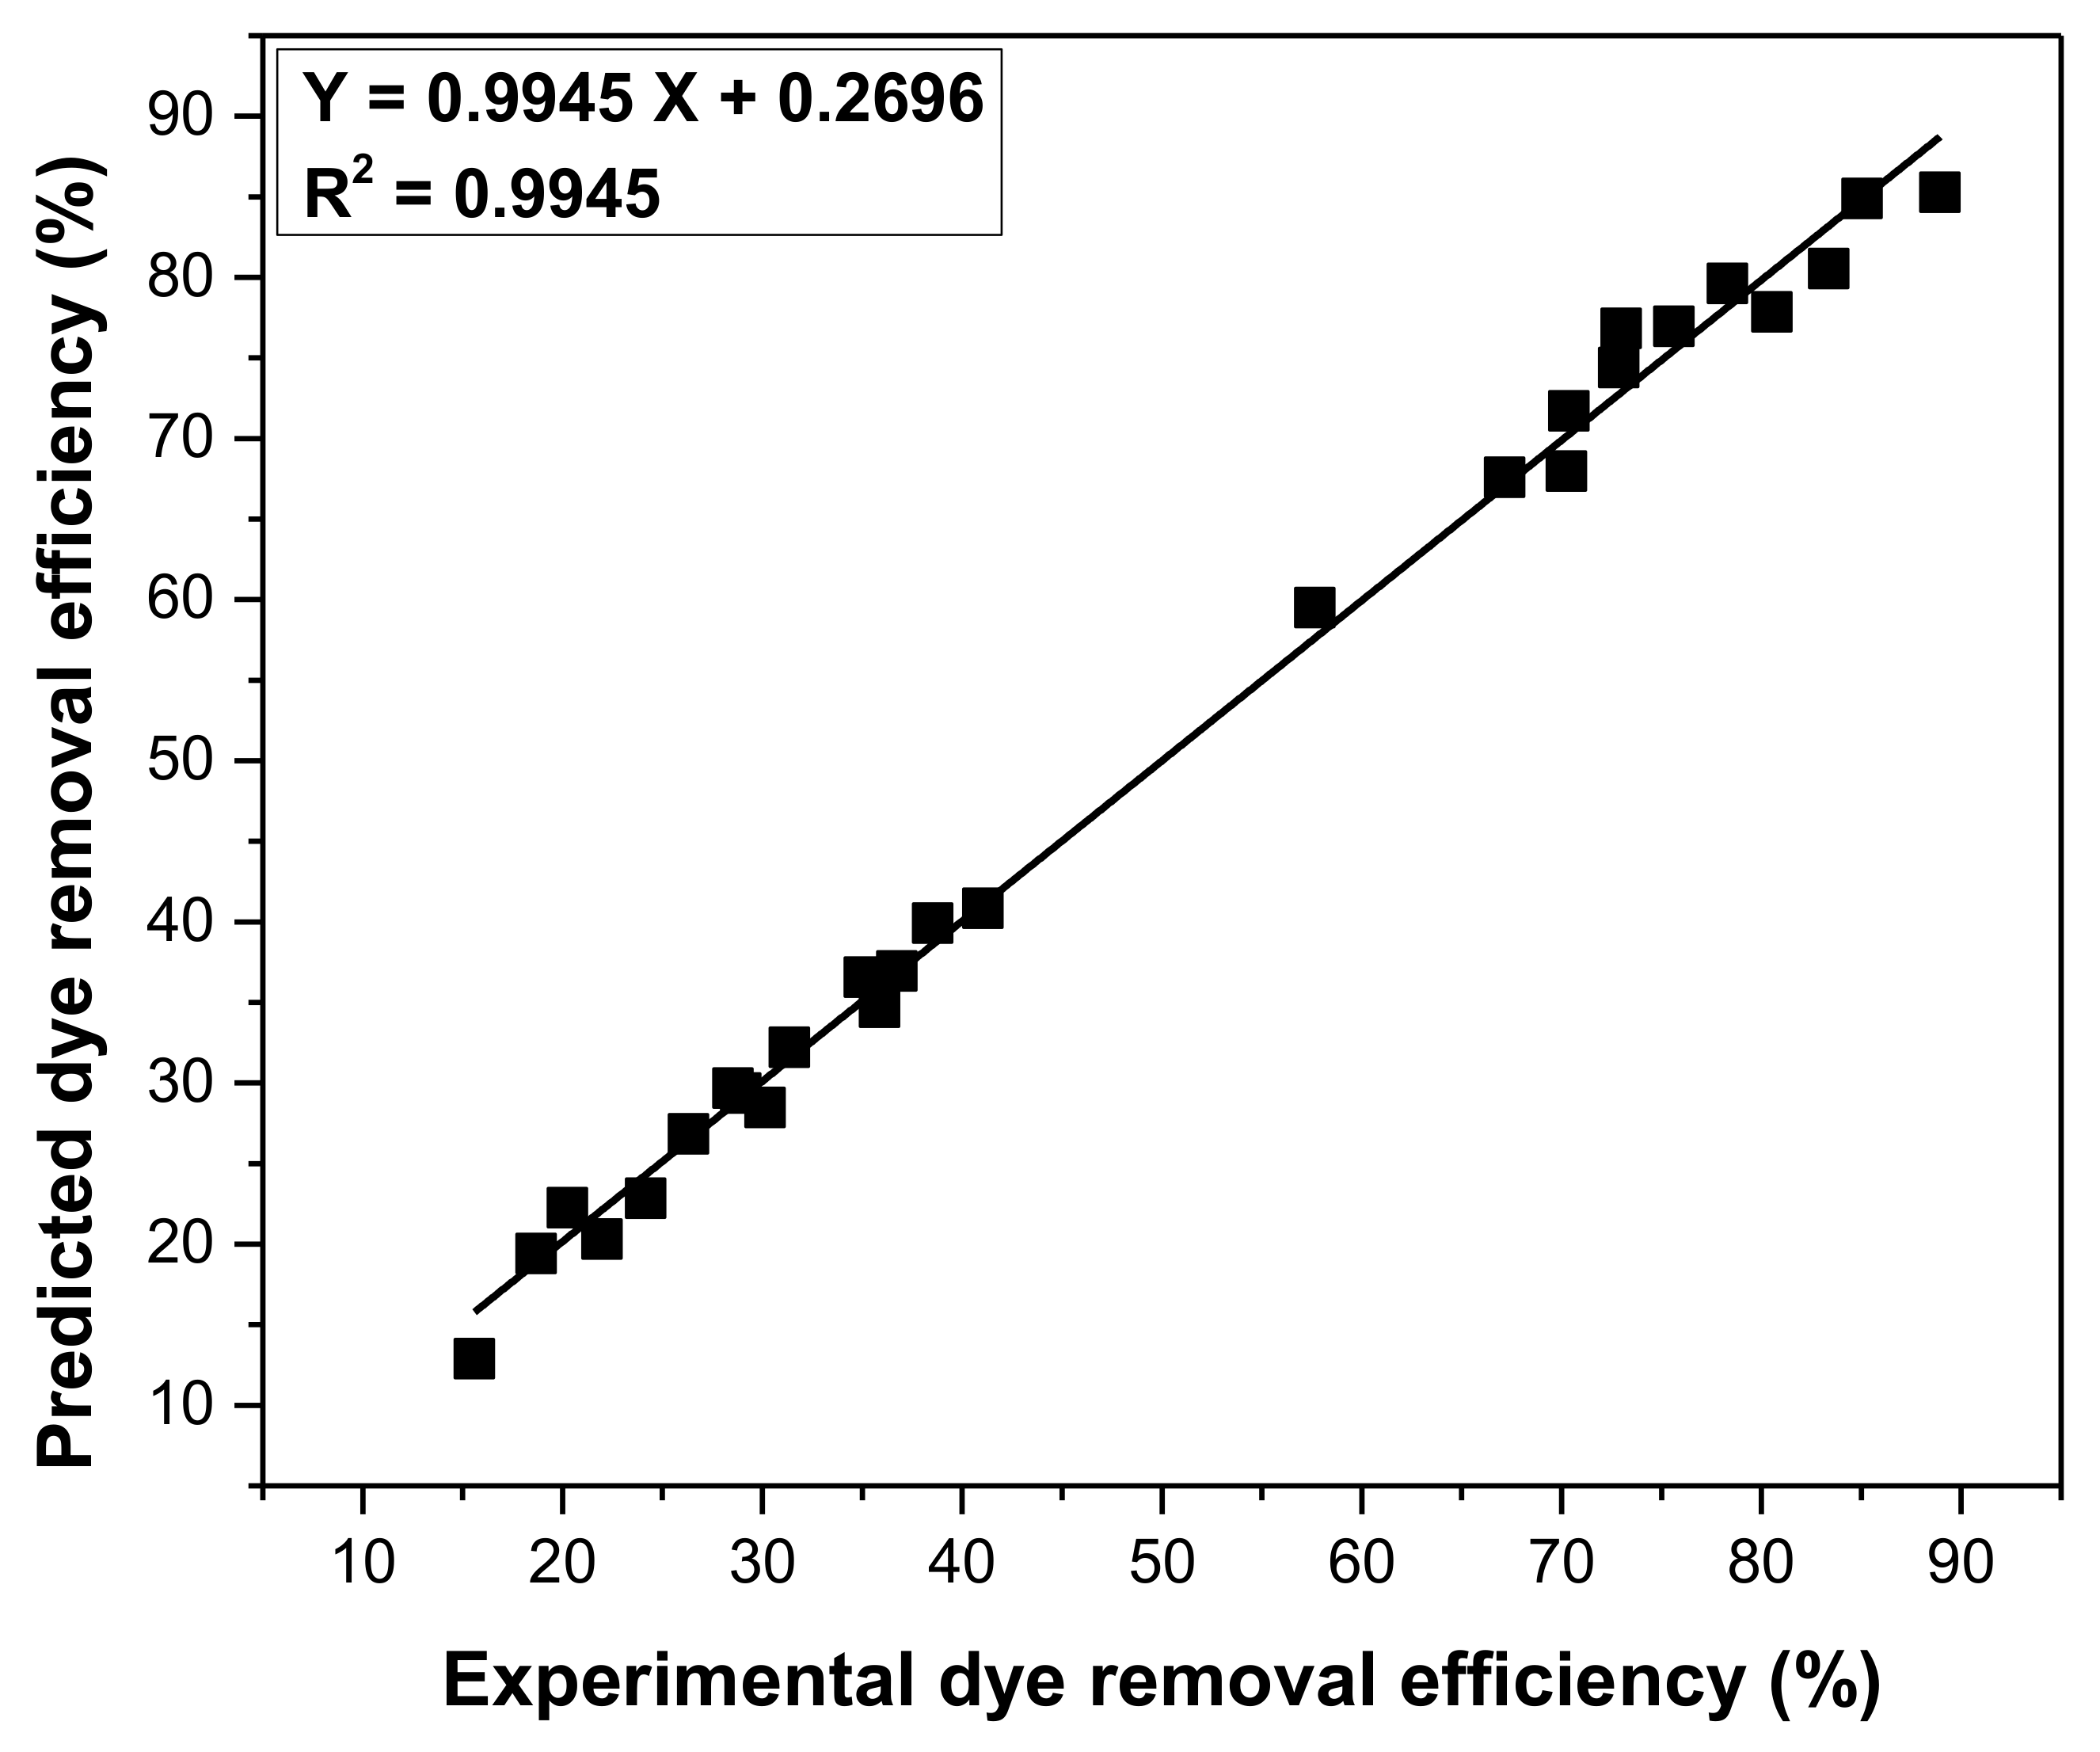
Table 7. The predicted crystal violet removal efficiency was correlated with the experimentally determined one, and it was found that the accuracy of the prediction of the Taguchi method is very good, R
2 being close to unity (
Figure 6).


