
Lutein Treatment Effects on the Redox Status and Metalloproteinase-9 (MMP-9) in Oral Cancer Squamous Cells—Are There Therapeutical Hopes?

 ,
,
Abstract
:1. Introduction
2. Materials and Methods
2.1. Lutein Nanoparticles Synthesis and Characterization
2.2. Human Cells BICR10 (ECACC 04072103) of Buccal Mucosa Squamous Carcinoma Protocol
2.3. ELISA Analyses
2.4. Statistical Analysis
3. Results
4. Discussion
5. Conclusions
Author Contributions
Funding
Institutional Review Board Statement
Informed Consent Statement
Data Availability Statement
Conflicts of Interest
References
- Ghantous, Y.; Abu Elnaaj, I. Global incidence and risk factors of oral cancer. Harefuah 2017, 156, 645–649. [Google Scholar]
- Peisker, A.; Raschke, G.; Fahmy, M.D.; Guentsch, A.; Roshanghias, K.; Hennings, J.; Schultze-Mosgau, S. Salivary MMP-9 in the detection of oral squamous cell carcinoma. Med. Oral Patol. Oral Cir. Bucal 2017, 22, e270–e275. [Google Scholar] [CrossRef] [Green Version]
- Weijers, M.; Snow, G.; Bezemer, D.; Van Der Wal, J.; Van Der Waal, I. The status of the deep surgical margins in tongue and floor of mouth squamous cell carcinoma and risk of local recurrence; an analysis of 68 patients. Int. J. Oral Maxillofac. Surg. 2004, 33, 146–149. [Google Scholar] [CrossRef]
- Nathan, C.-A.O.; Amirghahri, N.; Rice, C.; Abreo, F.W.; Shi, R.; Stucker, F.J. Molecular Analysis of Surgical Margins in Head and Neck Squamous Cell Carcinoma Patients. Laryngoscope 2002, 112, 2129–2140. [Google Scholar] [CrossRef]
- Nathan, C.-A.O.; Amirghahari, N.; Abreo, F.; Rong, X.; Caldito, G.; Jones, M.L.; Zhou, H.; Smith, M.; Kimberly, D.; Glass, J. Overexpressed eIF4E Is Functionally Active in Surgical Margins of Head and Neck Cancer Patients via Activation of the Akt/Mammalian Target of Rapamycin Pathway. Clin. Cancer Res. 2004, 10, 5820–5827. [Google Scholar] [CrossRef] [Green Version]
- Bugshan, A.; Farooq, I. Oral squamous cell carcinoma: Metastasis, potentially associated malignant disorders, etiology and recent advancements in diagnosis. F1000Research 2020, 9, 229. [Google Scholar] [CrossRef] [PubMed]
- Ogbureke, K.U.E.; Weinberger, P.M.; Looney, S.W.; Li, L.; Fisher, L.W. Expressions of matrix metalloproteinase-9 (MMP-9), dentin sialophosphoprotein (DSPP), and osteopontin (OPN) at histologically negative surgical margins may predict recurrence of oral squamous cell carcinoma. Oncotarget 2012, 3, 286–298. [Google Scholar] [CrossRef] [PubMed]
- Contaldo, M.; Boccellino, M.; Zannini, G.; Romano, A.; Sciarra, A.; Sacco, A.; Settembre, G.; Coppola, M.; Di Carlo, A.; D’Angelo, L.; et al. Sex Hormones and Inflammation Role in Oral Cancer Progression: A Molecular and Biological Point of View. J. Oncol. 2020, 2020, 1–14. [Google Scholar] [CrossRef] [PubMed]
- Hussein, A.A.; Forouzanfar, T.; Bloemena, E.; De Visscher, J.; Brakenhoff, R.H.; Leemans, C.R.; Helder, M.N. A review of the most promising biomarkers for early diagnosis and prognosis prediction of tongue squamous cell carcinoma. Br. J. Cancer 2018, 119, 724–736. [Google Scholar] [CrossRef] [Green Version]
- Tavakoli, N.N.; Hambly, B.D.; Sullivan, D.R.; Bao, S. Forkheadboxprotein 3: Essential immune regulatory role. Int. J. Biochem. Cell Biol. 2008, 40, 2369–2373. [Google Scholar] [CrossRef] [PubMed]
- Ialongo, C. Preanalytic of total antioxidant capacity assays performed in serum, plasma, urine and saliva. Clin. Biochem. 2017, 50, 356–363. [Google Scholar] [CrossRef] [PubMed]
- Rauch, T.A.; Wang, Z.; Wu, X.; Kernstine, K.H.; Riggs, A.; Pfeifer, G.P. DNA methylation biomarkers for lung cancer. Tumor Biol. 2011, 33, 287–296. [Google Scholar] [CrossRef] [PubMed]
- Kiokias, S.; Proestos, C.; Varzakas, T. A Review of the Structure, Biosynthesis, Absorption of Carotenoids-Analysis and Properties of their Common Natural Extracts. Curr. Res. Nutr. Food Sci. J. 2016, 4, 25–37. [Google Scholar] [CrossRef]
- Garewal, H.; Meyskens, F.; Friedman, S.; Alberts, D.; Ramsey, L. Oral Cancer Prevention: The Case for Carotenoids and Anti-Oxidant Nutrients. Prev. Med. 1993, 22, 701–711. [Google Scholar] [CrossRef] [Green Version]
- Maoka, T. Carotenoids as natural functional pigments. J. Nat. Med. 2020, 74, 1–16. [Google Scholar] [CrossRef] [Green Version]
- Wu, L.; Lin, D. 25–Molecular Aspects of Carotenoid Metabolizing Enzymes and Implications for Ophthalmology. In Handbook of Nutrition, Diet, and the Eye, 2nd ed.; Preedy, V.R., Watson, R.R., Eds.; Academic Press: Cambridge, MA, USA, 2019; pp. 415–424. [Google Scholar]
- Fernández-García, E.; Carvajal-Lérida, I.; Jarén-Galán, M.; Garrido-Fernández, J.; Pérez-Gálvez, A.; Hornero-Méndez, D. Carotenoids bioavailability from foods: From plant pigments to e_cient biological activities. Food Res. Int. 2012, 46, 438–450. [Google Scholar] [CrossRef]
- Langi, P.; Kiokias, S.; Varzakas, T.; Proestos, C. Carotenoids: From Plants to Food and Feed Industries. Methods Mol. Biol. 2018, 1852, 57–71. [Google Scholar] [CrossRef]
- Xavier, A.A.O.; Pérez-Gálvez, A. Carotenoids as a Source of Antioxidants in the Diet. In Carotenoids in Nature; Stange, C., Ed.; Subcellular Biochemistry; Springer International Publishing: Cham, Switzerland, 2016; Volume 79, pp. 359–375. ISBN 978-3-319-39124-3. [Google Scholar]
- Ribaya-Mercado, J.D.; Blumberg, J.B. Lutein and Zeaxanthin and Their Potential Roles in Disease Prevention. J. Am. Coll. Nutr. 2004, 23, 567S–587S. [Google Scholar] [CrossRef]
- Sindhu, E.R.; Firdous, A.P.; Ramnath, V.; Kuttan, R. Effect of carotenoid lutein on N-nitrosodiethylamine-induced hepatocellular carcinoma and its mechanism of action. Eur. J. Cancer Prev. 2013, 22, 320–327. [Google Scholar] [CrossRef]
- Rafi, M.M.; Kanakasabai, S.; Gokarn, S.V.; Krueger, E.G.; Bright, J.J. Dietary Lutein Modulates Growth and Survival Genes in Prostate Cancer Cells. J. Med. Food 2015, 18, 173–181. [Google Scholar] [CrossRef]
- Sumantran, V.N.; Zhang, R.; Lee, D.S.; Wicha, M.S. Differential regulation of apoptosis in normal versus transformed mammary epithelium by lutein and retinoic acid. Cancer Epidemiol. Biomark. Prev. 2000, 9, 257–263. [Google Scholar]
- Chew, B.P.; Brown, C.M.; Park, J.S.; Mixter, P.F. Dietary lutein inhibits mouse mammary tumour growth by regulating angiogenesis and apoptosis. Anticancer Res. 2003, 23, 3333–3339. [Google Scholar] [PubMed]
- Tran, S.; DeGiovanni, P.; Piel, B.; Rai, P. Cancer nanomedicine: A review of recent success in drug delivery. Clin. Transl. Med. 2017, 6, 44. [Google Scholar] [CrossRef] [Green Version]
- Aghebati-Maleki, L.; Dolati, S.; Ahmadi, M.; Baghbanzhadeh, A.; Asadi, M.; Fotouhi, A.; Yousefi, M. Nanoparticles and cancer therapy: Perspectives for application of nanoparticles in the treatment of cancers. J. Cell. Physiol. 2020, 235, 1962–1972. [Google Scholar] [CrossRef] [PubMed]
- Awasthi, R.; Roseblade, A.; Hansbro, P.; Rathbone, M.J.; Dua, K.; Bebawy, M. Nanoparticles in Cancer Treatment: Opportunities and Obstacles. Curr. Drug Targets 2018, 19, 1696–1709. [Google Scholar] [CrossRef]
- Patra, J.K.; Das, G.; Fraceto, L.F.; Campos, E.V.R.; del Pilar Rodriguez-Torres, M.; Acosta-Torres, L.S.; Diaz-Torres, L.A.; Grillo, R.; Swamy, M.K.; Sharma, S.; et al. Nano based drug delivery systems: Recent developments and future prospects. J. Nanobiotechnol. 2018, 16, 71. [Google Scholar] [CrossRef] [PubMed] [Green Version]
- Miricescu, D.; Stanescu, I.; Perlea, P.; Calenic, B.; Radulescu, R.; Totan, A.; Virgolici, B.; Sabliov, C.; Greabu, M. Oxidative Stress Following PLGA. Nanoparticles Administration to an Animal Model. Mater. Plast. 2017, 54, 249–252. [Google Scholar] [CrossRef]
- Miricescu, D.; Totan, A.; Stanescu, I.; Didilescu, A.; Sfeatcu, R.; Stanescu, A.M.A.; Stefani, C.; Greabu, M. Antioxidant Activity of Entrapped alfa-tocopherol and Luteinin PLGA Nanoparticles in Wistar Rats. Mater. Plast. 2019, 56, 520–524. [Google Scholar] [CrossRef]
- Kamiguti, A.S.; Serrander, L.; Lin, K.; Harris, R.J.; Cawley, J.C.; Allsup, D.; Slupsky, J.R.; Krause, K.-H.; Zuzel, M. Expression and Activity of NOX5 in the Circulating Malignant B Cells of Hairy Cell Leukemia. J. Immunol. 2005, 175, 8424–8430. [Google Scholar] [CrossRef] [Green Version]
- Patel, B.P.; Rawal, U.M.; Dave, T.K.; Rawal, R.M.; Shukla, S.N.; Shah, P.M.; Patel, P. Lipid Peroxidation, Total Antioxidant Status, and Total Thiol Levels Predict Overall Survival in Patients with Oral Squamous Cell Carcinoma. Integr. Cancer Ther. 2007, 6, 365–372. [Google Scholar] [CrossRef]
- Kumar, B.; Koul, S.; Khandrika, L.; Meacham, R.B.; Koul, H.K. Oxidative Stress Is Inherent in Prostate Cancer Cells and Is Required for Aggressive Phenotype. Cancer Res. 2008, 68, 1777–1785. [Google Scholar] [CrossRef] [Green Version]
- Nigitza, T.; Gölles, M. A generally applicable, simple and adaptive forecasting method for the short-term heat load of consumers. Appl. Energy 2019, 241, 73–81. [Google Scholar] [CrossRef]
- Roy, K.; Wu, Y.; Meitzler, J.L.; Juhasz, A.; Liu, H.; Jiang, G.; Lu, J.; Antony, S.; Doroshow, J.H. NADPH oxidases and cancer. Clin. Sci. 2015, 128, 863–875. [Google Scholar] [CrossRef] [PubMed]
- Simabuco, F.M.; Morale, M.G.; Pavan, I.C.B.; Morelli, A.P.; Silva, F.R.; Rodrigo, E.; Tamura, R.E. p53 and metabolism: From mechanism to therapeutics. Oncotarget 2018, 9, 23780–23823. [Google Scholar] [CrossRef] [PubMed] [Green Version]
- Liu, B.; Chen, Y.; Clair, D.K.S. ROS and p53: A versatile partnership. Free Radic. Biol. Med. 2008, 44, 1529–1535. [Google Scholar] [CrossRef] [PubMed] [Green Version]
- Sablina, A.A.; Budanov, A.V.; Ilyinskaya, G.V.; Agapova, L.S.; Kravchenko, J.E.; Chumakov, P.M. The antioxidant function of the p53 tumour suppressor. Nat. Med. 2005, 11, 1306–1313. [Google Scholar] [CrossRef] [Green Version]
- Polyak, K.; Xia, Y.; Zweier, J.L.; Kinzler, K.W.; Vogelstein, B. A model for p53-induced apoptosis. Nat. Cell Biol. 1997, 389, 300–305. [Google Scholar] [CrossRef]
- Porté, S.; Valencia, E.; Yakovtseva, E.A.; Borràs, E.; Shafqat, N.; Debreczeny, J.É.; Pike, A.C.; Oppermann, U.; Farrés, J.; Fita, I.; et al. Three-dimensional Structure and Enzymatic Function of Proapoptotic Human p53-inducible Quinone Oxidoreductase PIG3. J. Biol. Chem. 2009, 284, 17194–17205. [Google Scholar] [CrossRef] [Green Version]
- Zhang, Q.; Cheng, G.; Qiu, H.; Zhu, L.; Ren, Z.; Zhao, W.; Zhang, T.; Liu, L. The p53-inducible gene 3 involved in flavonoid-induced cytotoxicity through the reactive oxygen species-mediated mitochondrial apoptotic pathway in human hepatoma cells. Food Funct. 2015, 6, 1518–1525. [Google Scholar] [CrossRef]
- Kotsinas, A.; Aggarwal, V.; Tan, E.-J.; Levy, B.; Gorgoulis, V.G. PIG3: A novel link between oxidative stress and DNA damage response in cancer. Cancer Lett. 2012, 327, 97–102. [Google Scholar] [CrossRef]
- Budanov, A.V.; Karin, M. p53 Target Genes Sestrin1 and Sestrin2 Connect Genotoxic Stress and mTOR Signaling. Cell 2008, 134, 451–460. [Google Scholar] [CrossRef] [Green Version]
- Feng, Z.; Zhang, H.; Levine, A.J.; Jin, S. The coordinate regulation of the p53 and mTOR pathways in cells. Proc. Natl. Acad. Sci. USA 2005, 102, 8204–8209. [Google Scholar] [CrossRef] [PubMed] [Green Version]
- Kim, J.; Kundu, M.; Viollet, B.; Guan, K.-L. AMPK and mTOR regulate autophagy through direct phosphorylation of Ulk1. Nat. Cell Biol. 2011, 13, 132–141. [Google Scholar] [CrossRef] [PubMed] [Green Version]
- Rosenfeldt, M.T.; O’Prey, J.; Morton, J.; Nixon, C.; MacKay, G.; Mrowinska, A.; Au, A.; Rai, T.S.; Zheng, L.; Ridgway, R.; et al. p53 status determines the role of autophagy in pancreatic tumour development. Nat. Cell Biol. 2013, 504, 296–300. [Google Scholar] [CrossRef] [PubMed]
- Fitzwalter, B.E.; Thorburn, A. FOXO3 links autophagy to apoptosis. Autophagy 2018, 14, 1467–1468. [Google Scholar] [CrossRef] [PubMed]
- Pelicano, H.; Carney, D.; Huang, P. ROS stress in cancer cells and therapeutic implications. Drug Resist. Updates Rev. Comment. Antimicrob. Anticancer Chemother. 2004, 7, 97–110. [Google Scholar] [CrossRef]
- Jeong, C.-H.; Joo, S.H. Downregulation of Reactive Oxygen Species in Apoptosis. J. Cancer Prev. 2016, 21, 13–20. [Google Scholar] [CrossRef] [Green Version]
- Zhang, L.; Li, J.; Zong, L.; Chen, X.; Chen, K.; Jiang, Z.; Nan, L.; Li, X.; Li, W.; Shan, T.; et al. Reactive Oxygen Species and Targeted Therapy for Pancreatic Cancer. Oxidative Med. Cell. Longev. 2016, 2016, 1–9. [Google Scholar] [CrossRef] [Green Version]
- Kozlov, S.V.; Waardenberg, A.J.; Engholm-Keller, K.; Arthur, J.W.; Graham, M.; Lavin, M. Reactive Oxygen Species (ROS)-Activated ATM-Dependent Phosphorylation of Cytoplasmic Substrates Identified by Large-Scale Phosphoproteomics Screen. Mol. Cell. Proteom. 2016, 15, 1032–1047. [Google Scholar] [CrossRef] [Green Version]
- Dbouk, H.A.; Weil, L.M.; Perera, G.K.S.; Dellinger, M.; Pearson, G.; Brekken, R.A.; Cobb, M.H. Actions of the protein kinase WNK1 on endothelial cells are differentially mediated by its substrate kinases OSR1 and SPAK. Proc. Natl. Acad. Sci. USA 2014, 111, 15999–16004. [Google Scholar] [CrossRef] [Green Version]
- Gong, X.; Smith, J.R.; Swanson, H.M.; Rubin, L.P. Carotenoid Lutein Selectively Inhibits Breast Cancer Cell Growth and Potentiates the Effect of Chemotherapeutic Agents through ROS-Mediated Mechanisms. Molecules 2018, 23, 905. [Google Scholar] [CrossRef] [PubMed] [Green Version]
- Vousden, K.H.; Prives, C. Blinded by the Light: The Growing Complexity of p53. Cell 2009, 137, 413–431. [Google Scholar] [CrossRef] [Green Version]
- Macip, S.; Igarashi, M.; Berggren, P.; Yu, J.; Lee, S.W.; Aaronson, S.A. Influence of Induced Reactive Oxygen Species in p53-Mediated Cell Fate Decisions. Mol. Cell. Biol. 2003, 23, 8576–8585. [Google Scholar] [CrossRef] [PubMed] [Green Version]
- Cusick, J.K.; Xu, L.-G.; Bin, L.-H.; Han, K.-J.; Shu, H.-B. Identification of RELT homologues that associate with RELT and are phosphorylated by OSR1. Biochem. Biophys. Res. Commun. 2006, 340, 535–543. [Google Scholar] [CrossRef] [PubMed]
- Chi, Y.; Shi, C.; Zhao, Y.; Guo, C. Forkhead box O (FOXO) 3 modulates hypoxia-induced autophagy through AMPK signalling pathway in cardiomyocytes. Biosci. Rep. 2016, 36, e00345. [Google Scholar] [CrossRef] [Green Version]
- Ogbureke, K.; Fisher, L. Expression of SIBLINGs and Their Partner MMPs in Salivary Glands. J. Dent. Res. 2004, 83, 664–670. [Google Scholar] [CrossRef]
- Ogbureke, K.U.; Fisher, L.W. Renal expression of SIBLING proteins and their partner matrix metalloproteinases (MMPs). Kidney Int. 2005, 68, 155–166. [Google Scholar] [CrossRef] [Green Version]
- Upile, T.; Fisher, C.; Jerjes, W.; El Maaytah, M.; Searle, A.; Archer, D.; Michaels, L.; Rhys-Evans, P.; Hopper, C.; Howard, D.; et al. The uncertainty of the surgical margin in the treatment of head and neck cancer. Oral Oncol. 2007, 43, 321–326. [Google Scholar] [CrossRef]
- Bedi, G.C.; Westra, W.H.; Gabrielson, E.; Koch, W.; Sidransky, D. Multiple head and neck tumours: Evidence for a common clonal origin. Cancer Res. 1996, 56, 2484–2487. [Google Scholar]
- Eckert, M.A.; Yang, J. Targeting invadopodia to block breast cancer metastasis. Oncotarget 2011, 2, 562–568. [Google Scholar] [CrossRef] [Green Version]
- Wu, B.; Crampton, S.P.; Hughes, C.C. Wnt signaling inducesmatrix metalloproteinase expression and regulates T cell transmigration. Immunity 2007, 26, 227–239. [Google Scholar] [CrossRef] [PubMed] [Green Version]
- Crampton, S.P.; Wu, B.; Park, E.J.; Kim, J.-H.; Solomon, C.; Waterman, M.L.; Hughes, C.C.W. Integration of the β-catenin-dependent Wnt pathway with integrin signaling through the adaptor molecule Grb2. PLoS ONE 2009, 4, e7841. [Google Scholar] [CrossRef] [PubMed] [Green Version]
- Zhang, M.; Li, S.; Jiao, J.; Lu, Z. An essential role for N-cadherin and β-catenin for progression in tongue squamous cell carcinoma and their effect on invasion and metastasis of Tca8113 tongue cancer cells. Oncol. Rep. 2009, 21, 1223–1233. [Google Scholar] [CrossRef] [Green Version]
- Vallée, A.; LeCarpentier, Y. Crosstalk Between Peroxisome Proliferator-Activated Receptor Gamma and the Canonical WNT/β-Catenin Pathway in Chronic Inflammation and Oxidative Stress During Carcinogenesis. Front. Immunol. 2018, 9, 745. [Google Scholar] [CrossRef] [PubMed] [Green Version]
- Zhang, J.; Shemezis, J.R.; McQuinn, E.R.; Wang, J.; Sverdlov, M.; Chenn, A. AKT activation by N-cadherin regulates beta-catenin signaling and neuronal differentiation during cortical development. Neural Dev. 2013, 8, 7. [Google Scholar] [CrossRef] [PubMed] [Green Version]


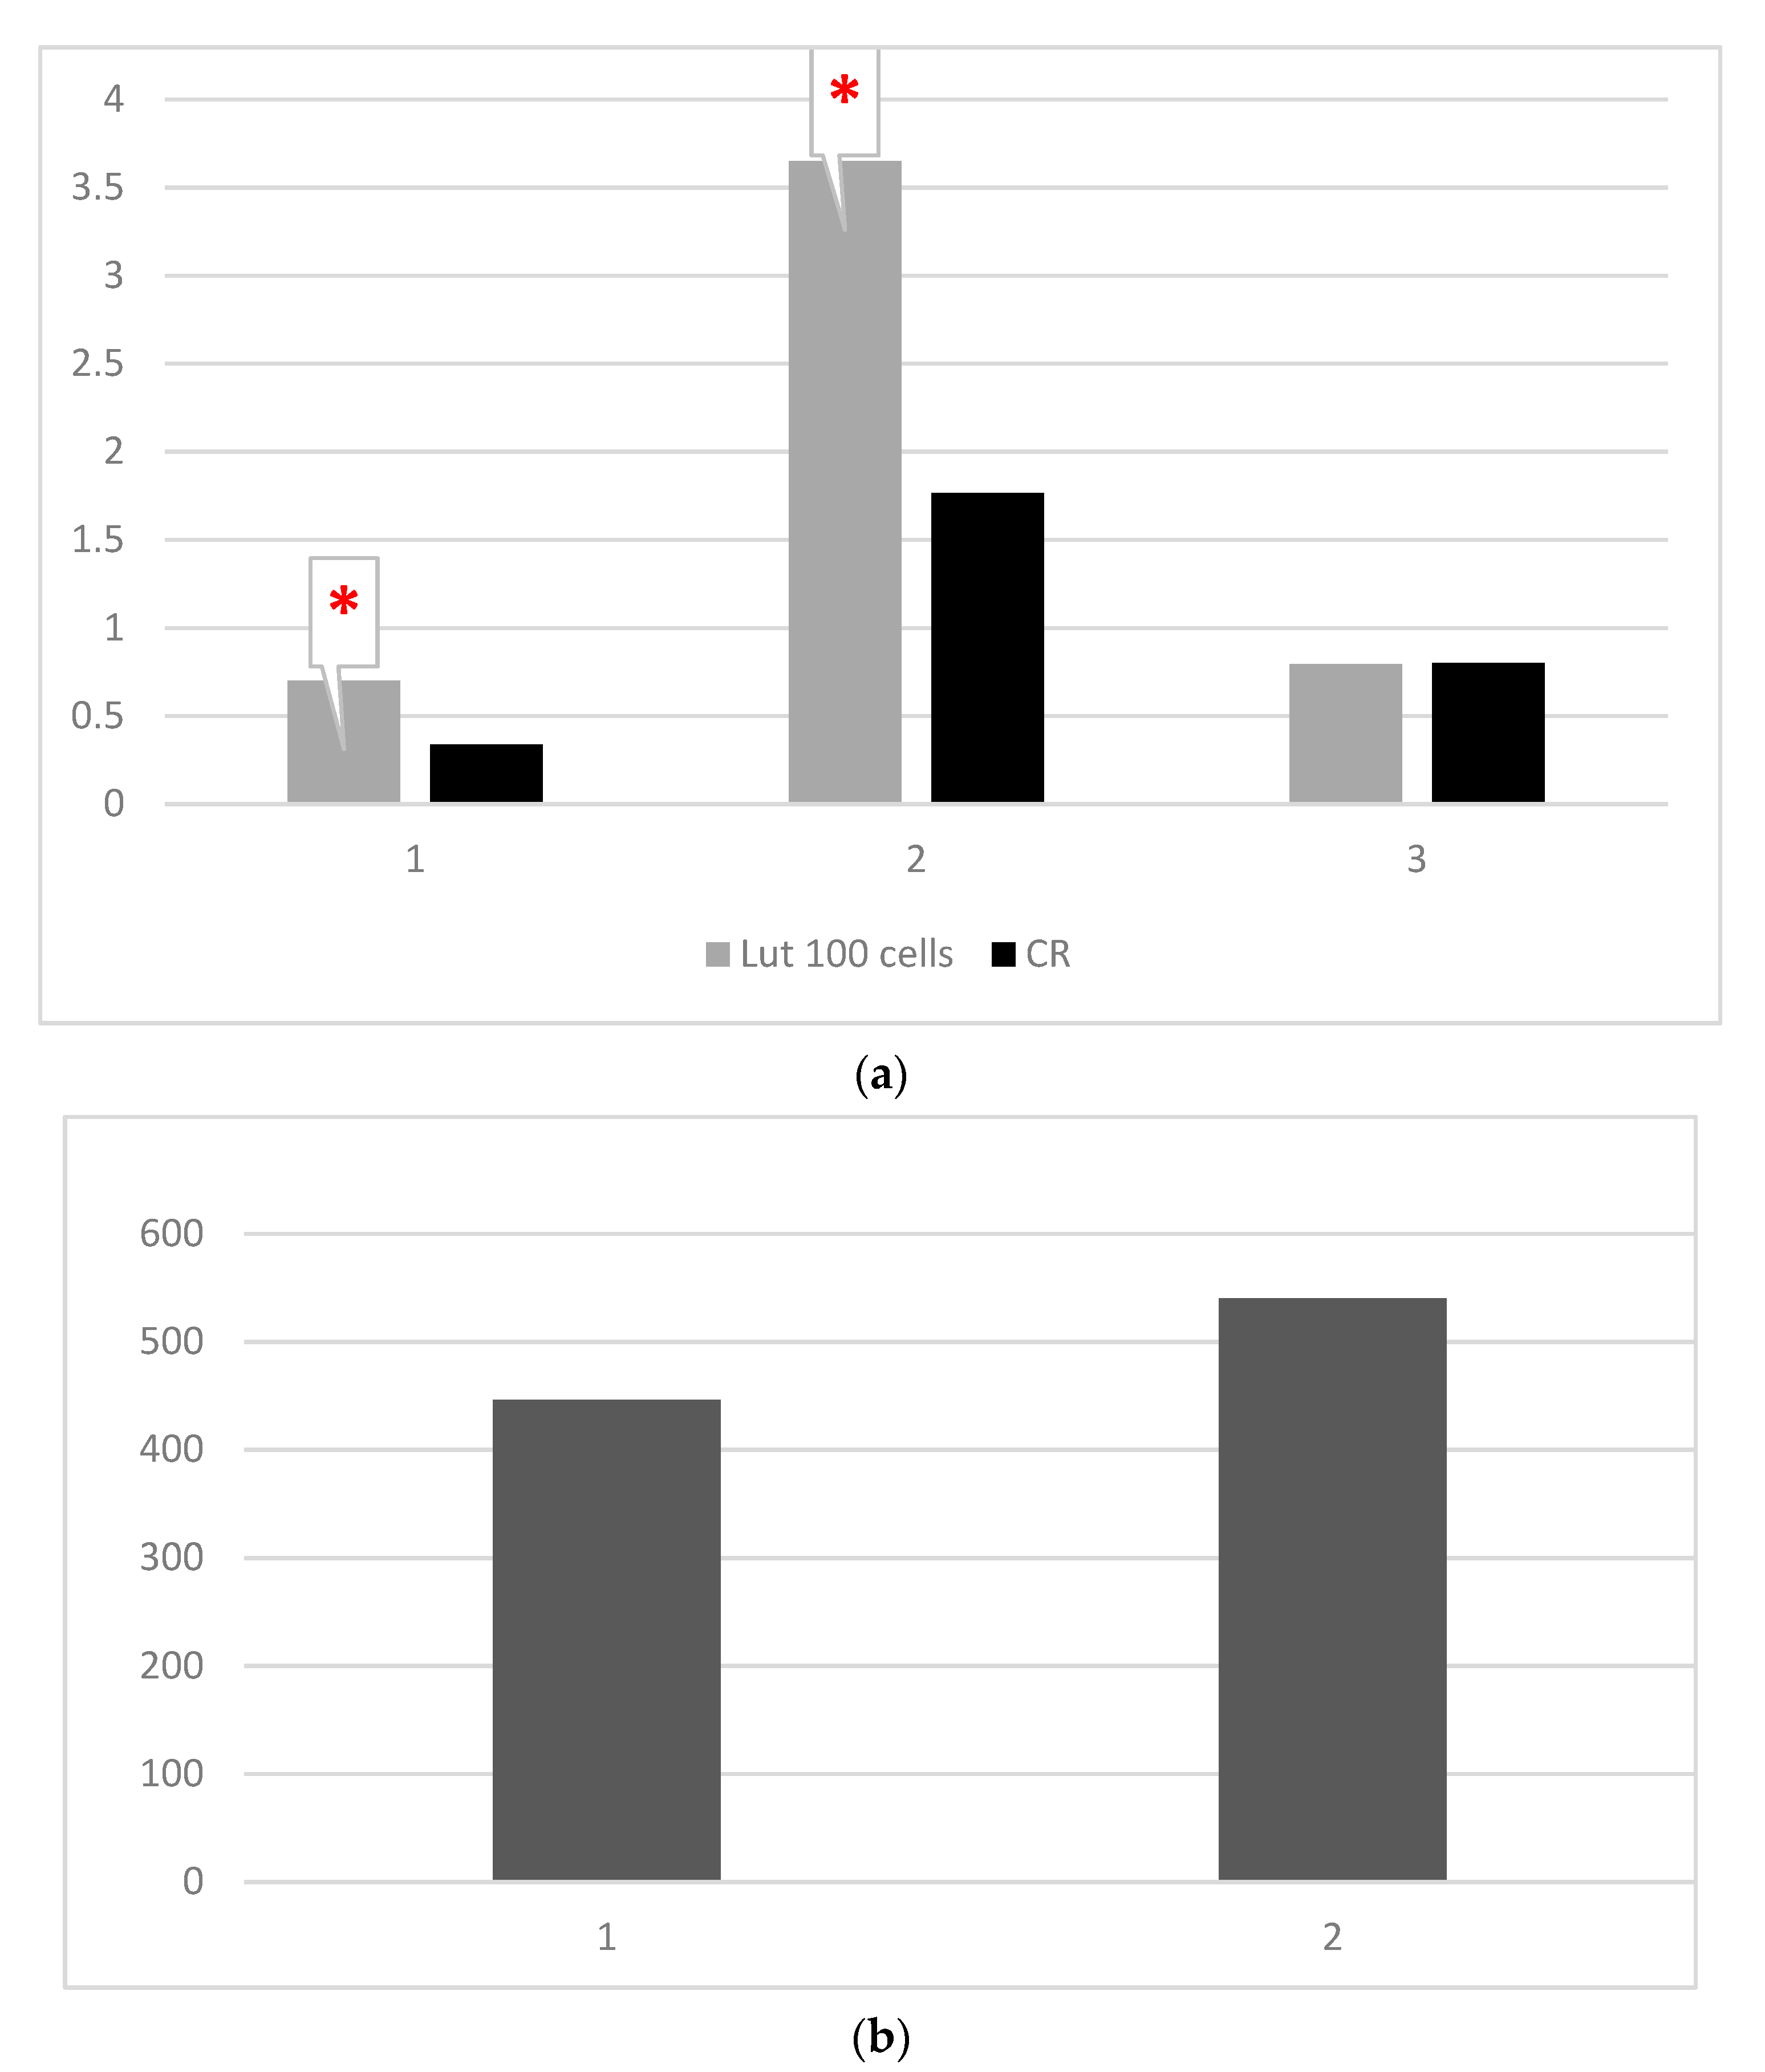
| Parameter | LUT 100 Cells | Control Cells | p |
|---|---|---|---|
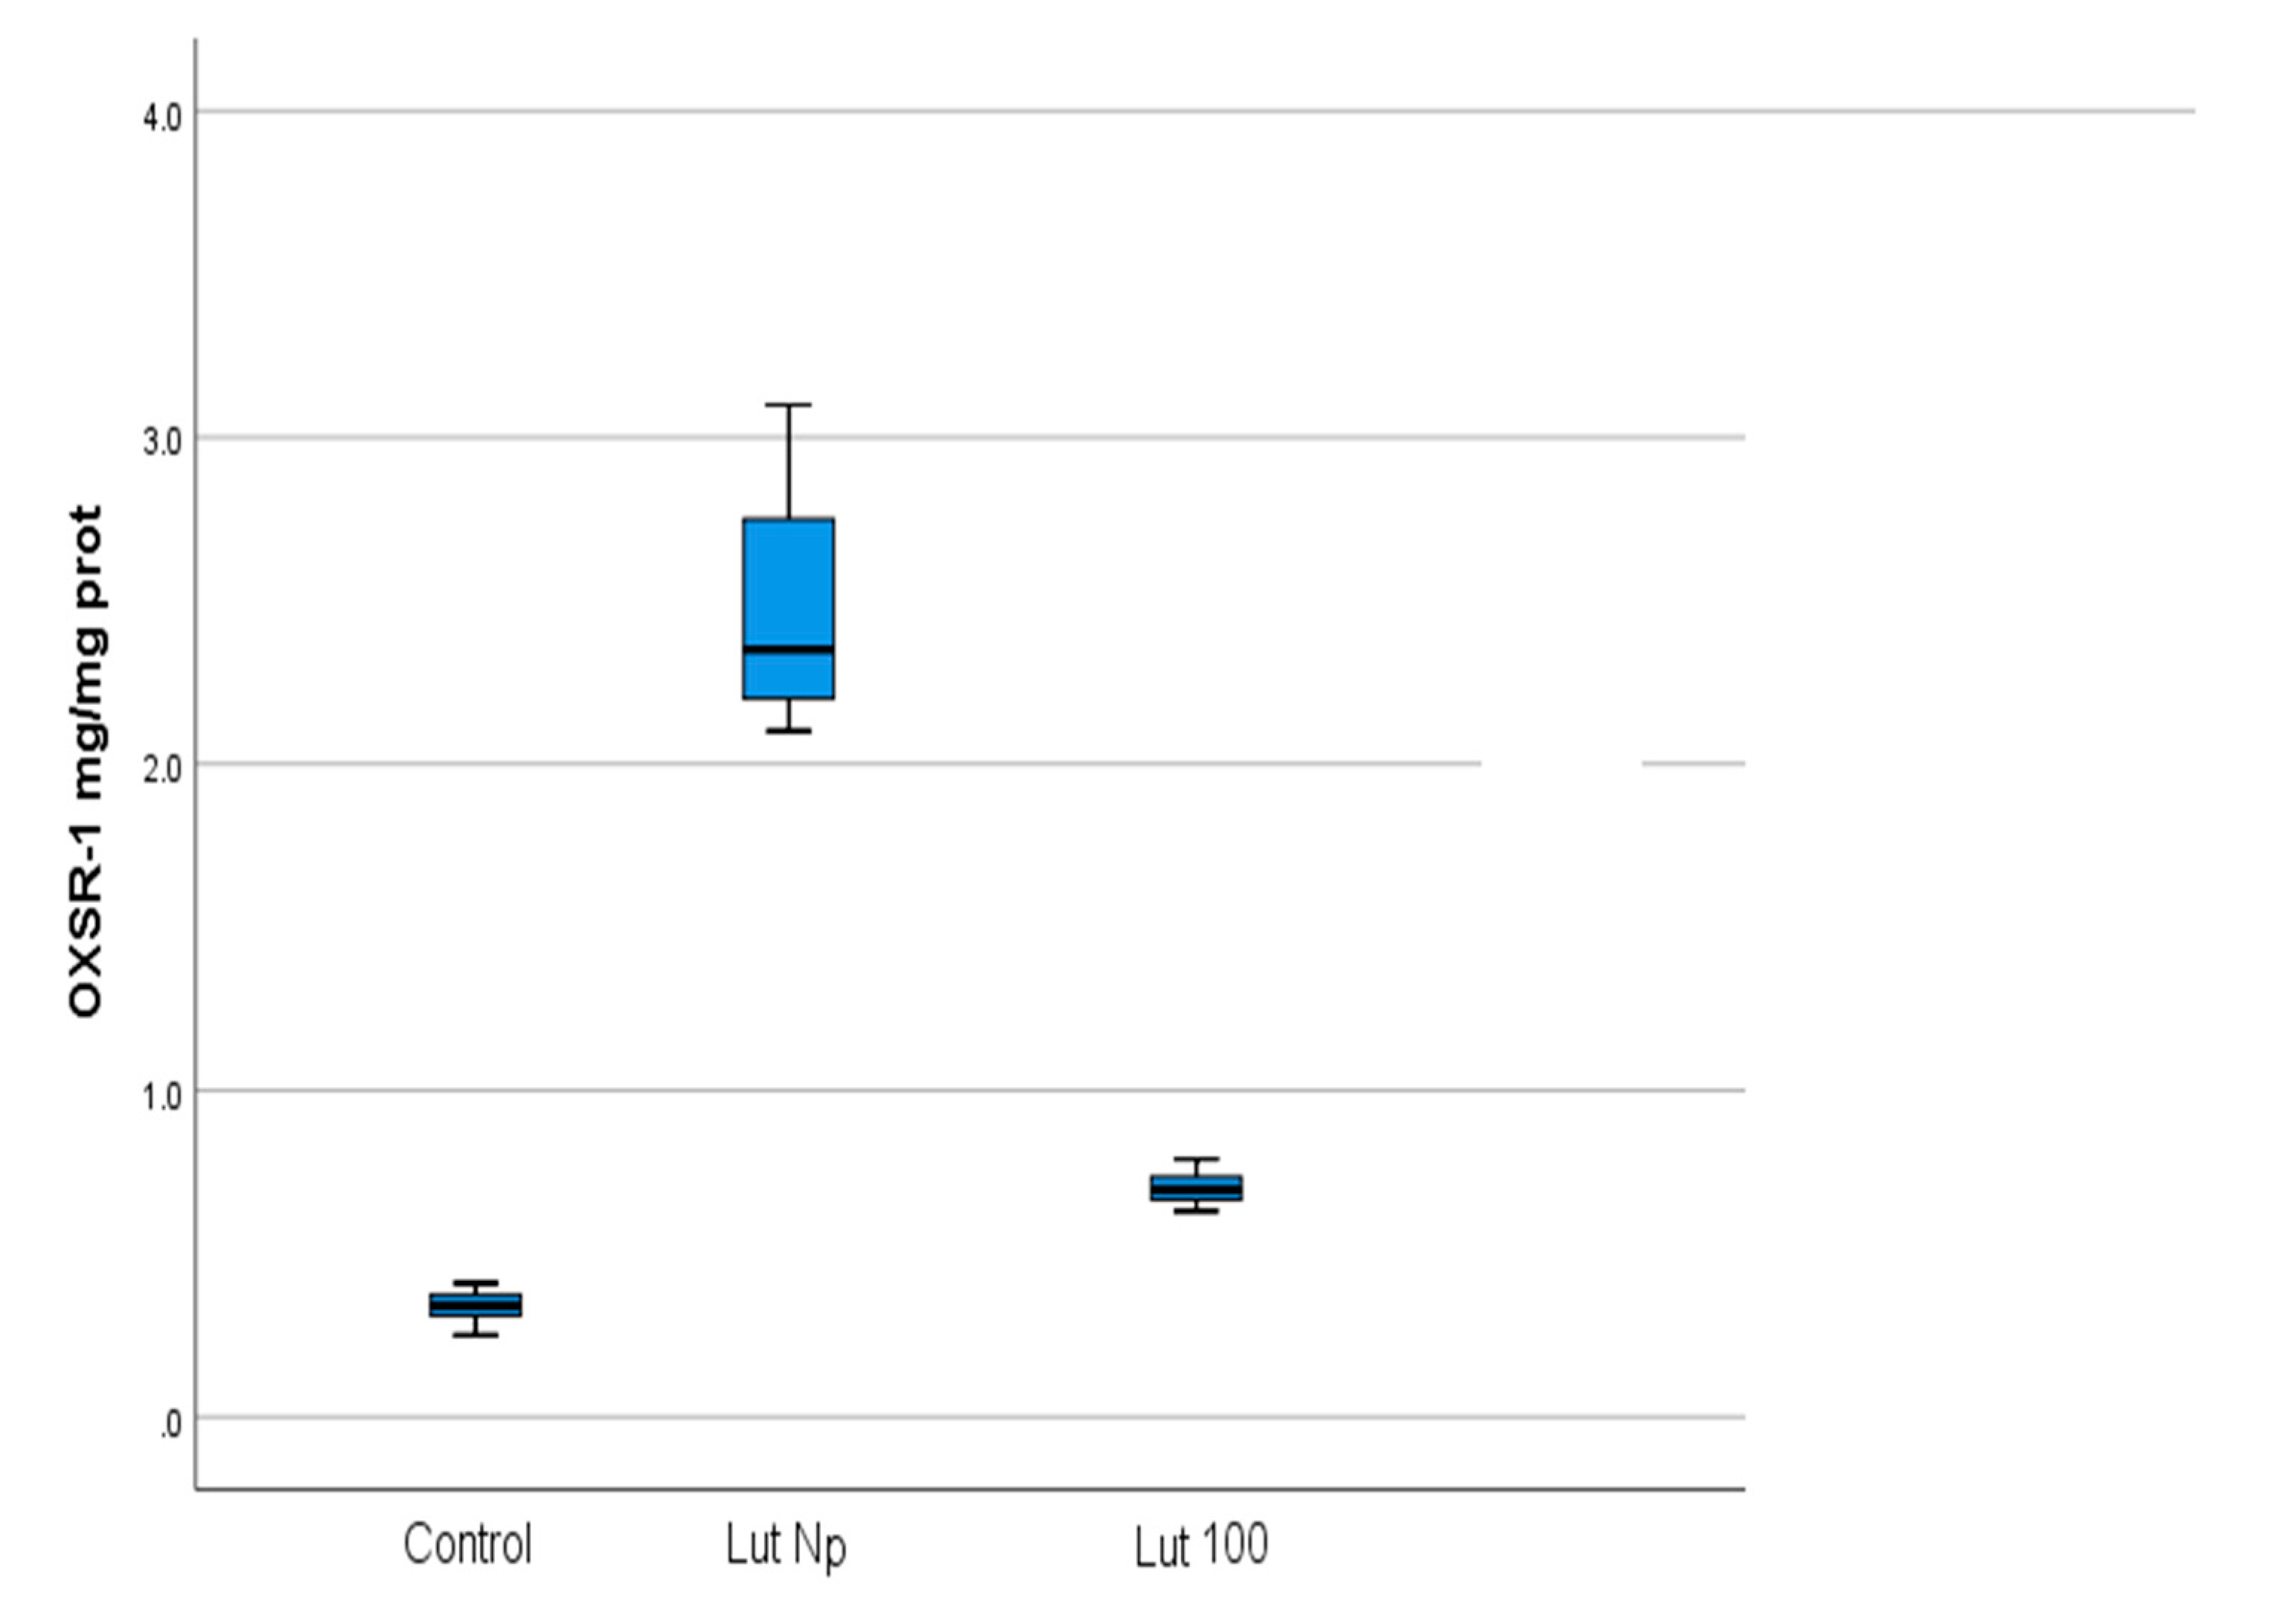
| OXSR1 (mg/mg protein) | 0.701 ± 0.05 | 0.339 ± 0.05 | <0.001 |
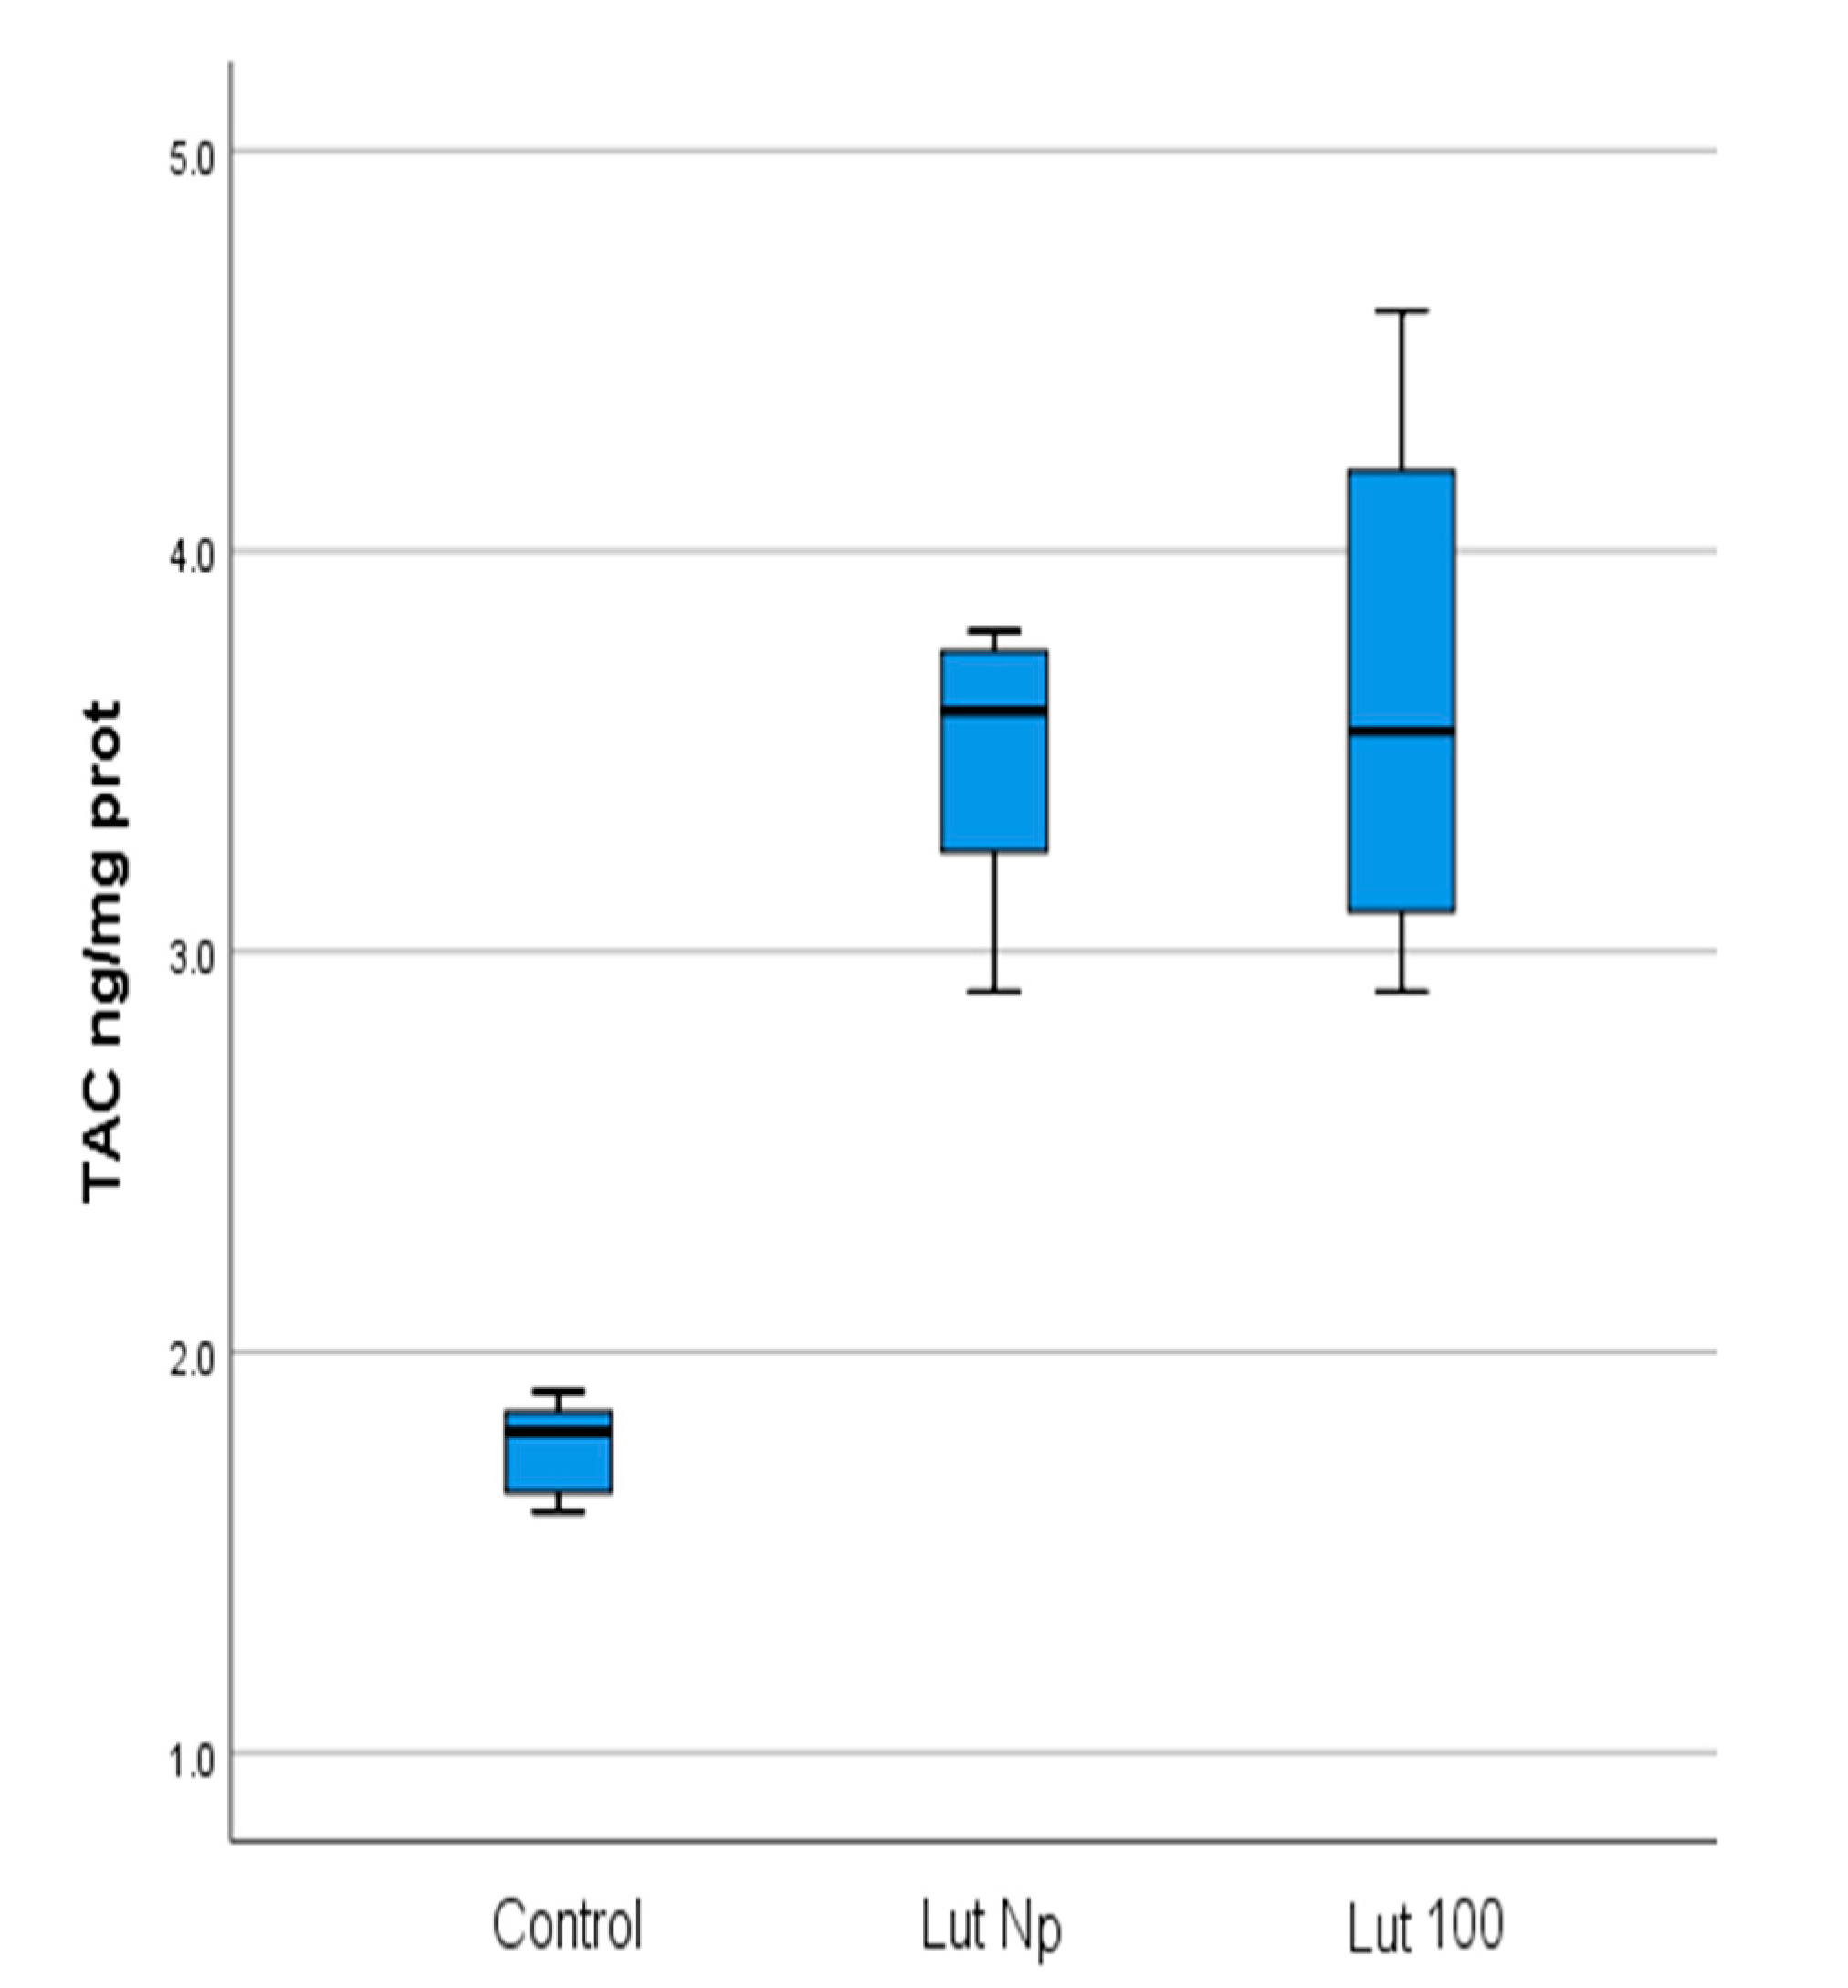
| TAC (ng/mg protein) | 3.65 ± 0.634 | 1.763 ± 0.118 | <0.001 |
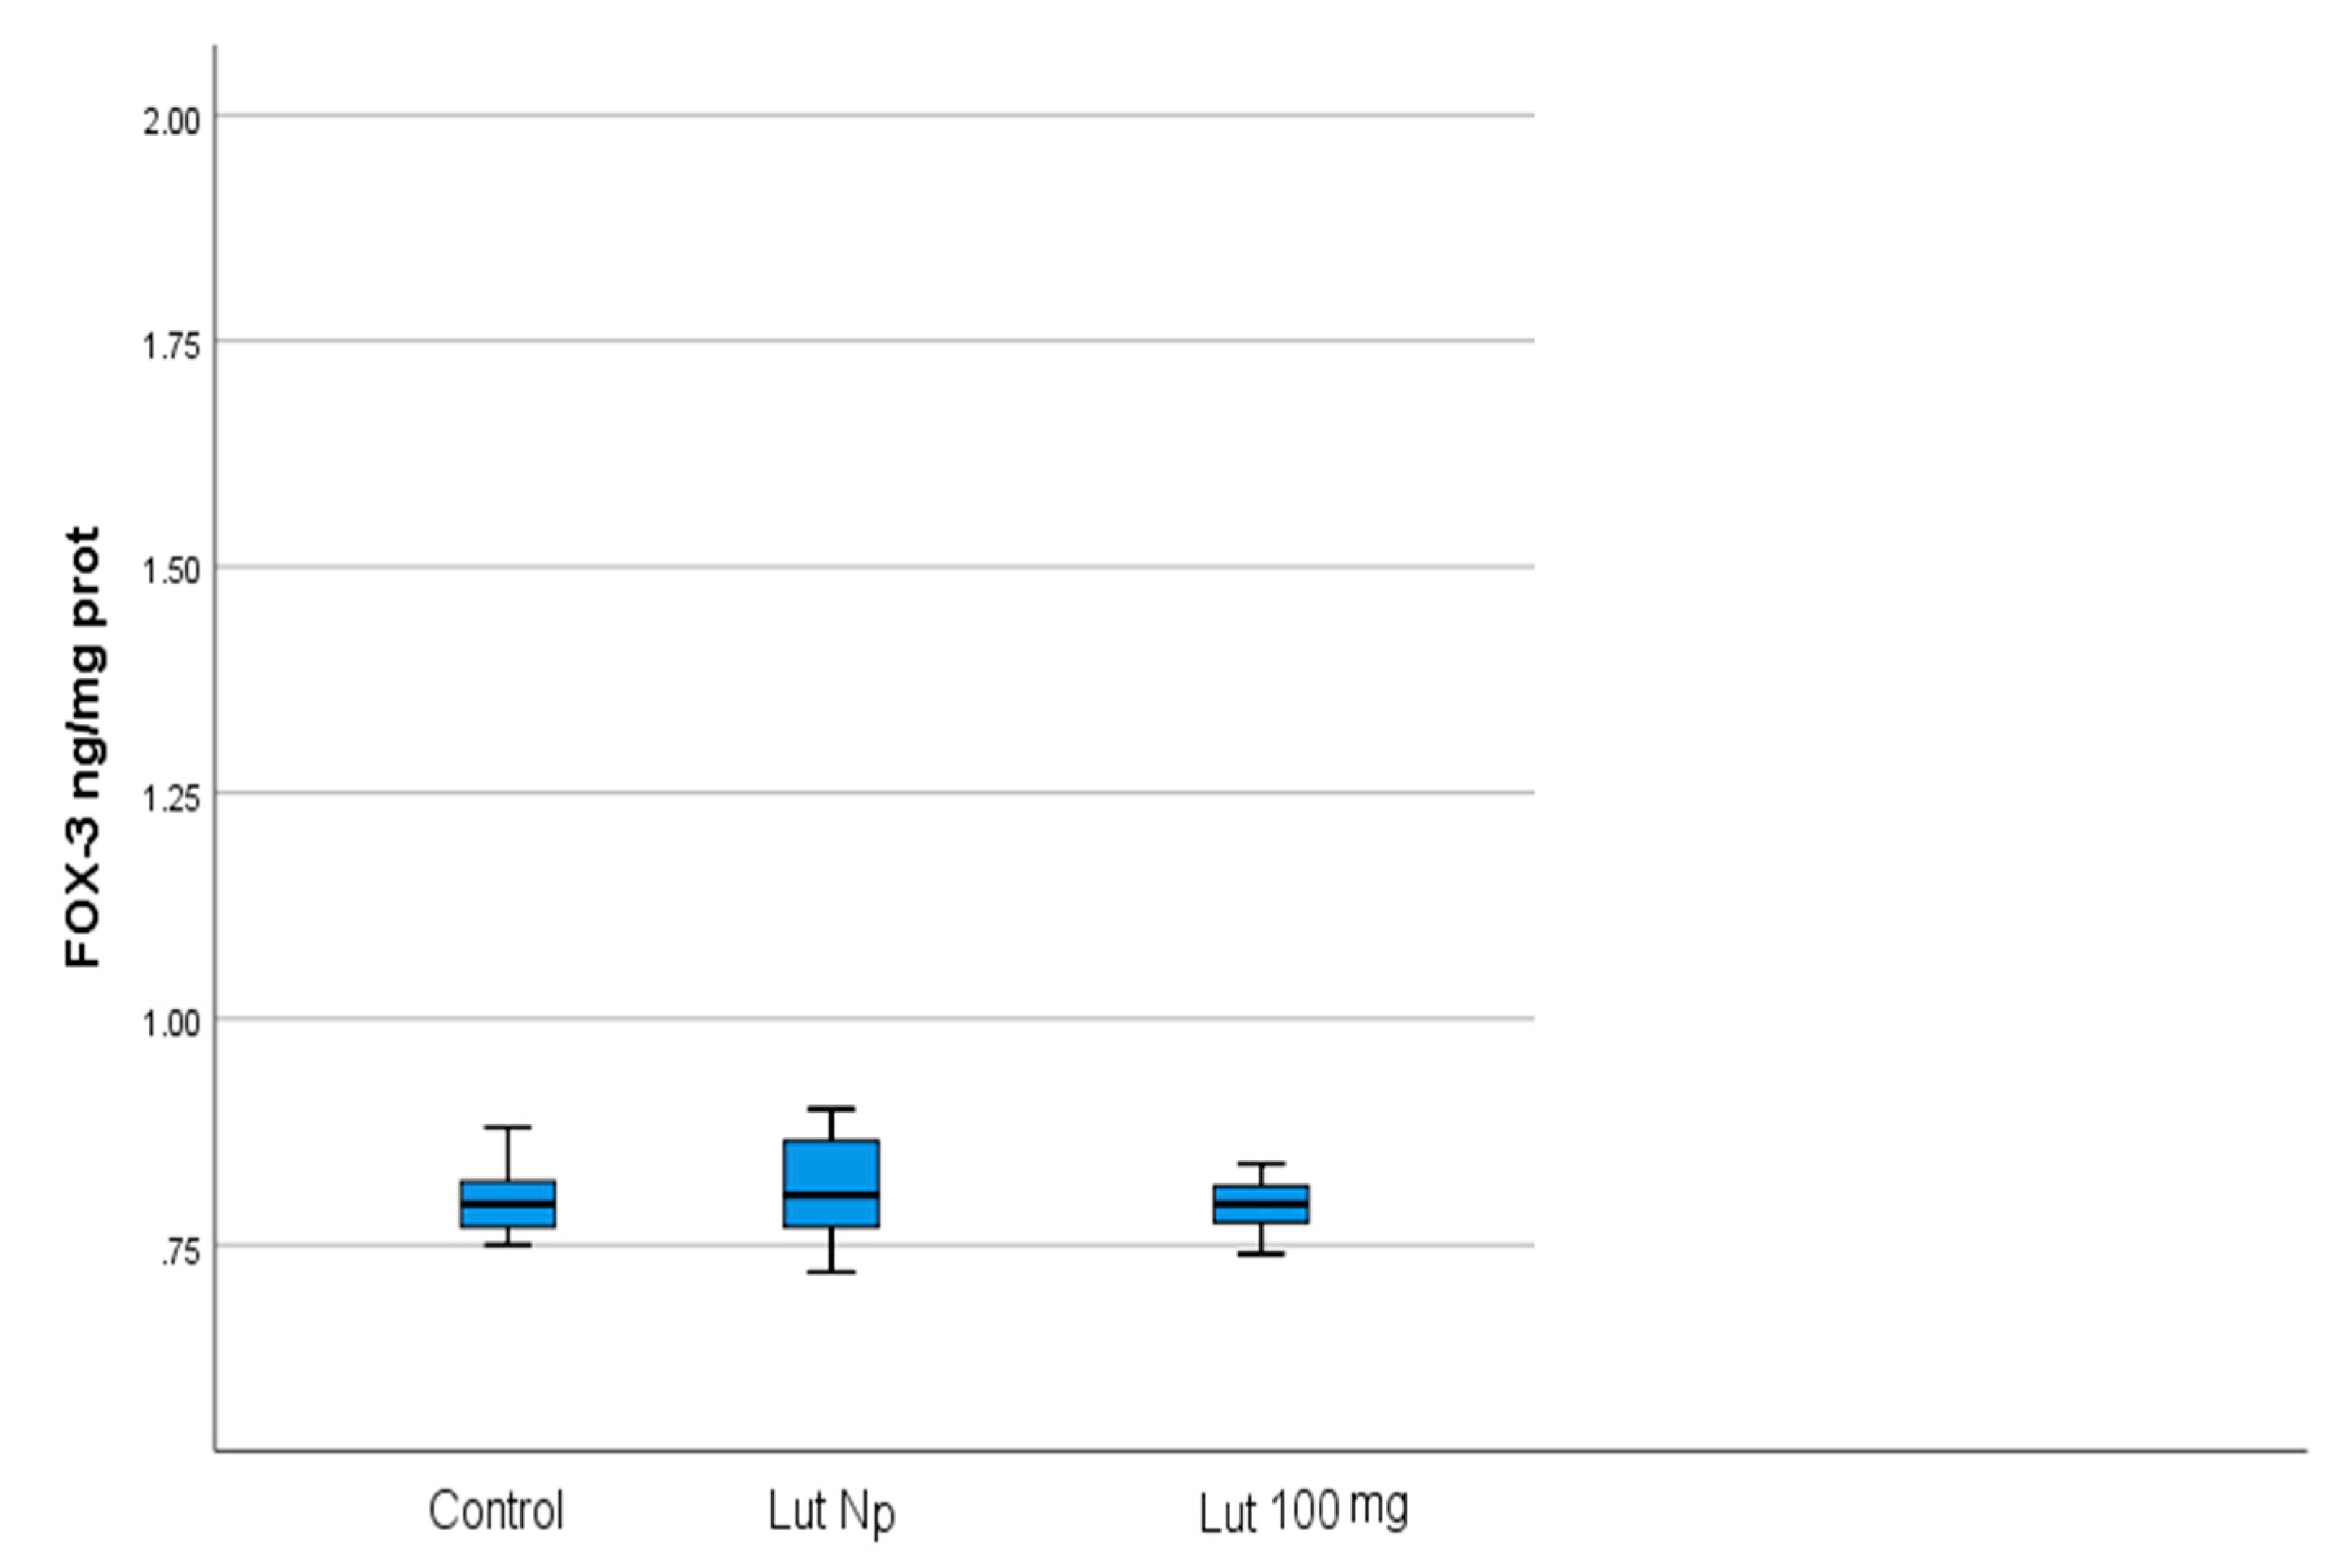
| FOXO-3 (ng/mg protein) | 0.794 ± 0.031 | 0.8 ± 0.042 | 0.99 |
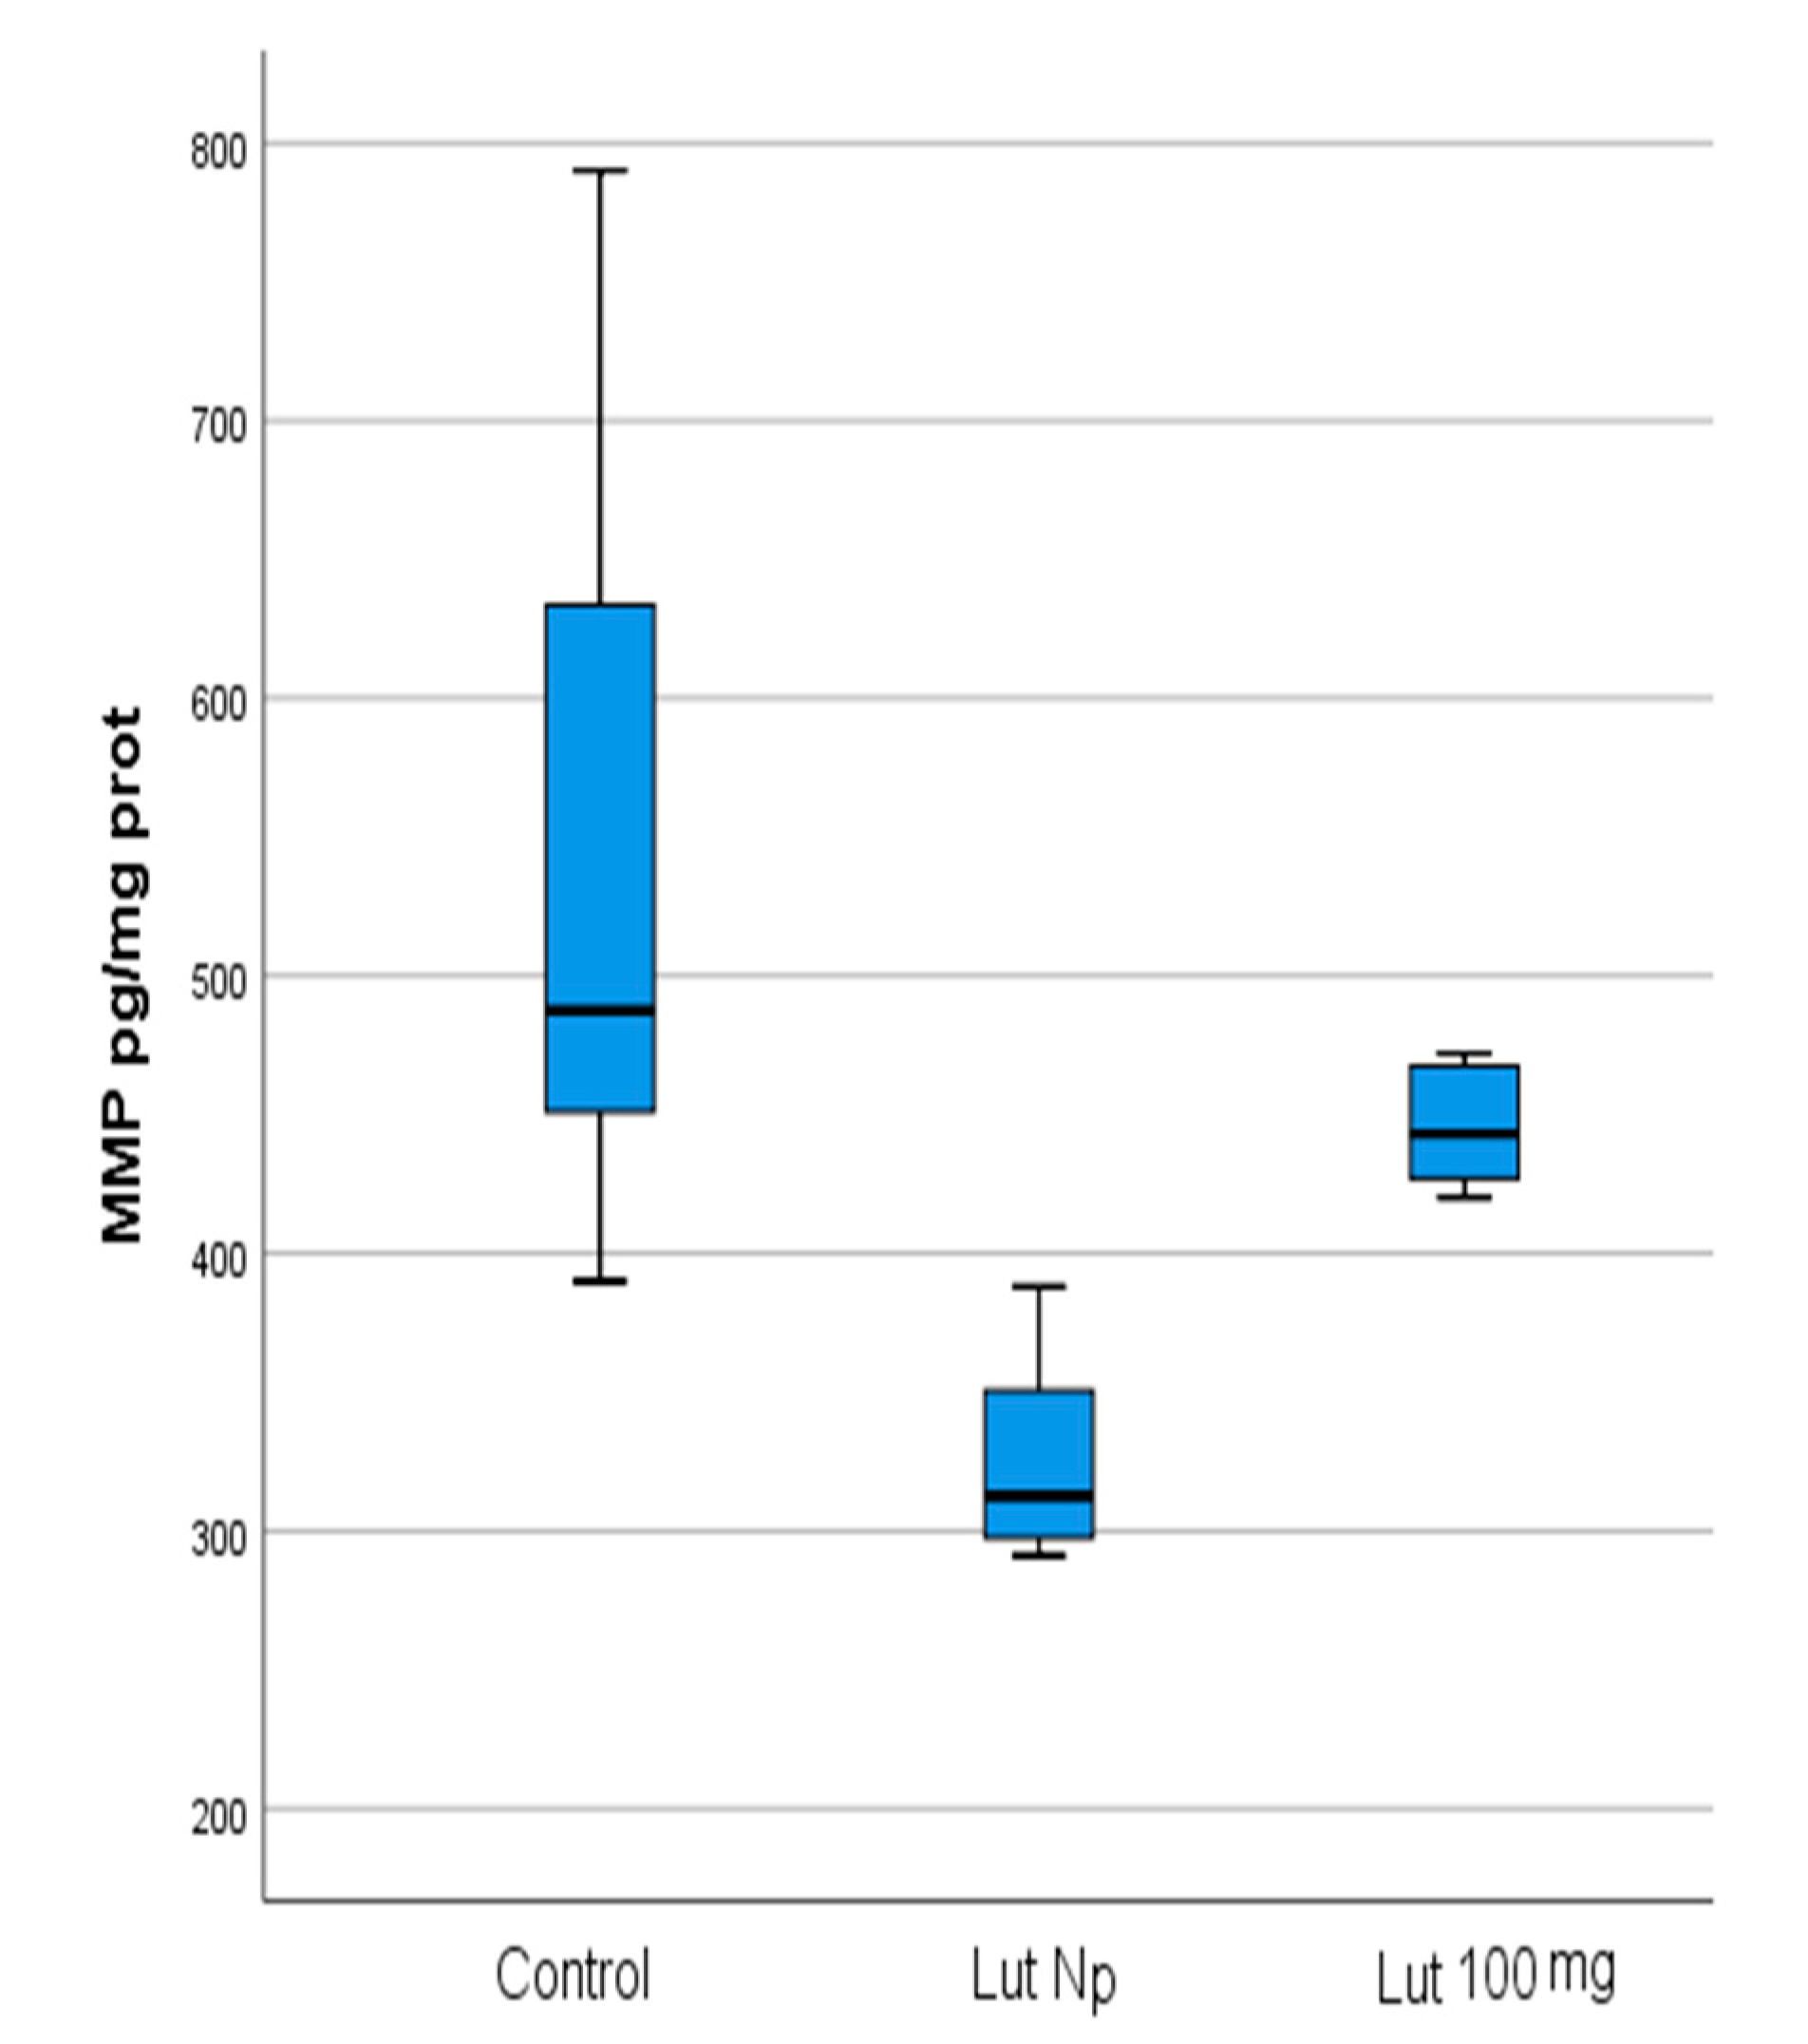
| MMP-9 (pg/mg protein) | 445.88 ± 21.79 | 540.5 ± 152.3 | 1.0 |
| Parameter | Lut Nps Cells | Control Cells | p |
|---|---|---|---|
| OXSR1 (mg/mg protein) | 2.47 ± 0.353 | 0.339 ± 0.05 | <0.001 |
| TAC (ng/mg protein) | 3.488 ± 0.335 | 1.763 ± 0.118 | <0.001 |
| FOXO-3 (ng/mg protein) | 0.813 ± 0.062 | 0.8 ± 0.042 | 0.98 |
| MMP-9 (pg/mg protein) | 325 ± 37.04 | 540.5 ± 152.3 | <0.004 |
| Batch * | CR | LUT 100 | LUT NPS |
|---|---|---|---|
| CR | - | <0.001 | <0.001 |
| LUT 100 | <0.001 | - | <0.001 |
| LUT NPS | <0.001 | <0.001 | - |
| Batch * | CR | LUT 100 | LUT NPS |
|---|---|---|---|
| CR | - | <0.001 | <0.001 |
| LUT 100 | <0.001 | - | 0.965 |
| LUT NPS | <0.001 | 0.965 | - |
| Grup * | CR | LUT 100 | LUT NPS |
|---|---|---|---|
| CR | - | 0.997 | 0.989 |
| LUT 100 | 0.997 | - | 0.936 |
| LUT NPS | 0.989 | 0.936 | - |
| Batch * | CR | LUT 100 | LUT NPS |
|---|---|---|---|
| CR | - | <0.001 | <0.001 |
| LUT 100 | 1.000 | - | 0.004 |
| LUT NPS | <0.001 | 0.004 | - |
Publisher’s Note: MDPI stays neutral with regard to jurisdictional claims in published maps and institutional affiliations. |
© 2021 by the authors. Licensee MDPI, Basel, Switzerland. This article is an open access article distributed under the terms and conditions of the Creative Commons Attribution (CC BY) license (https://creativecommons.org/licenses/by/4.0/).
Share and Cite
Enășescu, D.A.; Moisescu, M.G.; Imre, M.; Greabu, M.; Ripszky Totan, A.; Stanescu-Spinu, I.; Burcea, M.; Albu, C.; Miricescu, D. Lutein Treatment Effects on the Redox Status and Metalloproteinase-9 (MMP-9) in Oral Cancer Squamous Cells—Are There Therapeutical Hopes? Materials 2021, 14, 2968. https://doi.org/10.3390/ma14112968
Enășescu DA, Moisescu MG, Imre M, Greabu M, Ripszky Totan A, Stanescu-Spinu I, Burcea M, Albu C, Miricescu D. Lutein Treatment Effects on the Redox Status and Metalloproteinase-9 (MMP-9) in Oral Cancer Squamous Cells—Are There Therapeutical Hopes? Materials. 2021; 14(11):2968. https://doi.org/10.3390/ma14112968
Chicago/Turabian StyleEnășescu, Dan Alexandru, Mihaela Georgeta Moisescu, Marina Imre, Maria Greabu, Alexandra Ripszky Totan, Iulia Stanescu-Spinu, Marian Burcea, Crenguta Albu, and Daniela Miricescu. 2021. "Lutein Treatment Effects on the Redox Status and Metalloproteinase-9 (MMP-9) in Oral Cancer Squamous Cells—Are There Therapeutical Hopes?" Materials 14, no. 11: 2968. https://doi.org/10.3390/ma14112968