
Electron-Phonon Coupling Parameter of Ferromagnetic Metal Fe and Co


1
Department of Energy Science, Sungkyunkwan University, Suwon 16419, Korea
2
Center for Integrated Nanostructure Physics, Institute for Basic Science (IBS), Suwon 16419, Korea
*
Author to whom correspondence should be addressed.
Materials 2021, 14(11), 2755; https://doi.org/10.3390/ma14112755
Submission received: 30 April 2021
/
Revised: 19 May 2021
/
Accepted: 21 May 2021
/
Published: 23 May 2021
(This article belongs to the Special Issue Magnetic and Structural Properties of Ferromagnetic Thin Films)
Abstract
:The electron-phonon coupling (g) parameter plays a critical role in the ultrafast transport of heat, charge, and spin in metallic materials. However, the exact determination of the g parameter is challenging because of the complicated process during the non-equilibrium state. In this study, we investigate the g parameters of ferromagnetic 3d transition metal (FM) layers, Fe and Co, using time-domain thermoreflectance. We measure a transient increase in temperature of Au in an FM/Au bilayer; the Au layer efficiently detects the strong heat flow during the non-equilibrium between electrons and phonons in FM. The g parameter of the FM is determined by analyzing the temperature dynamics using thermal circuit modeling. The determined g values are 8.8–9.4 × 10¹⁷ W m−3 K−1 for Fe and 9.6–12.2 × 10¹⁷ W m−3 K−1 for Co. Our results demonstrate that all 3d transition FMs have a similar g value, in the order of 1018 W m−3 K−1.
1. Introduction
The ultrafast photoexcitation, triggered by femtosecond laser pulse, of metallic surfaces has enabled the investigation of the thermal relaxation process between excited electrons and phonons in metals. In particular, thermoreflectance, which refers to the change in reflectivity with temperature, has been used to collect the time-resolved temperature response on metal surfaces [1]. A key parameter for the ultrafast thermal relaxation in metals is the electron–phonon coupling (g), which has been reported for several materials [2,3,4,5,6,7,8]. This parameter has been studied for ferromagnetic 3d transition metals (FMs) to understand the ultrafast dynamics of magnetization. The most heavily studied FM is Ni, and the g parameter of Ni has been reported to be 8 and 10.5 × 10¹⁷ W m−3 K−1, determined from the transient temperature excursion in a single Ni layer [9,10]. However, the exact determination of the g parameter from the temperature responses of the FM is often challenging because of multiple couplings among electrons, phonons, and magnons. In a prior work, we demonstrated that the g parameter can be accurately determined by measuring the transient heat current from Ni to Au in a Ni/Au bilayer, and determined the g parameter of Ni to be 8.6 × 10¹⁷ W m−3 K−1 [11]. In this study, we investigate the g parameters of two FM materials, Fe and Co, by measuring the transient heat flow in an FM/Au bilayer. As far as we know, there is no experimental report of the g parameter of Fe, and theoretical estimation shows a large deviation for g of 7–55 × 1017 W m−3 K−1 [8,12,13,14]. Previously, the g parameter of Co was reported to be 20 × 1017 W m−3 K−1, but this value is obtained with a complicated structure and multiple fitting parameters [15]. Theoretical estimation of the g parameter of Co is 7 and 33 × 1017 W m−3 K−1 [13,14].
To investigate the g parameters of the target materials, we employ an indirect optical heating configuration: pump and probe beams hit the opposite surface of the sample. When the pump beam hits the bottom surface of the metallic bilayer, a transient heat flow occurs and leads to temperature dynamics on the top surface, which can be measured by the probe beam [11,16,17]. Indirect heating has several advantages over direct optical heating (pump and probe beams on the same surface). It has less contribution from non-thermalized electrons to the signal. In addition, as the pump and probe are spatially separated, they are free from several optical artifacts that occur when the pump and probe beams are spatially overlapped. In this study, we adopted both direct and indirect optical heating configurations to determine the g parameters of the target FM materials. In both configurations, we measure the Au temperature instead of the FM temperature; the probe beam is fixed on the Au surface, while the pump beam is either on the FM or Au surface. Au is known to have a small value of g, and hence the g of Au has only a minor effect on the transient heat flow at timescales of a few tens of picoseconds. Thus, the transient temperature excursion of the Au layer is sensitive to the g parameter of FM. In addition, the interpretation of the temperature of Au is simpler than that of FM, because Au does not have magnons.
To analyze the time-variant temperature excursion, we constructed a thermal circuit model based on a two-temperature model (TTM) in one-dimensional heat flow [11,17]. This circuit model is more convenient than a continuum analytical model in describing the initial distribution of thermal energy, the depth profile of temperature response, and temperature dependence of the thermodynamics parameters. By fitting the experimental results with the thermal circuit modeling, we determined the g parameters of 8.8–9.4 × 10¹⁷ for Fe and 9.6–12.2 × 10¹⁷ for Co, with a unit of W m−3 K−1. The g values have relative errors of 7% and 24%, respectively, for Fe and Co, depending on the heating configurations (direct and indirect). The reason for this discrepancy could be the uncertainties in the thermal modeling and experiment.
2. Materials and Methods
We prepared two types of the bilayer samples: sapphire substrate (sap)/FM 20 nm/Au 100 nm, where the FM is Fe or Co. The samples were fabricated with a magnetron sputtering system, with a process pressure of 3 mTorr and base pressure of less than 10−7 Torr. X-ray reflectometry was used to measure the thickness of each metallic film. All layers were deposited at room temperature.
To observe the dynamics of the temperature of the samples, we employed an optical pump-probe technique called time-domain thermoreflectance (TDTR). Pulsed pump and probe beams were generated by a Ti-sapphire laser oscillator with a repetition rate of 80 MHz. Both beams had a wavelength of 785 nm of a wavelength and pulse width, full width a half maximum (FWHM), of 0.1 ps; however, the pulse width of the pump beam was extended to 1 ps through an electro-optic modulator that modulated the pump beam at a frequency of 9.5 MHz. In addition, the probe beam was modulated at 200 Hz via an optical chopper. We collected the TDTR signal that had two frequency components of 9.5 MHz and 200 Hz to suppress the noise level and reject signals caused by pump leaking to the detector.
TDTR collects reflection changes (∆R) of the probe beam from the sample surface, depending on the time delays between the incidence of the pump beam and the probe beam on the sample. ∆R is typically expressed as a linear combination of changes in both the electron and phonon temperatures (∆Te and ∆Tph) [4]. In this work, we collected TDTR data from only the surface of the Au layer; ∆Tph of the Au layer has a dominant contribution to ∆R, while the role of ∆Te is minor [17]. The ∆Te effect on ∆R can be significant during a few ps after the pump irradiation, when ∆Te becomes much higher than ∆Tph. After a few ps, when the peak of ∆Te disappears, ∆R from the Au surface is dominated by ∆Tph [18,19,20]. We used the ratio of the in-phase signal (Vin) and out-of-phase signal (Vout) as the temperature response. The ratio Vin/Vout makes the TDTR signal more robust due to the following two issues: the defocus of the pump beam and changes in the spatial overlap between the pump and probe beams on the sample surface [21,22,23]. Both issues are caused by the change in the pump beam pathway length to adjust the time delay between the pump and probe beams. The motion of a delay stage causes a slight spatial defocus and misalignment in the pump spot on the sample. The ratio Vin/Vout suppresses the error associated with these issues because both Vin and Vout have the same dependencies on defocus and overlap.
3. Results
3.1. Overview
In this section, we introduce several thermal interaction steps in the bilayer samples according to the time scales. When the optical pump is projected onto the samples, the optical energy excites the electrons first, and the higher electronic energy is thermalized at 100 fs timescale, so that we can define ∆Te. Then, thermalization between the electron bath, with a small heat capacity of ce, and phonon bath, with a much larger heat capacity of cph, occurs in a few ps timescales. In particular, in this sample structure, the electron-phonon thermal relaxation is much faster in the FM layer than in the Au layer because of the large difference in the values of g for FM and Au. Finally, the phonon bath of Au is thermally equilibrated with the phonon bath of FM at around 100 ps timescale. These processes are shown in Figure 1a,b, where the thermal model predicts the temperature dynamics of the Fe/Au bilayer with initial pump energy on the Fe side and the Au side, respectively.
To determine the g parameter of FM, we focused on of the Au layer (∆Tph,Au), which is more sensitive than that of the FM layer (∆Tph,FM) to the change in the g parameter of FM. This is because the ultrafast heat transport from the FM electron bath to the Au layer at short timescales is critically dependent on the magnitude of the electron-phonon thermal interaction in the FM layer. Figure 1c shows that the magnitude of g of FM determines the amount of initial electronic heat flow from FM to Au. This mechanism allows us to reliably determine the g parameter of the FM using the FM/Au bilayer.
3.2. Thermal Circuit Model
For the thermal circuit model based on TTM, we used Equation (1) to reproduce the TDTR data analytically.
where the subscripts e and ph represent electron and phonon baths, respectively, Tj is the temperature of the bath j, Λj is the thermal conductivity of the bath j, and p is the initial electronic thermal energy absorbed from the optical pump pulse. The electron properties of ce and Λe are expressed as linear functions of Te, while the phonon properties of cph and Λph are constant values in the model.
The thermal circuit model consists of several discrete sub-circuits that have a specific length, such as the finite element method, as shown in Figure 2a,b. Each sub-circuit has two types of heat capacitance of electron and phonon baths (Ce and Cph), and they are connected through an electron-phonon thermal coupling resistance (Re-ph). In addition, the heat capacitors in neighboring sub-circuits in a single material that have the same types of carrier baths (electrons or phonons) are connected with a spatial thermal resistance (Re or Rph). At the interface between the different materials, the neighboring sub-circuits are connected by interfacial thermal resistances (Rj,FM-i). Rj,i-FM is given according to the type of carrier (j) and material (i). These circuit elements are described with intrinsic material properties, finite spatial heights (h), and areas (A), as follows:
where j is e or ph, and i is Au or sap for each FM-Au interface or FM-sap interface. We calculate Re,FM-Au with the Wiedemann-Franz law using the reported values of interfacial electrical resistance. The resistance for the Co-Au interface is assumed to be the same as the reported resistance for the Co-Cu interface, while that of the Fe-Au interface is chosen as the mean value of resistances for Co-Cu and Ni-Cu interfaces [24]. Rph,FM-i for the FM-Au interface is chosen as the same values as that for the Ni-Au interface [25], and that for the FM-sap interface is determined in this work at a time range after 200 ps, where the heat flow from the metal layers to the sapphire substrate dominates the TDTR response.
The heat transport in the FM/Au bilayer is driven by the energy sources (P) on the electron nodes of the metallic sub-circuits. This P represents the initial electronic thermal energy obtained from optically excited electronic energy with a finite spatial dimension (). For the optical pump on the FM side, we assume that P has a Gaussian form of 1 ps FWHM, which is the same as the pulse width of the pump beam. This assumption is reasonable, given that the time for thermalization of photoexcited electrons is approximately a few tens of femtoseconds in FM [26]. Thus, we calculated P using an optical transfer matrix method with the reported refractive index (n) values, assuming that electronic thermalization occurs instantaneously with the photoexcitation. On the other hand, Hohlfeld et al. reported that photoexcited electrons in Au move ballistically over 100 nm, and hence the electrons are thermalized spatially far from the photoexcited area [27]. The ballistic motion has been understood by the Fermi velocity of non-thermal electrons [28]. For the optical pump on the Au side, we followed this research and applied a phenomenological penetration depth of optically excited thermal electrons, i.e., 121.3 nm. The calculated P are described in Figure 3a,b. The fluence of the optical pump pulse energy was adjusted to be 0.65 J m−2 in all the experiments.
The reflected probe beam also has a penetration depth, and hence the TDTR data are composed of a linear combination of ∆Tph of the sub-circuits. To reproduce the penetration depth effect in the thermal model, proper weights of ∆Tph in all sub-circuits to the total TDTR signal are necessary. A transfer matrix method was used again, with reported information on the temperature-dependent refractive index (dn/dT) for Au [29]. The weight functions for ∆Tph along the depth from the Au surface is shown in Figure 3. The intrinsic thermal properties for the thermal circuit model are summarized in Table 1.
3.3. Fitting Results
To determine a reliable value of the g parameter, we perform fitting processes separately with two types of optical configurations: the optical pump on the FM side (indirect heating) and on the Au side (direct heating). The determined g parameter of Fe has 7% deviation, depending on the heating configuration: 8.8 × 10¹⁷ W m−3 K−1 for the indirect heating and 9.4 × 10¹⁷ W m−3 K−1 and for the direct heating. The g parameter of Co is determined with 24% deviation: 9.6 × 10¹⁷ W m−3 K−1 for the indirect heating and 12.2 × 10¹⁷ W m−3 K−1 for the direct heating. For both Fe and Co, the direct heating configuration results in a higher value of the g parameter compared to that with the indirect heating configuration. The deviation in g between indirect and direct heating is larger for Co than for Fe because of the smaller , the electronic thermal conductance at the FM/Au interface. When we increase from 14 to 20 × 109 W m−2 K−1, the deviation in g decreases from 24% to 7%: 10.3 × 10¹⁷ W m−3 K−1 for the indirect heating and 11 × 1017 W m−3 K−1 for the direct heating. Considering the uncertainties in the experiment and thermal modeling, we claim that the discrepancies of 7% and 24% for Fe and Co, respectively, are within the acceptable range. The sensitivities for the determination of g during the initial 20 or 40 ps are shown in Figure 4a,b,d,e, whereas the fitting results for the entire timescale of 1 ns are shown in Figure 4c,f. During the initial 4 ps with the direct heating configuration, TDTR data cannot be fitted with the thermal model because of the significant contribution of electrons on ∆R. Note that the peak of ∆Te is about six times larger with the direct heating than with the indirect heating, as shown in Figure 1b. In addition, the direct heating produces a significant amount of non-thermal electrons on Au, whose effect on ∆R could be larger than that of thermalized electrons. Since thermal modeling analyzes ∆Tph, we ignore such a peak of TDTR in a few ps for the fitting process.
4. Discussion
Using the TDTR technique, we measured the transient increase in temperature of Au in the FM/Au bilayer with two different heating configurations: indirect (pump on FM) and direct (pump on Au) heating. By analyzing the dynamics of temperature response using thermal circuit modeling, we determined the electron-phonon coupling (g) parameters of Fe and Co: 8.8 × 10¹⁷ (indirect heating) and 9.4 × 10¹⁷ (direct heating) for Fe and 9.6 × 10¹⁷ (indirect heating) and 12.2 × 10¹⁷ (direct heating) for Co, all in a units of W m−3 K−1. These values are similar to the previous result of Ni of 8.6 × 10¹⁷ W m−3 K−1 [11]. Despite a large variation in the theoretical prediction, we demonstrated that the g parameters of all 3d transition FMs are in the order of 1018 W m−3 K−1. Our determination of the g parameters could be useful for future research for ultrafast transport of heat, charge, and spin in FM. In addition, we found that g values tend to be larger with direct heating than with indirect heating. As a possible origin for this discrepancy, we suspect the uncertainties on the assumptions in thermal modeling. For the direct heating, we assume an exponential distribution of initial energy with a characteristic length of 121.3 nm, considering the ballistic transport in Au. Such a simple exponential distribution may not accurately describe the effect of non-thermal electrons. Since the complexity of non-thermal electrons, which is difficult to describe in diffusive thermal modeling, is suppressed in indirect heating, we expect that the g determination from the indirect heating is more accurate than that from the direct heating. The indirect heating configuration in a bilayer can be applied to various metals to determine the g parameters.
Author Contributions
Conceptualization and validation, G.-M.C.; investigation, data curation, writing—original draft preparation, K.K.; writing—review and editing, K.K. and G.-M.C. All authors have read and agreed to the published version of the manuscript.
Funding
G.-M.C. is funded by National Research Foundation of Korea (2019R1C1C1009199, 2018M3D1A1058793).
Institutional Review Board Statement
Not applicable.
Informed Consent Statement
Not applicable.
Data Availability Statement
Derived data supporting the findings of this study are available from the corresponding author on request.
Conflicts of Interest
The authors declare no conflict of interest.
References
- Anisimov, S.; Kapeliovich, B.; Perel’Man, T. Electron emission from metal surfaces exposed to ultrashort laser pulses. Sov. J. Exp. Theor. Phys. 1974, 39, 776–781. [Google Scholar]
- Fujimoto, J.G.; Liu, J.M.; Ippen, E.P.; Bloembergen, N. Femtosecond Laser Interaction with Metallic Tungsten and Nonequilibrium Electron and Lattice Temperatures. Phys. Rev. Lett. 1984, 53, 1837–1840. [Google Scholar] [CrossRef]
- Philip, B. Allen Theory of Thermal Relaxation of Electrons in Metals. Phys. Rev. Lett. 1987, 59, 1460. [Google Scholar]
- Brorson, S.D.; Kazeroonian, A.; Moodera, J.S.; Face, D.W.; Cheng, T.K.; Ippen, E.P.; Dresselhaus, M.S.; Dresselhaus, G. Femtosecond room-temperature measurement of the electron-phonon coupling constant γ in metallic superconductors. Phys. Rev. Lett. 1990, 64, 2172–2175. [Google Scholar] [CrossRef] [Green Version]
- Elsayed-Ali, H.E.; Juhasz, T.; Smith, G.O.; Bron, W.E. Femtosecond thermoreflectivity and thermotransmissivity of polycrystalline and single-crystalline gold films. Phys. Rev. B 1991, 43, 4488–4491. [Google Scholar] [CrossRef] [PubMed]
- Groeneveld, R.H.M.; Sprik, R.; Lagendijk, A. Femtosecond spectroscopy of electron-electron and electron-phonon energy relaxation in Ag and Au. Phys. Rev. B 1995, 51, 11433–11445. [Google Scholar] [CrossRef] [PubMed] [Green Version]
- Hostetler, J.L.; Smith, A.N.; Czajkowsky, D.M.; Norris, P.M. Measurement of the electron-phonon coupling factor dependence on film thickness and grain size in Au, Cr, and Al. Appl. Opt. 1999, 38, 3614–3620. [Google Scholar] [CrossRef] [PubMed]
- Lin, Z.; Zhigilei, L.; Celli, V. Electron-phonon coupling and electron heat capacity of metals under conditions of strong electron-phonon nonequilibrium. Phys. Rev. B 2008, 77, 1–17. [Google Scholar] [CrossRef] [Green Version]
- Caffrey, A.P.; Hopkins, P.E.; Klopf, J.M.; Norris, P.M. Thin Film Non-Noble Transition Metal Thermophysical Properties. Microscale Thermophys. Eng. 2005, 9, 365–377. [Google Scholar] [CrossRef]
- Beaurepaire, E.; Merle, J.-C.; Daunois, A.; Bigot, J.-Y. Ultrafast Spin Dynamics in Ferromagnetic Nickel. Phys. Rev. Lett. 1996, 76, 4250–4253. [Google Scholar] [CrossRef]
- Kang, K.; Choi, G.-M. Thermal coupling parameters between electron, phonon, and magnon of Nickel. J. Magn. Magn. Mater. 2020, 514, 167156. [Google Scholar] [CrossRef]
- Petrov, Y.V.; Inogamov, N.A.; Migdal, K.P. Thermal conductivity and the electron-ion heat transfer coefficient in condensed media with a strongly excited electron subsystem. JETP Lett. 2013, 97, 20–27. [Google Scholar] [CrossRef]
- Ritzmann, U.; Oppeneer, P.M.; Maldonado, P. Theory of out-of-equilibrium electron and phonon dynamics in metals after femtosecond laser excitation. Phys. Rev. B 2020, 102, 214305. [Google Scholar] [CrossRef]
- Medvedev, N.; Milov, I. Electron-phonon coupling in metals at high electronic temperatures. Phys. Rev. B 2020, 102, 064302. [Google Scholar] [CrossRef]
- Jang, H.; Marnitz, L.; Huebner, T.; Kimling, J.; Kuschel, T.; Cahill, D.G. Thermal Conductivity of Oxide Tunnel Barriers in Magnetic Tunnel Junctions Measured by Ultrafast Thermoreflectance and Magneto-Optic Kerr Effect Thermometry. Phys. Rev. Appl. 2020, 13, 1. [Google Scholar] [CrossRef] [Green Version]
- Wang, W.; Cahill, D.G. Limits to Thermal Transport in Nanoscale Metal Bilayers due to Weak Electron-Phonon Coupling in Au and Cu. Phys. Rev. Lett. 2012, 109, 175503. [Google Scholar] [CrossRef] [Green Version]
- Choi, G.-M.; Wilson, R.B.; Cahill, D.G. Indirect heating of Pt by short-pulse laser irradiation of Au in a nanoscale Pt/Au bilayer. Phys. Rev. B 2014, 89, 064307. [Google Scholar] [CrossRef]
- Schoenlein, R.W.; Lin, W.Z.; Fujimoto, J.G.; Eesley, G.L. Femtosecond studies of nonequilibrium electronic processes in metals. Phys. Rev. Lett. 1987, 58, 1680–1683. [Google Scholar] [CrossRef]
- Groeneveld, R.H.M.; Sprik, R.; Lagendijk, A. Effect of a nonthermal electron distribution on the electron-phonon energy relaxation process in noble metals. Phys. Rev. B 1992, 45, 5079–5082. [Google Scholar] [CrossRef] [PubMed] [Green Version]
- Giri, A.; Gaskins, J.T.; Foley, B.M.; Cheaito, R.; Hopkins, P.E. Experimental evidence of excited electron number density and temperature effects on electron-phonon coupling in gold films. J. Appl. Phys. 2015, 117, 044305. [Google Scholar] [CrossRef] [Green Version]
- Cahill, D.G. Analysis of heat flow in layered structures for time-domain thermoreflectance. Rev. Sci. Instrum. 2004, 75, 5119–5122. [Google Scholar] [CrossRef]
- Huxtable, S.; Cahill, D.G.; Fauconnier, V.; White, J.O.; Zhao, J.-C. Thermal conductivity imaging at micrometre-scale resolution for combinatorial studies of materials. Nat. Mater. 2004, 3, 298–301. [Google Scholar] [CrossRef]
- Costescu, R.M.; Wall, M.A.; Cahill, D.G. Thermal conductance of epitaxial interfaces. Phys. Rev. B 2003, 67, 054302. [Google Scholar] [CrossRef]
- Pratt, W.; Bass, J. Perpendicular-current studies of electron transport across metal/metal interfaces. Appl. Surf. Sci. 2009, 256, 399–403. [Google Scholar] [CrossRef] [Green Version]
- Wang, H.; Xu, Y.; Shimono, M.; Tanaka, Y.; Yamazaki, M. Computation of Interfacial Thermal Resistance by Phonon Diffuse Mismatch Model. Mater. Trans. 2007, 48, 2349–2352. [Google Scholar] [CrossRef] [Green Version]
- Van Kampen, M.; Kohlhepp, J.T.; De Jonge, W.J.M.; Koopmans, B.; Coehoorn, R. Sub-picosecond electron and phonon dynamics in nickel. J. Physics: Condens. Matter 2005, 17, 6823–6834. [Google Scholar] [CrossRef]
- Hohlfeld, J.; Wellershoff, S.-S.; Güdde, J.; Conrad, U.; Jähnke, V.; Matthias, E. Electron and lattice dynamics following optical excitation of metals. Chem. Phys. 2000, 251, 237–258. [Google Scholar] [CrossRef]
- Brorson, S.D.; Fujimoto, J.G.; Ippen, E.P. Femtosecond electronic heat-transport dynamics in thin gold films. Phys. Rev. Lett. 1987, 59, 1962–1965. [Google Scholar] [CrossRef]
- Wilson, R.B.; Apgar, B.A.; Martin, L.W.; Cahill, D.G. Thermoreflectance of metal transducers for optical pump-probe studies of thermal properties. Opt. Express 2012, 20, 28829–28838. [Google Scholar] [CrossRef] [PubMed]
- Purdue University, Thermophysical Properties Research Center. Thermophysical Properties of High Temperature Solid Materials; Touloukian, Y.S., Ed.; Macmillan: New York, NY, USA, 1967. [Google Scholar]
- Bruce, H.B.; Dwight, E. American Institute of Physics Handbook, 3rd ed.; McGraw-Hill: New York, NY, USA, 1972. [Google Scholar]
- Klemens, P.G.; Williams, R.K. Thermal conductivity of metals and alloys. Int. Met. Rev. 1986, 31, 197. [Google Scholar] [CrossRef]
- Wang, Y.; Lu, Z.; Ruan, X. First principles calculation of lattice thermal conductivity of metals considering phonon-phonon and phonon-electron scattering. J. Appl. Phys. 2016, 119, 225109. [Google Scholar] [CrossRef] [Green Version]
- Parchovianský, M.; Galusek, D.; Švančárek, P.; Sedláček, J.; Šajgalík, P. Thermal behavior, electrical conductivity and microstructure of hot pressed Al2O3/SiC nanocomposites. Ceram. Int. 2014, 40, 14421–14429. [Google Scholar] [CrossRef]
- Johnson, P.B.; Christy, R.W. Optical Constant of the Nobel Metals. Phys. Rev. B 1972, 6, 4370–4379. [Google Scholar] [CrossRef]
- Johnson, P.; Christy, R. Optical constants of transition metals: Ti, V, Cr, Mn, Fe, Co, Ni, and Pd. Phys. Rev. B 1974, 9, 5056–5070. [Google Scholar] [CrossRef]
- Malitson, I.H. and M.J. Dodge. Refractive-index and birefringence of synthetic sapphire. J. Opt. Soc. Am. 1972, 62, 1405. [Google Scholar]
Figure 1.
Analytic results of a thermal circuit simulation for the sap/Fe 20 nm/Au 100nm sample. An initial optical pump pulse is given on the Fe side (a) or Au side (b). The black solid/black dashed/red solid/red dashed line is ∆Te of Fe/∆Tph of Fe/∆Te of Au/∆Tph of Au, respectively. Three arrows indicate the timescales for (i) the thermalization in the electron bath (a few hundreds of femtoseconds), (ii) the thermal relaxation between the electron and phonon baths in Fe (a) or the spatial electronic heat transport from Au into Fe, which subsequently flows fast to the Fe phonon bath (b) (a few picoseconds), and (iii) the thermal relaxation between Fe and Au layers (a few hundreds of picoseconds). (c) The heat current per unit area from Fe to Au is driven by the optical excitation of Fe. The black solid/red dashed/blue dotted line is a simulation result with 8.8/4.4/17.6 × 1017 W m−3 K−1 of the g parameter of Fe. The larger the g parameter is, the smaller the heat current that flows from Fe to Au.

Figure 2.
(a) The sub-circuit in the thermal circuit model, as indicated with a blue dashed line. The square/circle node has / information and is connected to another square/circle nodes in neighboring sub-circuits. The heat source P is connected to the square node. (b) A schematic of the whole circuit, including the interfacial thermal resistances between two sub-circuits of different materials.

Figure 3.
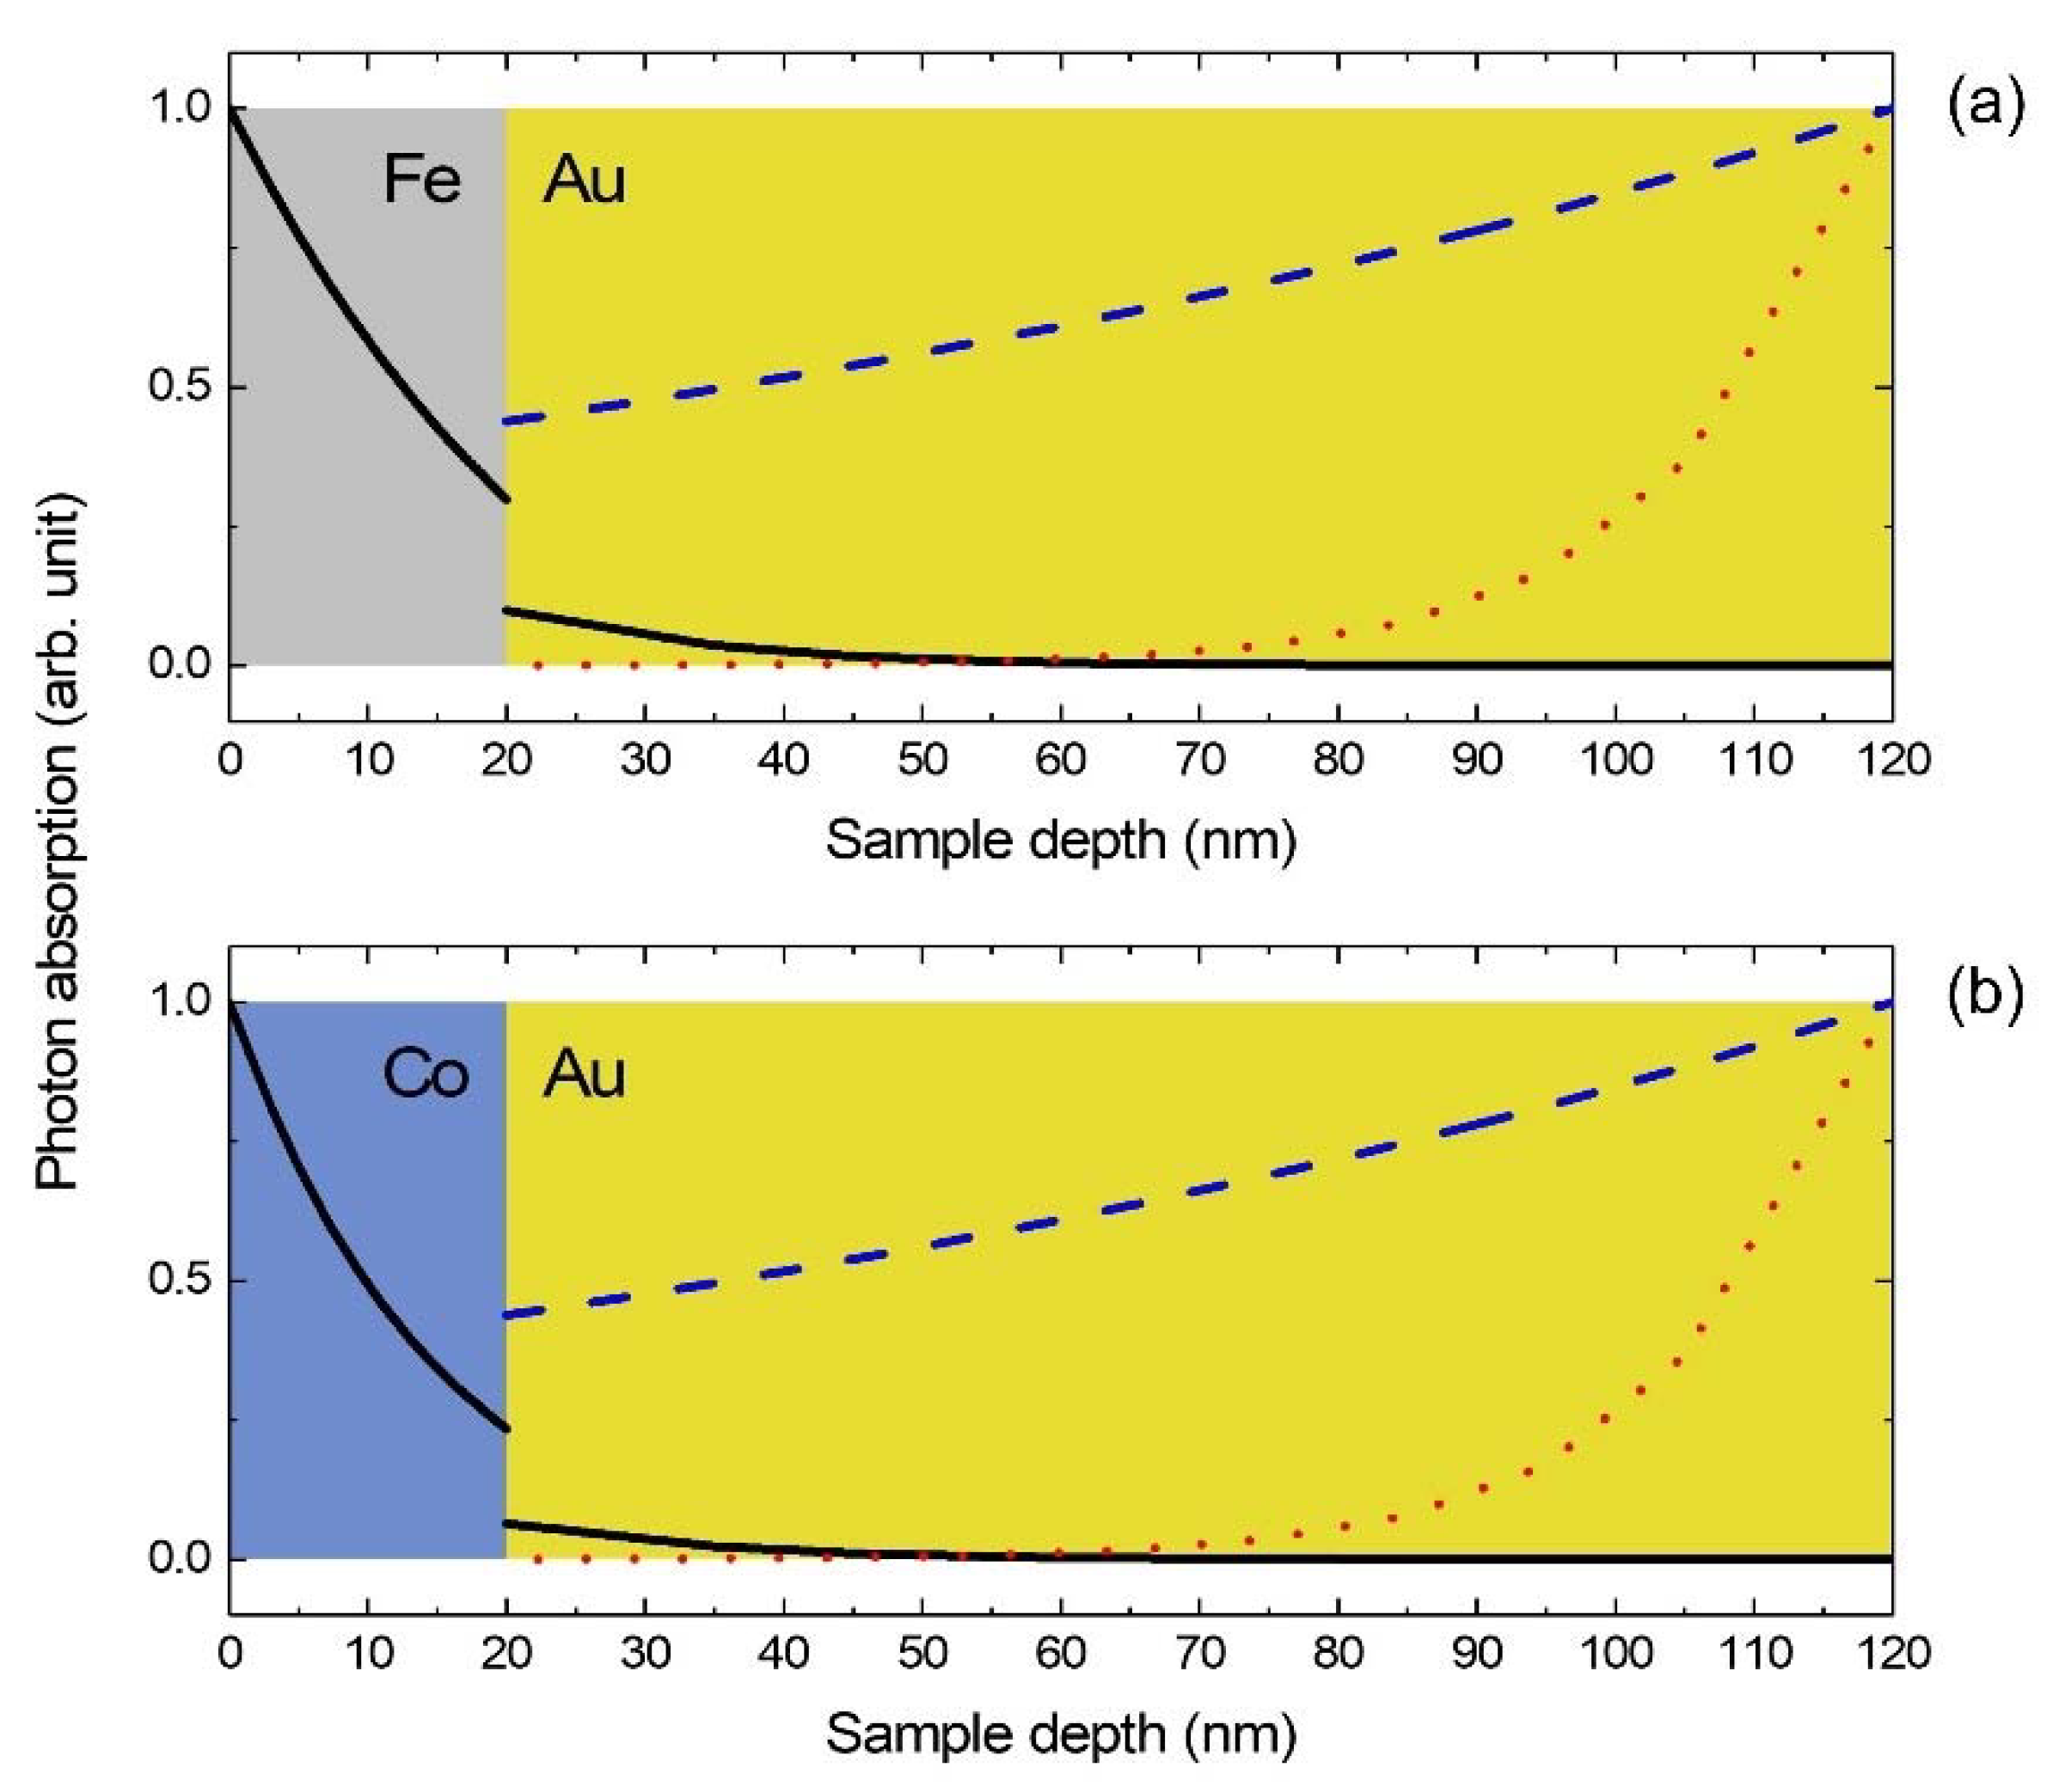
Initial electronic thermal energy distributions in the Fe/Au sample (a) and Co/Au sample (b). The black solid lines are that with the pump on the FM side, which are same with the optical energy absorption by the sample. Meanwhile, the blue dashed lines are that with the Au side pump, which are calculated with the phenomenological penetration depth of optically excited non-thermal electrons in Au, adapted from Ref. [27]. The red dotted lines are weight functions of ∆Tph in all Au sub-circuits to the TDTR signal.
Figure 3.
Initial electronic thermal energy distributions in the Fe/Au sample (a) and Co/Au sample (b). The black solid lines are that with the pump on the FM side, which are same with the optical energy absorption by the sample. Meanwhile, the blue dashed lines are that with the Au side pump, which are calculated with the phenomenological penetration depth of optically excited non-thermal electrons in Au, adapted from Ref. [27]. The red dotted lines are weight functions of ∆Tph in all Au sub-circuits to the TDTR signal.

Figure 4.
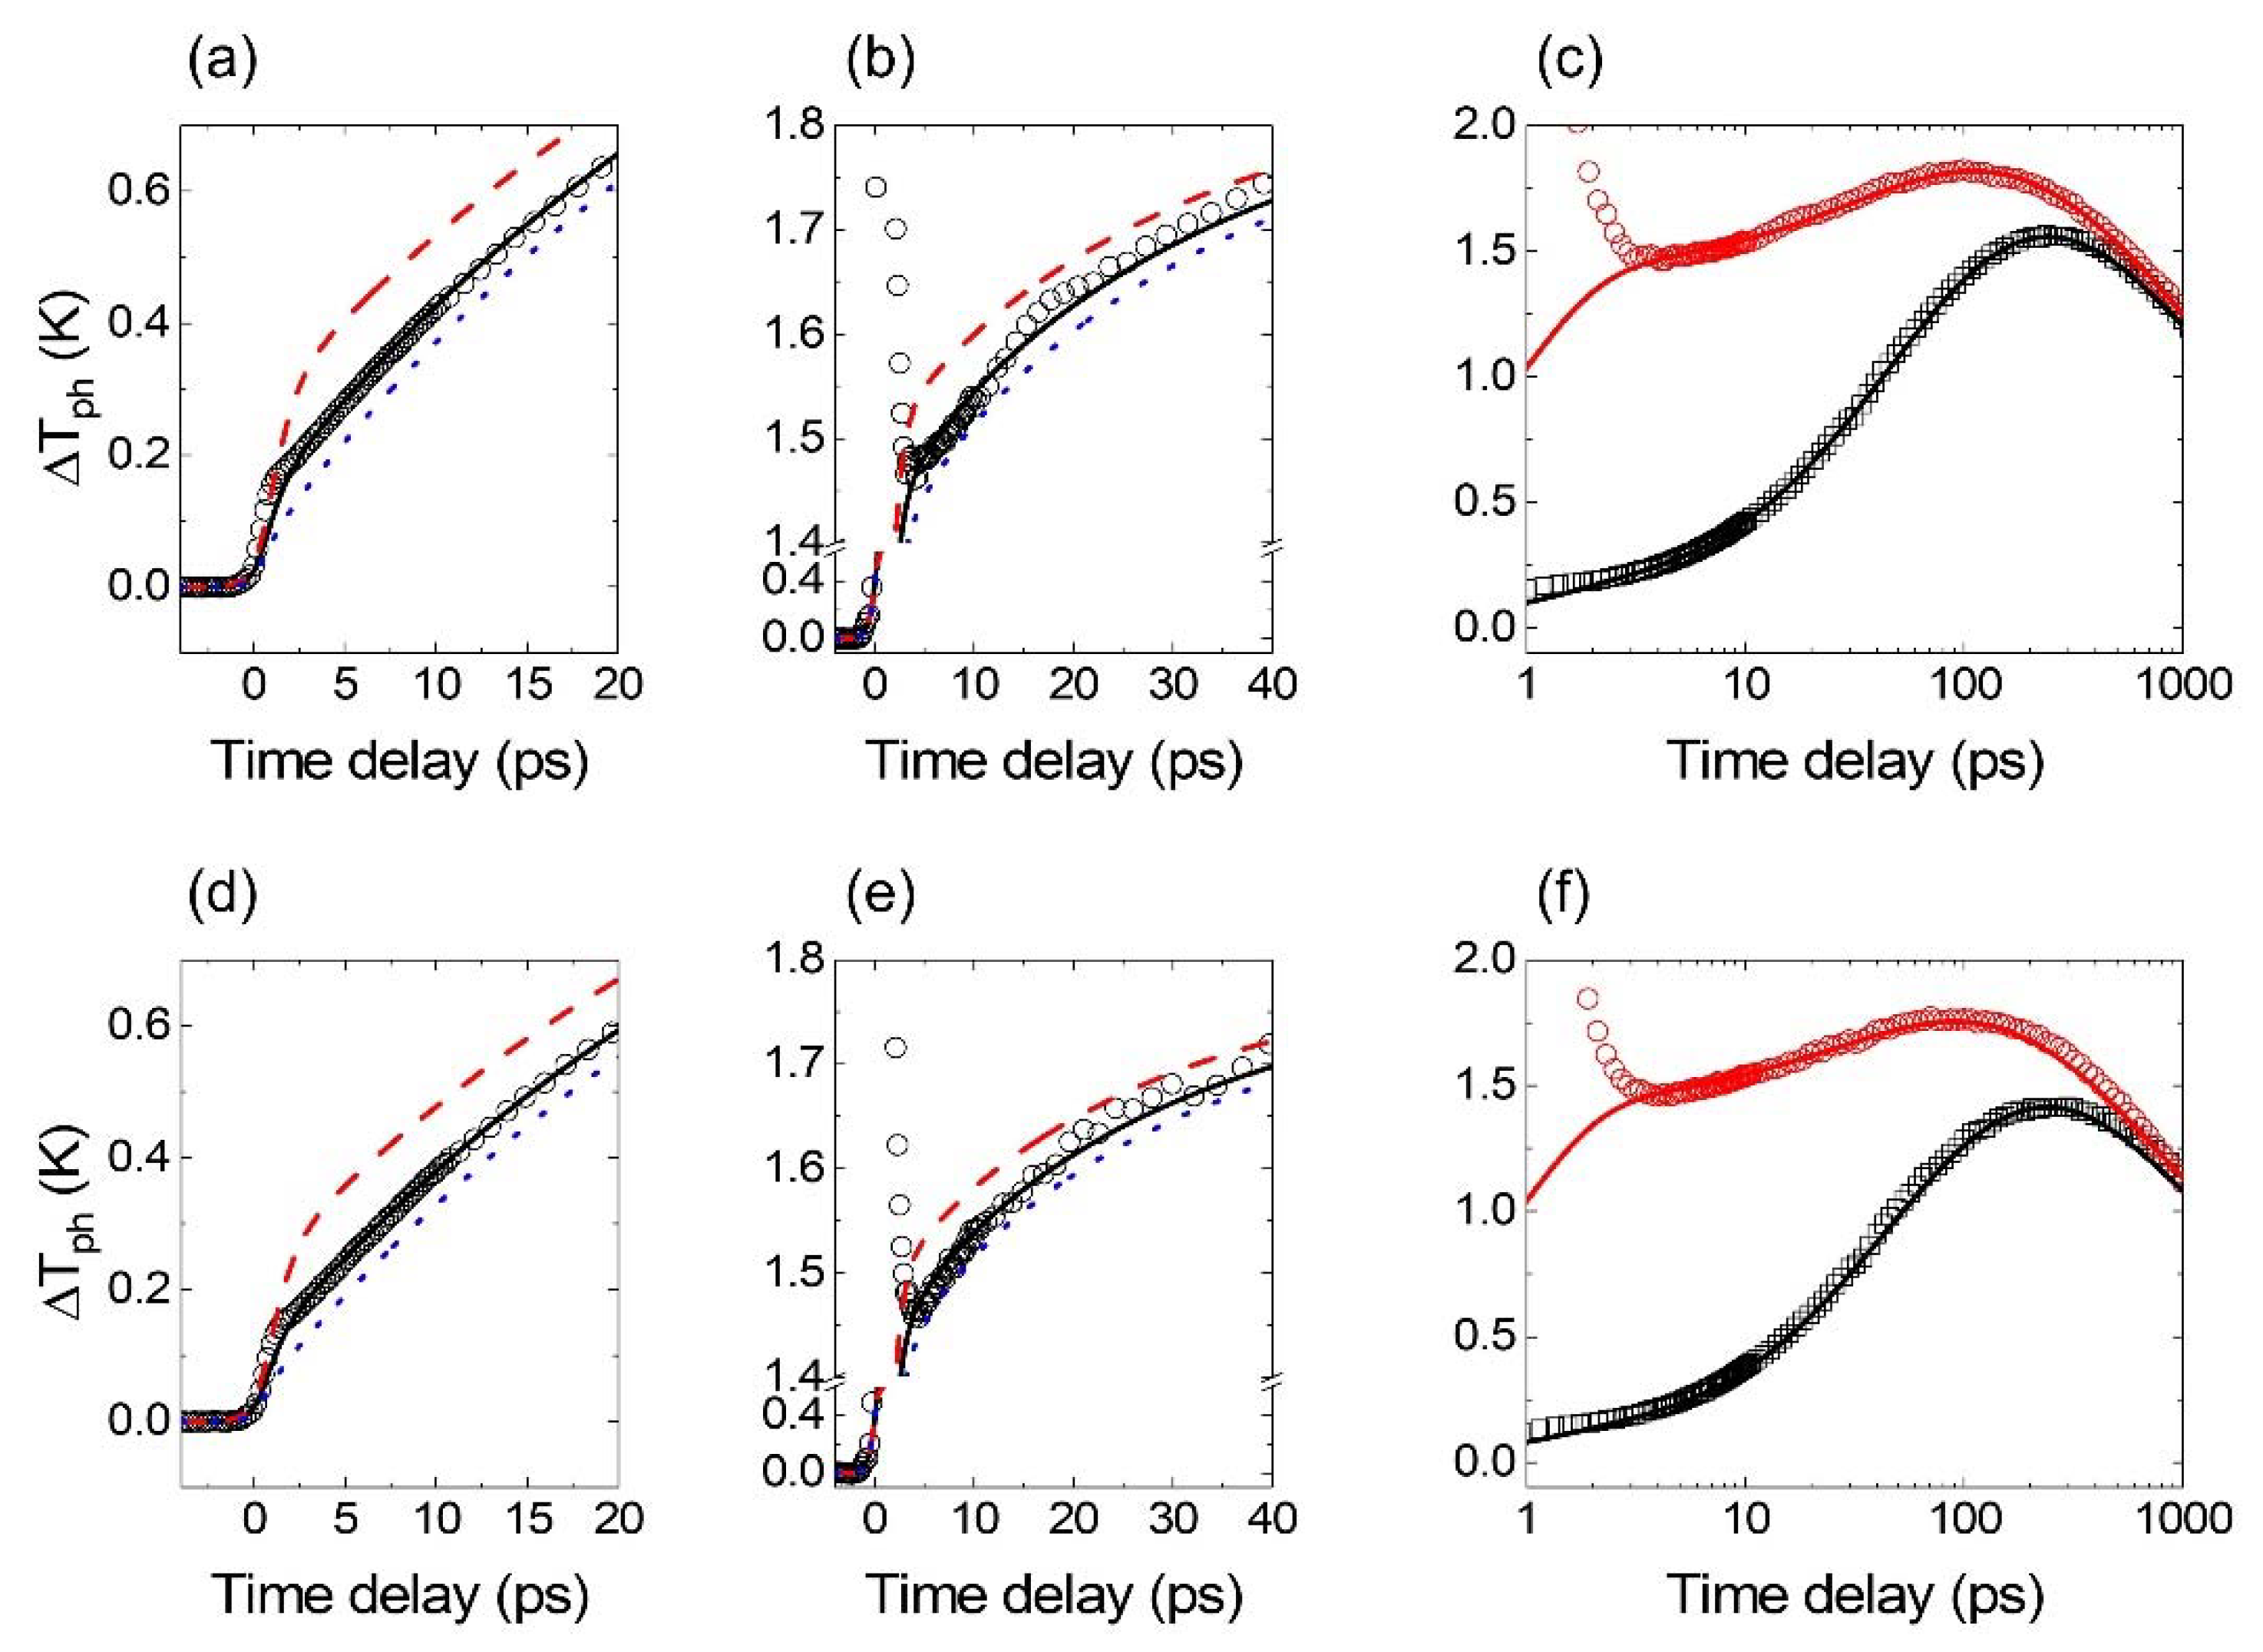
Fitting results between the thermal circuit simulation and TDTR data (all symbols). (a) and (b) ∆Tph of the Au layer in the Fe/Au sample with a pump pulse incidence on the Fe side and the Au side, respectively. The black circles are TDTR results. The black solid/red dashed/blue dotted lines are the thermal circuit model results with (a) 8.8/4.4/17.6 and (b) 9.4/4.7/18.8 of the g parameter of Fe. (c) Overall excursion of ∆Tph of the Au during 1 ns. The black squares/red circles are TDTR results with the indirect/direct heating. The black/red line is the thermal model results for the indirect/direct heating with the g parameter of Fe of 9.1. (d–f) Same configurations as above, but the Co/Au sample is analyzed. The black solid/red dashed/blue dotted lines are the thermal circuit model results with (d) 9.6/4.7/19.2 and (e) 12.2/6.1/24.4 of the g parameter of Co. The g parameter of 10.9 of Co is used for black and red lines in (f). All g parameters are in a unit of 1017 W m−3 K−1.
Figure 4.
Fitting results between the thermal circuit simulation and TDTR data (all symbols). (a) and (b) ∆Tph of the Au layer in the Fe/Au sample with a pump pulse incidence on the Fe side and the Au side, respectively. The black circles are TDTR results. The black solid/red dashed/blue dotted lines are the thermal circuit model results with (a) 8.8/4.4/17.6 and (b) 9.4/4.7/18.8 of the g parameter of Fe. (c) Overall excursion of ∆Tph of the Au during 1 ns. The black squares/red circles are TDTR results with the indirect/direct heating. The black/red line is the thermal model results for the indirect/direct heating with the g parameter of Fe of 9.1. (d–f) Same configurations as above, but the Co/Au sample is analyzed. The black solid/red dashed/blue dotted lines are the thermal circuit model results with (d) 9.6/4.7/19.2 and (e) 12.2/6.1/24.4 of the g parameter of Co. The g parameter of 10.9 of Co is used for black and red lines in (f). All g parameters are in a unit of 1017 W m−3 K−1.


Table 1.
Intrinsic properties included in the thermal circuit model.
| Au | Fe | Co | Sapphire | |
|---|---|---|---|---|
| () | 2.5 1 | 3.5 1 | 3.76 1 | 3.08 1 |
| () | 67.6 2 | 705 2 | 710 2 | |
| () | 2.47 3 | 3.32 3 | 3.55 3 | 3.08 3 |
| () | 0.7 4 | 0.17 5 | 0.18 5 | |
| () | 2.5 6 | 9 5 | 5 5 | 30 7 |
| () | 0.22 8 | 8.8–9.4 9 | 9.6–12.2 9 | |
| () | 20 10 | 14 10 | ||
| () | 1 11 | 1 11 | ||
| () | 0.35 9 | 0.6 9 | ||
| 0.15 + 4.8j 12 | 2.9 + 3.33j 13 | 2.46 + 4.75j 13 | 1.76 14 | |
| () | 2 15 |
1 Reference [30]; 2 Reference [31]; 3 obtained by ctotal—ce at 300 K; 4 Wiedemann-Franz law calculation with a measured electrical conductivity; 5 Reference [32]; 6 Reference [33]; 7 Reference [34]; 8 References [8,16,17]; 9 Determined values in this work; 10 Wiedemann-Franz law calculation with interfacial electrical resistances reported [24]; 11 Reference [25]; 12 Reference [35]; 13 Reference [36]; 14 Reference [37]; 15 Reference [29].
Publisher’s Note: MDPI stays neutral with regard to jurisdictional claims in published maps and institutional affiliations. |
© 2021 by the authors. Licensee MDPI, Basel, Switzerland. This article is an open access article distributed under the terms and conditions of the Creative Commons Attribution (CC BY) license (https://creativecommons.org/licenses/by/4.0/).
Share and Cite
MDPI and ACS Style
Kang, K.; Choi, G.-M. Electron-Phonon Coupling Parameter of Ferromagnetic Metal Fe and Co. Materials 2021, 14, 2755. https://doi.org/10.3390/ma14112755
AMA Style
Kang K, Choi G-M. Electron-Phonon Coupling Parameter of Ferromagnetic Metal Fe and Co. Materials. 2021; 14(11):2755. https://doi.org/10.3390/ma14112755
Chicago/Turabian StyleKang, Kyuhwe, and Gyung-Min Choi. 2021. "Electron-Phonon Coupling Parameter of Ferromagnetic Metal Fe and Co" Materials 14, no. 11: 2755. https://doi.org/10.3390/ma14112755
Note that from the first issue of 2016, this journal uses article numbers instead of page numbers. See further details here.