Rate-Dependent Cohesive Zone Model for Fracture Simulation of Soda-Lime Glass Plate

1
School of Civil Engineering and Transportation, South China University of Technology, Guangzhou 510640, China
2
School of Civil Engineering, Guangzhou College of South China University of Technology, Guangzhou 510800, China
*
Author to whom correspondence should be addressed.
Materials 2020, 13(3), 749; https://doi.org/10.3390/ma13030749
Submission received: 29 December 2019
/
Revised: 30 January 2020
/
Accepted: 1 February 2020
/
Published: 6 February 2020
(This article belongs to the Special Issue Advances in Structural Mechanics Modeled with FEM)
Abstract
:In this paper, rate-dependent cohesive zone model was established to numerical simulate the fracture process of soda-lime glass under impact loading. Soda-lime glass is widely used in architecture and automobile industry due to its transparency. To improve the accuracy of fracture simulation of soda-lime glass under impact loading, strain rate effect was taken into consideration and a rate-dependent cohesive zone model was established. Tensile-shear mixed mode fracture was also taken account. The rate-dependent cohesive zone model was implemented in the commercial finite element code ABAQUS/Explicit with the user subroutine VUMAT. The fracture behavior of a monolithic glass plate impacted by a hemispherical impactor was simulated. The simulation results demonstrated that the rate-dependent cohesive zone model is more suitable to describe the impact failure characteristics of a monolithic glass plate, compared to cohesive zone model without consideration of strain rate. Moreover, the effect of the strain rate sensitivity coefficient C, the mesh size of glass plate and the impact velocity on the fracture characteristics were studied.
1. Introduction
Because of its good transparency, soda-lime glass is often used in window panes and curtain wall systems in modern buildings. However, soda lime glass is threatened by extreme loads such as impact loading and blast loading. Under these extreme conditions, due to brittleness, soda-lime glass may suddenly crack, fragment, or even shatter. For example, statistics shows that windborne debris as a major contributor to glass damage when encountering typhoon weather [1]. The study of soda-lime glass materials under impact loading is vital. For this reason, it is necessary to investigate the cracking mechanism of glass window panes.
In recent years, a large number of experimental [2,3,4,5,6,7,8,9,10,11], analytic [12,13,14,15,16], and numerical [17,18,19,20,21,22,23,24,25,26,27,28,29,30,31,32,33,34,35,36,37,38,39,40,41,42,43,44] studies have been devoted to the fracture of soda lime glass. Nie and Chen [2,3,4,5] conducted SHPB experiments to study the effect of the shear stress, mechanical confinement, and temperature on the strength of glass under dynamic loading. Daryadel et al. [6] investigate the influence of the surface flaw on the strength. Johnson et al. [7] and Zhang et al. [9,10,11] reveals that the compressive strength of soda-lime glass is rate-dependent. Further research shows that not only the compressive strength but also the tensile strength could increase with the increase of strain rate [8,11]. Ji and Dharani [15] developed analytic approaches to simulate the damage probability in laminated glass subjected to low velocity small missile impacts. Dharani et al. [14] proposed a two-parameter Weibull distribution to characterize the cumulative probability of inner glass ply breakage. Zhou et al. [13] proposed an empirical formula to calculate the average fragment size. Overend et al. [12] delivered a general crack growth model based on established statistical failure theory and linear elastic fracture mechanics. Nurhuda et al. [16] put forward a model to estimation of strengths in large annealed glass panels which contain widely spaced flaws. A large amount of numerical method is proposed to simulate the cracking process of soda-lime glass. For example, André et al. [39] and Braun et al. [40] adopt the discrete element method (DEM) to conduct the simulation. However, finite element method (FEM) is the most commonly used method. The discontinuity modeling is the most important part when FEM is adopted to the fracture simulation of the soda-lime glass. Element delete method (EDM) is the most common way to model the discontinuity. For instance, Bois et al. [41] simulate an impact of a sphere into a glass plate using an element delete method. Liu et al. [22] adopted EDM to investigate the energy absorption process of windshield under different impact speeds and angles. Extended finite element method (XFEM) [23,24,25,26] is also applied to the fracture simulation of soda-lime glass.
Cohesive zone model (CZM) has been found widely used in the cracking process simulation [27,28,29,30,31,32,33,34,35,36,37,38,44]. Barenblatt [31] and Dugdale [32] were the first to proposed the CZM. After that, application of CZM in the simulation of cracking of glass is more and more widespread. Repetto et al. [28] simulated the dynamic fracture and fragmentation of glass rod under impact loading with CZM. A mixed-mode formula is proposed to combined the tensile and shear cracking mode [29]. Intrinsic and extrinsic [30,34,35,36,37] cohesive zone models were used to simulate the cracking process of laminated glass.
So far, however, there has been little discussion about the rate-dependent cohesive zone model applied to the failure process of soda-lime glass. However, as the experimental results [8,9,10,11] showed that the strength of soda-lime glass could increase with the increase of strain rate. As a result, to ensure the accuracy, a rate-dependent CZM in fracture simulation of soda-lime glass is important and necessary.
The aim of this study is to improve the accuracy of fracture simulation of glass by employing a rate-dependent CZM. The overall structure of the study takes the form of five sections, including this introductory chapter. Section 2 begins by laying out the theoretical methodology of the rate-dependent cohesive zone model. In Section 3, simulation results are presented, including a successful validation against experimental results of a drop-weight test with monolithic glass plate. Besides, the effects of the strain rate sensitivity coefficient C, mesh size and impact velocity are investigated in Section 4.1, Section 4.2 and Section 4.3, respectively. Finally, the conclusions are drawn in Section 5.
2. Rate-Dependent Cohesive Zone Model
2.1. Traction–separation Law
To study the cracking process of soda-lime glass plate under impact loading, the rate-dependent cohesive zone model is employed to simulate the discontinuity in the finite element model. Cohesive zone model assumes that there is a small cohesive zone behind the crack tip, as shown in Figure 1 In the cohesive zone model, there is a mathematical relationship between the separation δ and traction t, as shown in Equation (1). This mathematical relationship is called traction–separation law (TSL).
t = f(δ)
A rate-dependent traction–separation law is employed in this research, and its normal law is showed in the Figure 2. The tensile stiffness of the cohesive zone will be degraded when the normal separation δn exceeds to a critical value, under quasi-static or under dynamic for example. As the separation continues to increase to the maximum normal separation ( under quasi-static and under dynamic), the tensile stiffness decreases to 0 completely, which indicates the formation of macro cracks. The energy required to form a new crack is called fracture energy. The dissipated energy (G) due to failure is equal to the integration of f(δn) and δn. Therefore, the normal fracture energy release rate in Figure 2 is equal to the area enclosed by the traction–separation curve and δn axis. The normal penalty stiffness Kn is the slope of the curve in the undamaged stage.
Similar to the normal traction–separation law, the shear traction–separation law is defined by a linear relationship between shear traction (τs) and the shear separation (δs), as shown in Figure 3. The shear stiffness of the cohesive zone will be degraded when the shear separation δs exceeds to a critical value, under quasi-static or under dynamic for example. As the separation continues to increase to the maximum shear separation (under quasi-static and under dynamic), the shear stiffness decreases to 0 completely, which indicates the formation of macro cracks. The dissipated energy (G) due to failure is equal to the integration of f(δs) and δs. Therefore, the shear fracture energy release rate in Figure 2 is equal to the area enclosed by the traction–separation curve and δs axis. The shear penalty stiffness Ks is the slope of the curve in the undamaged stage.
Under dynamic loading, the soda-lime glass is rate dependent [8,10,11]. In JH-2 constitutive model, Holmquist et al. [7] suggested the DIF (dynamic increment factor) should be formulated in Equation (2).
where the C is the strain rate sensitivity coefficient.
Therefore, the dynamic strength could be expressed by the Equations (3) and (4).
The maximum normal separation and the maximum shear separation under quasi-static could be calculated by the critical energy divided by stress. By multiplying DIF, we could obtain the dynamic maximum separation and , respectively, as shown in Equations (5) and (6).
The dynamic critical energy could be calculated by Equations (7) and (8), according to its definition.
2.2. Mixed-Mode Failure
The mode mix of the deformation fields in the cohesive zone quantify the relative proportions of normal and shear deformation. Under impact loading, mixed-mode cracking is very common. In mixed-mode failure, the maximum separation until failure is expressed by Equation (9).
where the is mixed-mode critical failure energy, calculated by the Benzeggagh–Kenane fracture criterion [45]. The could be calculated by Equation (10). In Equation (9), the is the mixed-mode separation corresponding the damage initiation, which could be calculated by Equation (11) [29].
where β = . and are initial damage separations under single failure mode, which could be calculated by Equations (12) and (13).
where Kn and Ks are the penalty stiffness of normal and shear mode, respectively.
Under mixed-mode failure, the damage is defined as
where the refers to the maximum value of the effective separation attained during the loading history. could be expressed by
where and are the immediate normal and shear separation, respectively, and <x> is the Macauley operator, which could be defined as
3. Simulation Results and Experimental Validation
3.1. Set Up of Experimental Test
Pauw [46] conducted drop-weight test with a monolithic glass specimen, which is a circular soda-lime glass plate with a radius of 50 mm and a thickness of 4 mm. The impactor is a steel cylinder with a 10 mm radius ending in a spherical tip [46]. If the boundary of the fixed plate is too rigid, it is easy to lead to stress concentration, which causes the plate to failure prematurely. Therefore, soft cushions are placed around the upper and lower parts of the plate. The cushions are annular, with a thickness of 3 mm, an inner radius of 46 mm and an outer radius of 54 mm. The schematic diagram of the experimental device is shown in Figure 4. Due to the symmetry, only one-quarter model is showed, and the model is symmetrical about the plane of x0y and y0z.
During the test, the acceleration time history curve of the punch is recorded by the sensor. The drop height of weight is 200 mm, and the velocity of contact plate is 1.98 m/s. The punch mass is 6.84 kg. The theoretical impact kinetic energy can be calculated as 13407.7 mJ by the equation .
3.2. Finite Element Model
Eight solid node elements are employed to discrete the soda-lime glass plate. The element size of glass plate is 0.7 mm × 0.7 mm. The mesh model is showed in the Figure 5. Due to the symmetry, only one-quarter model is showed. Because the location of cracks cannot be predicted, zero thickness cohesive elements are inserted between every two solid elements.
The frictionless hard contact is defined between the impactor and plate, and between the plate and the soft cushion, and between the soft cushion and the rigid clamper. The rigid clamper is fully fitted in translational and rotational degrees of freedom of x-, y-, and z-axis. The boundary conditions of the glass plate and the soft cushion are free. The initial velocity of impactor is 1.98 m/s, which is consistent with the experimental test. Symmetric boundary conditions are set on all symmetric surfaces.
Due to their stiffness is a lot larger than other parts, rigid bodies are employed to model impactor and the clamper. The material of soft cushion is polypropylene and a linear elastic constitutive model is adopted in simulation. Wedge element is used to mesh the impactor. If the size of wedge element is too large, there would be a loss of mass, which could result in the loss of kinetic energy. Table 1 depicts the errors corresponding to different mesh size of impactor. As could be seen in Table 1, the error will become larger when the mesh size of impactor increase. In order to ensure the accuracy, the wedge element size should be controlled lower than 2 mm. In this study, the element size of impactor near the impact area is set to 0.7 mm × 0.7 mm × 0.7 mm, whereas the other area is 2 mm × 2 mm × 2 mm.
3.3. Result Analysis
3.3.1. Elastic Result
To verify the accuracy of the FE model, including boundary conditions and so on, a simulation with elastic model is conducted. The constants of elastic model are shown in Table 2. Figure 6 shows the acceleration time curves of impactor. Compared to the experimental test results, the simulation result is a bit higher but keep the similar pattern. The reflection of stress wave on the boundary leads to the fluctuation of the curve, which could be found both in the experimental result and the simulation result.
3.3.2. Rate-Dependent CZM Results
Table 3 depicts the constants of rate-dependent cohesive zone model adopted in this study. In this section, numerical simulations are carried out with the rate-dependent CZM. In the simulation, cohesive element will be removed if damage is equal to 1. The rate-dependent cohesive zone model was implemented in the commercial finite element code ABAQUS/Explicit with the user subroutine VUMAT.
Figure 7 shows the simulation result conducted with rate-dependent cohesive zone model. The fracture mode of the simulation result agrees well with the experimental result. In the simulation result, the impact area of the plate is found obvious smash. Circle crack is found near the impact area, which thoroughly penetrated the thickness of the plate. Therefore, lots of fragments are formed. In the experimental test results, circle of cracks is also could be found, which results in a large area of vacancy. This phenomenon has also been well simulated in numerical test. In addition, in the experimental test, radial cracks appeared in the plate, which penetrated the whole plate and extended to the edge of the plate. The numerical results have the same crack pattern. To sum up, it can be concluded that the rate-dependent cohesive zone model can accurately simulate the fracture mode of the impact failure of the soda-lime glass plate.
After treated by the image processing method, we could obtain the front view of Figure 7, as shown in Figure 8. The numerical test results are symmetrical. However, due to the irregular microcracks on the surface of the glass plate in the laboratory test, the results of the laboratory test are not symmetrical. In Figure 8a, because of the symmetry, the cracks are regular. The fragments in Figure 8a in the middle are approximately triangular, and the maximum size of the fragment is 25.0 mm. The maximum size of the fragment obtained in the experimental test is about 25.2 mm. Therefore, we could conclude that the rate-dependent cohesive zone model could accurately calculate the size of the fragments under impact loading.
Figure 9 depicts the velocity-time curves of impactor. Between 0.0 ms and 0.2 ms, the curve of experimental test, simulation result with rate-dependent CZM and simulation result with CZM agree well. However, after 0.2 ms, the velocity obtained by CZM is obvious lower than the experimental results. The simulation result conducted with rate-dependent CZM is able to predict the velocity well as shown in Figure 9.
Figure 10 shows the fracture process of the glass plate. As could be seen in the Figure 10a, the radial cracks are the first to appear. After that, inner circle cracks could be found in the impact area, as shown in Figure 10c. Outer circle cracks are found at around 2.0 ms. At this moment, all the cracks are formed basically. We could infer that the formation of radial cracks is mainly because of the discontinuity of angular velocity. The formation of inner circle cracks is because of the punch shear, whereas the formation of outer circle cracks is because of the bending.
4. Parametric Studies
4.1. Strain Rate Sensitivity Coefficient C
In Equation (2), we employed a strain rate sensitivity coefficient C to consider the effect of strain rate on the fracture strength. Five numerical tests are carried out in this section, in order to study the effect of C on the cracking pattern. The numerical results are shown in Figure 11. In Figure 11a, the coefficient C is 0, which indicates that the strength of glass is rate independent. It could be found in Figure 11a that the fracture gathers near the impact area, which is inconsistent with the actual situation shown in Figure 7b. In Figure 11b, most of the energy dissipation is gather near the impact point as well even though the strain rate effect is put into consideration. When the coefficient C is 0.02, we could see that the outer circle crack is obvious. The crack pattern when C = 0.03 is the most consistent with the experimental result. The strain rate effect forms a shielding zone in the region with high strain rate, which makes the energy propagate outward. However, when C = 0.04, the strength of soda-lime glass becomes too high making the fracture area too small compared with Figure 11d. We could also find that the number of small fragments when C = 0.04 is obviously less than that in Figure 11d. This can also be attributed to the strength of the glass is too high when C = 0.04.
4.2. Mesh Size
Two different mesh is conducted in this section, including a fine mesh with element size of 0.7 mm and a coarse mesh with element size of 2 mm. The results are shown in Figure 12. The crack pattern of glass plate is similar. Radial cracks and circle crack can be found in both of numerical result. Fewer small fragments are found in the coarse mesh result. However, the large fragments of both the two results show agreement. We could conclude that the rate-dependent cohesive zone model has little dependence on the mesh size.
4.3. Impact Velocity
Figure 13 depicts the numerical results conducted with 5 different impact velocity. When the velocity is 0.50 m/s and 1.00 m/s, no outer circle cracks could be found in the result, as the Figure 13a,b shown. As the velocity increase, the outer circle cracks appear when velocity is 1.98 m/s, 3.00 m/s and 4.00 m/s. Thus, we can conclude that more kinetic energy is needed to form a circular crack compared with a radial crack.
5. Conclusions
In this paper, we have established a rate-dependent cohesive zone model for the fracture simulation of soda-lime glass plate. A monolithic glass plate is simulated in this paper conducted with the rate-dependent CZM and the simulation has been validated by the experimental results. Finally, parametric studies are carried out. The main conclusions found of this research are as follows:
- (1)
- Soda-lime glass is a rate dependent material. It is necessary to consider the rate dependence of glass when simulating fracture under impact loading. The numerical simulation results show that the rate-dependent CZM considering the strain rate is more accurate.
- (2)
- The rate-dependent CZM is applied to the finite element simulation by VUMAT. In the rate-dependent CZM, the maximum traction and the maximum separation are rate dependent, which results in that the cohesive element dissipate more energy when it is damaged. The strain rate effect forms a shielding zone in the region with high strain rate, which makes the energy propagate outward.
- (3)
- The rate-dependent cohesive zone model has little dependence on the mesh size. Furthermore, more kinetic energy is needed to form a circular crack compared with a radial crack.
Author Contributions
Conceptualization, D.L.; methodology, D.L.; software, D.L.; validation, D.L., D.W; formal analysis, D.W.; investigation, D.W.; resources, D.L.; data curation, D.L.; writing—original draft preparation, D.L.; writing—review and editing, D.L.; visualization, D.L.; supervision, D.W.; project administration, D.W.; funding acquisition, D.W. All authors have read and agreed to the published version of the manuscript.
Funding
The authors would like to gratefully acknowledge research grants from the National Natural Science Foundation of China (Project no. 11672110).
Conflicts of Interest
The authors declare that there is no conflict of interest regarding the publication of this paper.
References
- Minor, J.E. Lessons Learned from Failures of the Building Envelope in Windstorms. J. Archit. Eng. 2005, 11, 10–13. [Google Scholar] [CrossRef]
- Nie, X.; Chen, W.W.; Sun, X.; Templeton, D.W. Dynamic Failure of Borosilicate Glass Under Compression/Shear Loading Experiments. J. Am. Ceram. Soc. 2007, 90, 2556–2562. [Google Scholar] [CrossRef]
- Nie, X.; Chen, W. High-Rate Progressive Failure of Borosilicate Glass under Mechanical Confinement at High Temperatures. Exp. Mech. 2013, 53, 67–75. [Google Scholar] [CrossRef]
- Nie, X.; Chen, W.W. Dynamic Equibiaxial Flexural Strength of Borosilicate Glass at High Temperatures. Exp. Mech. 2012, 52, 135–143. [Google Scholar] [CrossRef]
- Sun, X.; Liu, W.; Chen, W.; Templeton, D. Modeling and characterization of dynamic failure of borosilicate glass under compression/shear loading. Int. J. Impact. Eng. 2009, 36, 226–234. [Google Scholar] [CrossRef]
- Daryadel, S.S.; Mantena, P.R.; Kim, K.; Stoddard, D.; Rajendran, A.M. Dynamic response of glass under low-velocity impact and high strain-rate SHPB compression loading. J. Non Cryst. Solids 2016, 432, 432–439. [Google Scholar] [CrossRef]
- Holmquist, T.J.; Johnson, G.R.; Lopatin, C.M.; Grandy, D.E. High strain rate properties and constitutive modeling of glass. In Proceedings of the 15th International Symposium on Ballistics, Jerusalem, Israel, 21–24 May 1995; pp. 237–244. [Google Scholar]
- Peroni, M.; Solomos, G.; Pizzinato, V.; Larcher, M. Experimental Investigation of High Strain-Rate Behaviour of Glass. Appl. Mech. Mater. 2011, 68, 63–68. [Google Scholar] [CrossRef]
- Zhang, X.; Zou, Y.; Hao, H.; Li, X.; Ma, G.; Liu, K. Laboratory Test on Dynamic Material Properties of Annealed Float Glass. Int. J. Prot. Struct. 2012, 3, 407–430. [Google Scholar] [CrossRef]
- Zhang, X.; Hao, H.; Ma, G. Dynamic material model of annealed soda-lime glass. Int. J. Impact Eng. 2015, 77, 108–119. [Google Scholar] [CrossRef] [Green Version]
- Zhang, X.; Hao, H.; Ma, G. Laboratory test and numerical simulation of laminated glass window vulnerability to debris impact. Int. J. Impact Eng. 2013, 55, 49–62. [Google Scholar] [CrossRef]
- Overend, M.; Parke, G.A.; Buhagiar, D. Predicting Failure in Glass-A General Crack Growth Model. J. Struct. Eng. 2007, 133, 1146–1155. [Google Scholar] [CrossRef] [Green Version]
- Zhou, F.; Molinari, J.; Ramesh, K.T. Characteristic fragment size distributions in dynamic fragmentation. Appl. Phys. Lett. 2006, 88, 261918. [Google Scholar] [CrossRef]
- Dharani, L.R.; Ji, F.; Behr, R.A.; Minor, J.E.; Kremer, P.A. Breakage Prediction of Laminated Glass Using the "Sacrificial Ply" Design Concept. J. Archit. Eng. 2004, 10, 126–135. [Google Scholar] [CrossRef]
- Ji, F.S.; Dharani, L.R.; Behr, R.A. Damage probability in laminated glass subjected to low velocity small missile impacts. J. Mater. Sci. 1998, 33, 4775–4782. [Google Scholar] [CrossRef]
- Nurhuda, I.; Lam, N.T.K.; Gad, E.F.; Calderone, I. Estimation of strengths in large annealed glass panels. Int. J. Solids Struct. 2010, 47, 2591–2599. [Google Scholar] [CrossRef] [Green Version]
- Pyttel, T.; Liebertz, H.; Cai, J. Failure criterion for laminated glass under impact loading and its application in finite element simulation. Int. J. Impact Eng. 2011, 38, 252–263. [Google Scholar] [CrossRef]
- Xu, X.Q.; Liu, B.H.; Wang, Y.; Li, Y.B.; Xu, J. A numerical model on PVB laminated windshield subjected to headform low-speed impact. J. Phys. Conf. Ser. 2013, 451, 12016. [Google Scholar] [CrossRef] [Green Version]
- Zhang, X.; Hao, H.; Ma, G. Parametric study of laminated glass window response to blast loads. Eng. Struct. 2013, 56, 1707–1717. [Google Scholar] [CrossRef]
- Peng, Y.; Yang, J.; Deck, C.; Willinger, R. Finite element modeling of crash test behavior for windshield laminated glass. Int. J. Impact Eng. 2013, 57, 27–35. [Google Scholar] [CrossRef]
- Hidallana-Gamage, H.D.; Thambiratnam, D.P.; Perera, N.J. Numerical modelling and analysis of the blast performance of laminated glass panels and the influence of material parameters. Eng. Fail. Anal. 2014, 45, 65–84. [Google Scholar] [CrossRef]
- Liu, B.; Xu, T.; Xu, X.; Wang, Y.; Sun, Y.; Li, Y. Energy absorption mechanism of polyvinyl butyral laminated windshield subjected to head impact: Experiment and numerical simulations. Int. J. Impact Eng. 2016, 90, 26–36. [Google Scholar] [CrossRef]
- Jaśkowiec, J. Numerical Modeling Mechanical Delamination in Laminated Glass by XFEM. Procedia Eng. 2015, 108, 293–300. [Google Scholar] [CrossRef]
- Xu, J.; Li, Y.; Chen, X.; Yan, Y.; Ge, D.; Zhu, M.; Liu, B. Characteristics of windshield cracking upon low-speed impact: Numerical simulation based on the extended finite element method. Comp. Mater. Sci. 2010, 48, 582–588. [Google Scholar] [CrossRef]
- Xu, X.; Xu, J.; Chen, J.; Li, P.; Liu, B.; Li, Y. Investigation of dynamic multi-cracking behavior in PVB laminated glass plates. Int. J. Impact Eng. 2017, 100, 62–74. [Google Scholar] [CrossRef]
- Ghaffari, D.; Rash Ahmadi, S.; Shabani, F. XFEM simulation of a quenched cracked glass plate with moving convective boundaries. C. R. Mécanique 2016, 344, 78–94. [Google Scholar] [CrossRef]
- Xu, X.P.; Needleman, A. Void nucleation by inclusion debonding in a crystal matrix. Model. Simul. Mater. Sci. Eng. 1993, 1, 111–132. [Google Scholar] [CrossRef]
- Repetto, E.A.; Radovitzky, R.; Ortiz, M. Finite element simulation of dynamic fracture and fragmentation of glass rods. Comput. Methods Appl Mech. Eng. 2000, 183, 3–14. [Google Scholar] [CrossRef]
- Camanho, P.P.; Davila, C.G.; de Moura, M.F. Numerical Simulation of Mixed-Mode Progressive Delamination in Composite Materials. J. Compos. Mater. 2003, 37, 1415–1438. [Google Scholar] [CrossRef]
- Gao, W.; Xiang, J.; Chen, S.; Yin, S.; Zang, M.; Zheng, X. Intrinsic cohesive modeling of impact fracture behavior of laminated glass. Mater. Design 2017, 127, 321–335. [Google Scholar] [CrossRef]
- Barenblatt, G.I. The Mathematical Theory of Equilibrium Cracks in Brittle Fracture. Adv. Appl. Mech. 1962, 7, 32. [Google Scholar] [CrossRef]
- Dugdale, D.S. Yielding of steel sheets containing slits. J. Mech. Phys. Solids 1960, 8, 100–104. [Google Scholar] [CrossRef]
- Celes, W.; Paulino, G.H.; Espinha, R. A compact adjacency-based topological data structure for finite element mesh representation. Int. J. Numer. Meth. Eng. 2005, 64, 1529–1556. [Google Scholar] [CrossRef]
- Zhang, Z.J.; Paulino, G.H.; Celes, W. Extrinsic cohesive modelling of dynamic fracture and microbranching instability in brittle materials. Int. J. Numer. Meth. Eng. 2007, 72, 893–923. [Google Scholar] [CrossRef]
- Chen, S.; Zang, M.; Xu, W. A three-dimensional computational framework for impact fracture analysis of automotive laminated glass. Comput. Methods Appl. Mech. Eng. 2015, 294, 72–99. [Google Scholar] [CrossRef]
- Chen, S.; Zang, M.; Wang, D.; Zheng, Z.; Zhao, C. Finite element modelling of impact damage in polyvinyl butyral laminated glass. Compos. Struct. 2016, 138, 1–11. [Google Scholar] [CrossRef]
- Lin, D.; Wang, D.; Chen, S.; Zang, M. Numerical simulations of impact fracture behavior of an automotive windshield glazing: An intrinsic cohesive approach. Compos. Struct. 2018, 186, 79–93. [Google Scholar] [CrossRef]
- Musto, M.; Alfano, G. A fractional rate-dependent cohesive-zone model. Int. J. Numer. Meth. Eng. 2015, 103, 313–341. [Google Scholar] [CrossRef] [Green Version]
- André, D.; Jebahi, M.; Iordanoff, I.; Charles, J.; Néauport, J. Using the discrete element method to simulate brittle fracture in the indentation of a silica glass with a blunt indenter. Comput. Methods Appl. Mech. Eng. 2013, 265, 136–147. [Google Scholar] [CrossRef] [Green Version]
- Braun, M.; Fernández-Sáez, J. A new 2D discrete model applied to dynamic crack propagation in brittle materials. Int. J. Solids Struct. 2014, 51, 3787–3797. [Google Scholar] [CrossRef] [Green Version]
- Du Bois, P.A.; Kolling, S.; Fassnacht, W. Modelling of safety glass for crash simulation. Comp. Mater. Sci. 2003, 28, 675–683. [Google Scholar] [CrossRef]
- Timmel, M.; Kolling, S.; Osterrieder, P.; Du Bois, P.A. A finite element model for impact simulation with laminated glass. Int. J. Impact Eng. 2007, 34, 1465–1478. [Google Scholar] [CrossRef]
- Yao, J.; Yang, J.; Otte, D. Investigation of head injuries by reconstructions of real-world vehicle-versus-adult-pedestrian accidents. Safety Sci. 2008, 46, 1103–1114. [Google Scholar] [CrossRef]
- Xu, X.P.; Needleman, A. Numerical simulations of fast crack growth in brittle solids. J. Mech. Phys. Solids 1994, 42, 1397–1434. [Google Scholar] [CrossRef]
- Benzeggagh, M.L.; Kenane, M. Measurement of mixed-mode delamination fracture toughness of unidirectional glass/epoxy composites with mixed-mode bending apparatus. Compos. Sci. Technol. 1996, 56, 439–449. [Google Scholar] [CrossRef]
- De Pauw, S. Experimental and Numerical Study of Impact on Window Glass Fitted with Safety Window Film. Ph.D. Thesis, Ghent University, Ghent, Belgium, 2010. [Google Scholar]
Figure 1.
Schematic diagram of cohesive model.
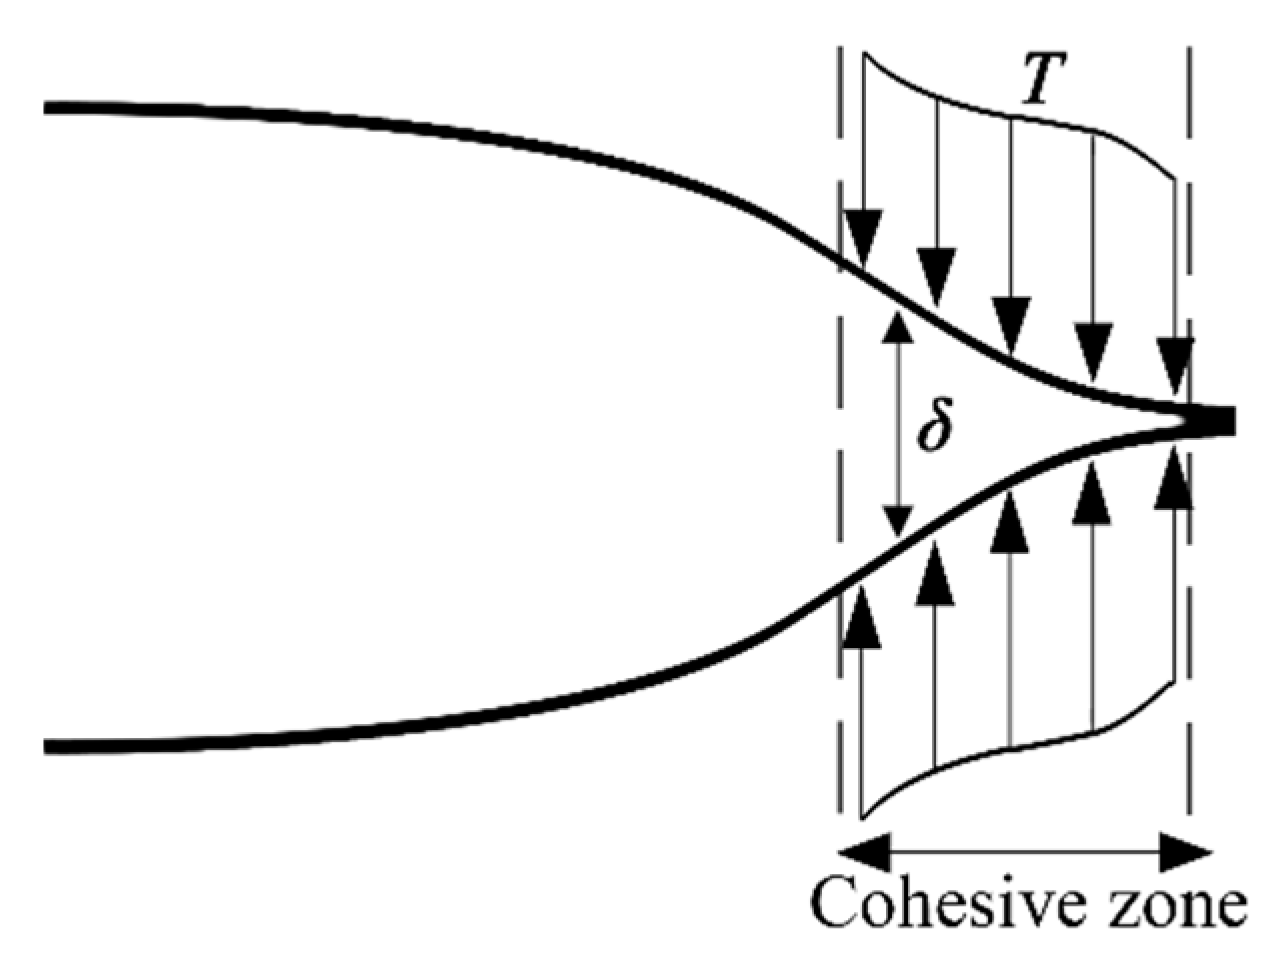
Figure 2.
Rate-dependent traction–separation law in normal direction.
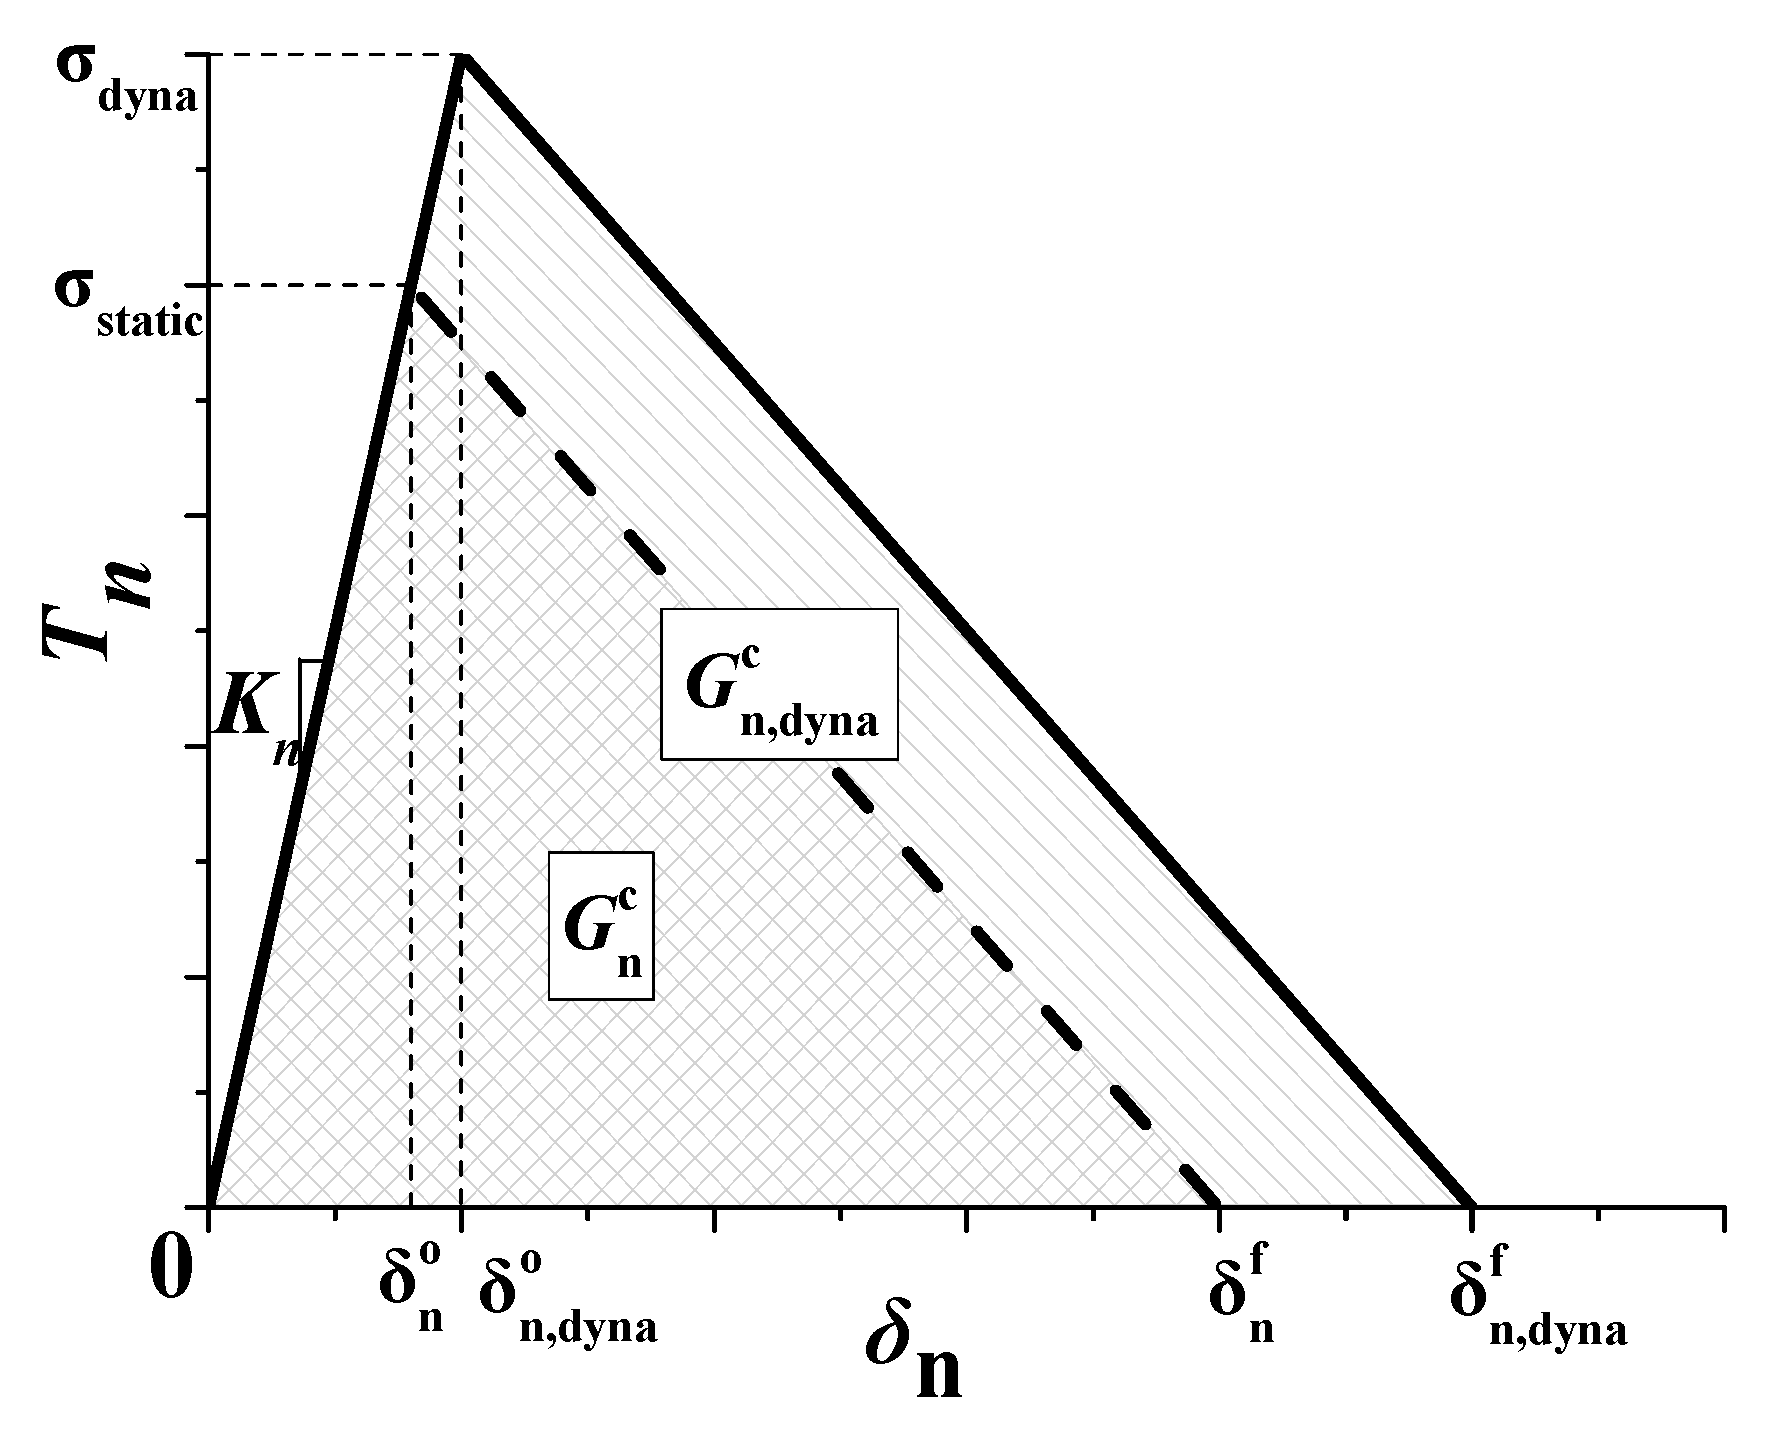
Figure 3.
Rate-dependent TSL for shear direction.
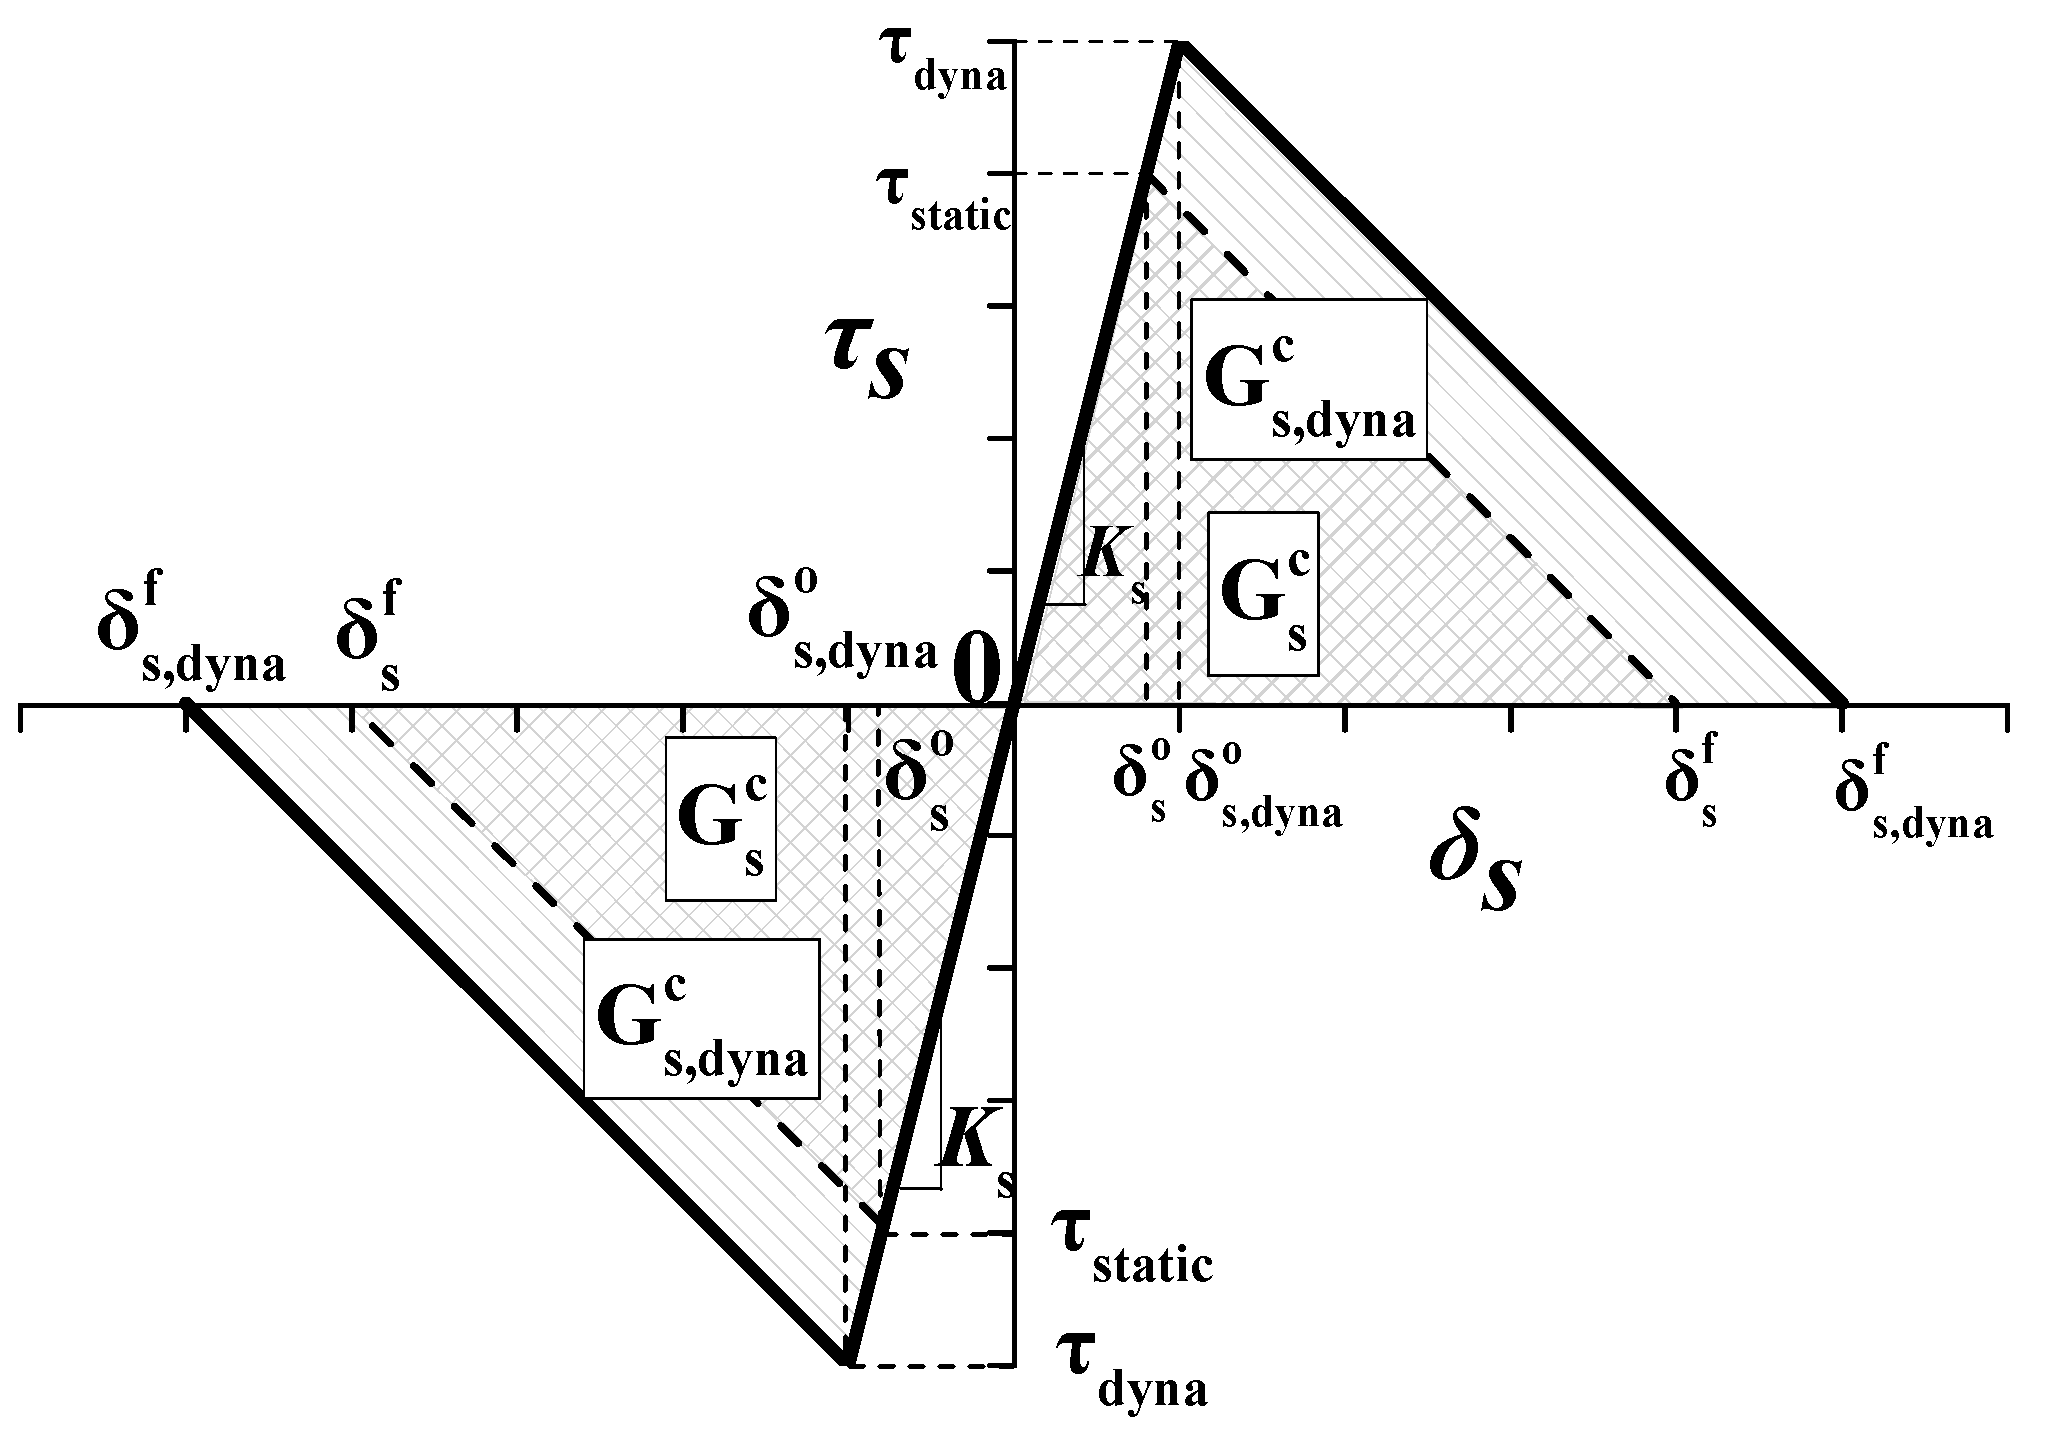
Figure 4.
Schematic diagram of basic test device.

Figure 5.
One-quarter mesh model of the plate (a) solid element mesh; (b) cohesive element mesh.
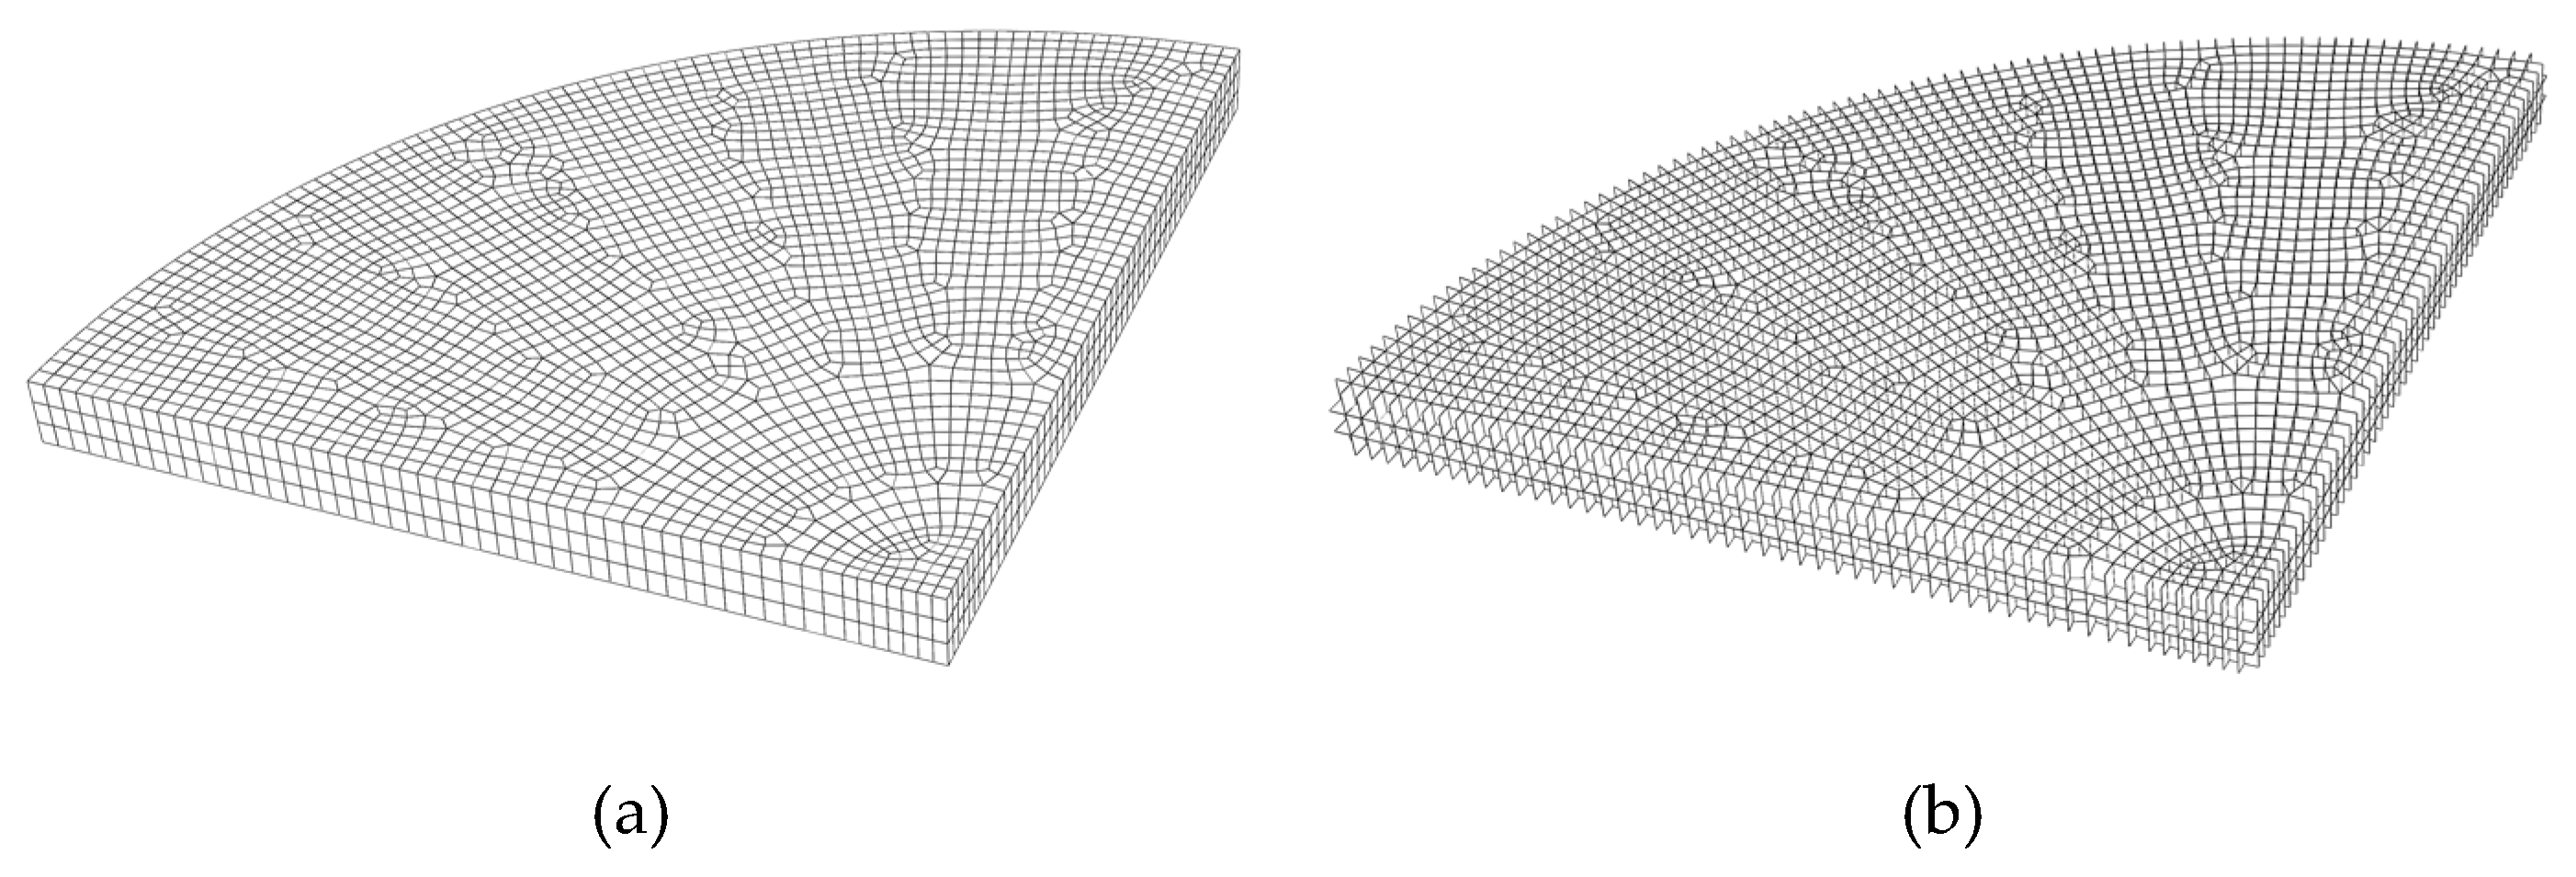
Figure 6.
Acceleration-time curves of impactor.
Figure 7.
Comparison of the numerical test result and laboratory test result. (a) Numerical result; (b) experimental result [46].
Figure 7.
Comparison of the numerical test result and laboratory test result. (a) Numerical result; (b) experimental result [46].

Figure 8.
Comparison of the size of fragments. (a) Numerical result; (b) experimental result [46].
Figure 8.
Comparison of the size of fragments. (a) Numerical result; (b) experimental result [46].
Figure 9.
Velocity–time curves of impactor.

Figure 10.
Failure process of the plate (a) 0.5 ms; (b) 1.0 ms; (c) 2.0 ms; (d) 2.5 ms; (e) 4.0 ms; (f) 5.0 ms.
Figure 10.
Failure process of the plate (a) 0.5 ms; (b) 1.0 ms; (c) 2.0 ms; (d) 2.5 ms; (e) 4.0 ms; (f) 5.0 ms.
Figure 11.
Effect of C on the results (a) C = 0.00; (b) C = 0.01; (c) C = 0.02; (d) C = 0.03; (e) C = 0.04.
Figure 11.
Effect of C on the results (a) C = 0.00; (b) C = 0.01; (c) C = 0.02; (d) C = 0.03; (e) C = 0.04.
Figure 12.
Effect of mesh size on the results. (a) Fine mesh; (b) coarse mesh.

Figure 13.
Effect of initial velocity on the results (a) v0 = 0.50 m/s; (b) v0 = 1.00 m/s; (c) v0 = 1.98 m/s; (d) v0 = 3.00 m/s; (e) v0 = 4.00 m/s.
Figure 13.
Effect of initial velocity on the results (a) v0 = 0.50 m/s; (b) v0 = 1.00 m/s; (c) v0 = 1.98 m/s; (d) v0 = 3.00 m/s; (e) v0 = 4.00 m/s.


Table 1.
Relationship between the mesh size of impactor and the kinetic energy
| Mesh Size of Impactor (mm) | Kinetic Energy (mJ) | Error (%) |
|---|---|---|
| 1 | 13382.3 | 0.19 |
| 2 | 13277.1 | 0.97 |
| 3 | 12922.2 | 3.62 |
| 4 | 12864.9 | 4.05 |
Table 2.
Constants of the linear elastic model for glass and polypropylene
| Material | Density (kg/m3) | Young’s Modulus (GPa) | Poisson’s Ratio |
|---|---|---|---|
| Soda-lime glass | 2530 | 73 | 0.3 |
| Polypropylene | 1000 | 2 | 0.3 |
© 2020 by the authors. Licensee MDPI, Basel, Switzerland. This article is an open access article distributed under the terms and conditions of the Creative Commons Attribution (CC BY) license (http://creativecommons.org/licenses/by/4.0/).
Share and Cite
MDPI and ACS Style
Li, D.; Wei, D. Rate-Dependent Cohesive Zone Model for Fracture Simulation of Soda-Lime Glass Plate. Materials 2020, 13, 749. https://doi.org/10.3390/ma13030749
AMA Style
Li D, Wei D. Rate-Dependent Cohesive Zone Model for Fracture Simulation of Soda-Lime Glass Plate. Materials. 2020; 13(3):749. https://doi.org/10.3390/ma13030749
Chicago/Turabian StyleLi, Dong, and Demin Wei. 2020. "Rate-Dependent Cohesive Zone Model for Fracture Simulation of Soda-Lime Glass Plate" Materials 13, no. 3: 749. https://doi.org/10.3390/ma13030749
Note that from the first issue of 2016, this journal uses article numbers instead of page numbers. See further details here.