Role of Hydrogen-Charging on Nucleation and Growth of Ductile Damage in Austenitic Stainless Steels

 ,
, 
Abstract
:1. Introduction
2. Materials And Methods
2.1. Materials
2.2. Methods
3. Results
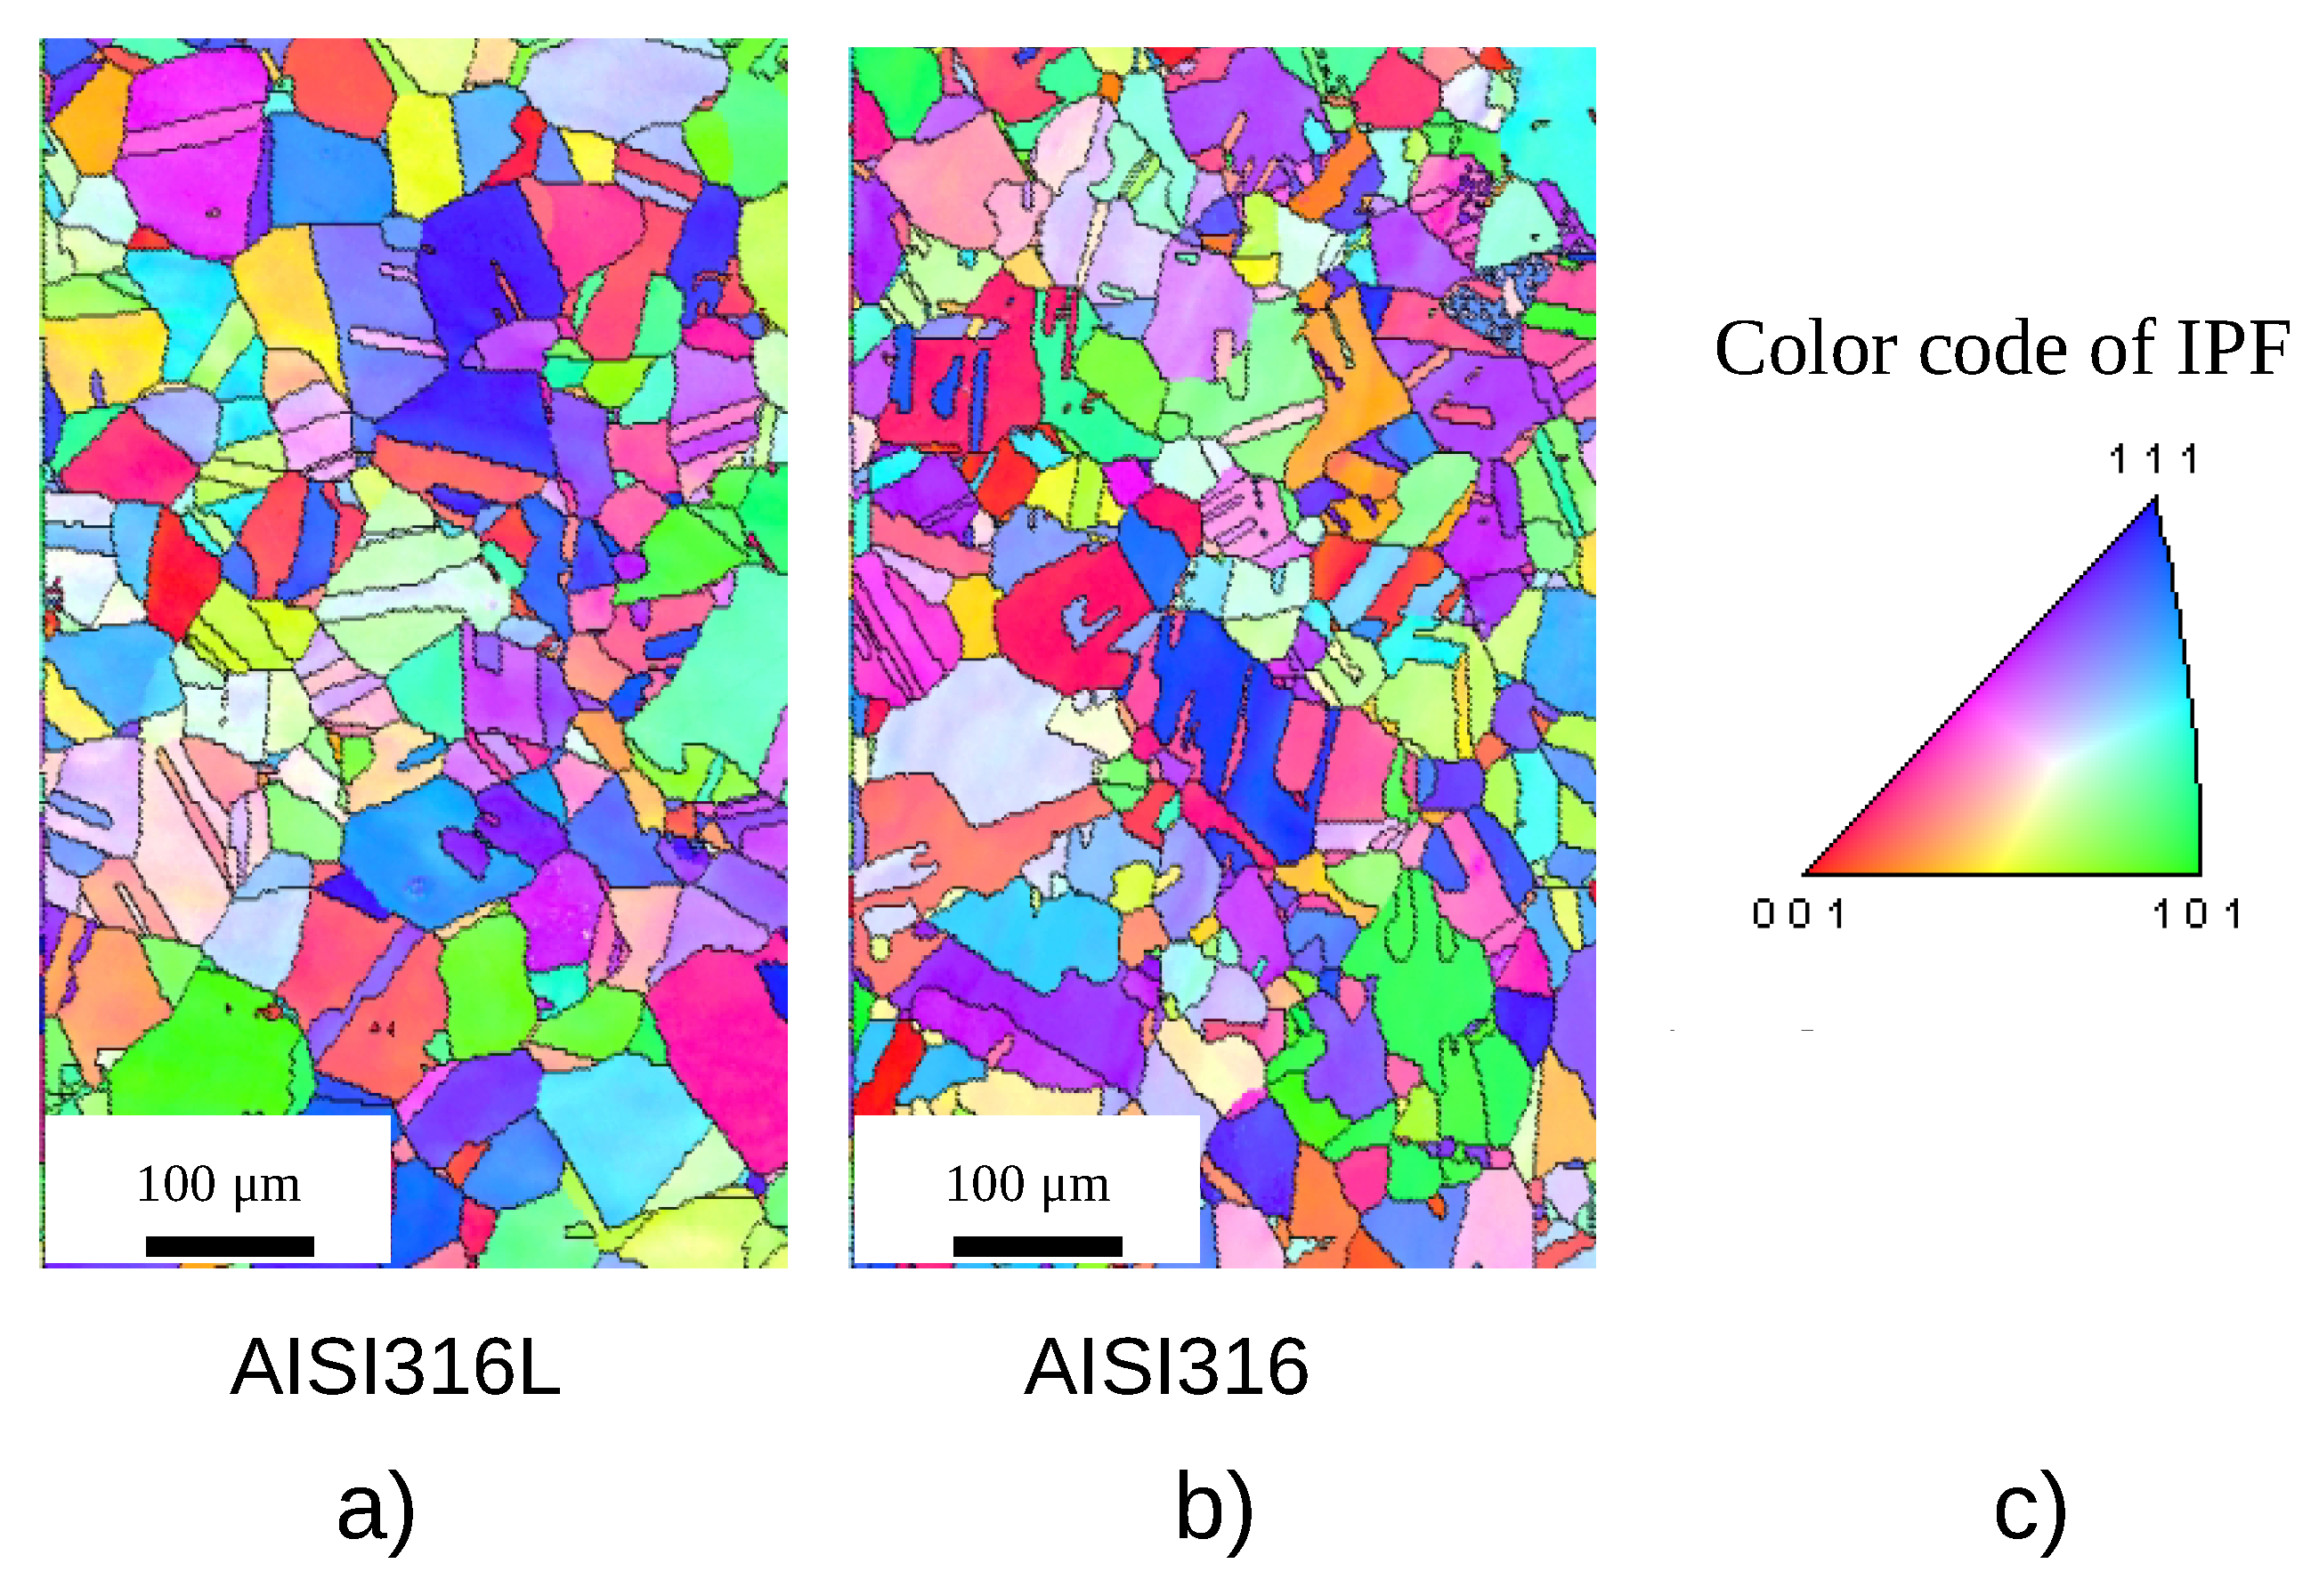
3.1. EBSD
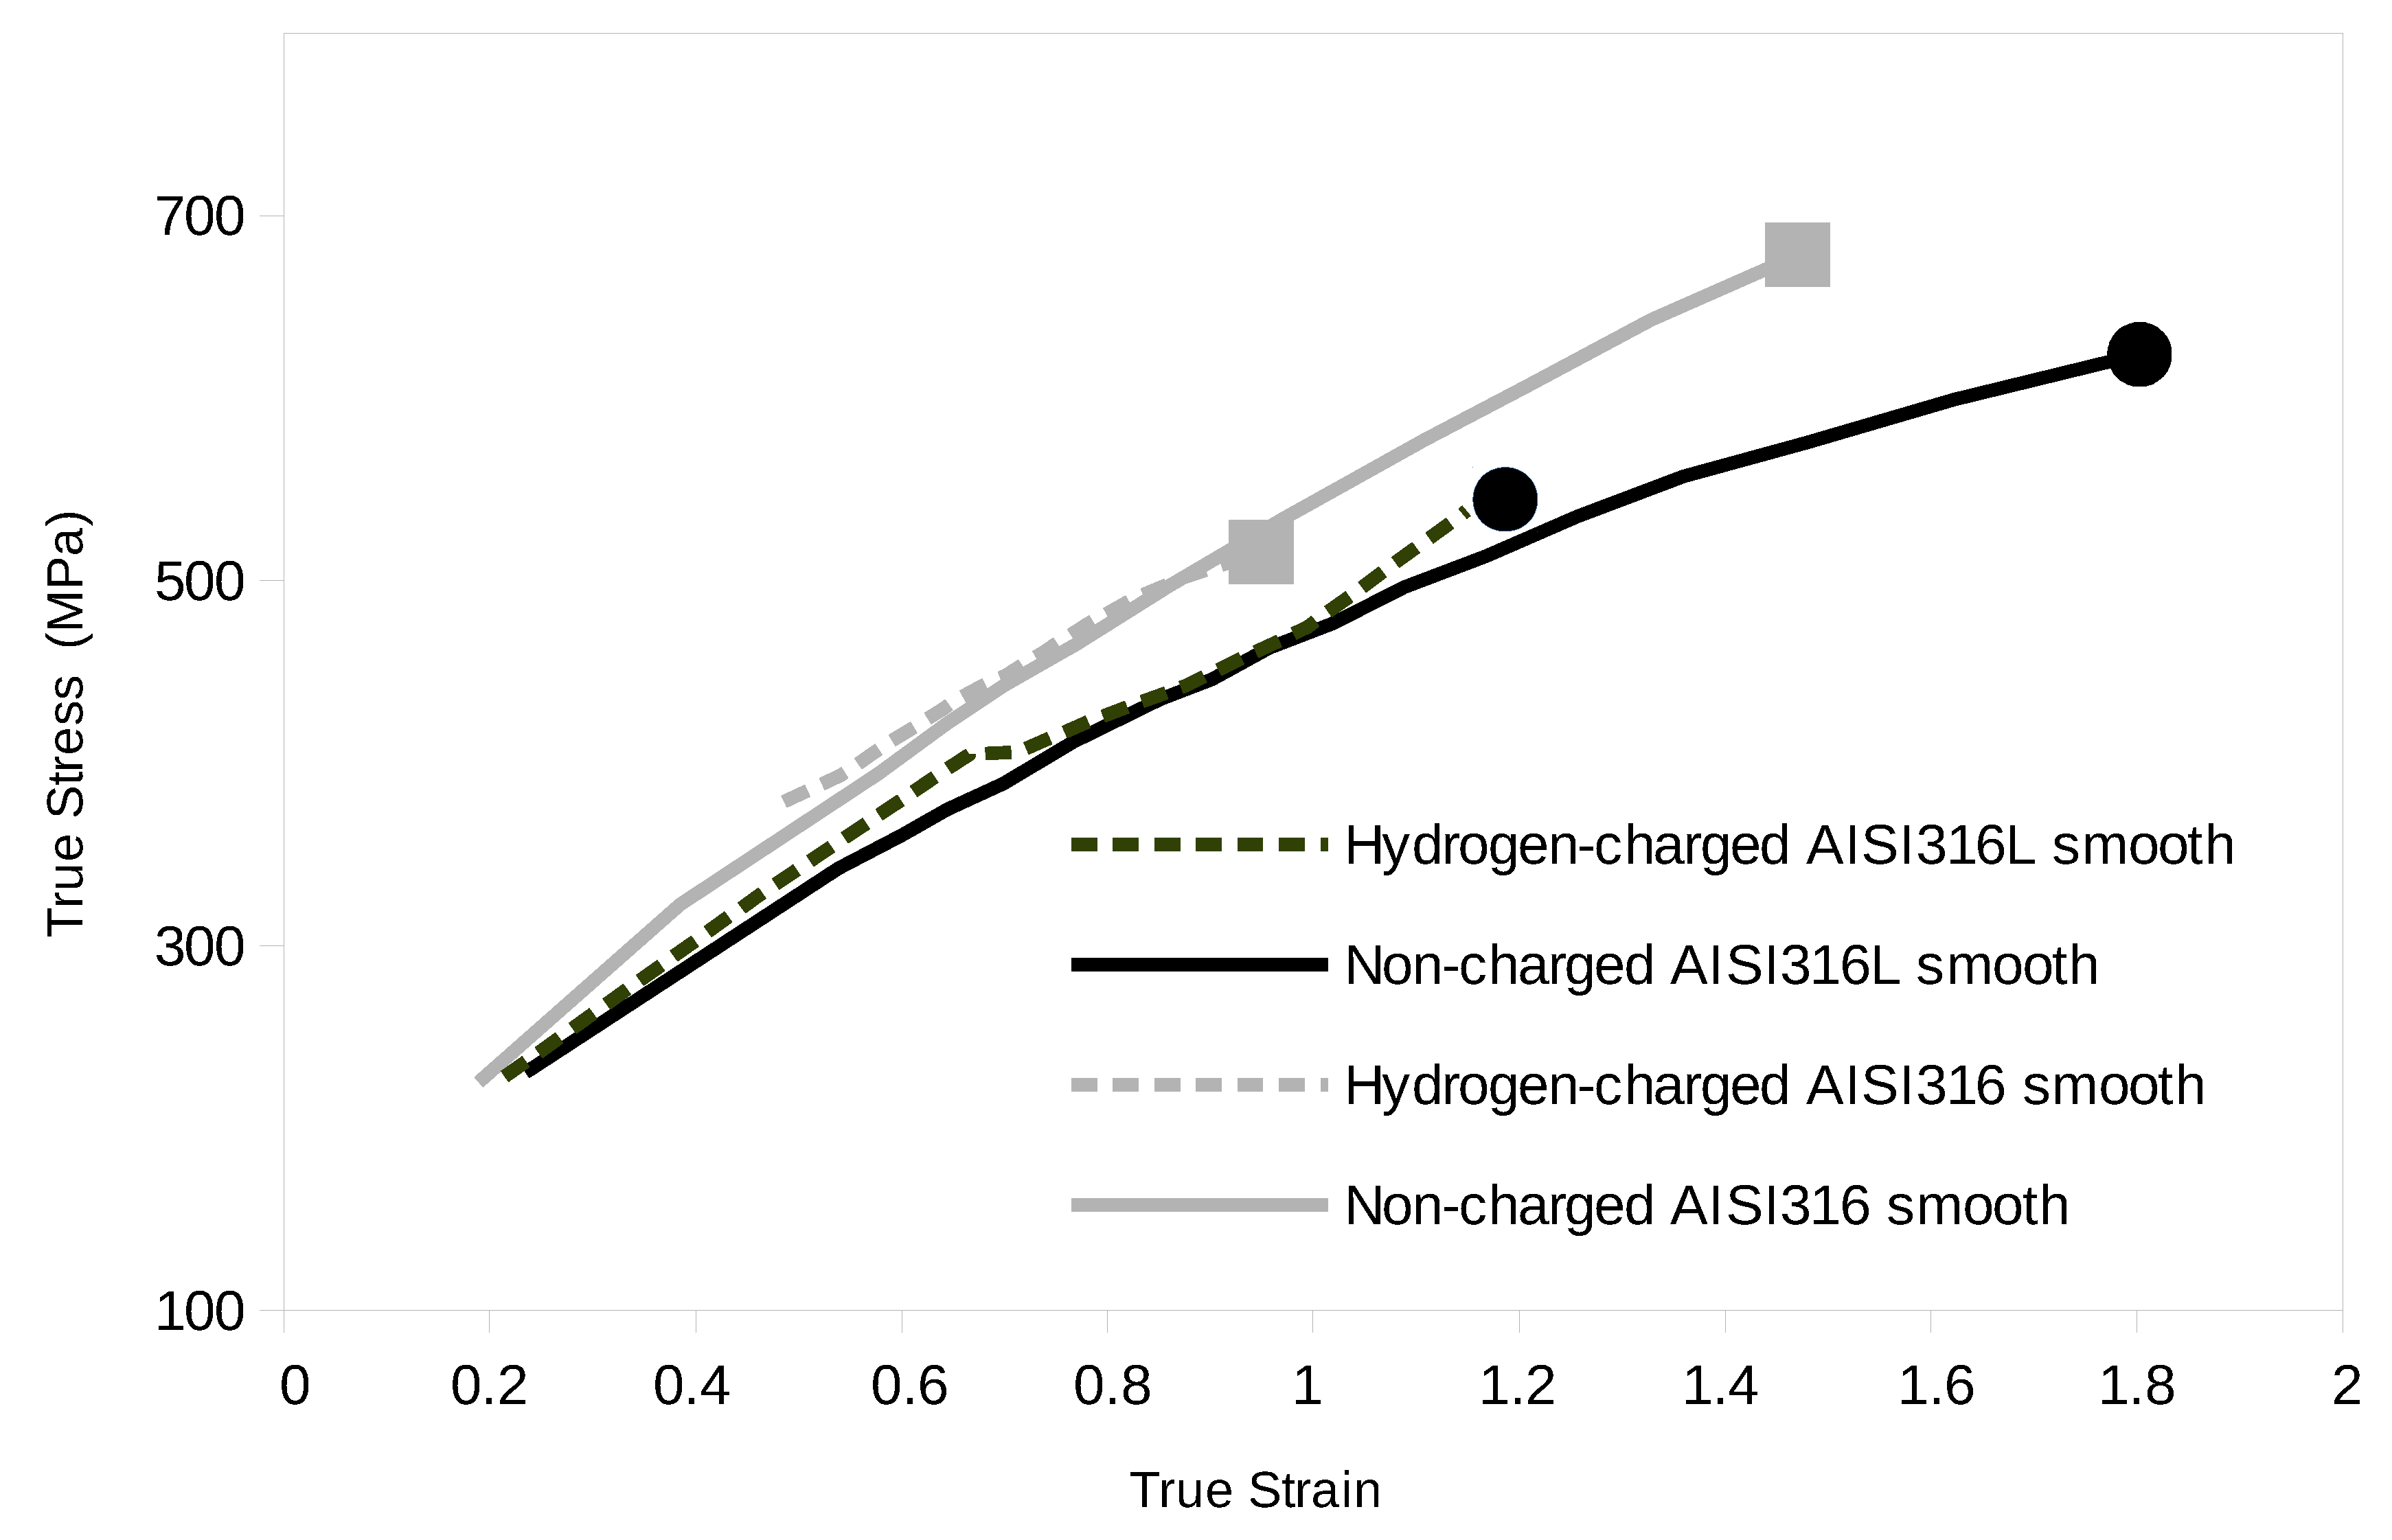
3.2. Hardening Curves from In Situ X-Ray Computed Tomography
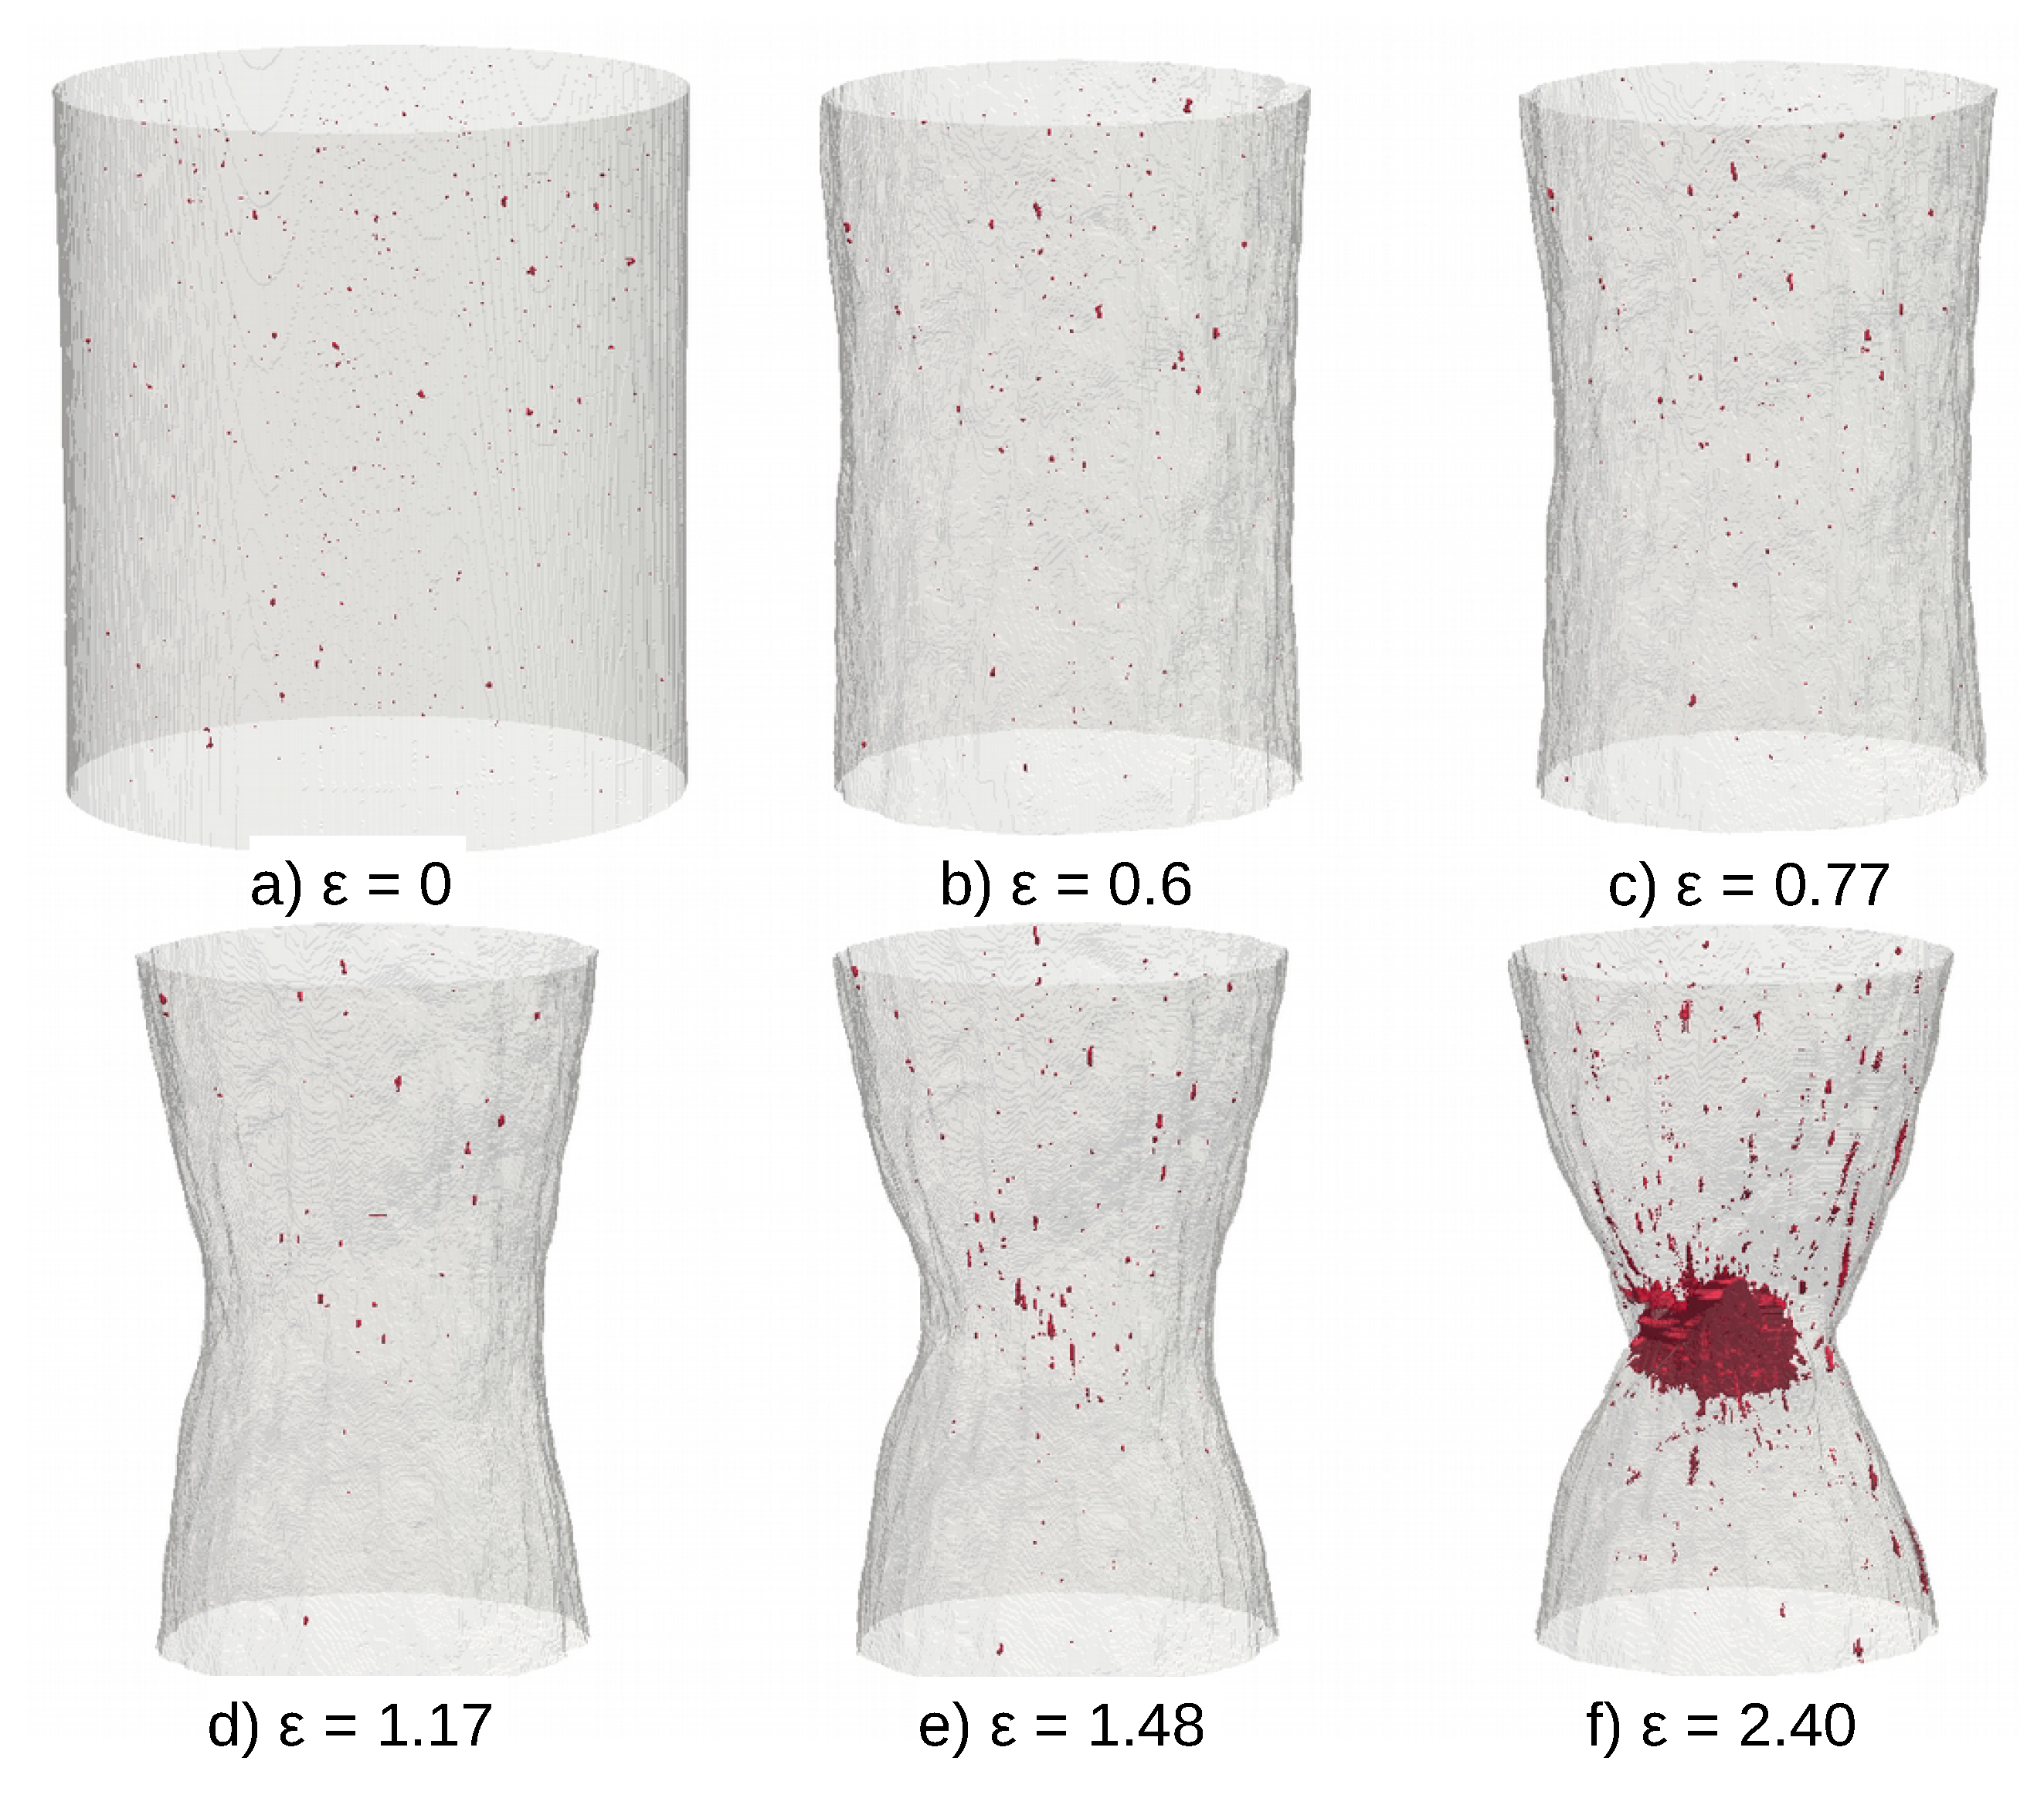
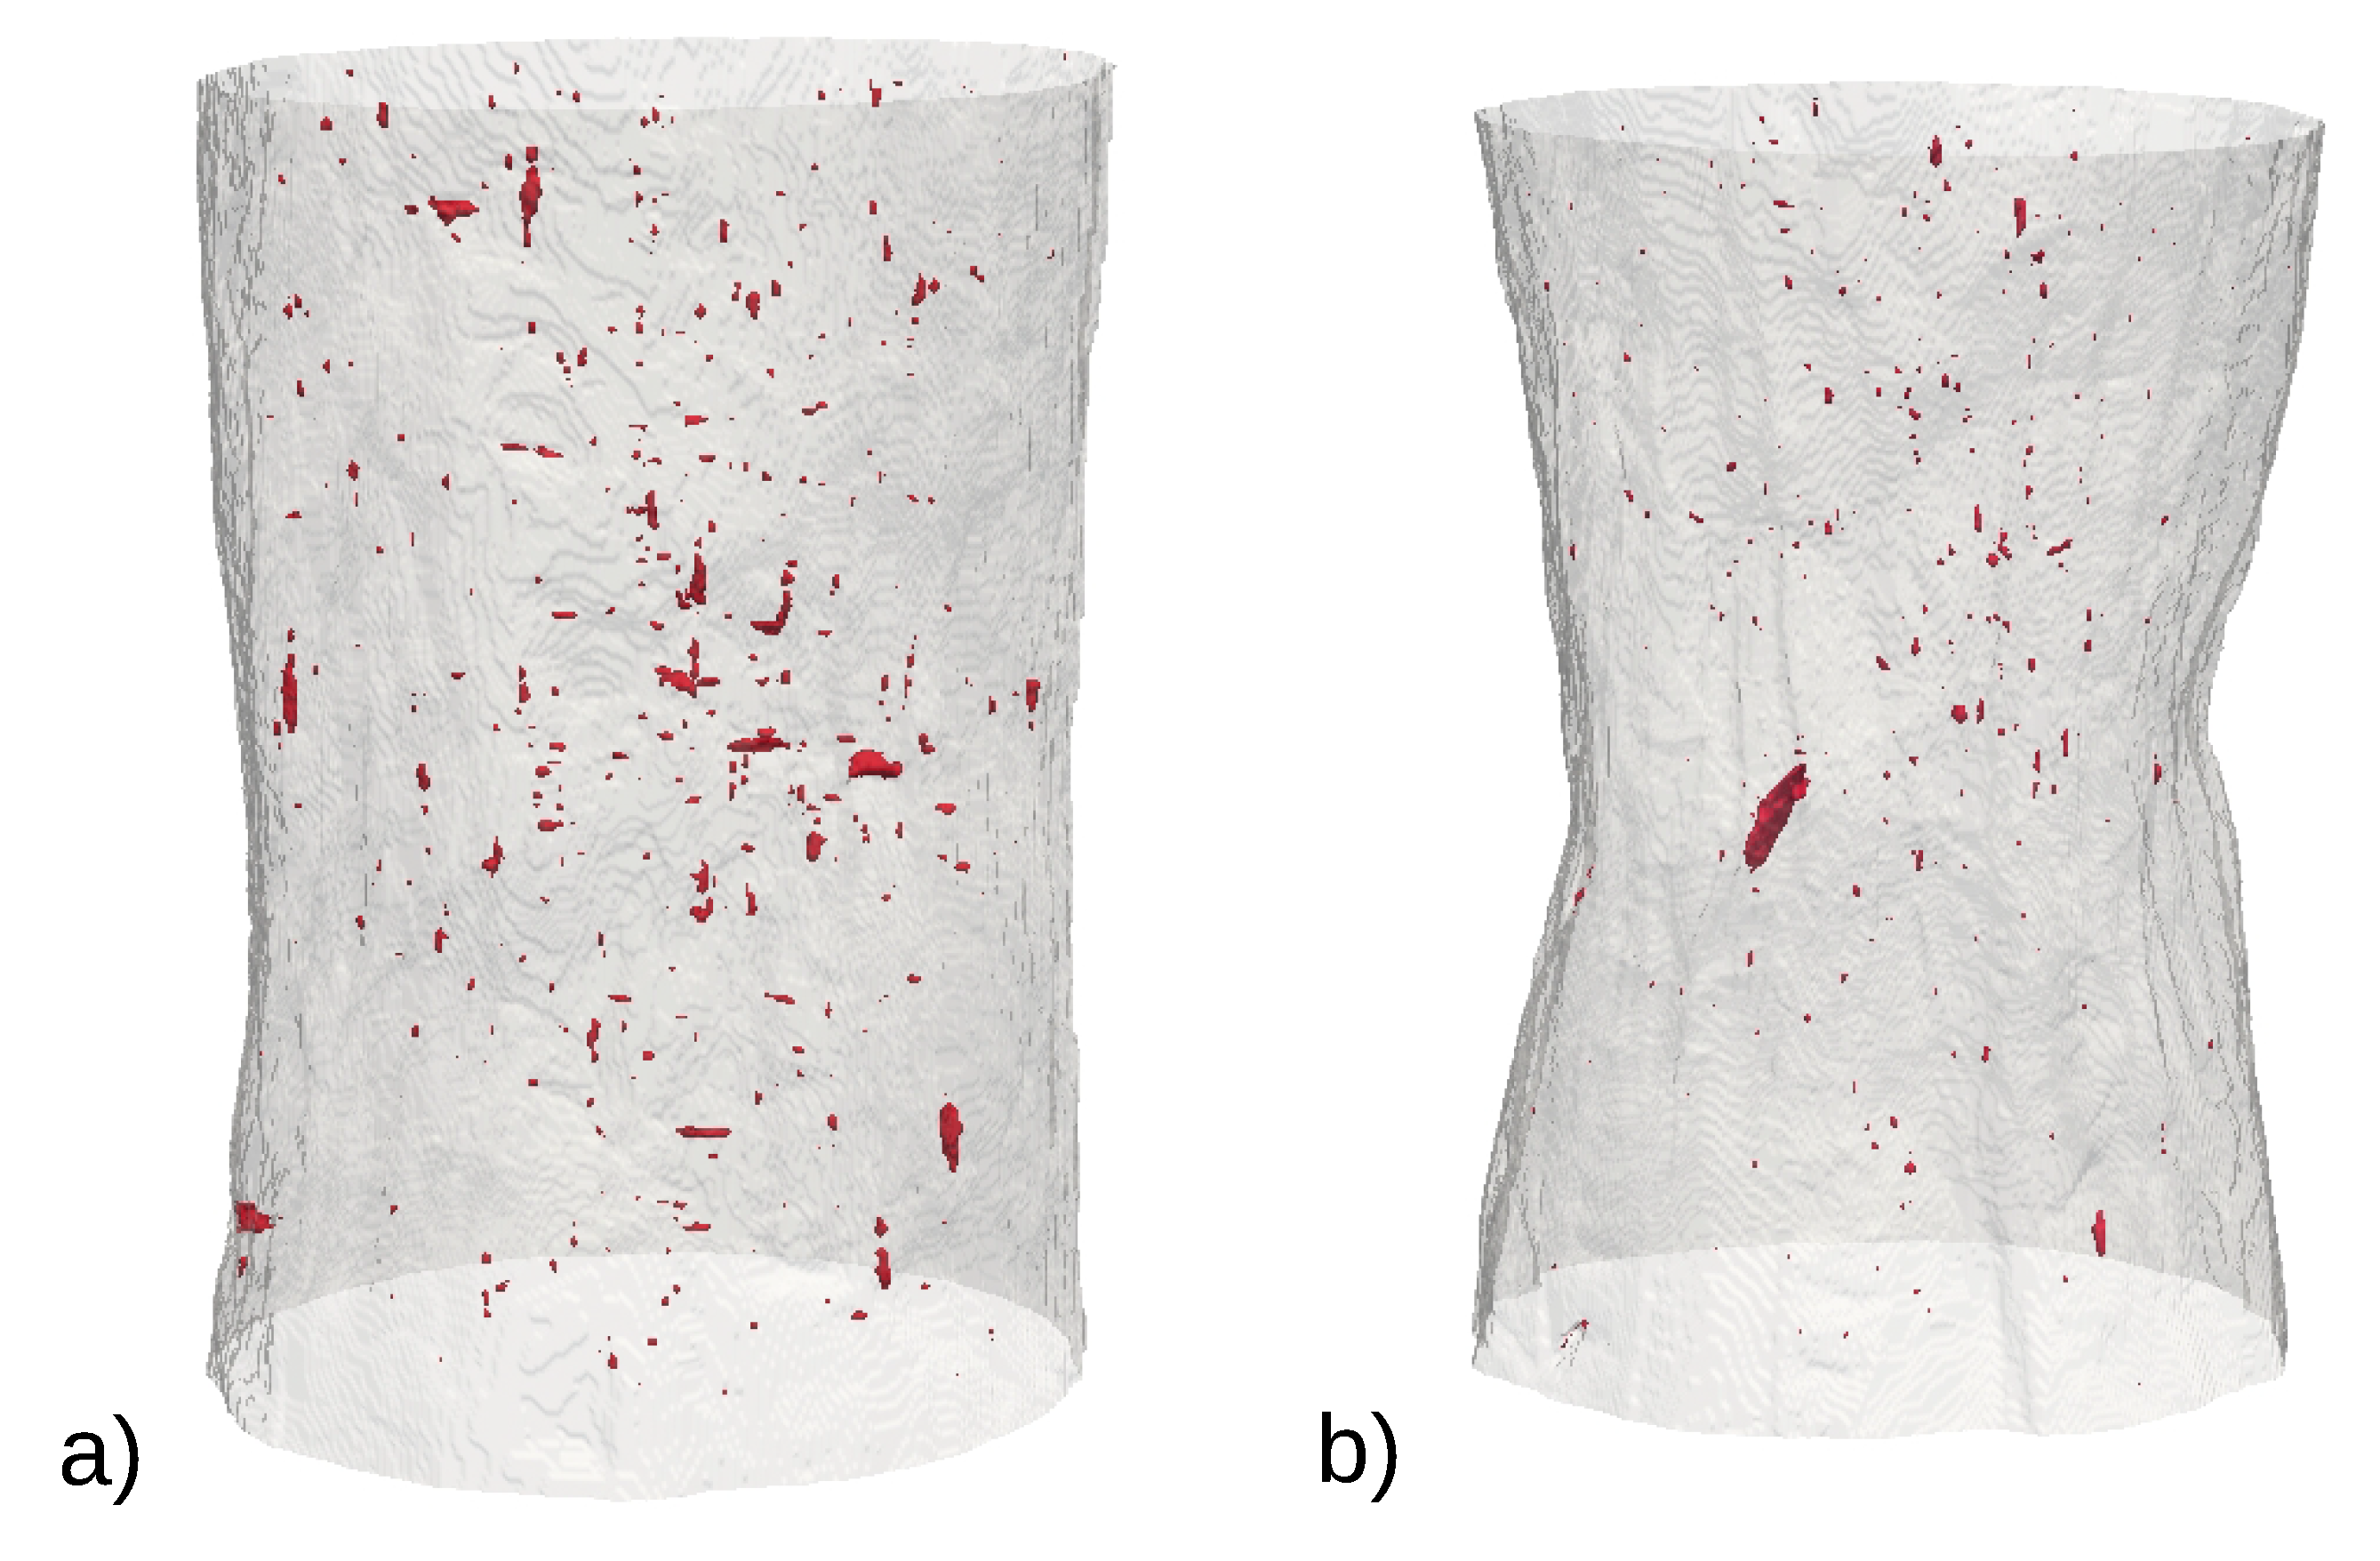
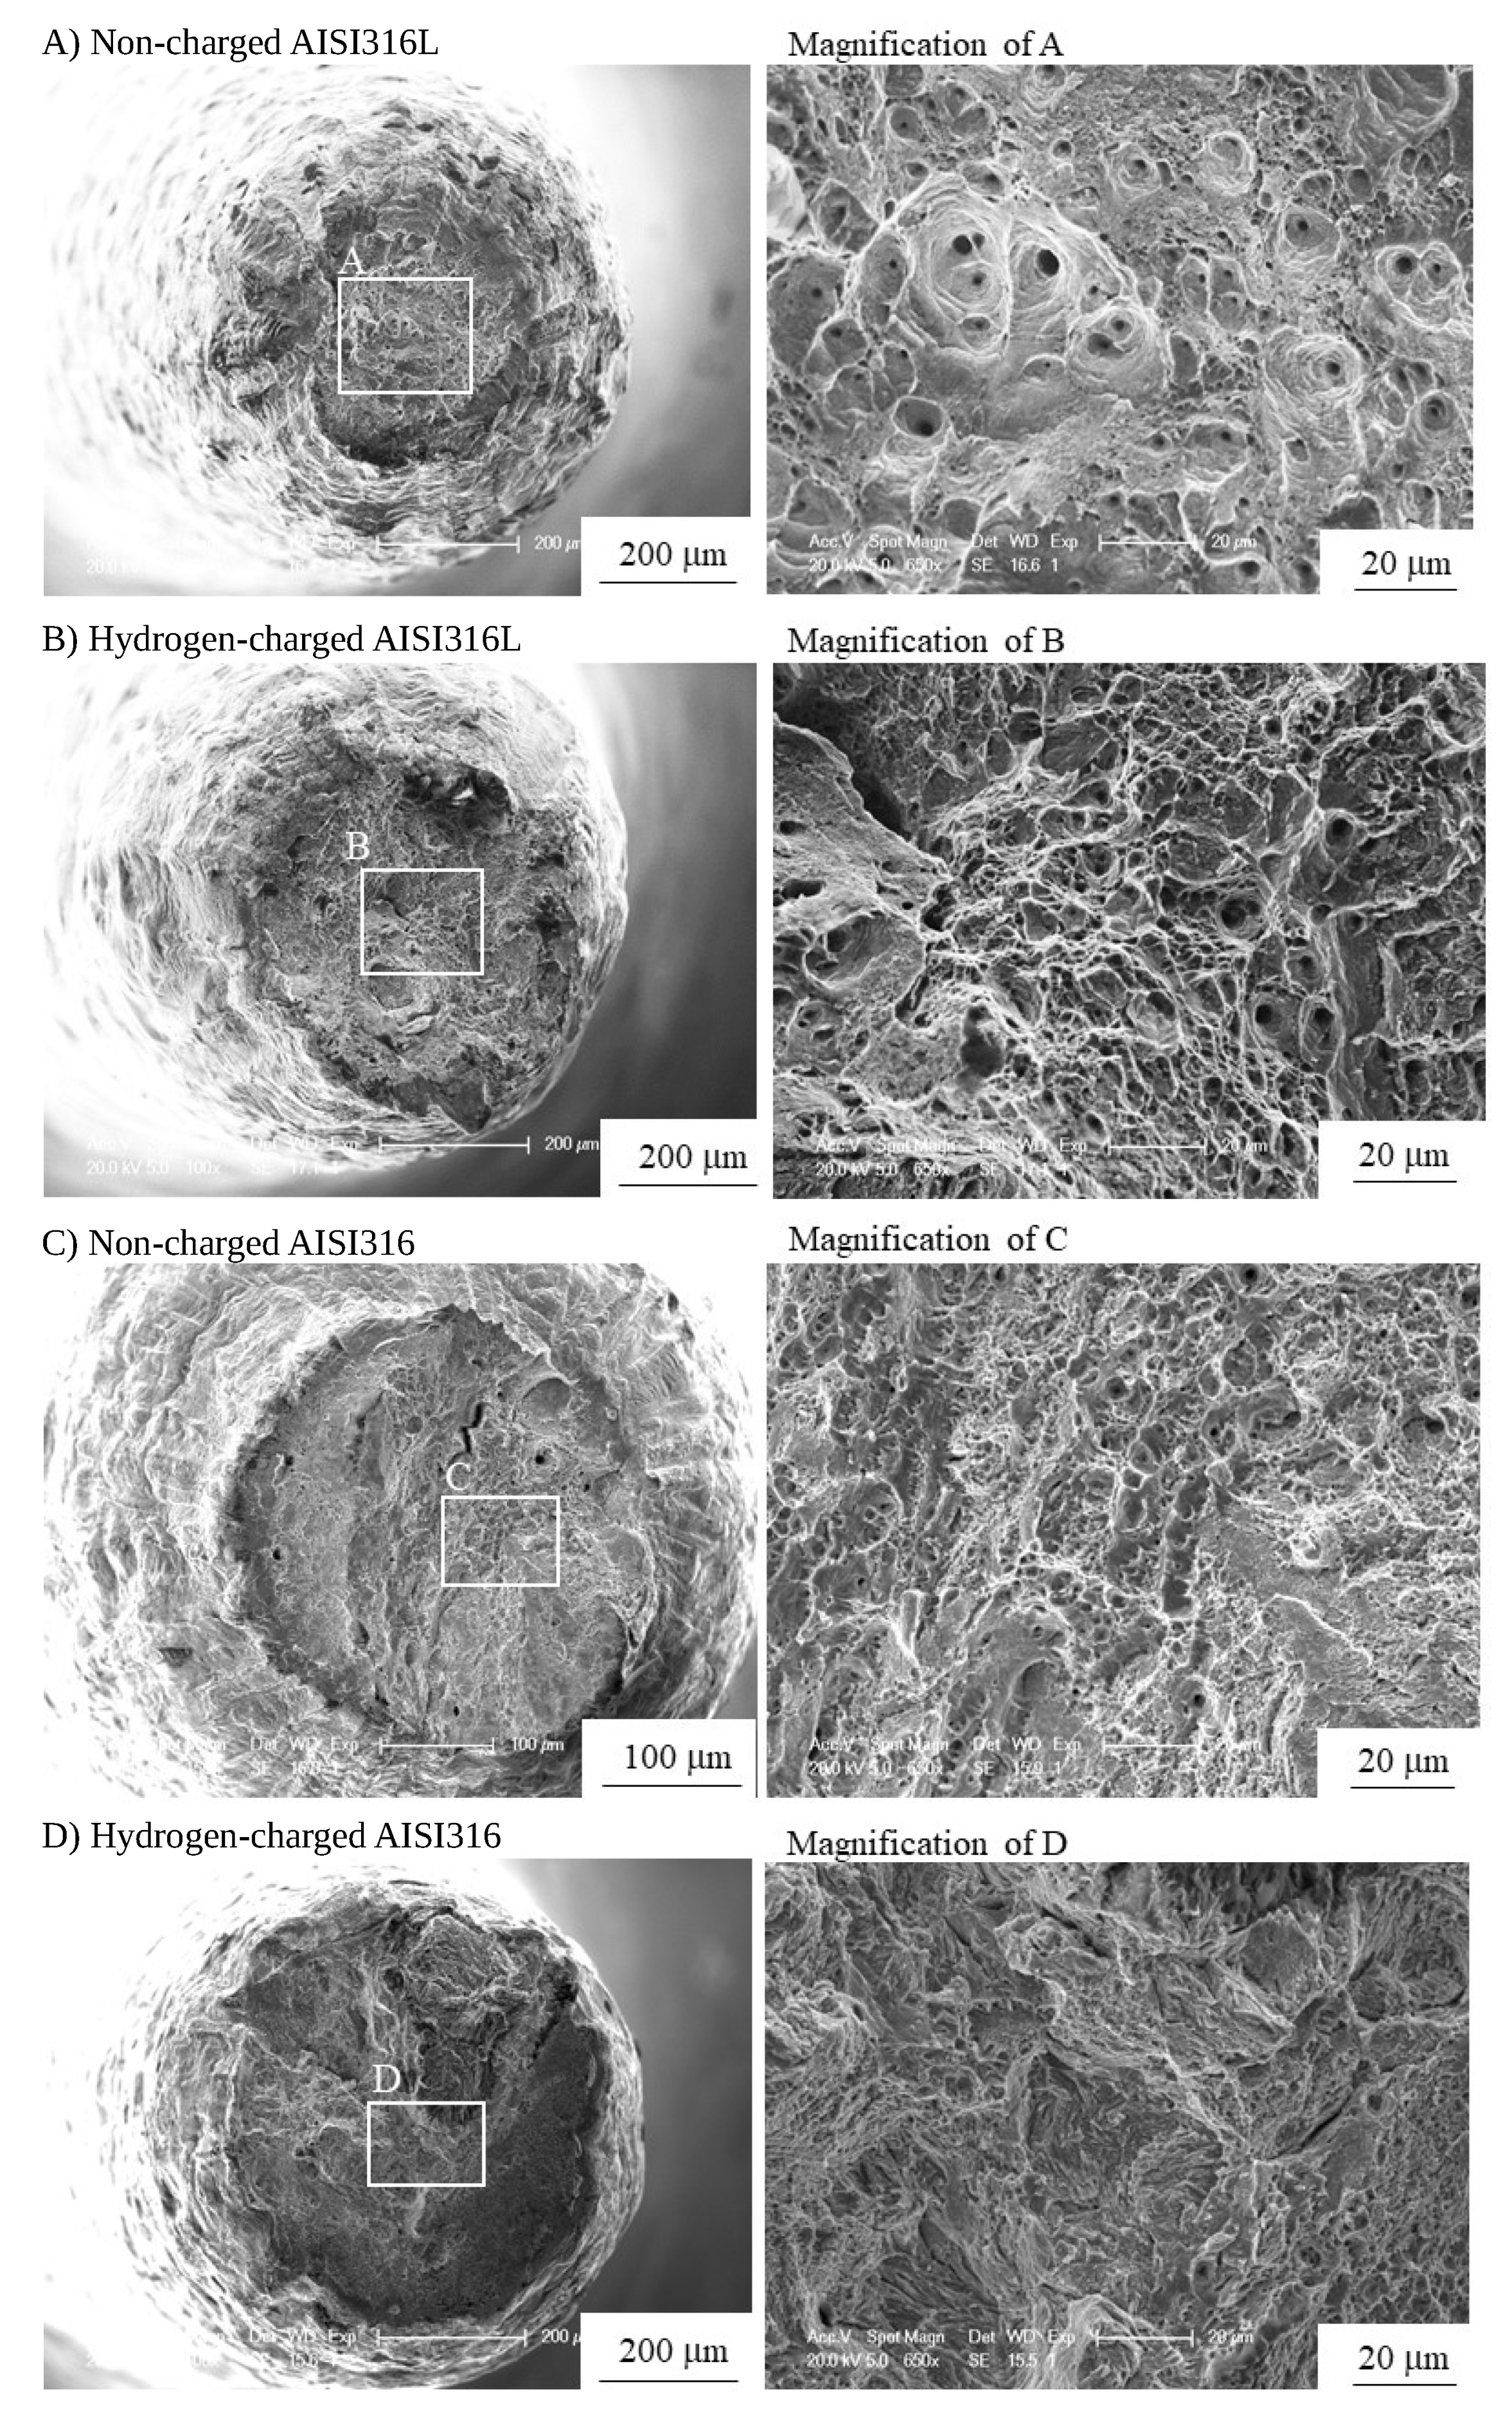
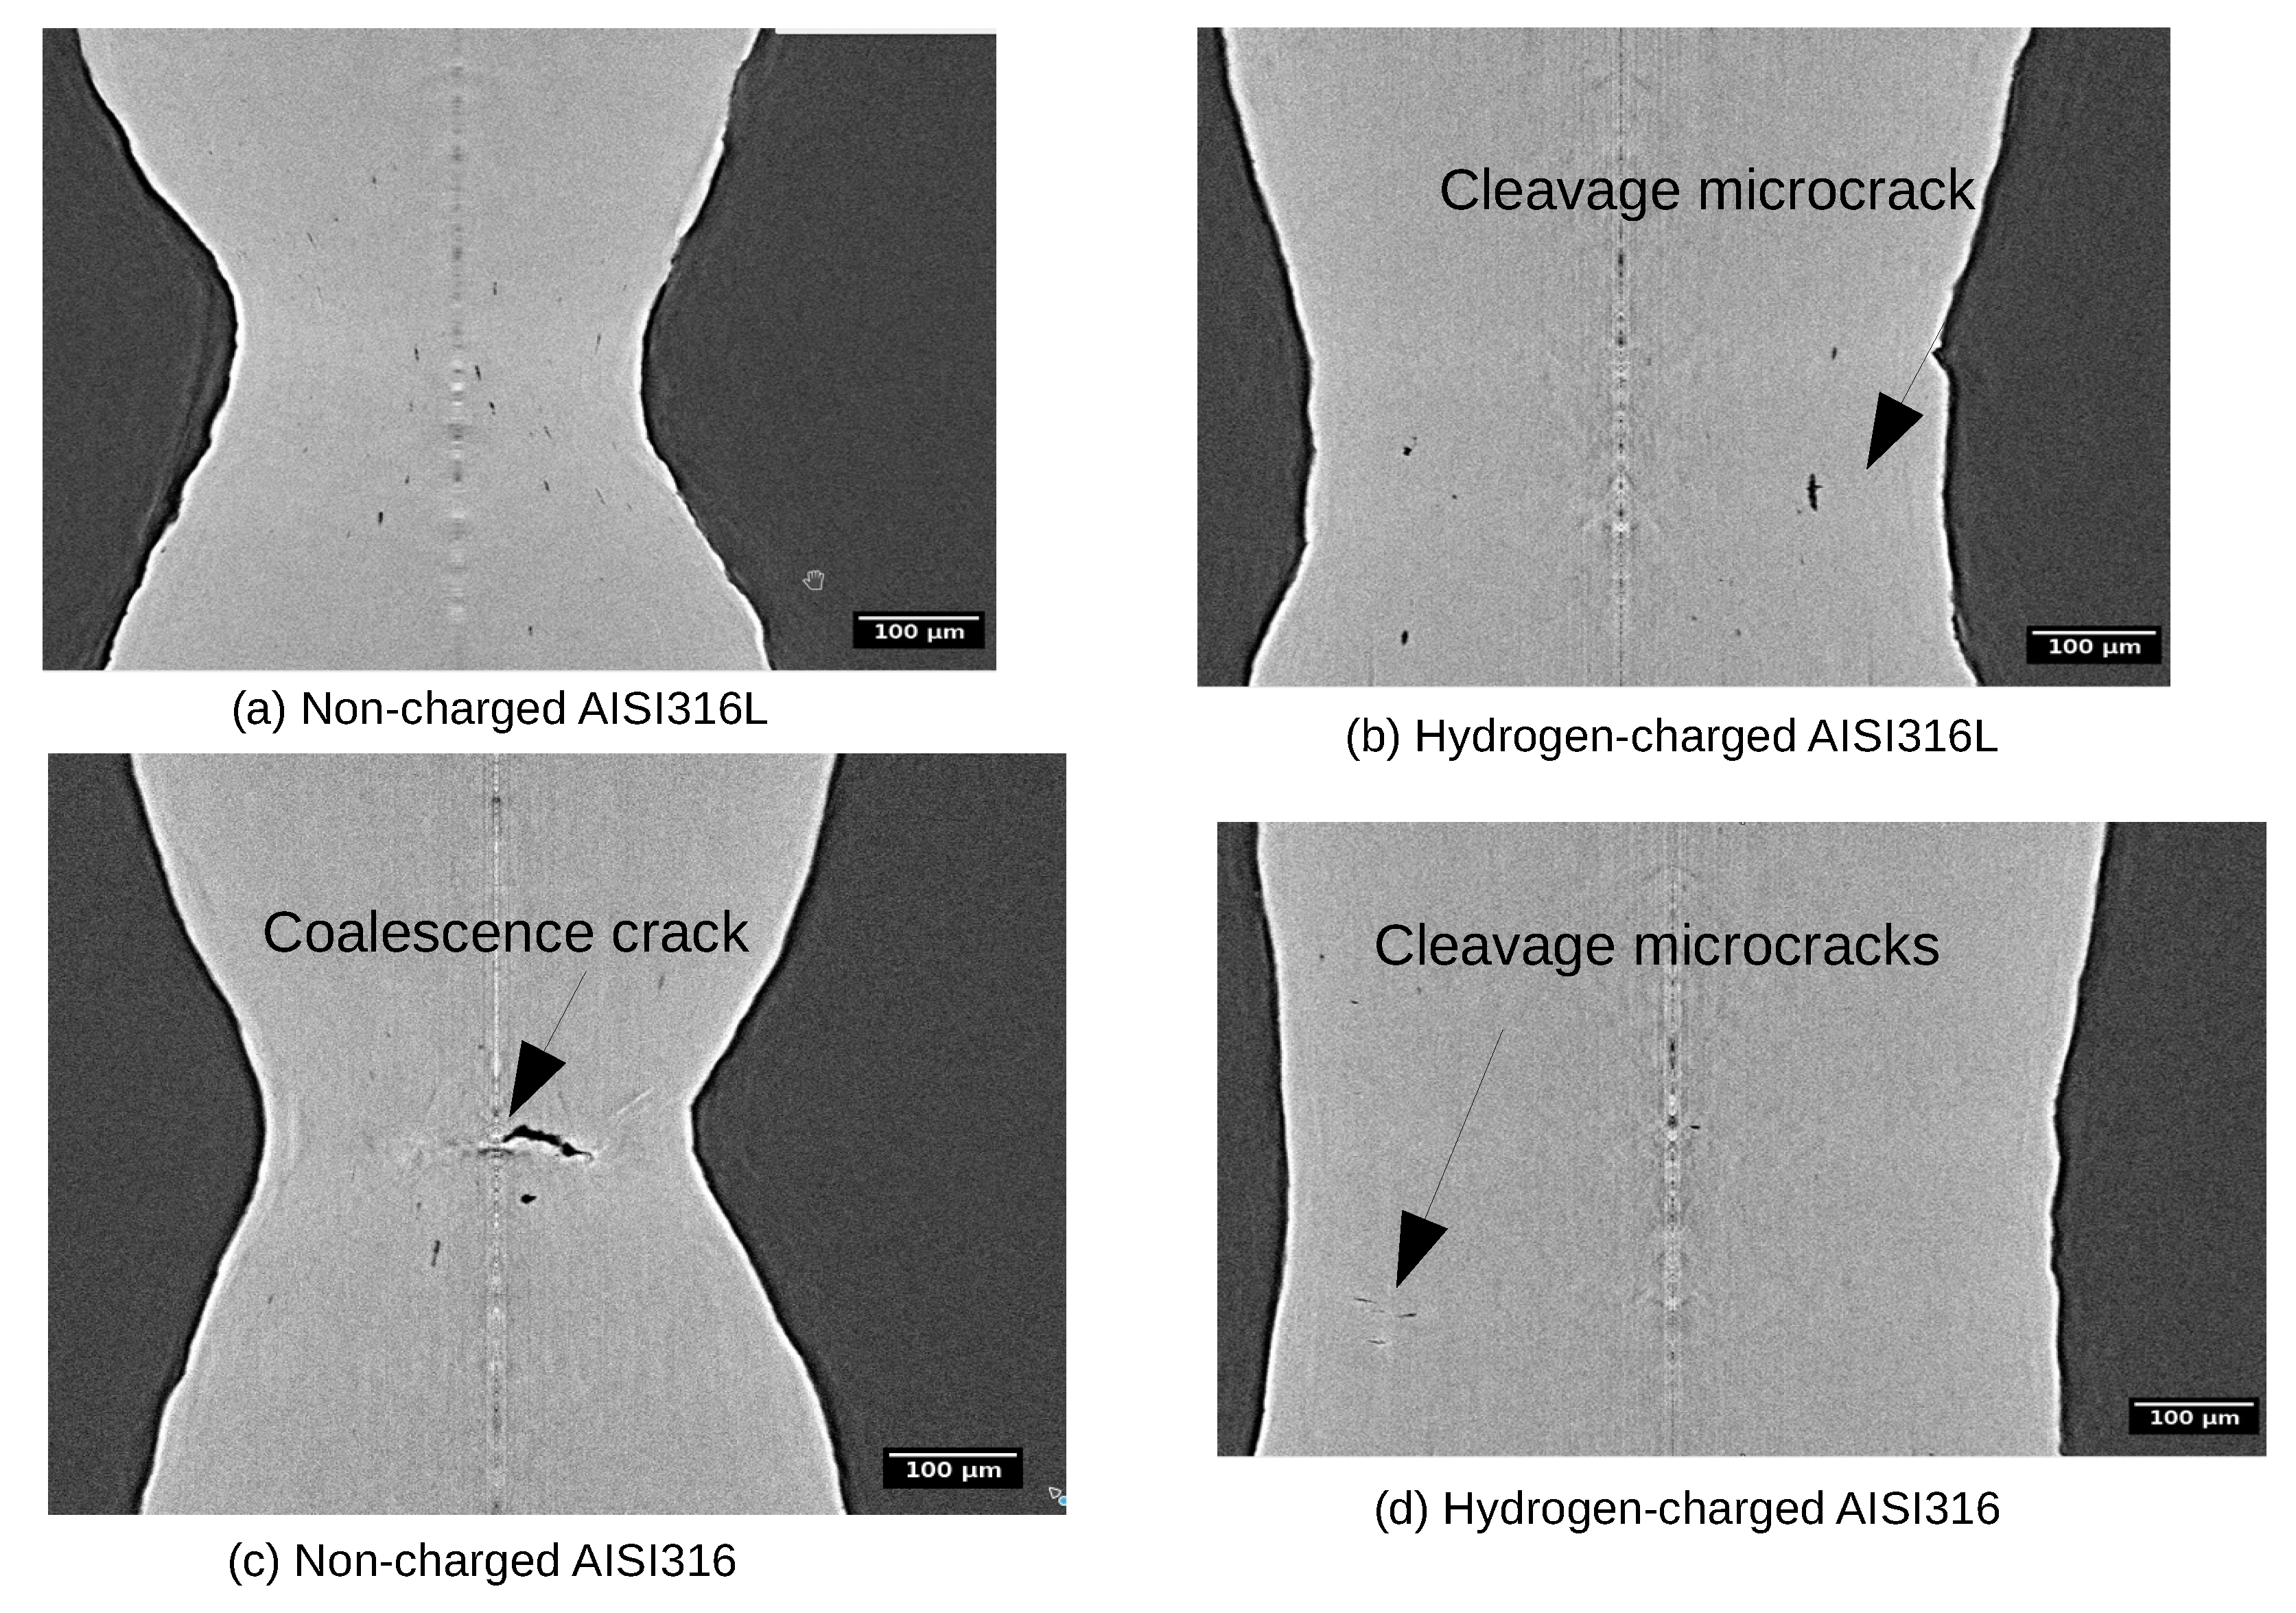
3.3. Qualitative Damage Evolution
3.4. Quantitative Damage Evolution
Void Nucleation
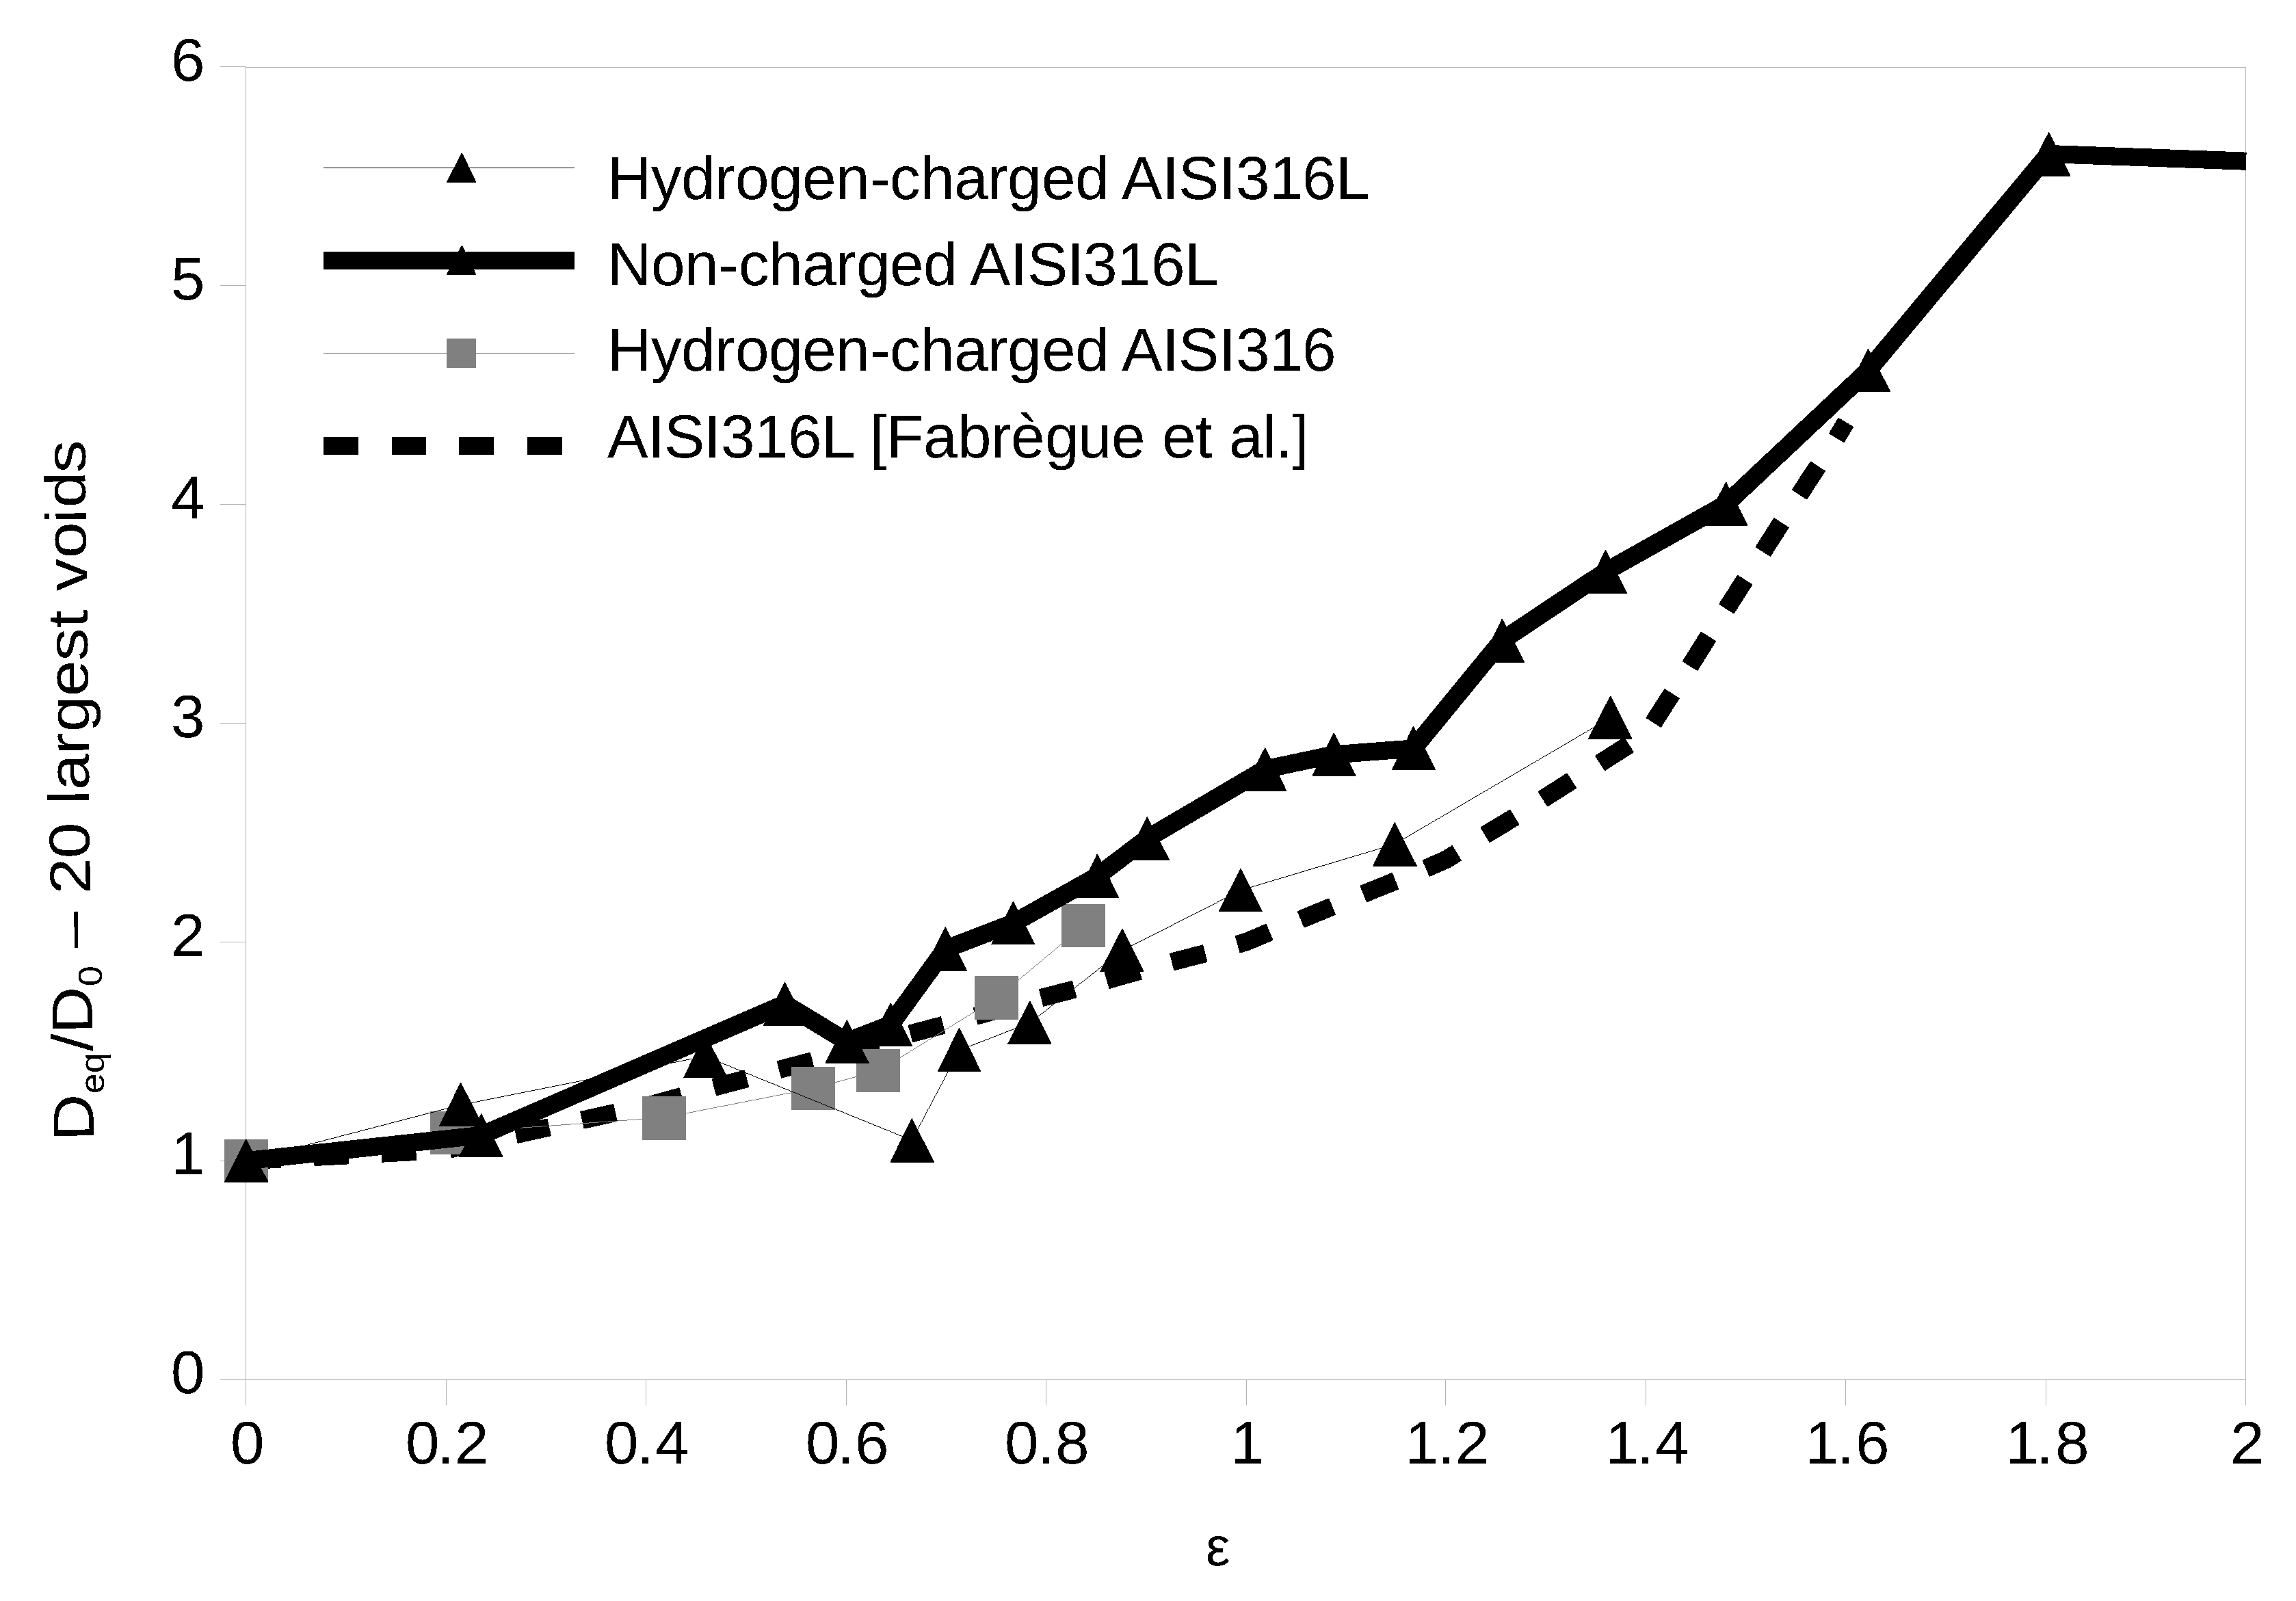
3.5. Void Growth
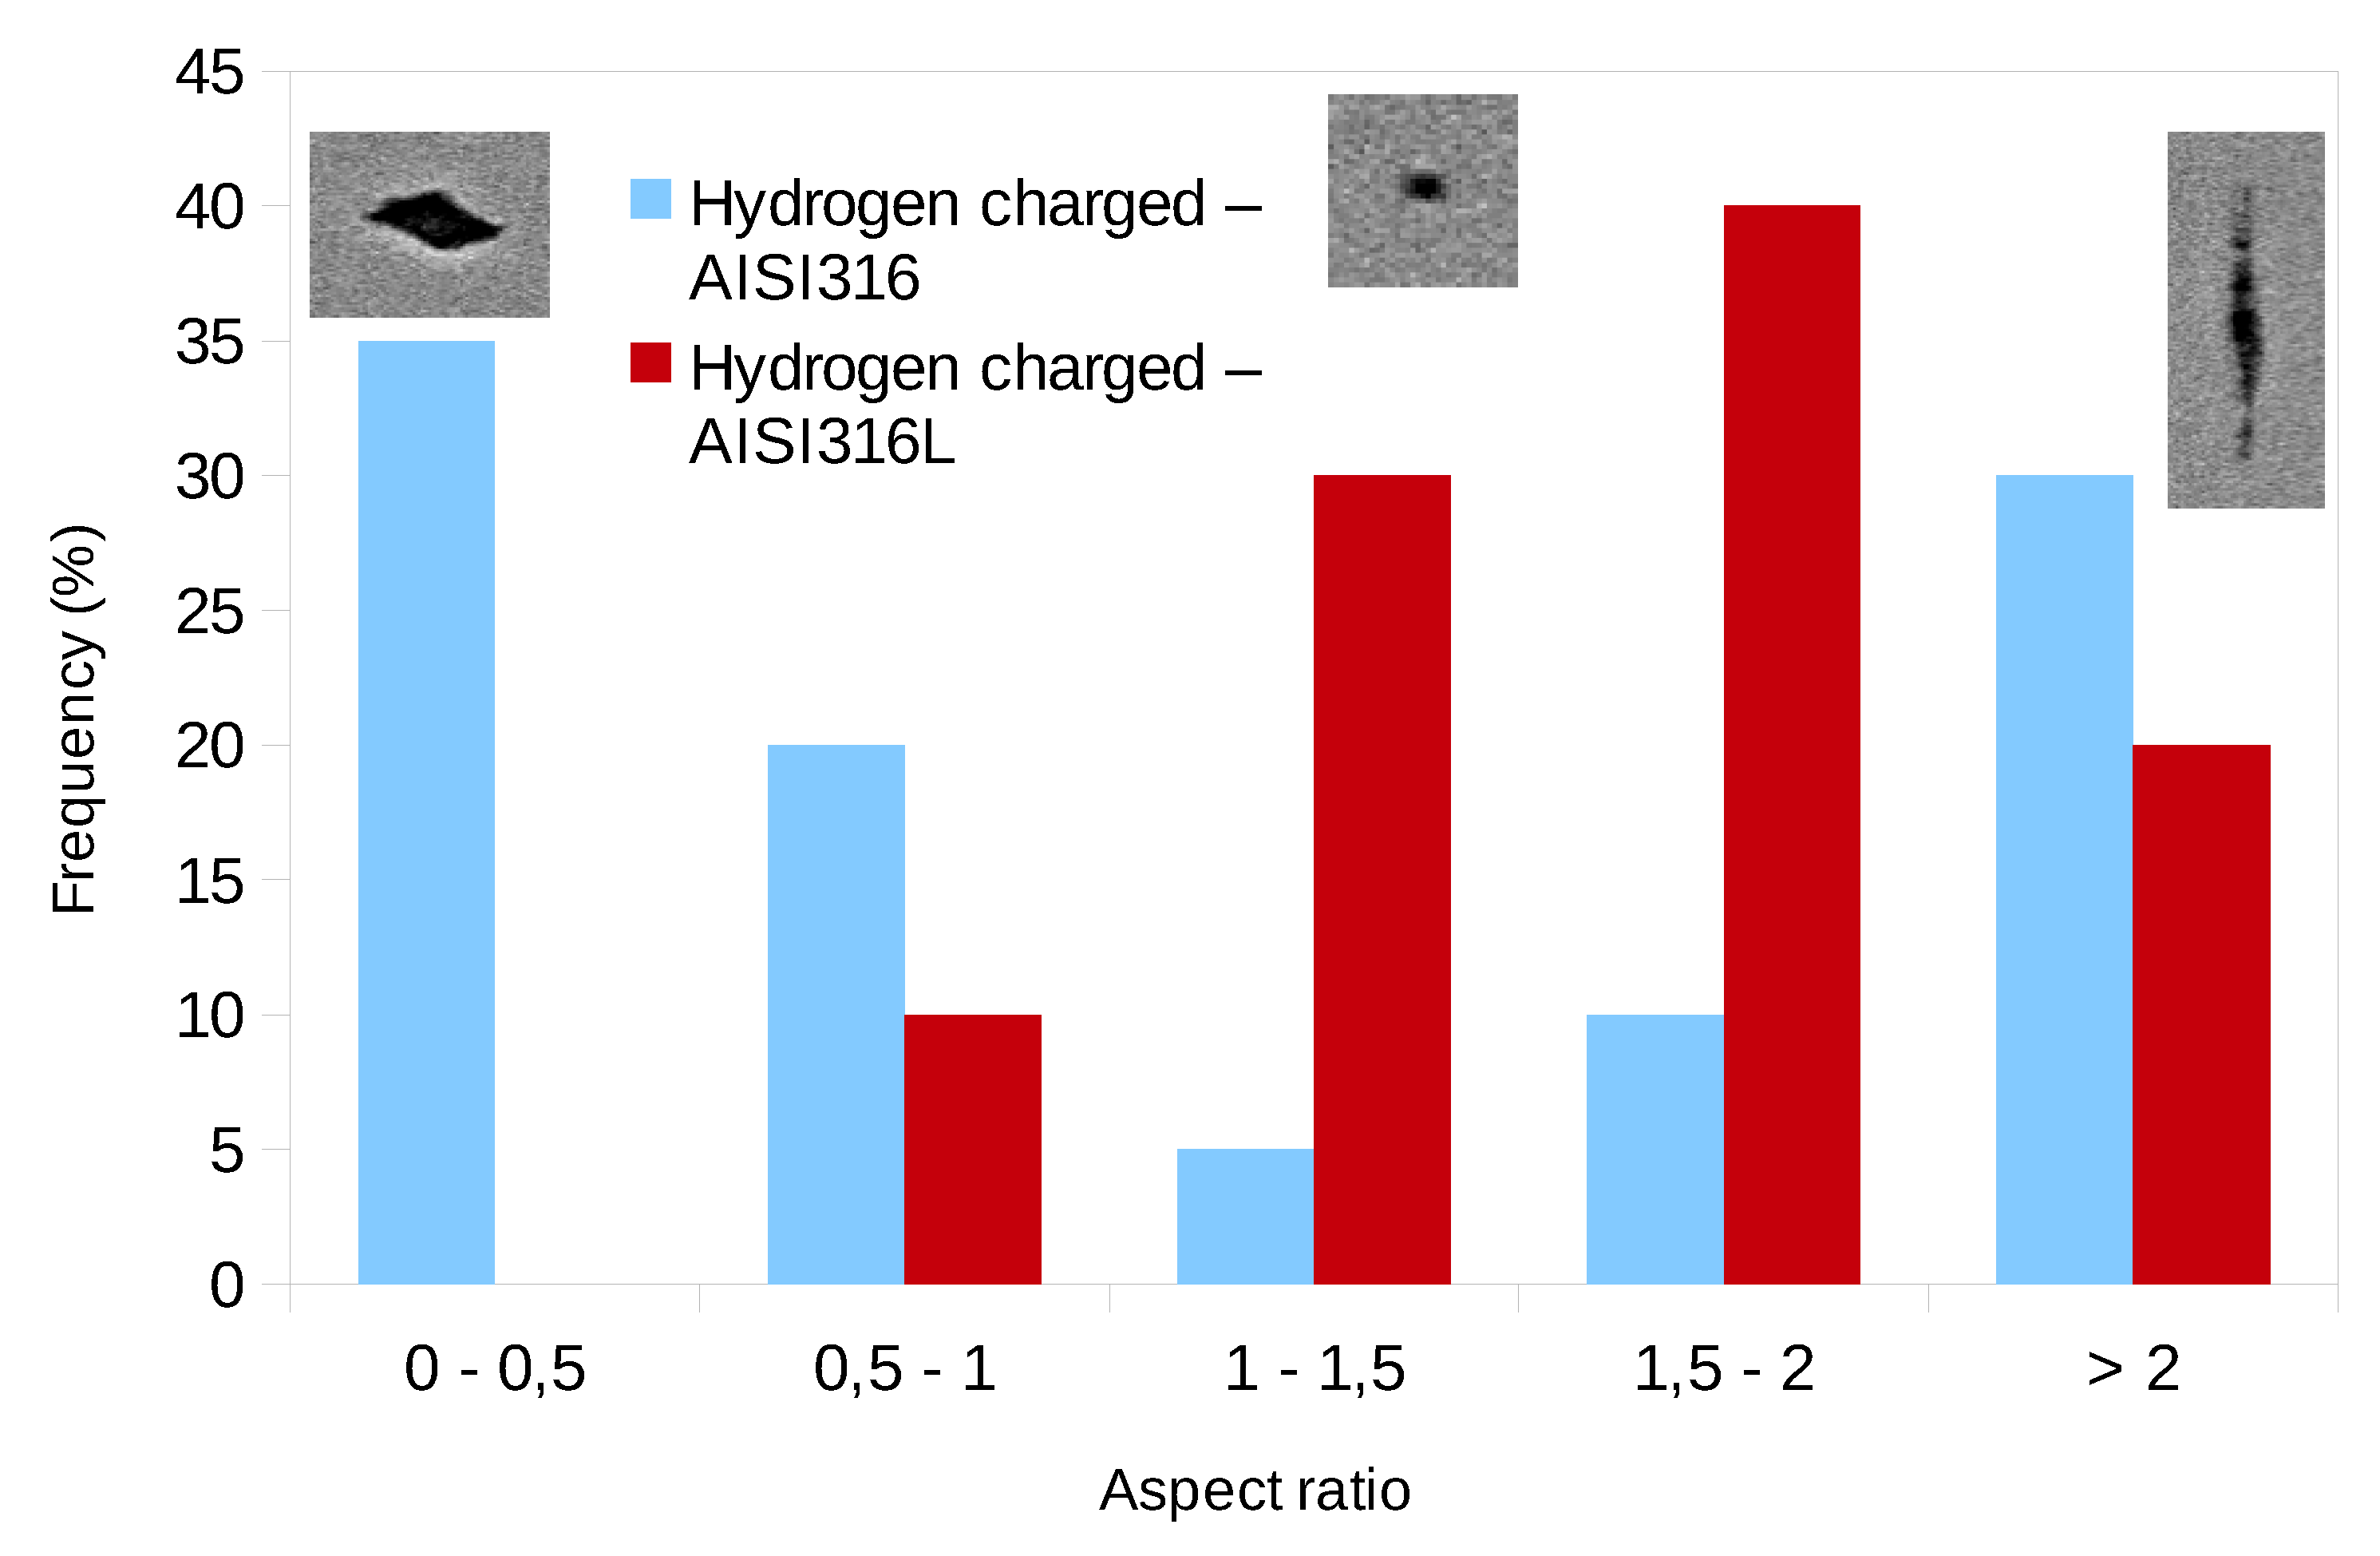
3.6. Aspect Ratio of the Cavities
4. Discussion
5. Conclusions
- The ductility is reduced by Hydrogen charging, in a more important way for the AISI316 sample.
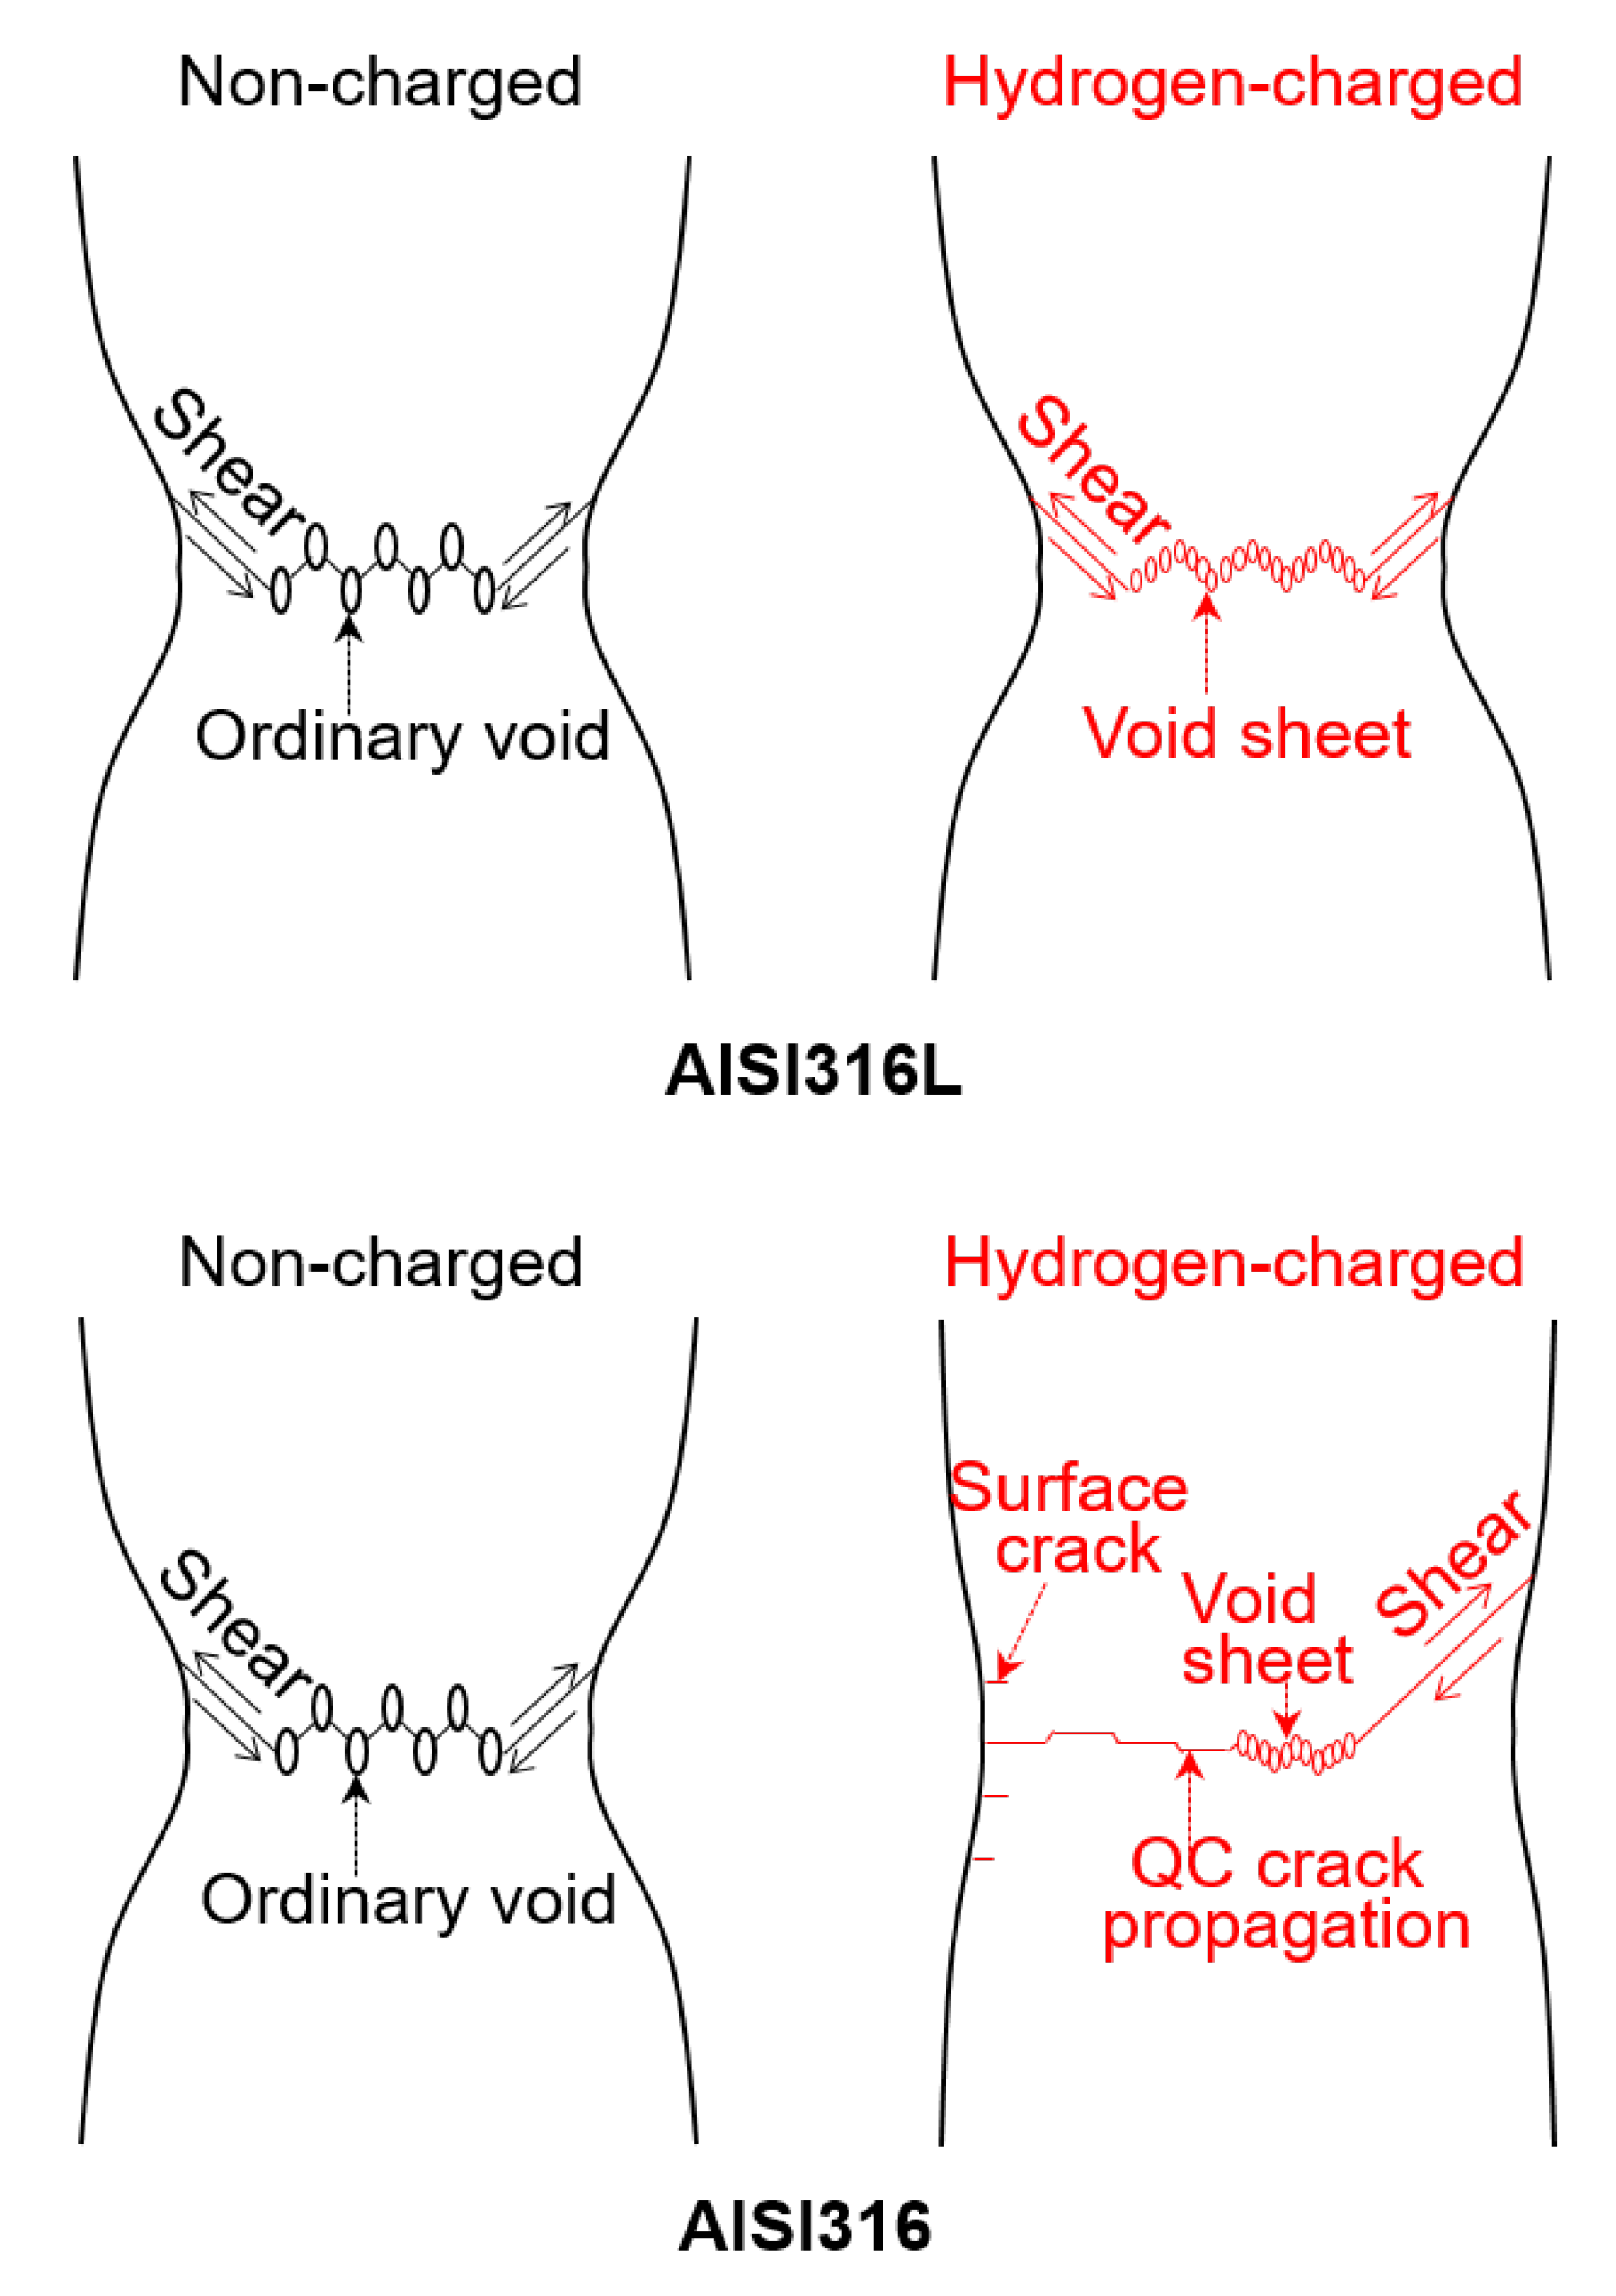
- In this material, cavities quickly transform into cracks perpendicular to the tensile axis leading to early fracture.
- By quantifying damage, we have also shown that both nucleation and growth, are not strongly affected by hydrogen charging. This means that the microscopic evolution of damage is not accelerated by the presence of hydrogen.
- The only noticeable difference, and the explanation for the reduction in ductility, is the aspect ratio of the cavities showing again a crack shape in the hydrogen-charged AISI316 leading to earlier macroscopic fracture.
Author Contributions
Acknowledgments
Conflicts of Interest
References
- Matsuoka, S.; Yamabe, J.; Matsunaga, H. Criteria for determining hydrogen compatibility and the mechanisms for hydrogen-assisted, surface crack growth in austenitic stainless steels. Eng. Fract. Mech. 2016, 153, 103–127. [Google Scholar] [CrossRef]
- Takakuwa, O.; Yamabe, J.; Matsunaga, H.; Furuya, Y.; Matsuoka, S. Comprehensive understanding of ductility loss mechanisms in various steels with external and internal hydrogen. Metall. Mater. Trans. 2017, 48, 5717–5732. [Google Scholar] [CrossRef]
- Tsay, L.W.; Chen, J.J.; Huang, J.C. Hydrogen-assisted fatigue crack growth of AISI316L stainless steel weld. Corros. Sci. 2008, 50, 2973–2980. [Google Scholar] [CrossRef]
- Ronevich, J.; Somerday, B.P.; San Marchi, C.W. Effects of microstructure banding on hydrogen assisted fatigue crack growth in X65 pipeline steels. Int. J. Fatigue 2015, 82, 497–504. [Google Scholar] [CrossRef]
- Matsunaga, H.; Takakuwa, O.; Yamabe, J.; Matsuoka, S. Hydrogen-enhanced fatigue crack growth in steels and its frequency dependence. Philos. Trans. R. Soc. 2017, 375. [Google Scholar] [CrossRef]
- Matsuoka, S.; Takakuwa, O.; Okazaki, S.; Yoshikawa, M.; Yamabe, J.; Matsunaga, H. Peculiar temperature dependence of hydrogen-enhanced fatigue crack growth of low-carbon steel in gaseous hydrogen. Scr. Mater. 2018, 154, 101–105. [Google Scholar] [CrossRef]
- Wang, S.; Nagao, A.; Sofronis, P.; Robertson, I.M. Hydrogen-modified dislocation structures in a cyclically deformed ferritic-pearlitic low carbon steel. Acta Mater. 2018, 144, 164–176. [Google Scholar] [CrossRef]
- Birenis, D.; Ogawa, Y.; Matsunaga, H.; Takakuwa, O.; Yamabe, J.; Prytz, Ø.; Thøgersen, A. Interpretation of hydrogen-assisted fatigue crack propagation in BCC iron based on dislocation structure evolution around the crack wake. Acta Mater. 2018, 156, 245–253. [Google Scholar] [CrossRef]
- Koyama, M.; Ogawa, T.; Yan, D.; Matsumotoc, Y.; Tasan, C.C.; Takai, K.; Tsuzaki, K. Hydrogen desorption and cracking associated with martensitic transformation in Fe-Cr-Ni-Based austenitic steels with different carbon contents. Int. J. Hydrogen Energy 2017, 42, 26423–26435. [Google Scholar] [CrossRef]
- Ogawa, Y.; Okazaki, S.; Takakuwa, O.; Matsunaga, H. The roles of internal and external hydrogen in the deformation and fracture processes at the fatigue crack tip zone of metastable austenitic stainless steels. Scr. Mater. 2018, 157, 95–99. [Google Scholar] [CrossRef]
- Stock, S. X-ray microtomography of materials. Int. Mater. Rev. 1999, 44, 141–164. [Google Scholar] [CrossRef]
- Stock, S.R. Microcomputed Tomography: Methodology and Applications; CRC Press: Boca Raton, FL, USA, 2008. [Google Scholar]
- Withers, P.J. X-ray nanotomography. Mater. Today 2007, 10, 26–34. [Google Scholar] [CrossRef]
- Maire, E.; Withers, P.J. Quantitative X-ray tomography. Int. Mater. Rev. 2014, 59, 1–43. [Google Scholar] [CrossRef]
- Landron, C.; Bouaziz, O.; Maire, E.; Adrien, J. Characterization and modeling of void nucleation by interface decohesion in dual phase steels. Scr. Mater. 2010, 63, 973–976. [Google Scholar] [CrossRef]
- Toda, H.; Oogo, H.; Uesugi, K.; Kobayashi, M. Roles of pre-existing hydrogen micropores on ductile fracture. Mater. Trans. 2009, 50, 2285–2290. [Google Scholar] [CrossRef]
- Fabrègue, D.; Landron, C.; Bouaziz, O.; Maire, E. Damage evolution in TWIP and standard austenitic steel by means of 3D X ray tomography. Mater. Sci. Eng. 2013, 579, 92–98. [Google Scholar] [CrossRef]
- Yamabe, J.; Takakuwa, O.; Matsunaga, H.; Itoga, H.; Matsuoka, S. Hydrogen diffusivity and tensile-ductility loss of solution-treated austenitic stainless steels with external and internal hydrogen. Int. J. Hydrogen Energy 2017, 42, 13289–13299. [Google Scholar] [CrossRef]
- Available online: http://www.esrf.eu/home/UsersAndScience/Experiments/StructMaterials/ID19.html (accessed on 4 September 2018).
- Buffiere, J.Y.; Maire, E.; Adrien, J.; Masse, J.P.; Boller, E. In Situ Experiments with X ray Tomography: An Attractive Tool for Experimental Mechanics. Exp. Mech. 2010, 50, 289–305. [Google Scholar] [CrossRef]
- Available online: http://ftp.esrf.fr/scisoft/PYHST2/ (accessed on 4 September 2018).
- Schneider, C.A.; Rasband, W.S.; Eliceiri, K.W. NIH Image to ImageJ: 25 years of image analysis. Nat. Methods 2012, 9, 671. [Google Scholar] [CrossRef]
- Landron, C.; Maire, E.; Bouaziz, O.; Adrien, J.; Lecarme, L.; Bareggi, A. Validation of void growth models using X-ray microtomography characterization of damage in dual phase steels. Acta Mater. 2011, 59, 7564–7573. [Google Scholar] [CrossRef]
- Maire, E.; Zhou, S.; Adrien, J.; Dimichiel, M. Damage quantification in aluminium alloys using in situ tensile tests in X-ray tomography. Eng. Fract. Mech. 2011, 78, 2679–2690. [Google Scholar] [CrossRef]
- San Marchi, C.; Michler, T.; Nibur, K.; Somerday, B. On the physical differences between tensile testing of type 304 and 316 austenitic stainless steels with internal hydrogen and in external hydrogen. Int. J. Hydrogen Energy 2010, 35, 9736–9745. [Google Scholar] [CrossRef]
- Cox, T.; Low, J.R. An investigation of the plastic fracture of AISI 4340 and 18 Nickel-200 grade maraging steels. Metall. Trans. 1974, 5, 1457–1470. [Google Scholar] [CrossRef]


| C | Si | Mn | P | S | Cr | Mo | Ni | |
|---|---|---|---|---|---|---|---|---|
| AISI316 | 0.04 | 0.64 | 0.93 | 0.032 | 0.001 | 16.83 | 2.05 | 10.23 |
| AISI316L | 0.018 | 0.50 | 0.84 | 0.021 | 0 | 17.45 | 2.05 | 12.09 |
| Materials | 0.2% Proof Stress | Tensile Strength | Elongation (%) |
|---|---|---|---|
| (MPa) | (MPa) | (%) | |
| AISI316 | 263 | 586 | 61.0 |
| AISI316L | 229 | 528 | 66.0 |
| Materials | Specimen Shape | Ductility | DDH: Decrease Due to Hydrogen Charging (%) | |
|---|---|---|---|---|
| Non-Charged | Hydrogen-Charged | |||
| AISI316 | Smooth | 1.91 | 0.885 | 53.7 |
| Notched | 1.66 | 0.62 | 62.7 | |
| AISI316L | Smooth | 1.92 | 1.35 | 29.4 |
| Notched | 1.9 | 1.08 | 42.9 | |
© 2019 by the authors. Licensee MDPI, Basel, Switzerland. This article is an open access article distributed under the terms and conditions of the Creative Commons Attribution (CC BY) license (http://creativecommons.org/licenses/by/4.0/).
Share and Cite
Maire, E.; Grabon, S.; Adrien, J.; Lorenzino, P.; Asanuma, Y.; Takakuwa, O.; Matsunaga, H. Role of Hydrogen-Charging on Nucleation and Growth of Ductile Damage in Austenitic Stainless Steels. Materials 2019, 12, 1426. https://doi.org/10.3390/ma12091426
Maire E, Grabon S, Adrien J, Lorenzino P, Asanuma Y, Takakuwa O, Matsunaga H. Role of Hydrogen-Charging on Nucleation and Growth of Ductile Damage in Austenitic Stainless Steels. Materials. 2019; 12(9):1426. https://doi.org/10.3390/ma12091426
Chicago/Turabian StyleMaire, Eric, Stanislas Grabon, Jérôme Adrien, Pablo Lorenzino, Yuki Asanuma, Osamu Takakuwa, and Hisao Matsunaga. 2019. "Role of Hydrogen-Charging on Nucleation and Growth of Ductile Damage in Austenitic Stainless Steels" Materials 12, no. 9: 1426. https://doi.org/10.3390/ma12091426