Stress Intensity Factor of Semielliptical Surface Crack in Internally Pressurized Hollow Cylinder—A Comparison between BS 7910 and API 579/ASME FFS-1 Solutions

 , and
, and
Abstract
:1. Introduction
2. Materials and Methods
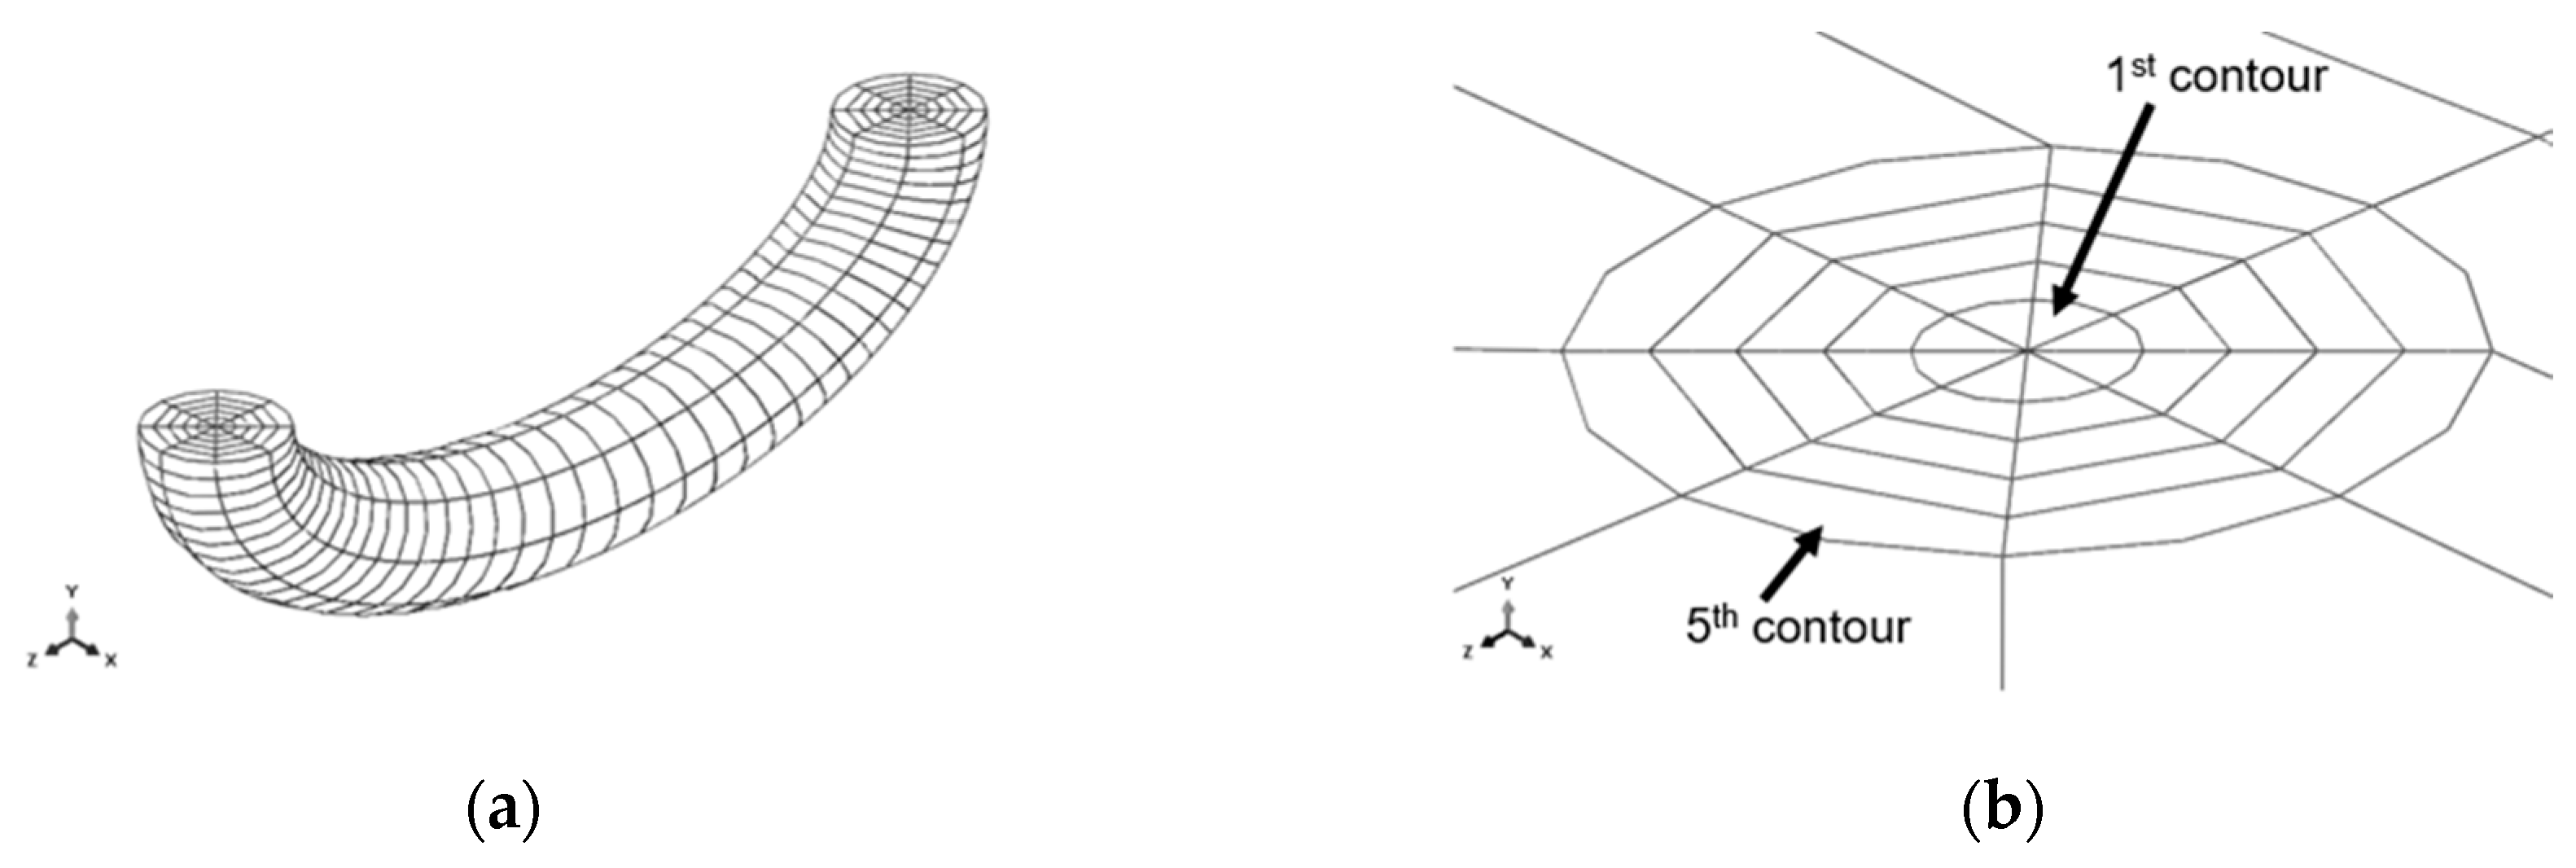
Developed Finite Element (FE) Model
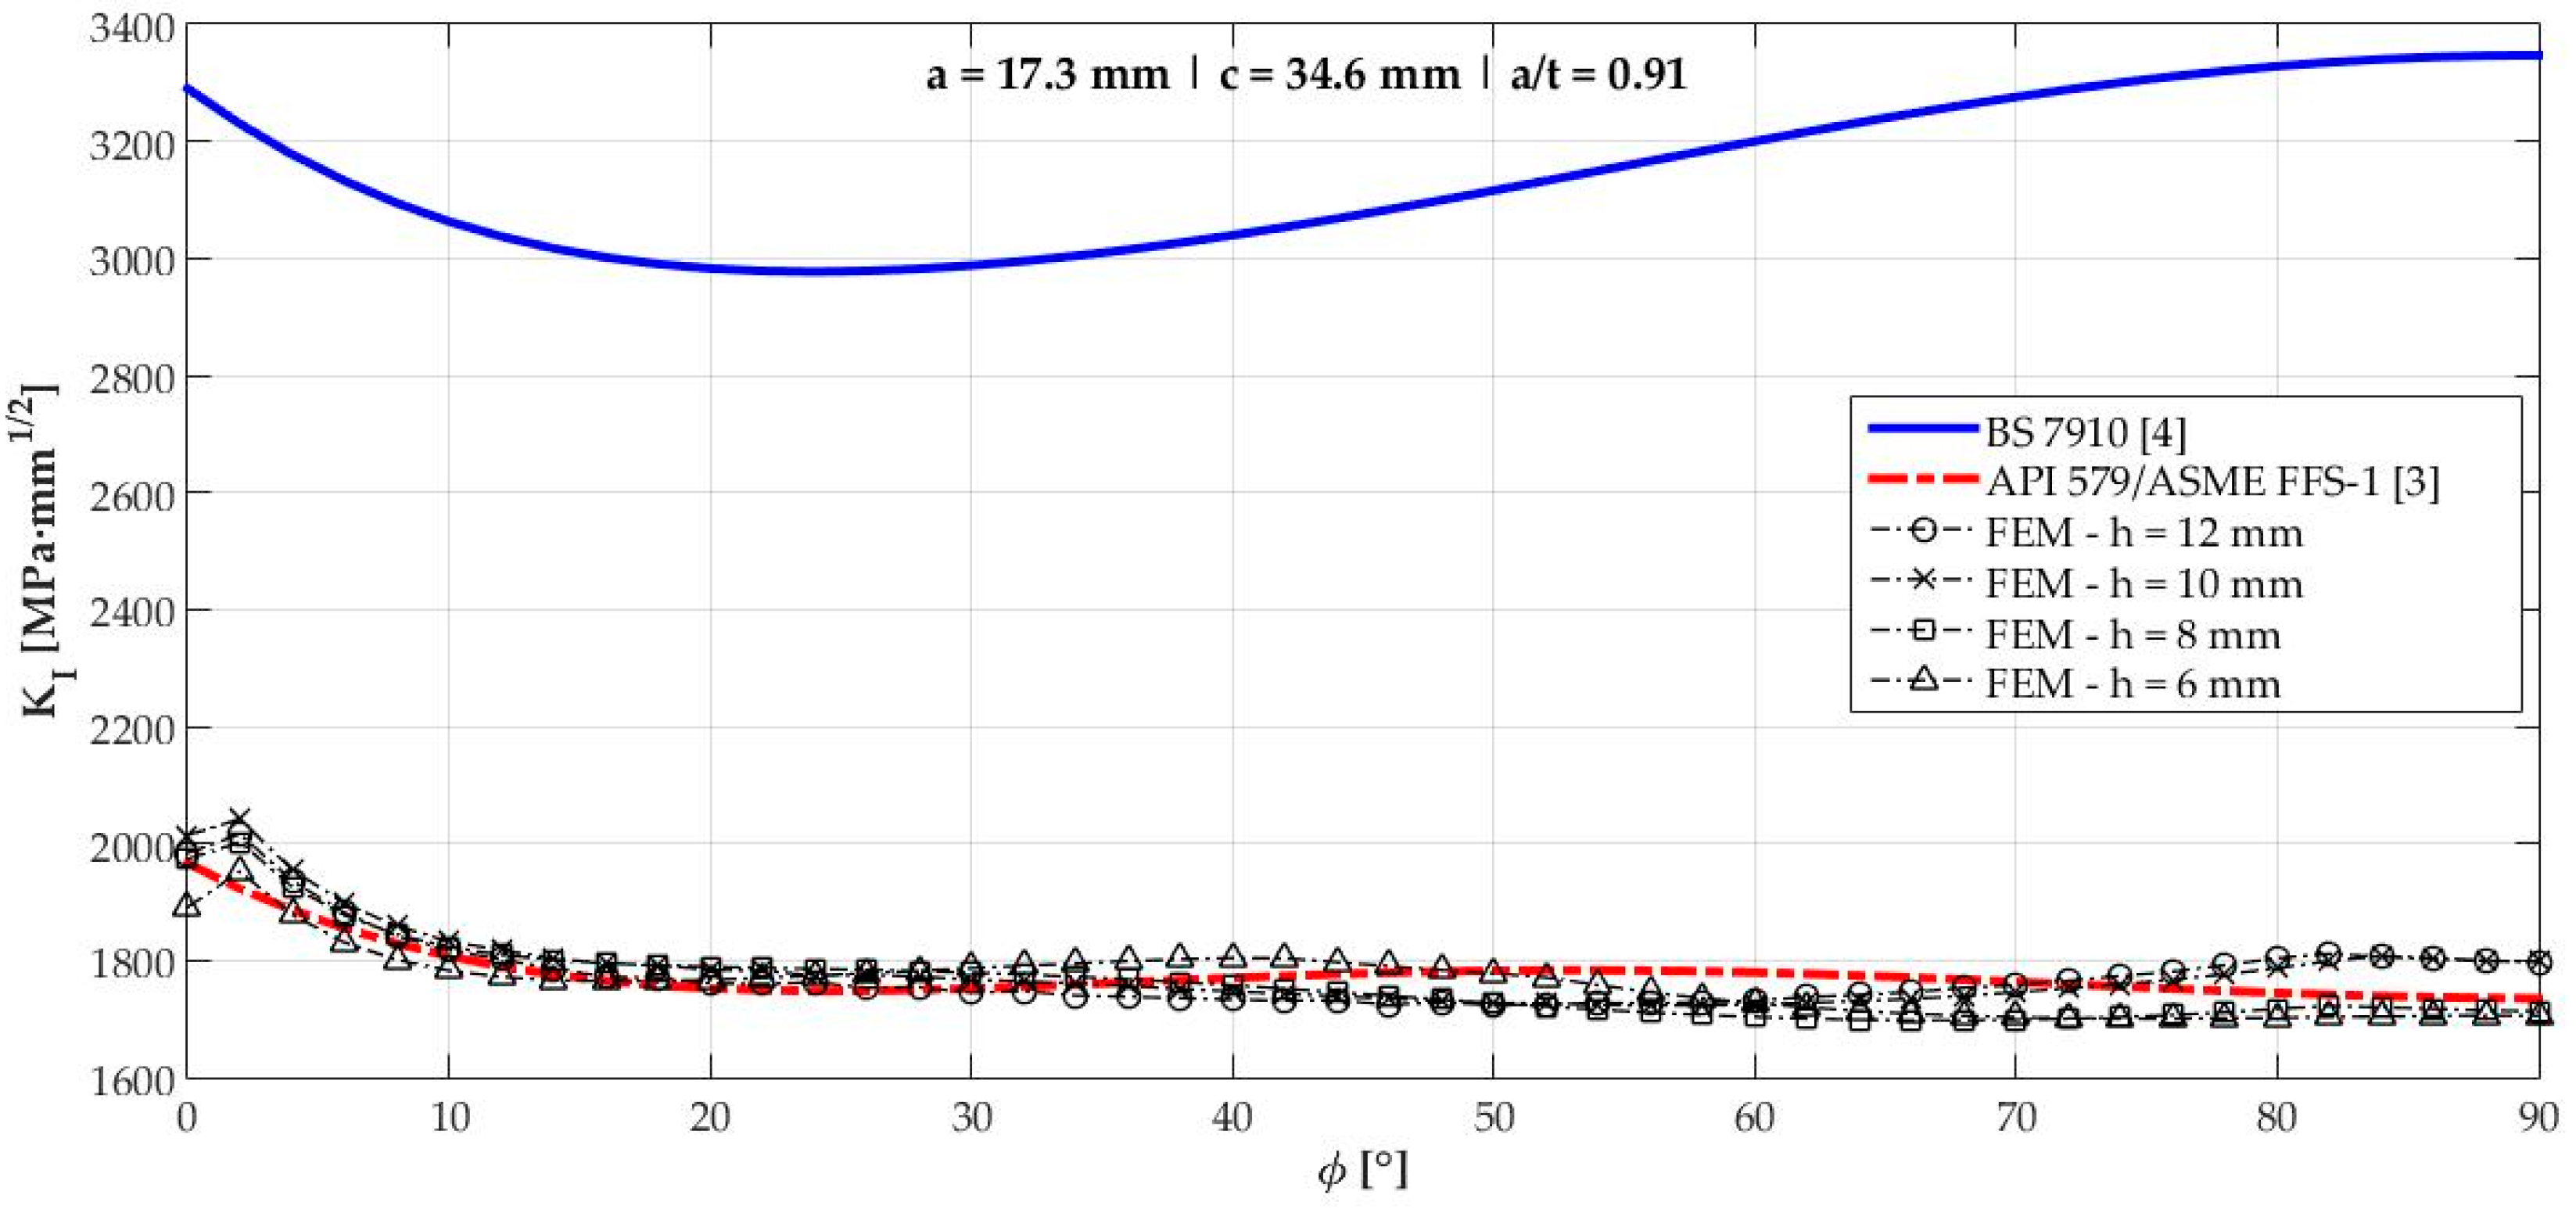
3. Results
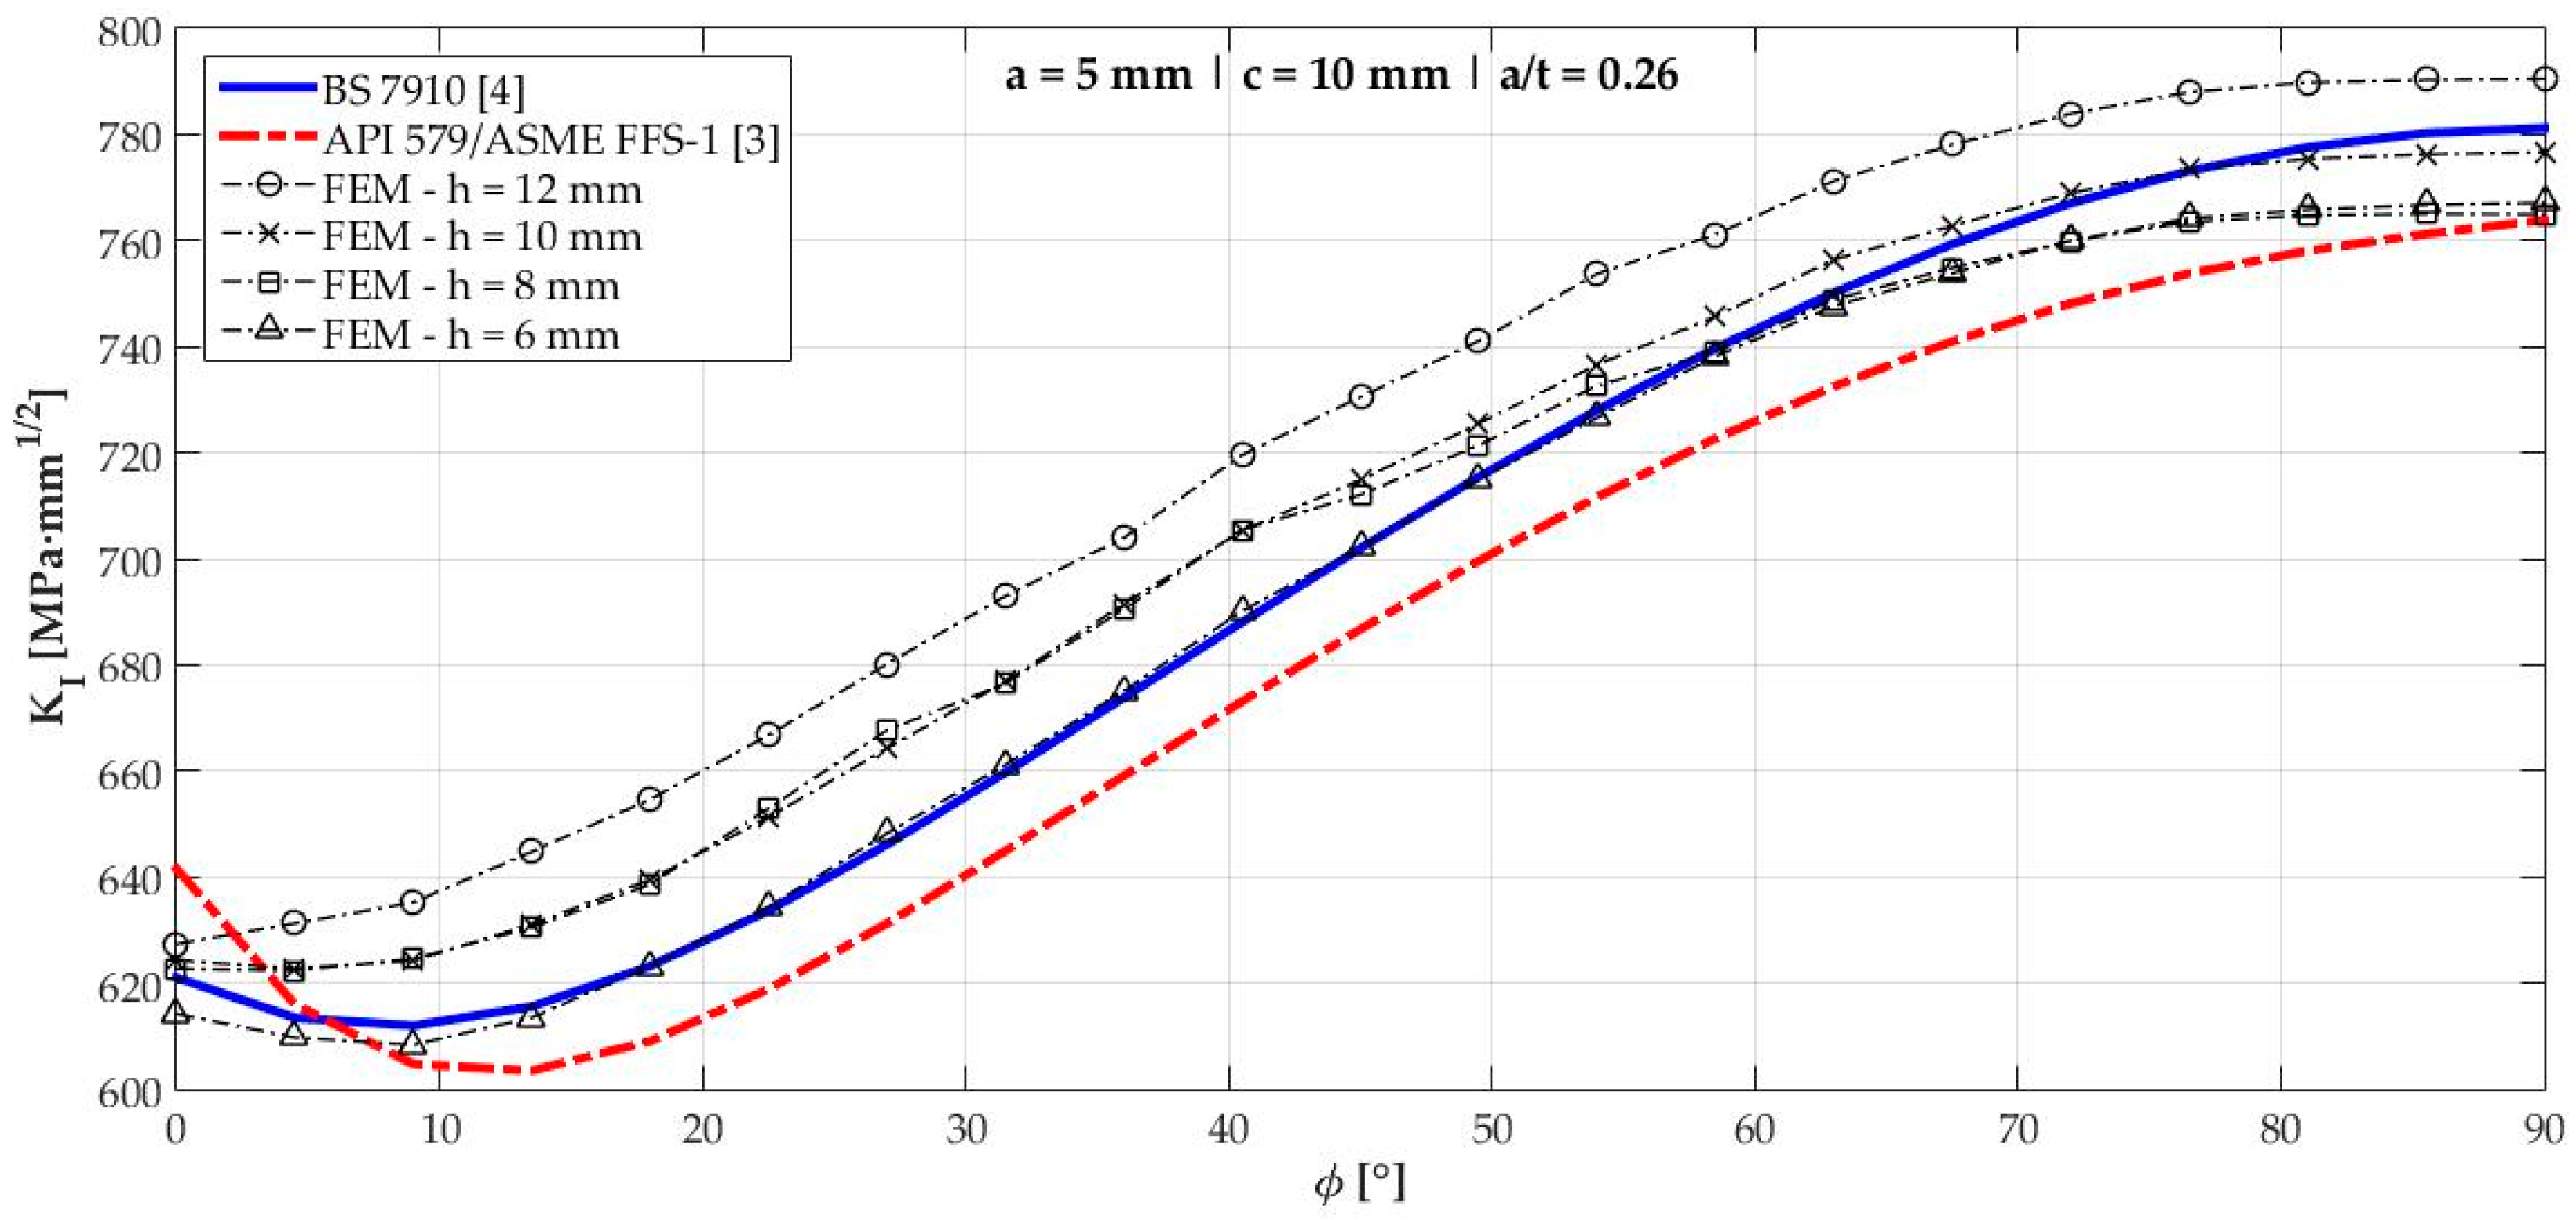
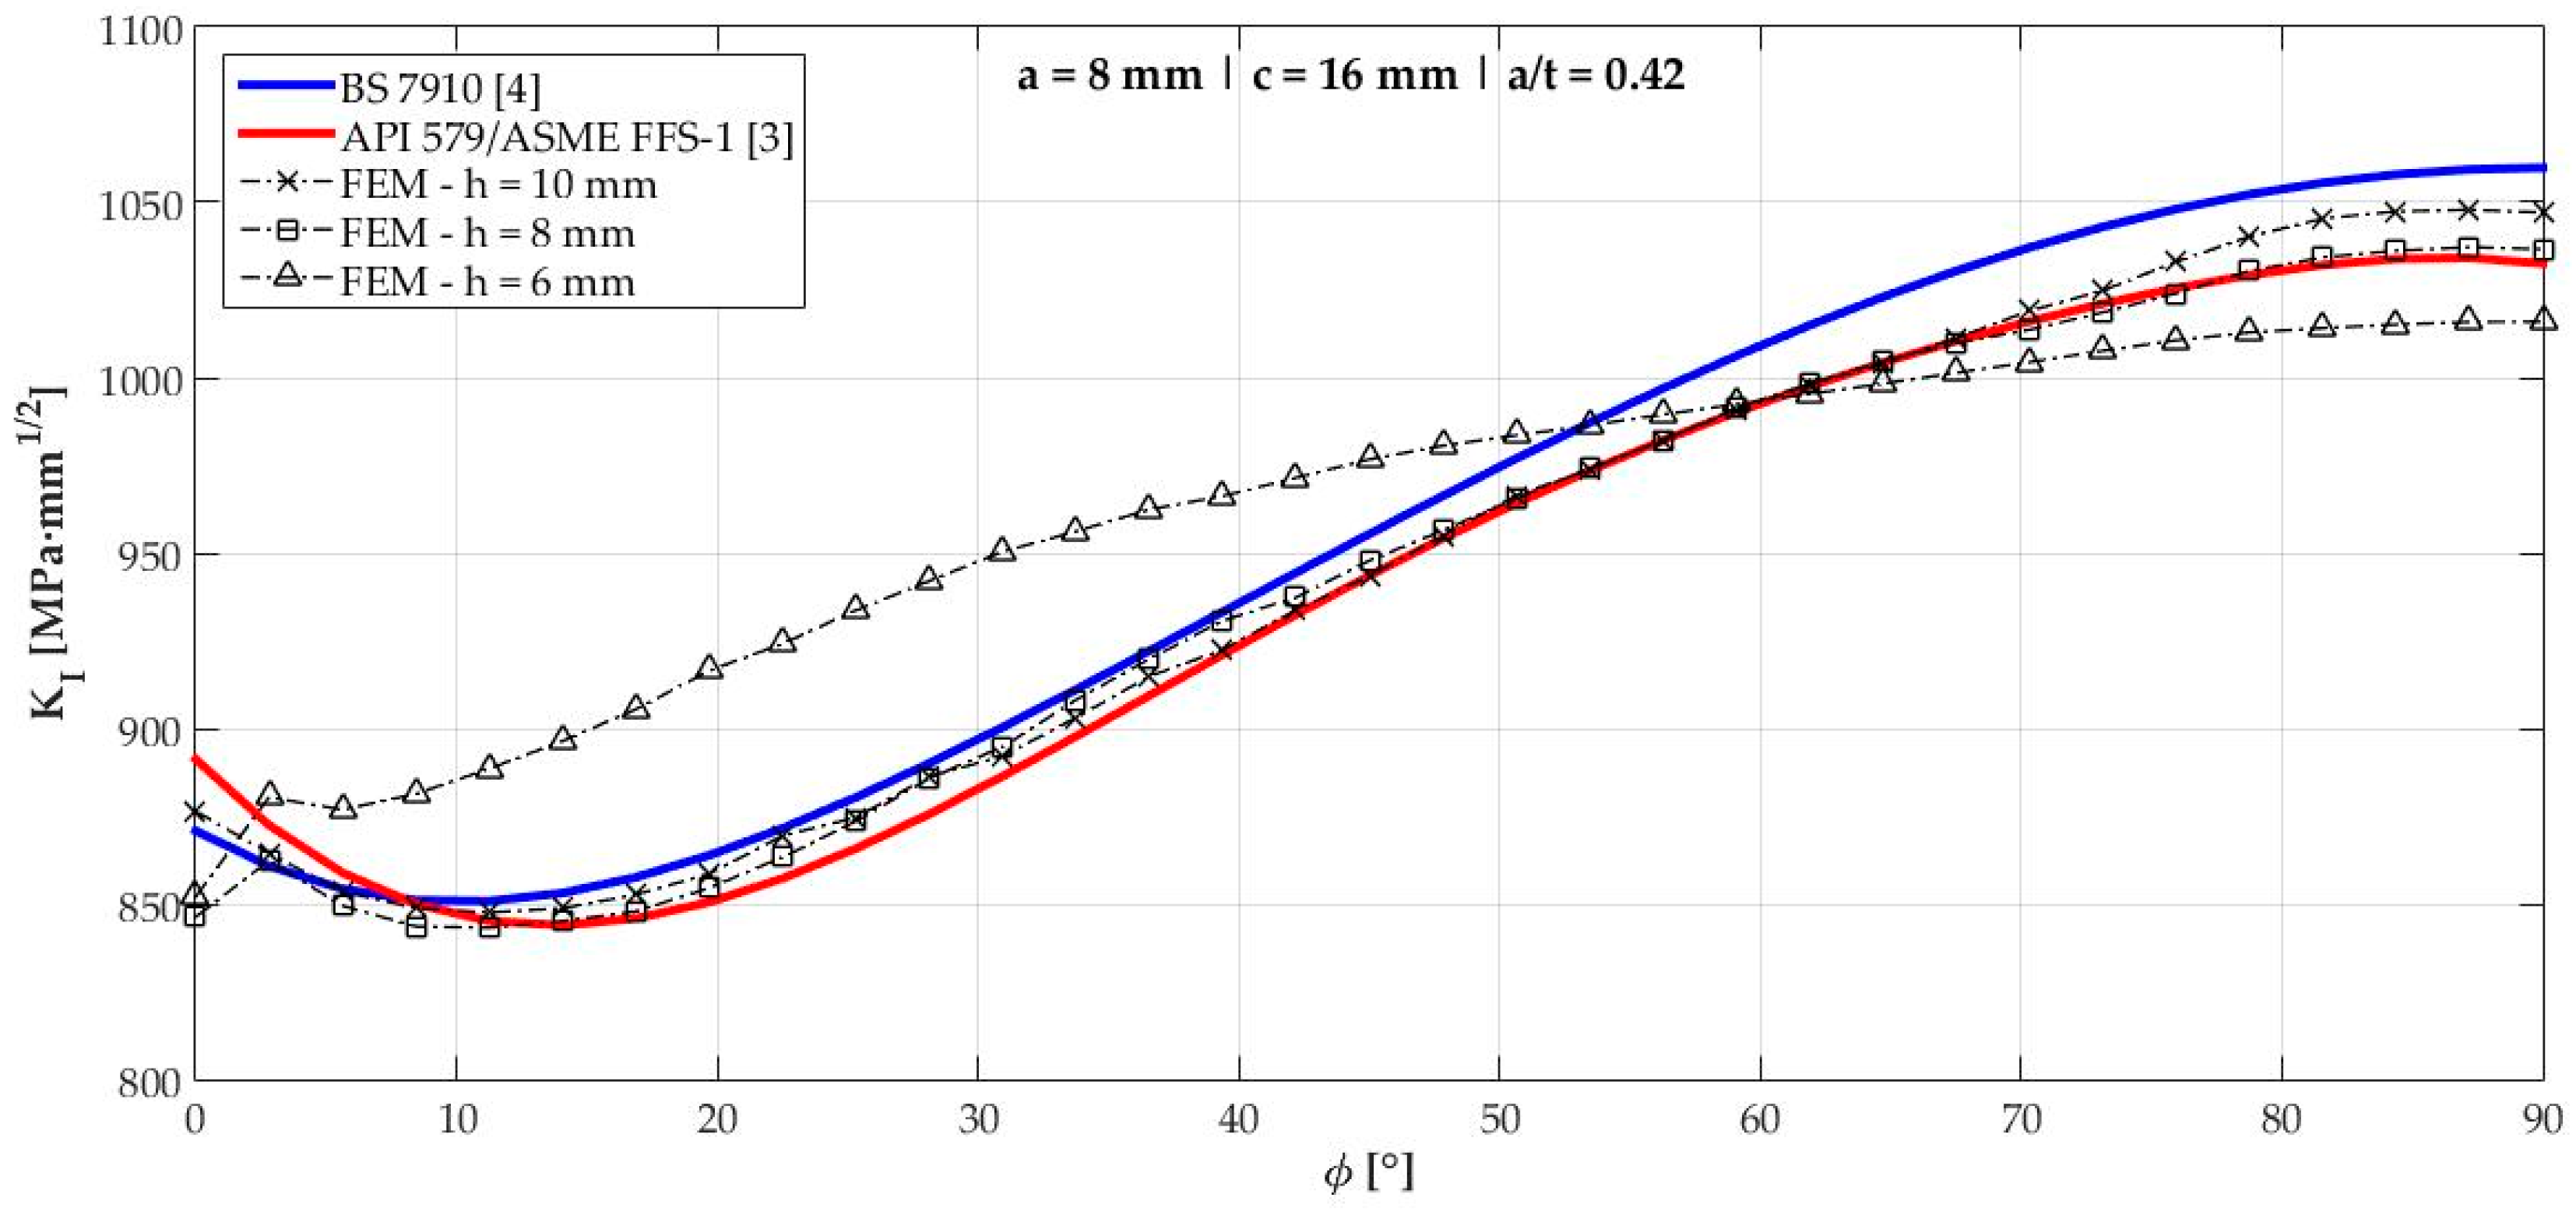
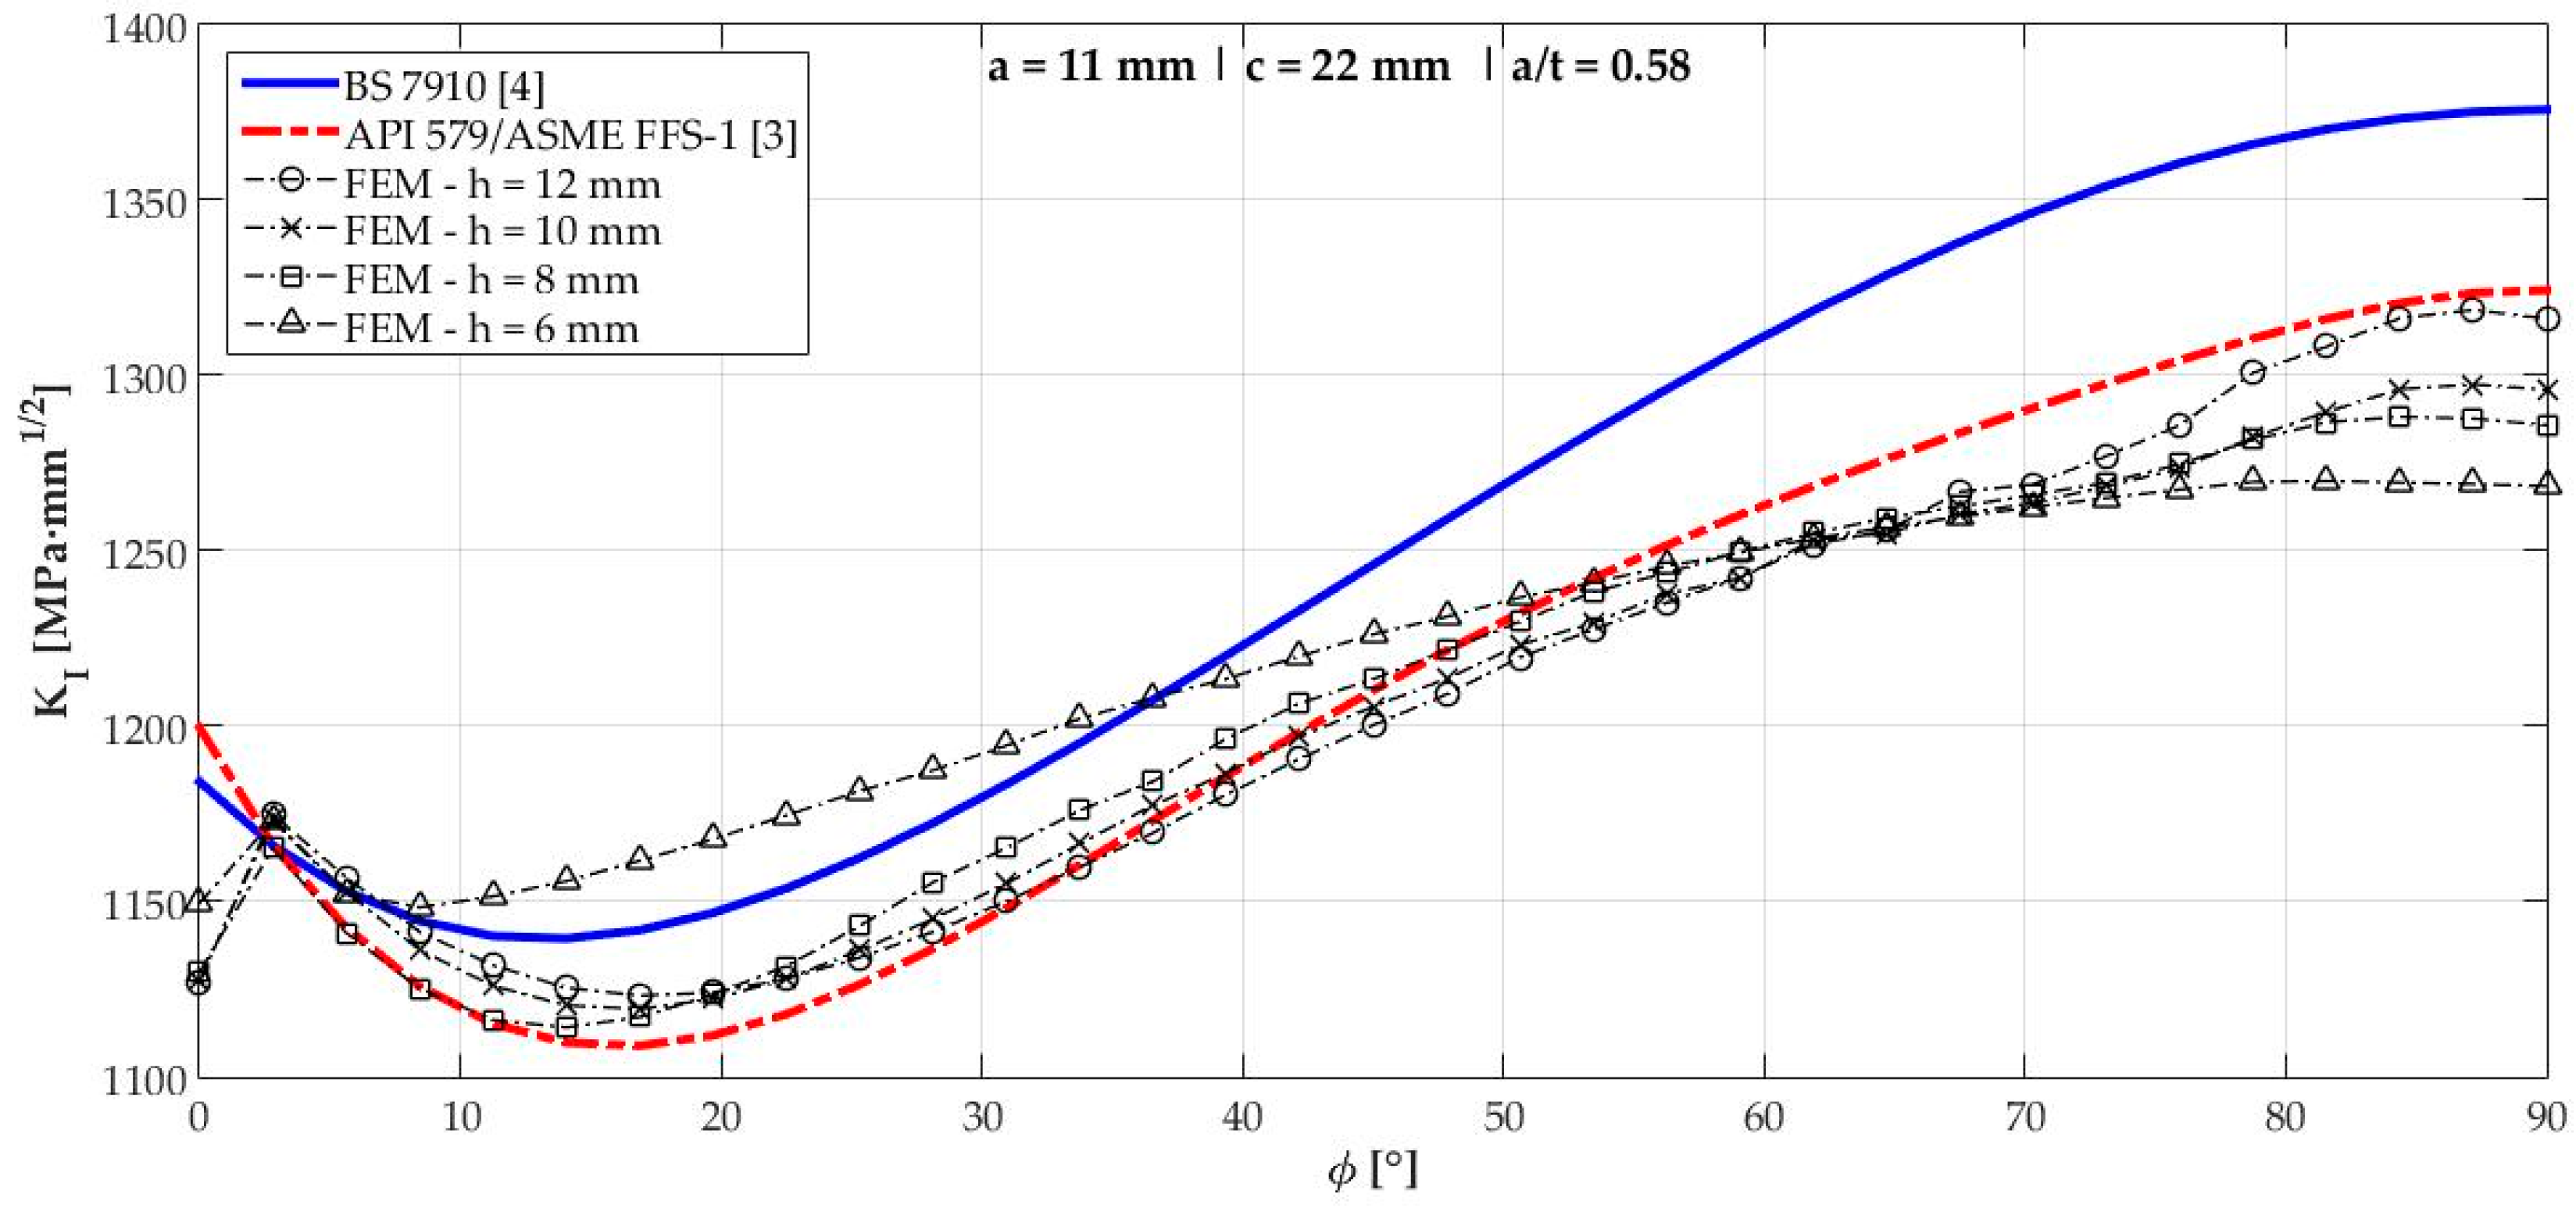
FE Results
4. Discussion
4.1. FE Result Analysis
4.2. Discussion of SIF Solutions
4.3. Influence of Both Solutions on Structural Integrity Assessment
5. Conclusions
Author Contributions
Funding
Acknowledgments
Conflicts of Interest
References
- Irwin, G.R. Analysis of Stresses and Strains Near the End of a Crack Traversing a Plate. J. Appl. Mech. 1957, 24, 361–364. [Google Scholar]
- Perez, N. Fracture Mechanics, 1st ed.; Kluwer Academic Publishers: Boston, MA, USA, 2004; ISBN 9788578110796. [Google Scholar]
- American Society of Mechanical Engineers. American Petroleum Institute API 579-1/ASME FFS-1: Fitness-For-Service; API Publishing Services: Washington, DC, USA, 2016. [Google Scholar]
- The British Standards Institution. Guide to Methods for Assessing the Acceptability of Flaws in Metallic Structures, 3rd ed.; BS 7910; BSI Standards Limited: London, UK, 2013. [Google Scholar]
- Newman, J.C.J.; Raju, I.S. Stress-Intensity Factor Equations for Cracks in Three-Dimensional Finite Bodies Subjected to Tension adn Bending Loads; NASA: Hampton, VA, USA, April 1984.
- Anderson, T.L. Flaw Characterization. In Comprehensive Structural Integrity; Ainsworth, R.A., Schwalbe, K.H., Eds.; Elsevier Pergamon: San Diego, CA, USA, 2003; pp. 227–243. ISBN 0-08-044152-1. [Google Scholar]
- Coêlho, G.C. Structural Integry Assessment of a Pressure Vessel Damaged by Cracks: Numerical Analysis and Fitness-For-Service. Master’s Thesis, Federal Univeristy of Campina Grande, Campina Grande, Brazil, 2018. [Google Scholar]
- Zheng, X.J.; Kiciak, A.; Glinka, G. Weight Functions and Stress Intensity Factors for Internal Surface Semi-Elliptical Crack in Thick-Walled Cylinder. Eng. Fract. Mech. 1997, 58, 207–221. [Google Scholar] [CrossRef]
- Sisan, A.M.; Hadley, I.; Smith, S.E.; Smith, M. A Review of K-Solutions for Through-Thickness Flaws in Cylinders and Spheres. In Proceedings of the ASME Pressure Vessels and Piping Conference, San Antonio, TX, USA, 22–26 July 2007; pp. 1–8. [Google Scholar]
- Larrosa, N.O.; Ainsworth, R.A. Comparisons of the Solutions of Common FFS Standard Procedures to Benchmark Problems. Procedia Eng. 2015, 130, 1327–1342. [Google Scholar] [CrossRef] [Green Version]
- Ramos, K.A.M. Comparative Study Between Results Obtained by API-579 and BS-7910 Documents on the Assessment of Cracks in Pressure Vessels; Federal University of Rio Grande do Sul: Porto Alegre, Brazil, 2009. [Google Scholar]
- Raju, I.S.; Newman, J.C. Stress-Intensity Factors for Internal and External Surface Cracks in Cylindrical Vessels. J. Press. Vessel Technol. 1982, 104, 293–298. [Google Scholar] [CrossRef]
- Simulia, D.S. Abaqus 6.12 Analysis User’s Manual Volume 2: Analysis. In Abaqus 6.12 Analysis User’s Manual; Simulia, D.S., Ed.; John Wiley & Sons Inc.: Providence, RI, USA, 2012; Volume II. [Google Scholar]
- Tipple, C.; Thorwald, G. Using the Failure Assessment Diagram Method with Fatigue Crack Growth to Determine Leak-before-Rupture. In Proceedings of the SIMULIA Customer Conference, Providence, RI, USA, 15–17 May 2012; pp. 1–15. [Google Scholar]
- Coêlho, G.C.; Silva, A.A.; dos Santos, M.A.; dos Santos, N.C. The Use of XFEM for Stress Intensity Factor Estimation of Surface Cracks. In Proceedings of the 24th ABCM International Congress of Mechanical Engineering, Curitiba, Brazil, 3–8 December 2017; ABCM: Curitiba, Brazil, 2017. [Google Scholar]
- Noda, N.A.; Kobayashi, K.; Oohashi, T. Variation of the stress intensity factor along the crack front of interacting semi-elliptical surface cracks. Arch. Appl. Mech. 2001, 71, 43–52. [Google Scholar] [CrossRef]
- Coules, H.E. Stress Intensity Interaction Between Dissimilar Semi-Elliptical Surface Cracks. Int. J. Press. Vessel. Pip. 2016, 146, 55–64. [Google Scholar] [CrossRef]
- Benthem, J.P. State of Stress at the Vertex of a Quarter-Infinite Crack in a Half-Space. Int. J. Solids Struct. 1977, 13, 479–492. [Google Scholar] [CrossRef]
- Raju, I.S.; Newman, J.C. Stress-Intensity Factors for a Wide Range of Semielliptical Surface Cracks in Finte-Thickness Plates. Eng. Fract. Mech. 1979, 11, 817–829. [Google Scholar] [CrossRef]
- Ramberg, W.; Osgood, W.R. Description of Stress-Strain Curves by Three Parameters; National Advisory Committee for Aeronautics: Washington, DC, USA, 1943.


| Crack | a (mm) | c (mm) | a/t |
|---|---|---|---|
| 1 | 5.00 | 10.00 | 0.26 |
| 2 | 8.00 | 16.00 | 0.42 |
| 3 | 11.00 | 22.00 | 0.58 |
| 4 | 14.00 | 28.00 | 0.74 |
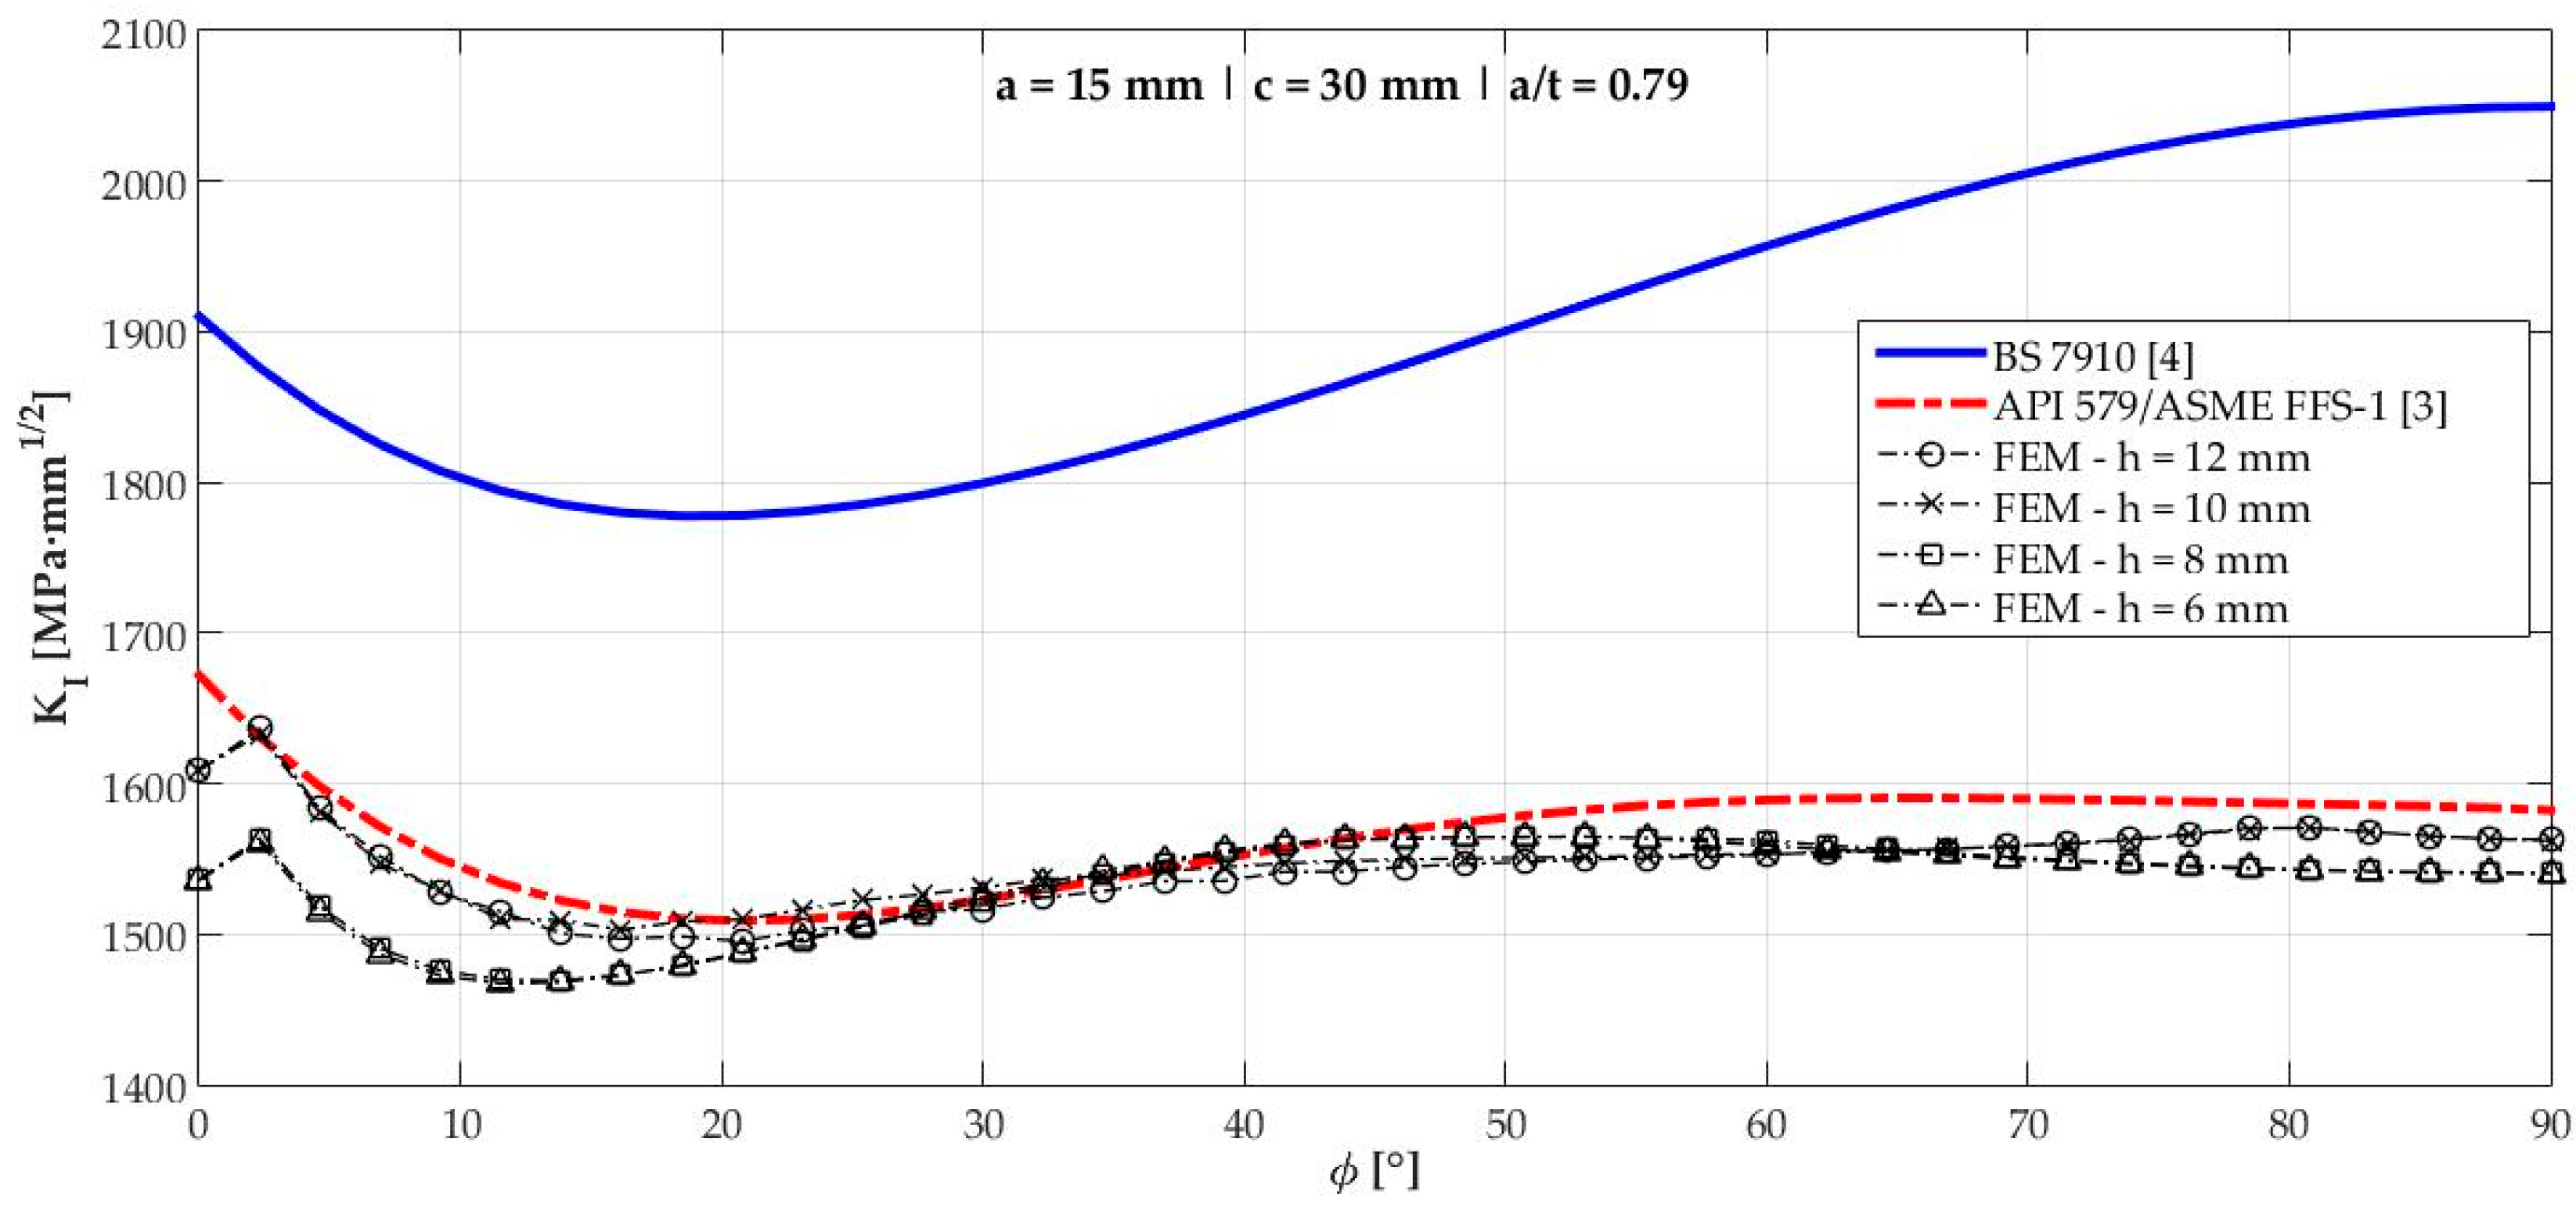
| 5 | 15.00 | 30.00 | 0.79 |
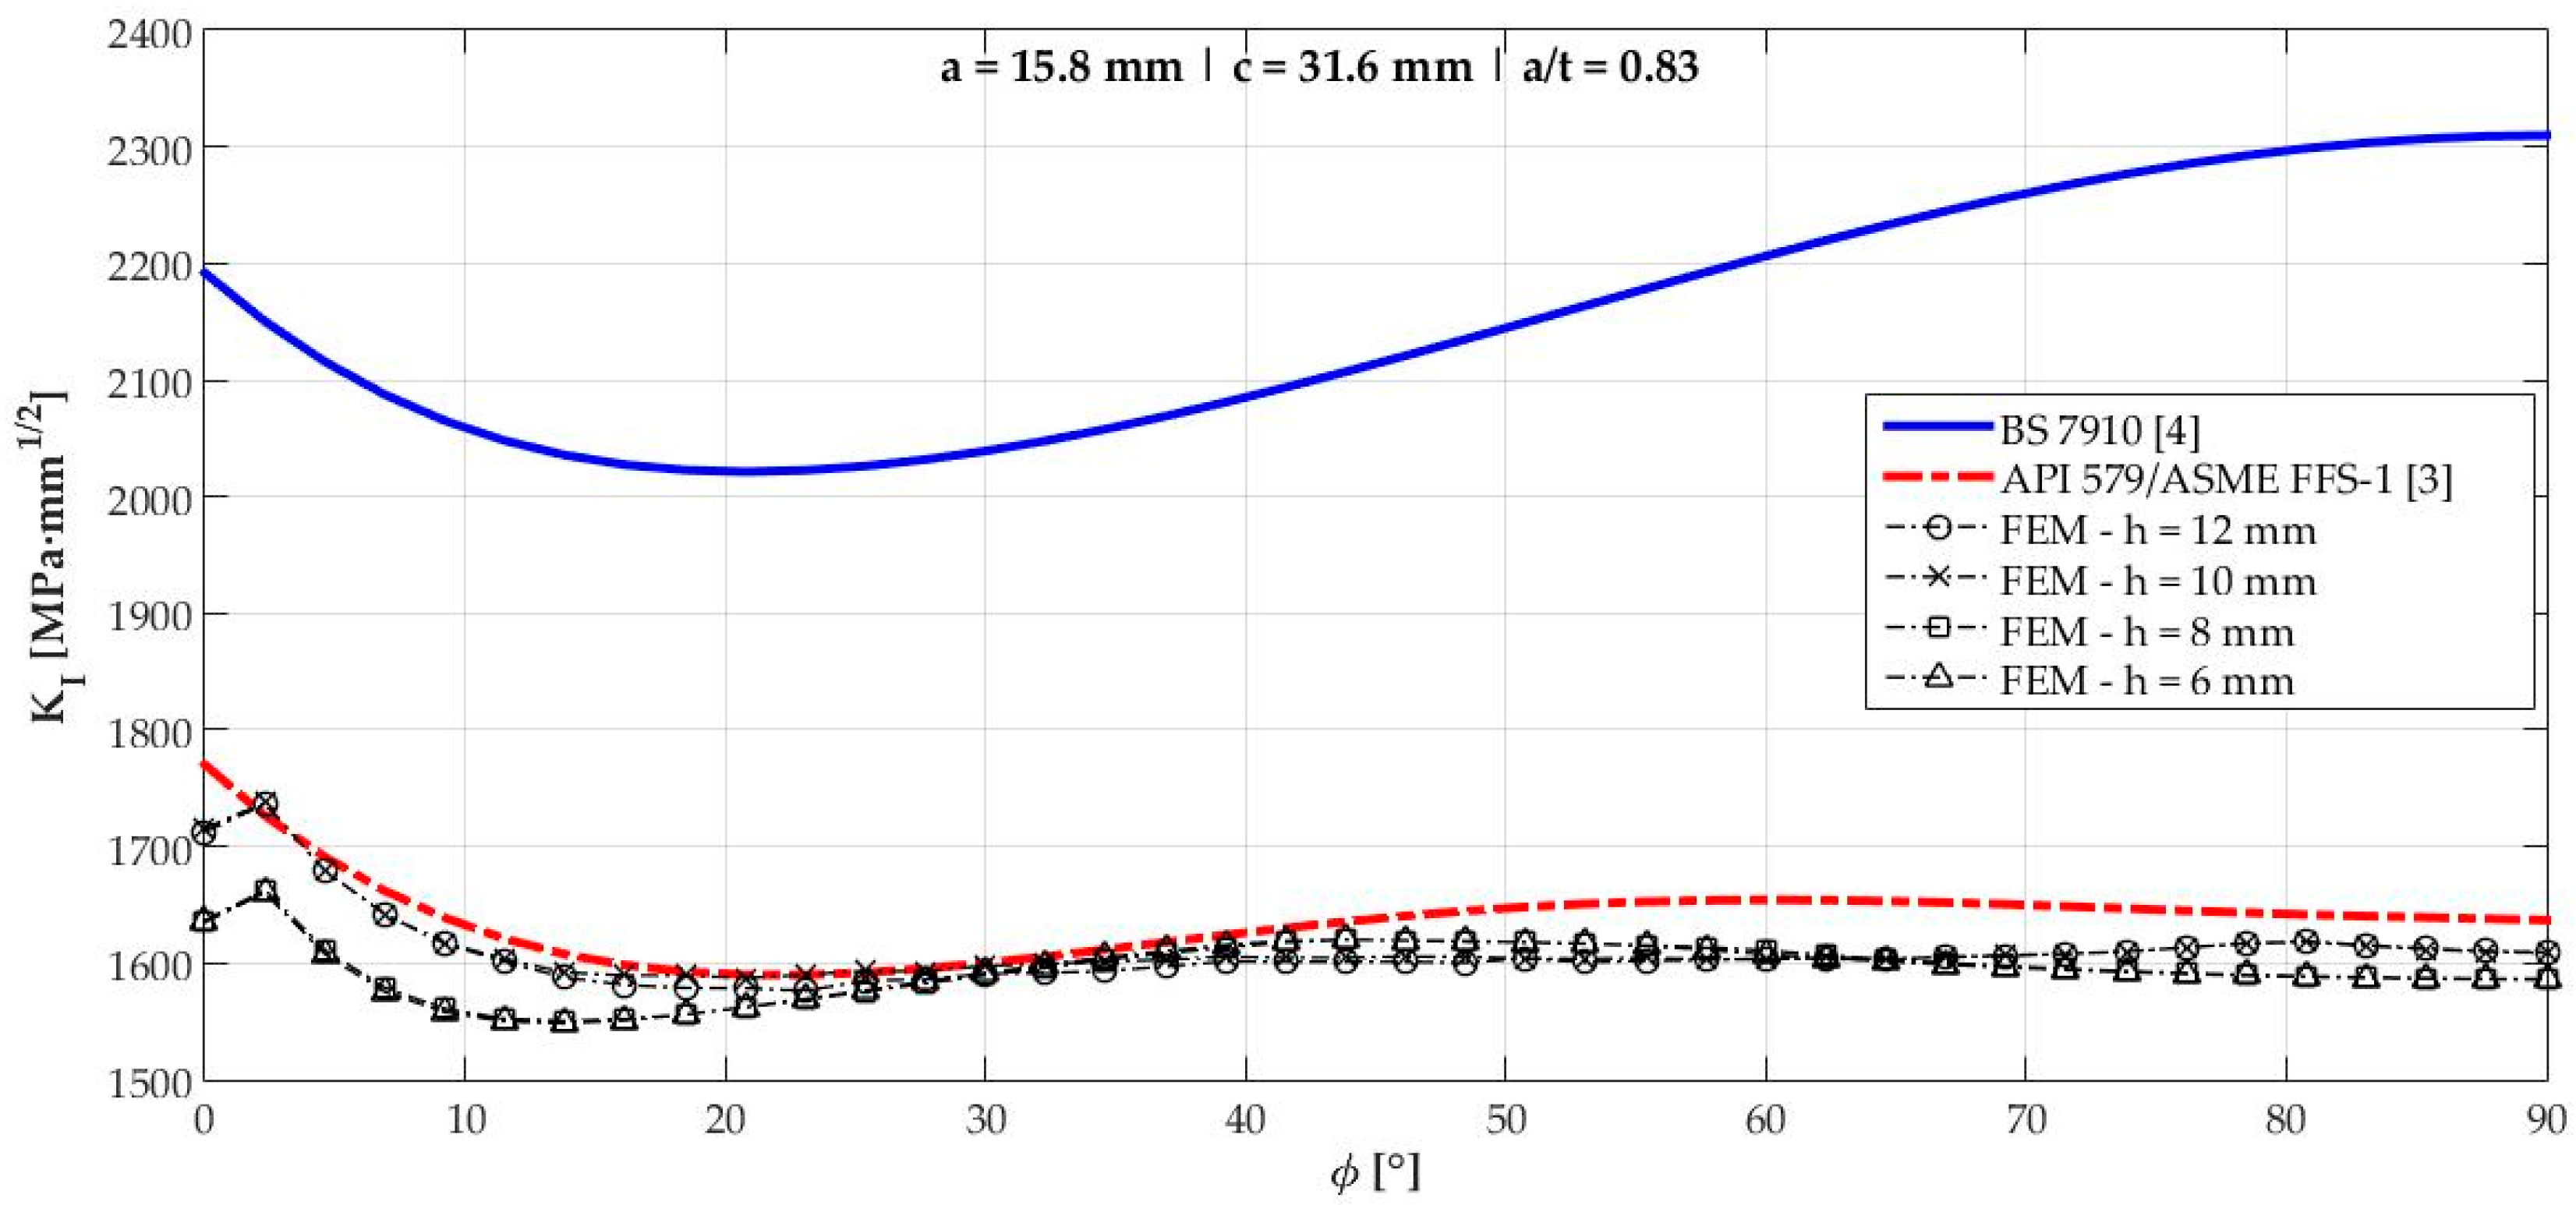
| 6 | 15.80 | 31.60 | 0.83 |
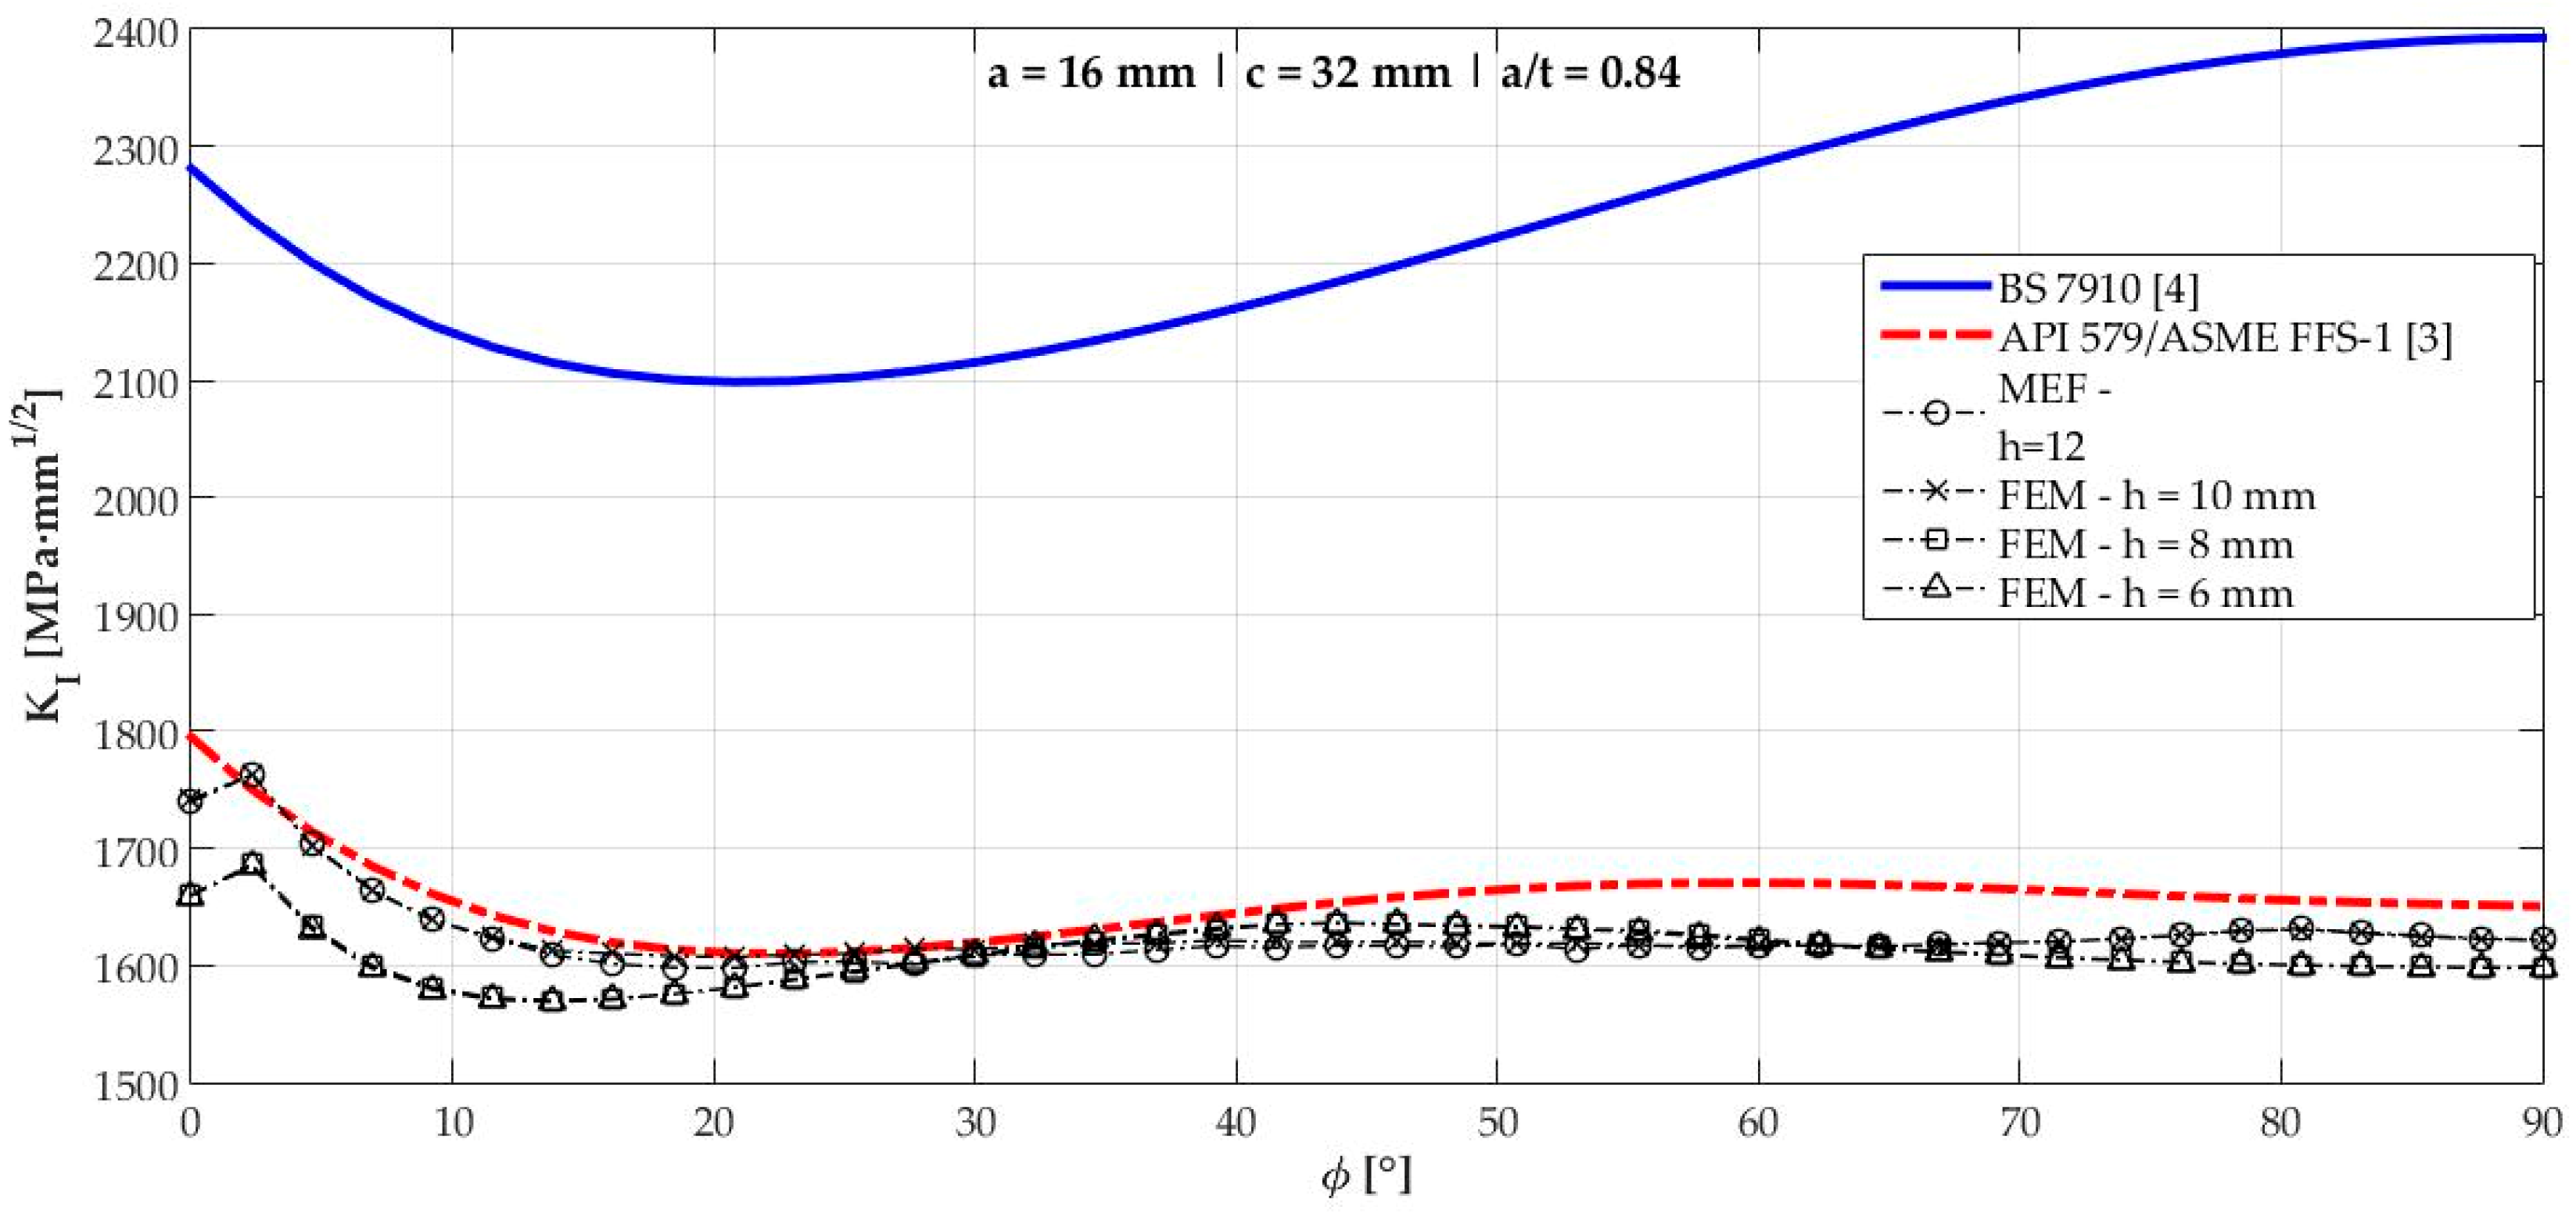
| 7 | 16.00 | 32.00 | 0.84 |
| 8 | 16.40 | 32.80 | 0.86 |
| 9 | 16.50 | 33.00 | 0.87 |
| 10 | 17.18 | 34.36 | 0.90 |
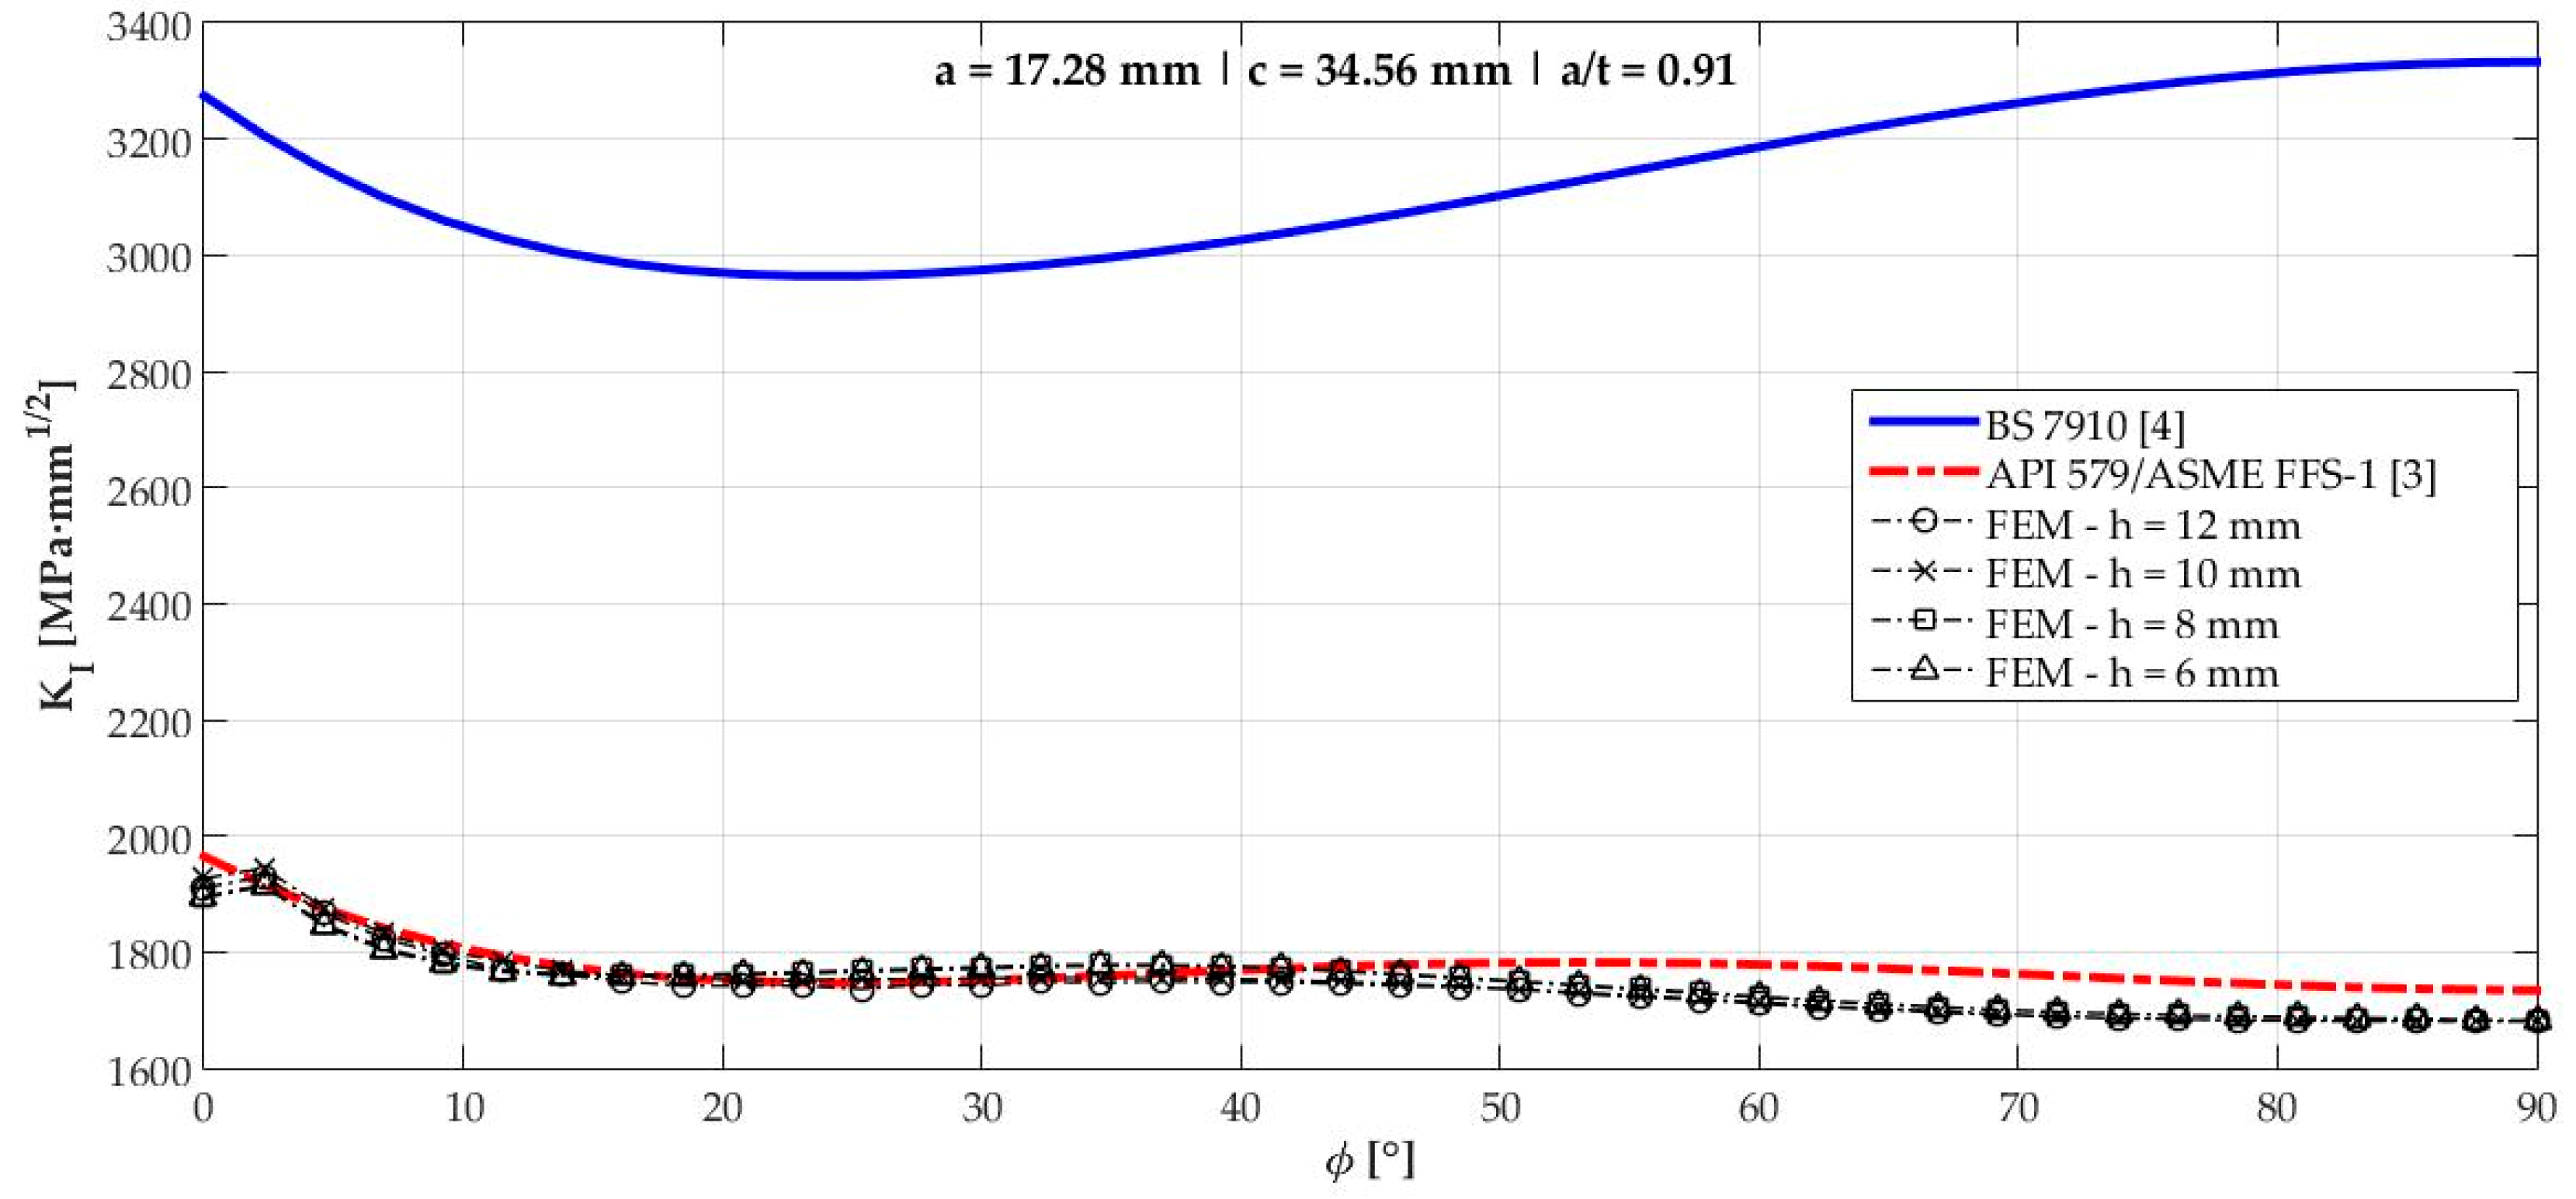
| 11 | 17.28 | 34.56 | 0.91 |
| 12 | 17.30 | 34.60 | 0.91 |
| Parameter | Value (mm) |
|---|---|
| Cylinder length () | 6000.00 |
| Internal radius () | 1139.75 |
| Thickness () | 19.00 |
| Crack | Element Type | Number of Elements | Number of Nodes |
|---|---|---|---|
| 1 | C3D15 (1° contour) + C3D20R (remaining) | 115,802 | 499,828 |
| 2 | 29,636 | 135,922 | |
| 3 | 25,524 | 116,698 | |
| 4 | 38,892 | 174,860 | |
| 5 | 38,892 | 174,860 | |
| 6 | 38,892 | 174,860 | |
| 7 | 38,892 | 174,860 | |
| 8 | 38,892 | 174,860 | |
| 9 | 38,892 | 174,860 | |
| 10 | 35,754 | 162,028 | |
| 11 | 35,754 | 162,028 | |
| 12 | 239,820 | 1,008,164 |
| Crack | a/t | Mean Difference Percentage, | ||||||||||
|---|---|---|---|---|---|---|---|---|---|---|---|---|
| BS | API | BS | API | BS | API | BS | API | |||||
| 1 | 0.26 | 3.32% | 5.49% | 1.46% | 3.51% | 1.63% | 2.99% | 0.59% | 1.91% | |||
| 2 * | 0.42 | - | - | 1.30% | 0.60% | 3.48% | 3.45% | 3.42% | 3.51% | |||
| 3 | 0.58 | 3.49% | 1.11% | 3.69% | 1.31% | 3.53% | 1.31% | 3.31% | 2.69% | |||
| 4 | 0.74 | 12.88% | 1.15% | 12.55% | 0.98% | 13.39% | 1.92% | 13.49% | 2.01% | |||
| 5 | 0.79 | 18.56% | 1.35% | 18.36% | 1.24% | 19.18% | 2.11% | 19.20% | 2.18% | |||
| 6 | 0.83 | 25.07% | 1.77% | 24.92% | 1.59% | 25.72% | 2.59% | 25.74% | 2.62% | |||
| 7 | 0.84 | 27.00% | 1.85% | 26.87% | 1.68% | 27.65% | 2.68% | 27.67% | 2.71% | |||
| 8 | 0.86 | 31.38% | 1.97% | 31.25% | 1.79% | 32.00% | 2.81% | 32.02% | 2.84% | |||
| 9 | 0.87 | 32.58% | 2.19% | 32.47% | 2.02% | 33.20% | 3.05% | 33.24% | 3.11% | |||
| 10 | 0.90 | 42.60% | 1.98% | 42.42% | 1.94% | 42.21% | 1.98% | 42.27% | 1.98% | |||
| 11 | 0.91 | 44.37% | 2.14% | 44.20% | 1.95% | 44.00% | 1.96% | 44.06% | 1.97% | |||
| 12 | 0.91 | 43.43% | 1.89% | 43.22% | 2.14% | 43.88% | 2.18% | 43.83% | 1.86% | |||
| Crack | FEM | BS 7910 [4] | API 579/ASME FFS-1 [3] | |||||
|---|---|---|---|---|---|---|---|---|
[MPa·mm1/2] | [MPa·mm1/2] | [MPa·mm1/2] | ||||||
| 1 | 609.75 | 767.11 | 781.18 | 90° | 1.80% | 763.86 | 90° | 0.43% |
| 2 | 864.44 | 1047.08 | 1059.85 | 90° | 1.20% | 1032.52 | 90° | 1.41% |
| 3 | 1174.84 | 1316.22 | 1375.78 | 90° | 4.33% | 1324.32 | 90° | 0.61% |
| 4 | 1505.27 | 1503.32 | 1819.53 | 90° | 17.38% | 1514.12 | 0° | 0.58% |
| 5 | 1632.57 | 1562.12 | 2049.56 | 90° | 23.78% | 1631.14 | 0° | 0.09% |
| 6 | 1737.65 | 1608.92 | 2309.72 | 90° | 30.34% | 1726.55 | 0° | 0.64% |
| 7 | 1762.95 | 1621.54 | 2392.61 | 90° | 32.23% | 1750.65 | 0° | 0.70% |
| 8 | 1815.73 | 1648.81 | 2591.64 | 90° | 36.38% | 1799.13 | 0° | 0.92% |
| 9 | 1828.87 | 1655.93 | 2650.30 | 90° | 37.52% | 1817.99 | 0° | 0.60% |
| 10 | 1930.93 | 1670.63 | 3215.65 | 90° | 48.05% | 1896.17 | 0° | 1.83% |
| 11 | 1944.21 | 1680.66 | 3332.81 | 90° | 49.57% | 1915.37 | 0° | 1.51% |
| 12 | 1951.63 | 1705.72 | 3347.023 | 90° | 49.04% | 1922.46 | 0° | 1.52% |
© 2019 by the authors. Licensee MDPI, Basel, Switzerland. This article is an open access article distributed under the terms and conditions of the Creative Commons Attribution (CC BY) license (http://creativecommons.org/licenses/by/4.0/).
Share and Cite
Coêlho, G.d.C.; Silva, A.A.; Santos, M.A.; Lima, A.G.B.; Santos, N.C. Stress Intensity Factor of Semielliptical Surface Crack in Internally Pressurized Hollow Cylinder—A Comparison between BS 7910 and API 579/ASME FFS-1 Solutions. Materials 2019, 12, 1042. https://doi.org/10.3390/ma12071042
Coêlho GdC, Silva AA, Santos MA, Lima AGB, Santos NC. Stress Intensity Factor of Semielliptical Surface Crack in Internally Pressurized Hollow Cylinder—A Comparison between BS 7910 and API 579/ASME FFS-1 Solutions. Materials. 2019; 12(7):1042. https://doi.org/10.3390/ma12071042
Chicago/Turabian StyleCoêlho, Gabriel de C., Antonio A. Silva, Marco A. Santos, Antonio G. B. Lima, and Neilor C. Santos. 2019. "Stress Intensity Factor of Semielliptical Surface Crack in Internally Pressurized Hollow Cylinder—A Comparison between BS 7910 and API 579/ASME FFS-1 Solutions" Materials 12, no. 7: 1042. https://doi.org/10.3390/ma12071042