CH4 Adsorption Probability on GaN(0001) and (000−1) during Metalorganic Vapor Phase Epitaxy and Its Relationship to Carbon Contamination in the Films

 , , , and
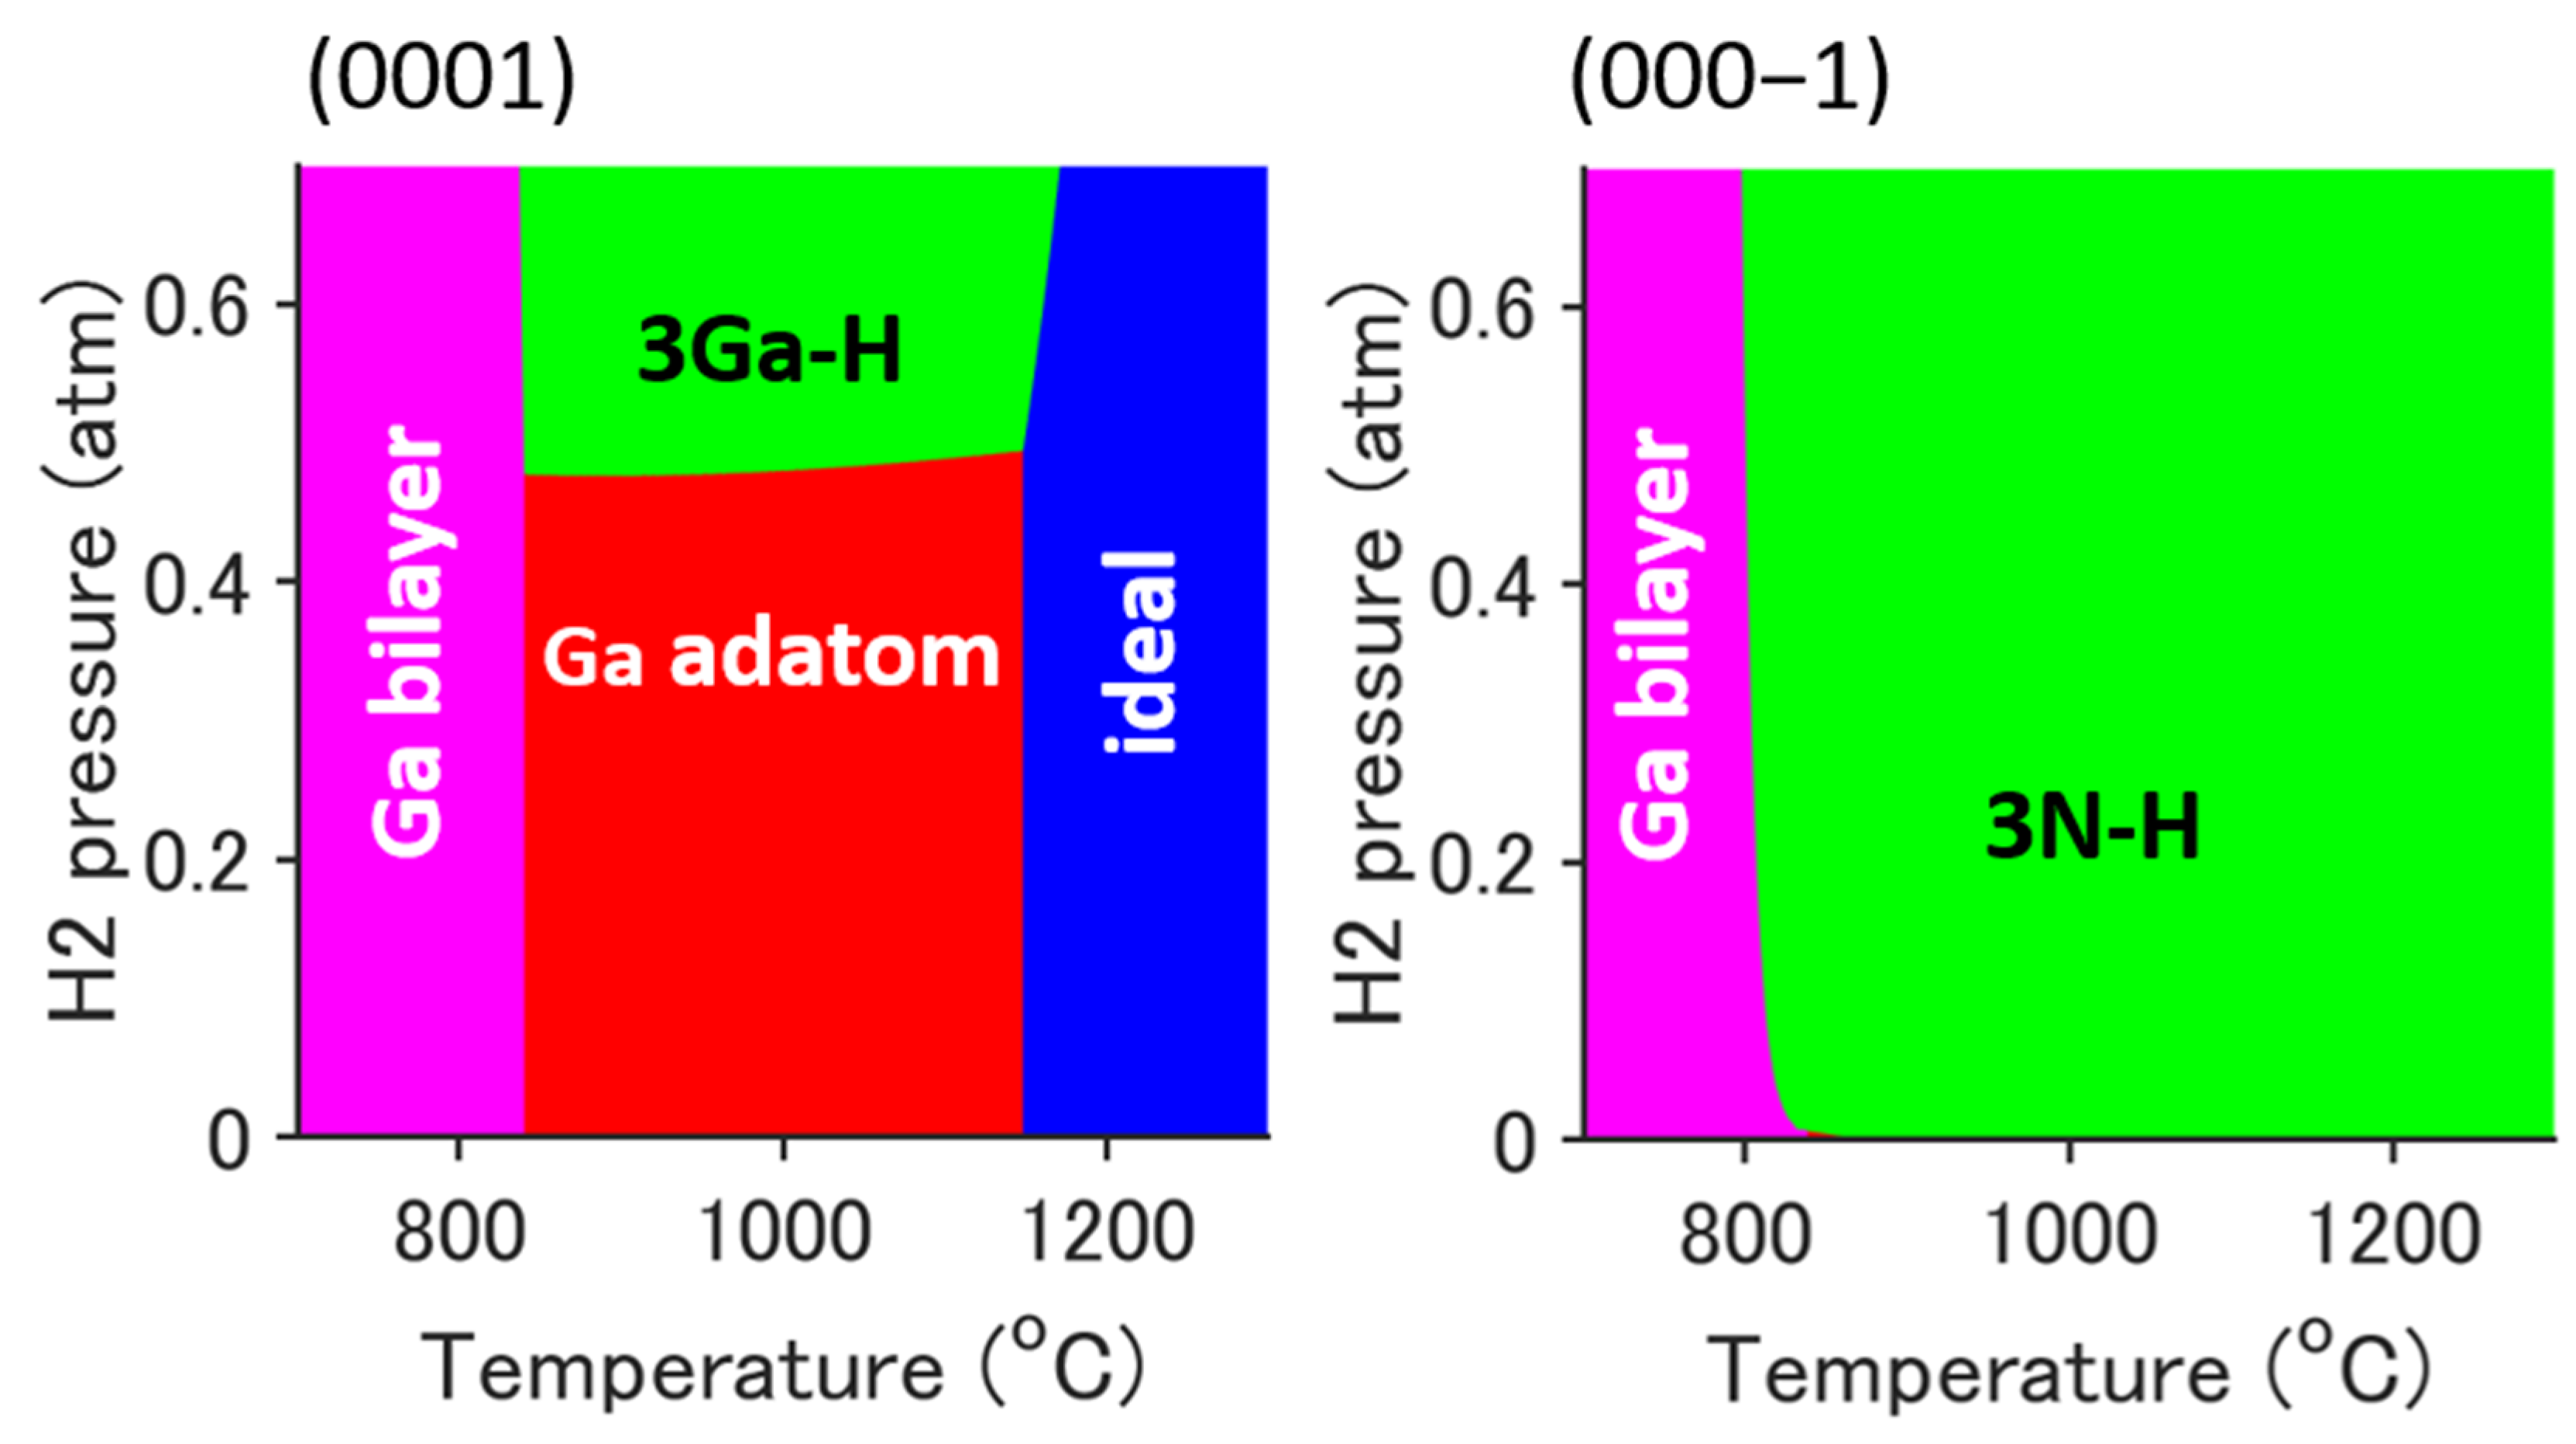
Abstract
:1. Introduction
2. Adsorption Structure
2.1. Reconstructed Surface During the MOVPE Process
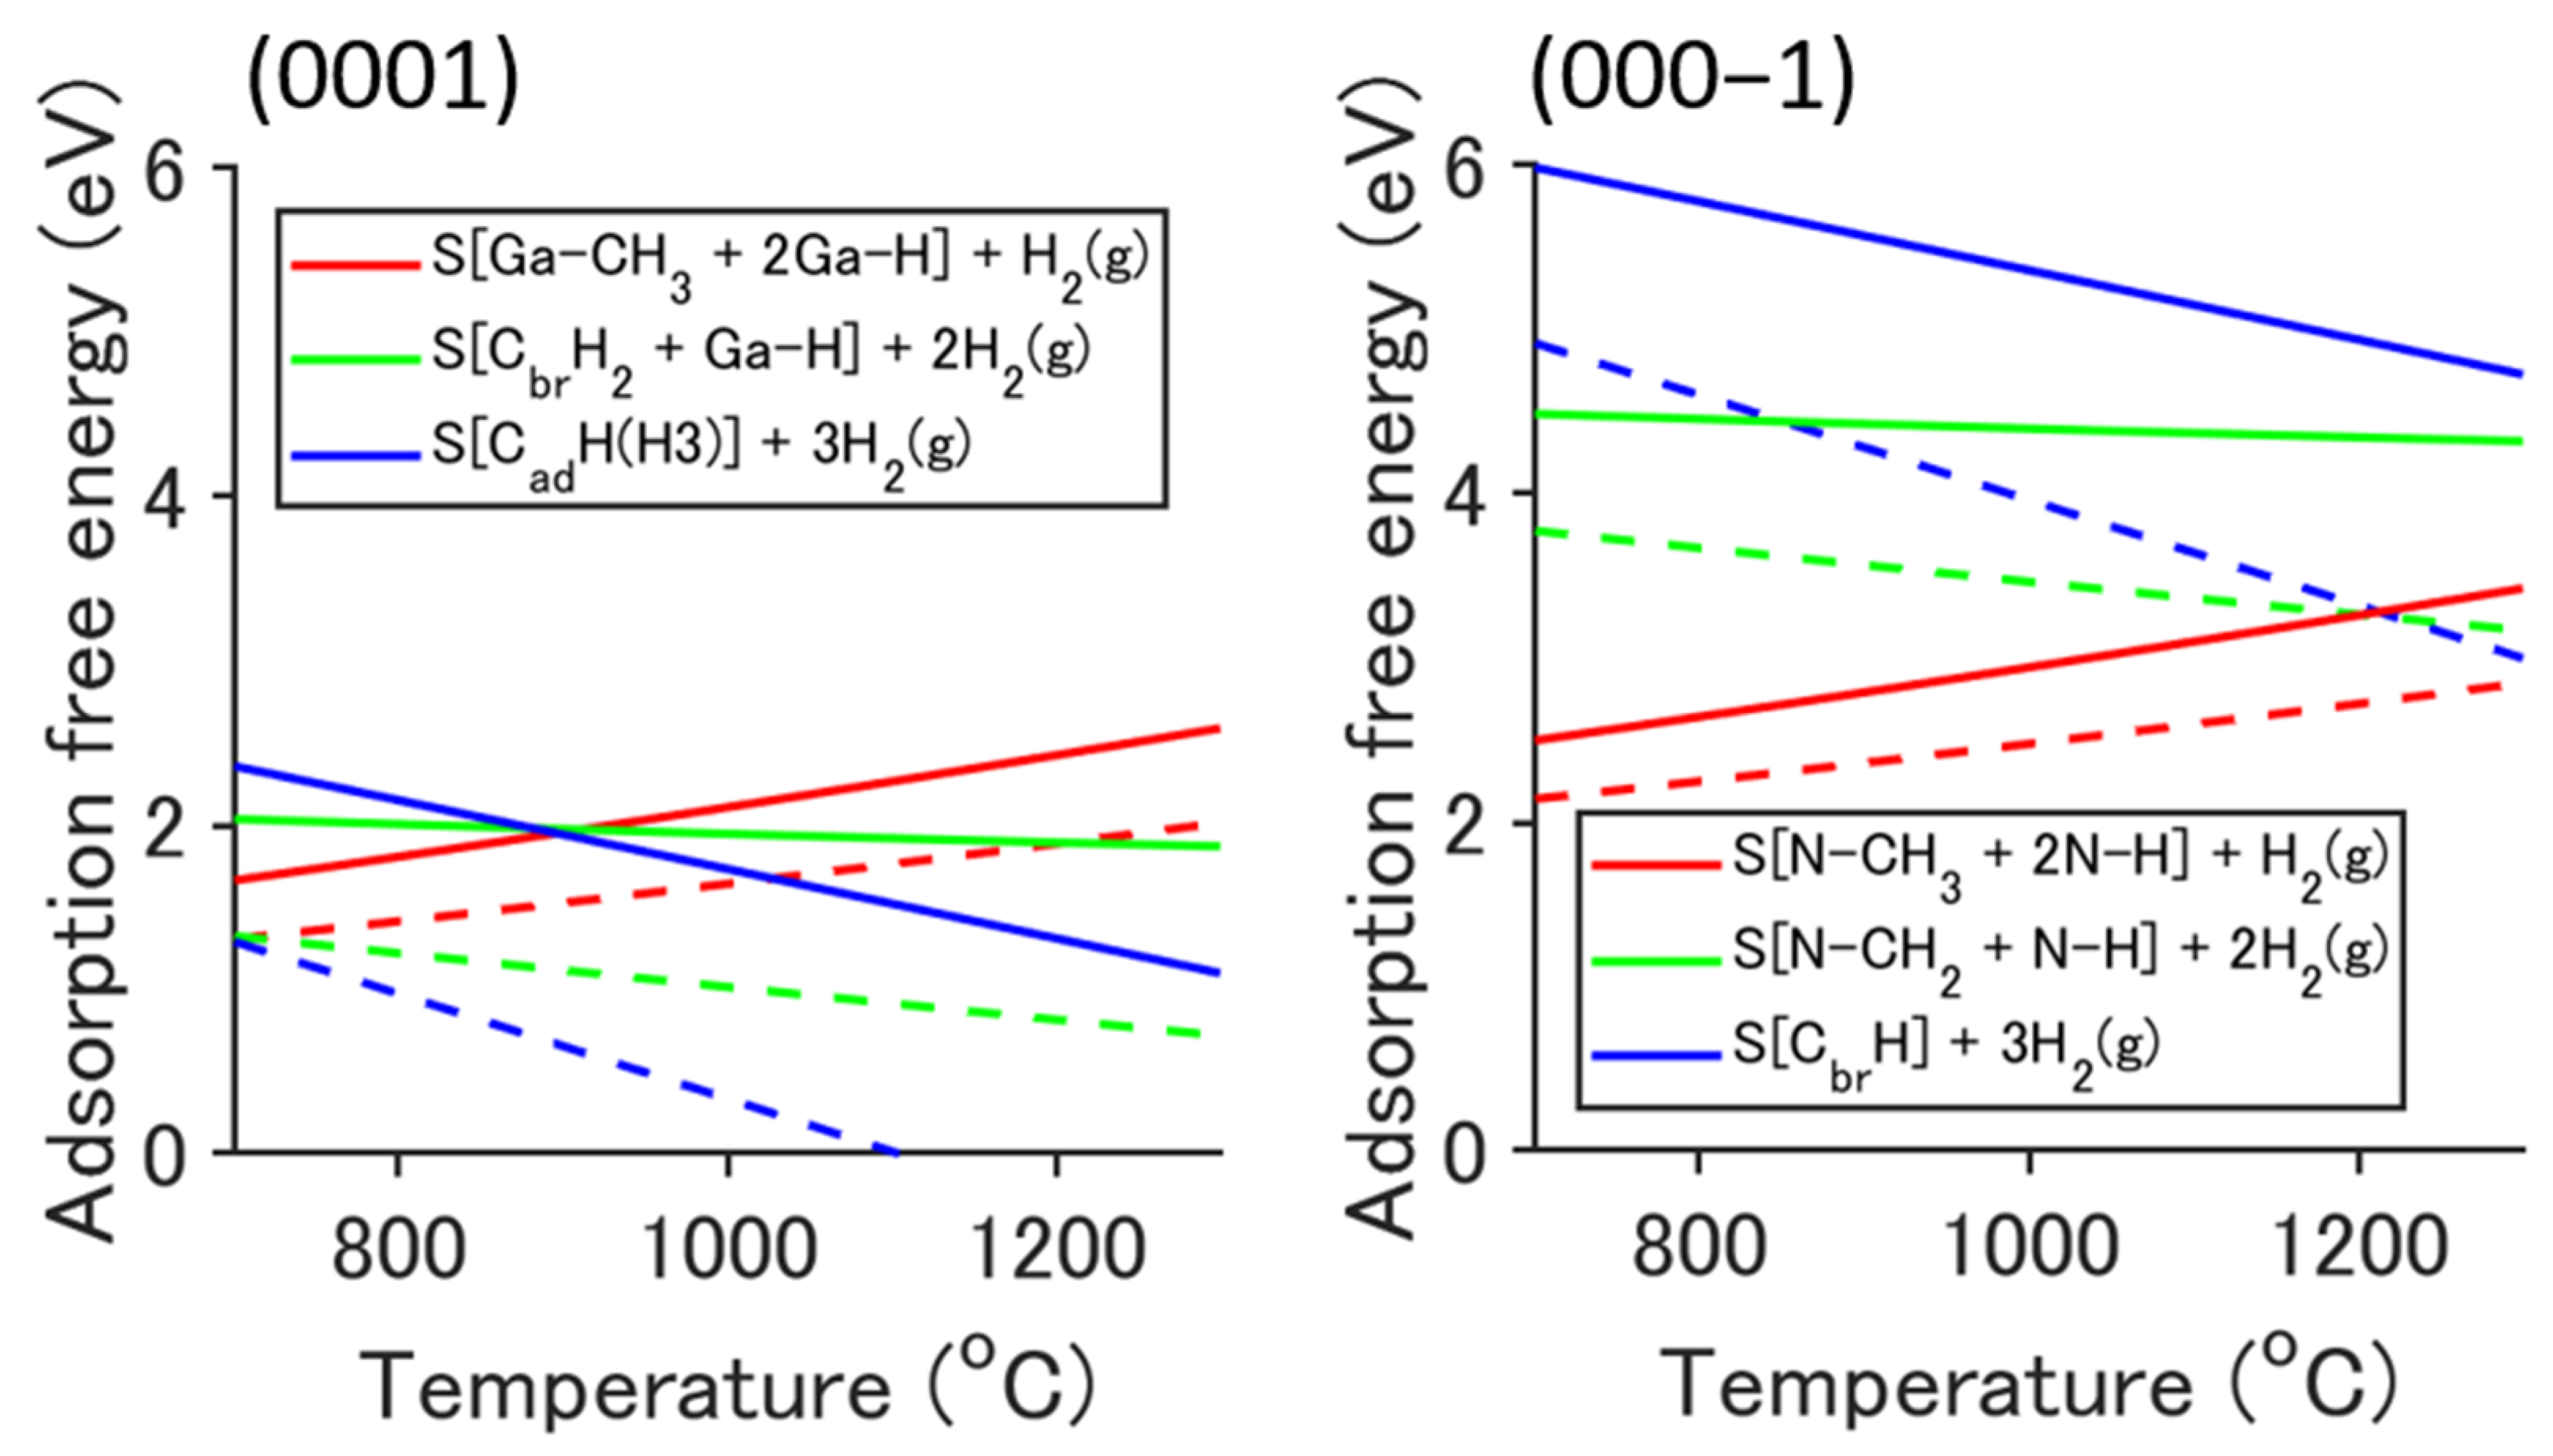
2.2. Adsorption Structure and Its Stabilization
3. Adsorption Probability
3.1. Steepest-Entropy-Ascent Quantum Thermodynamics
3.2. System Definition and Calculation Condition
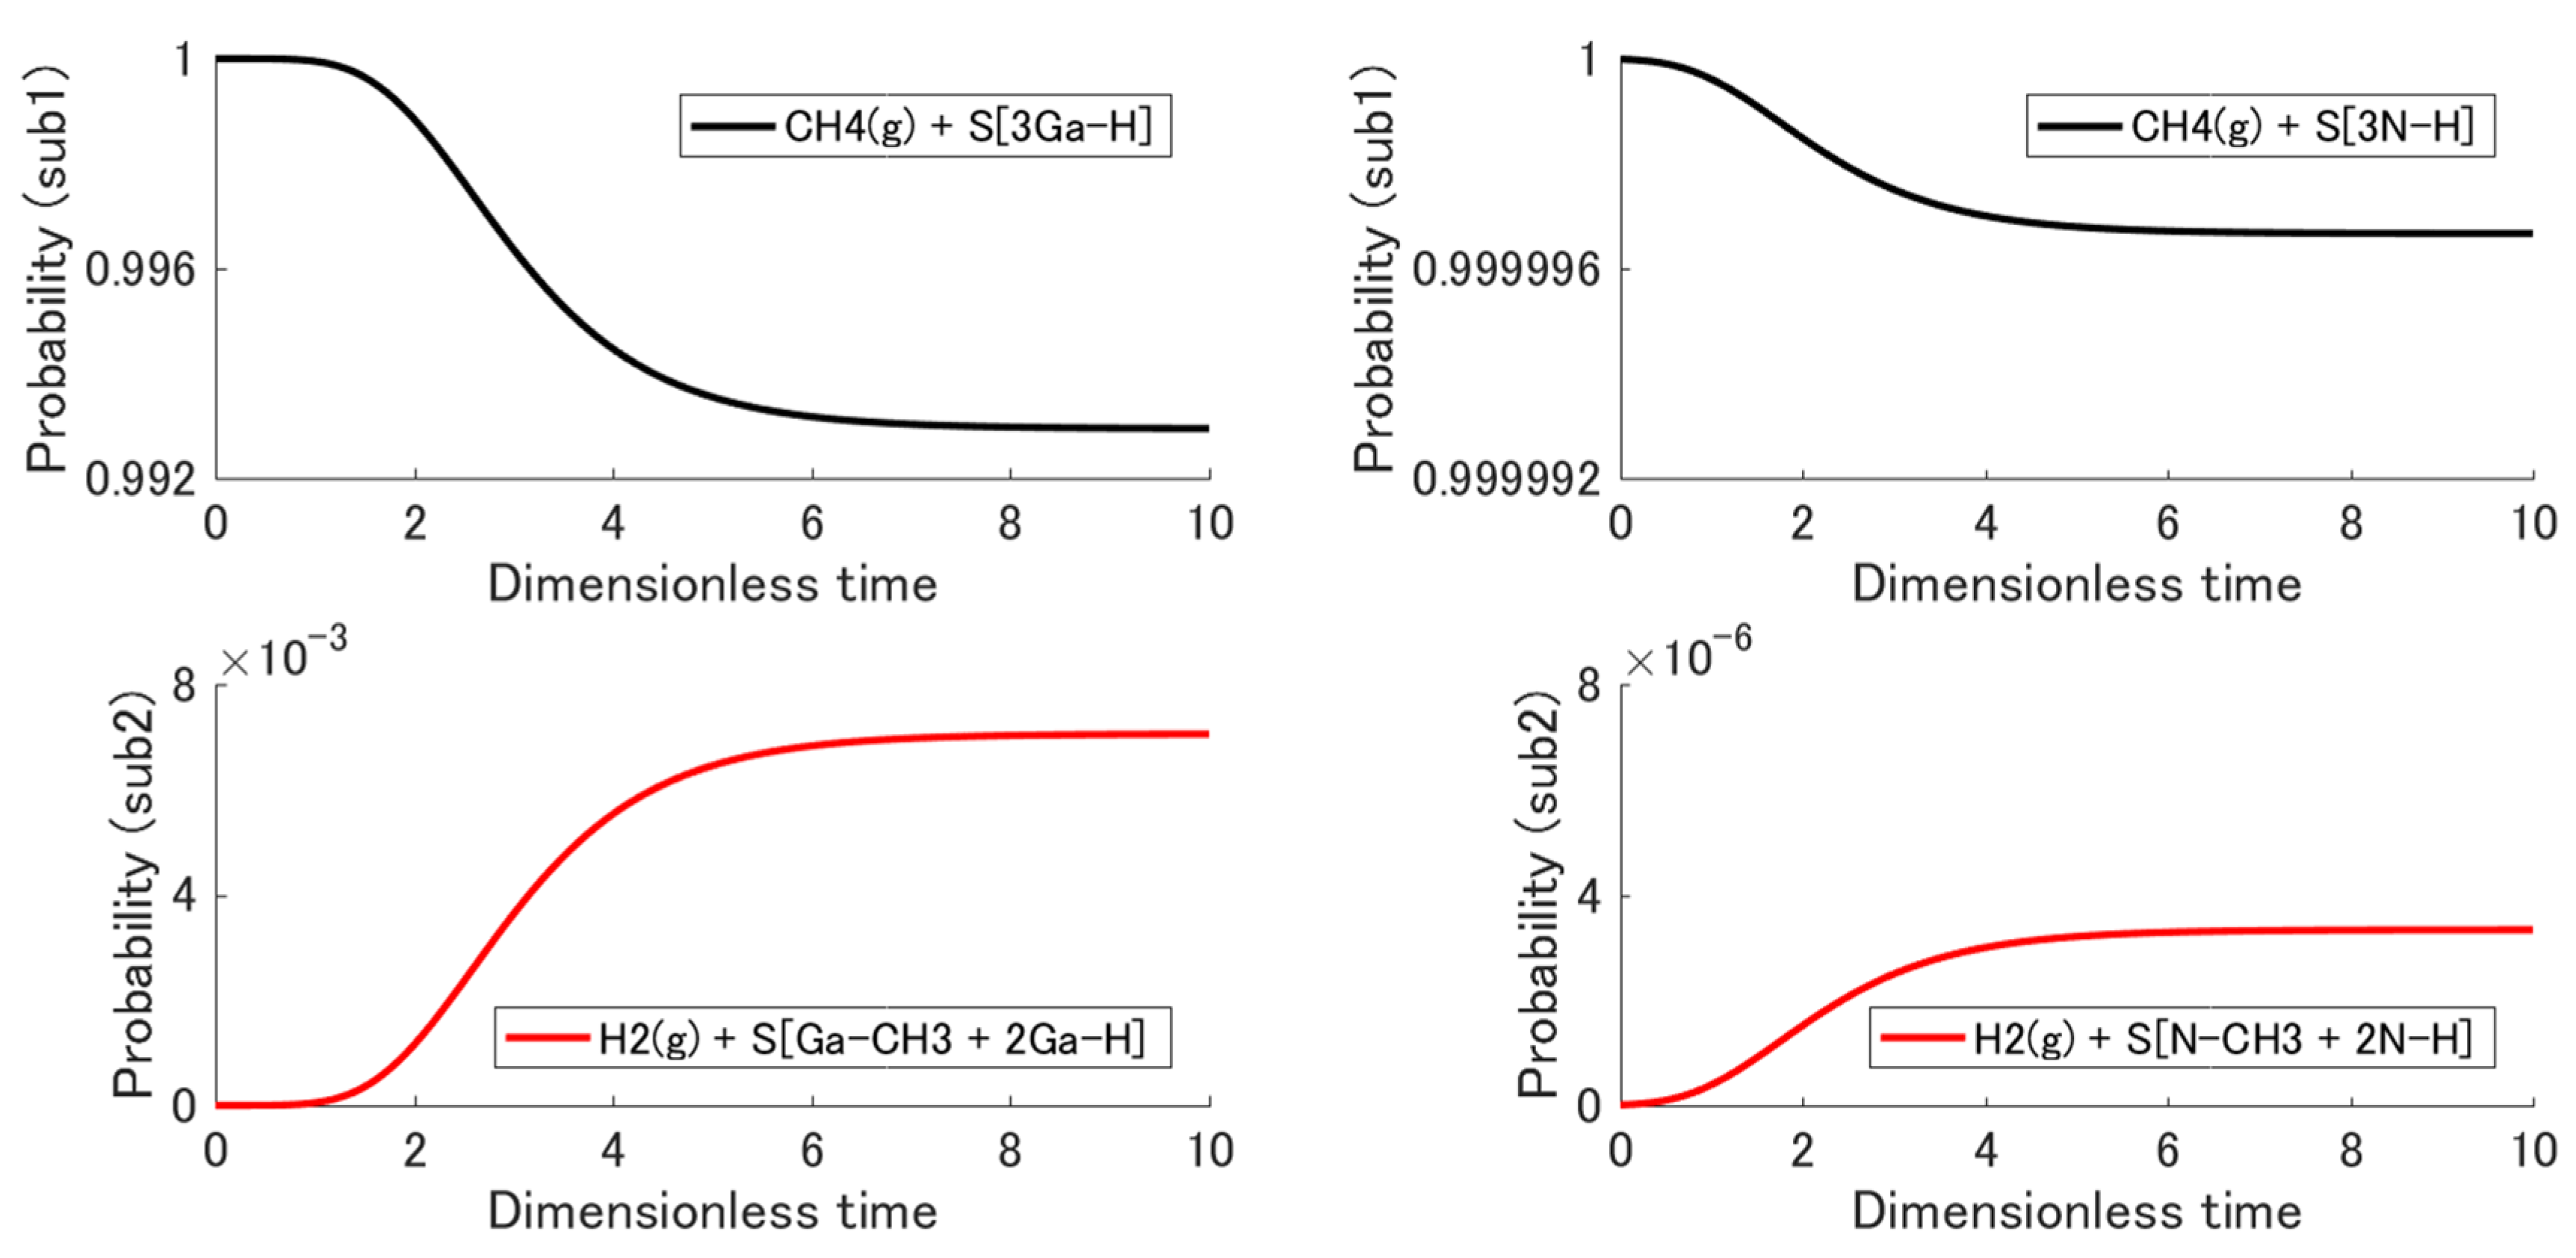
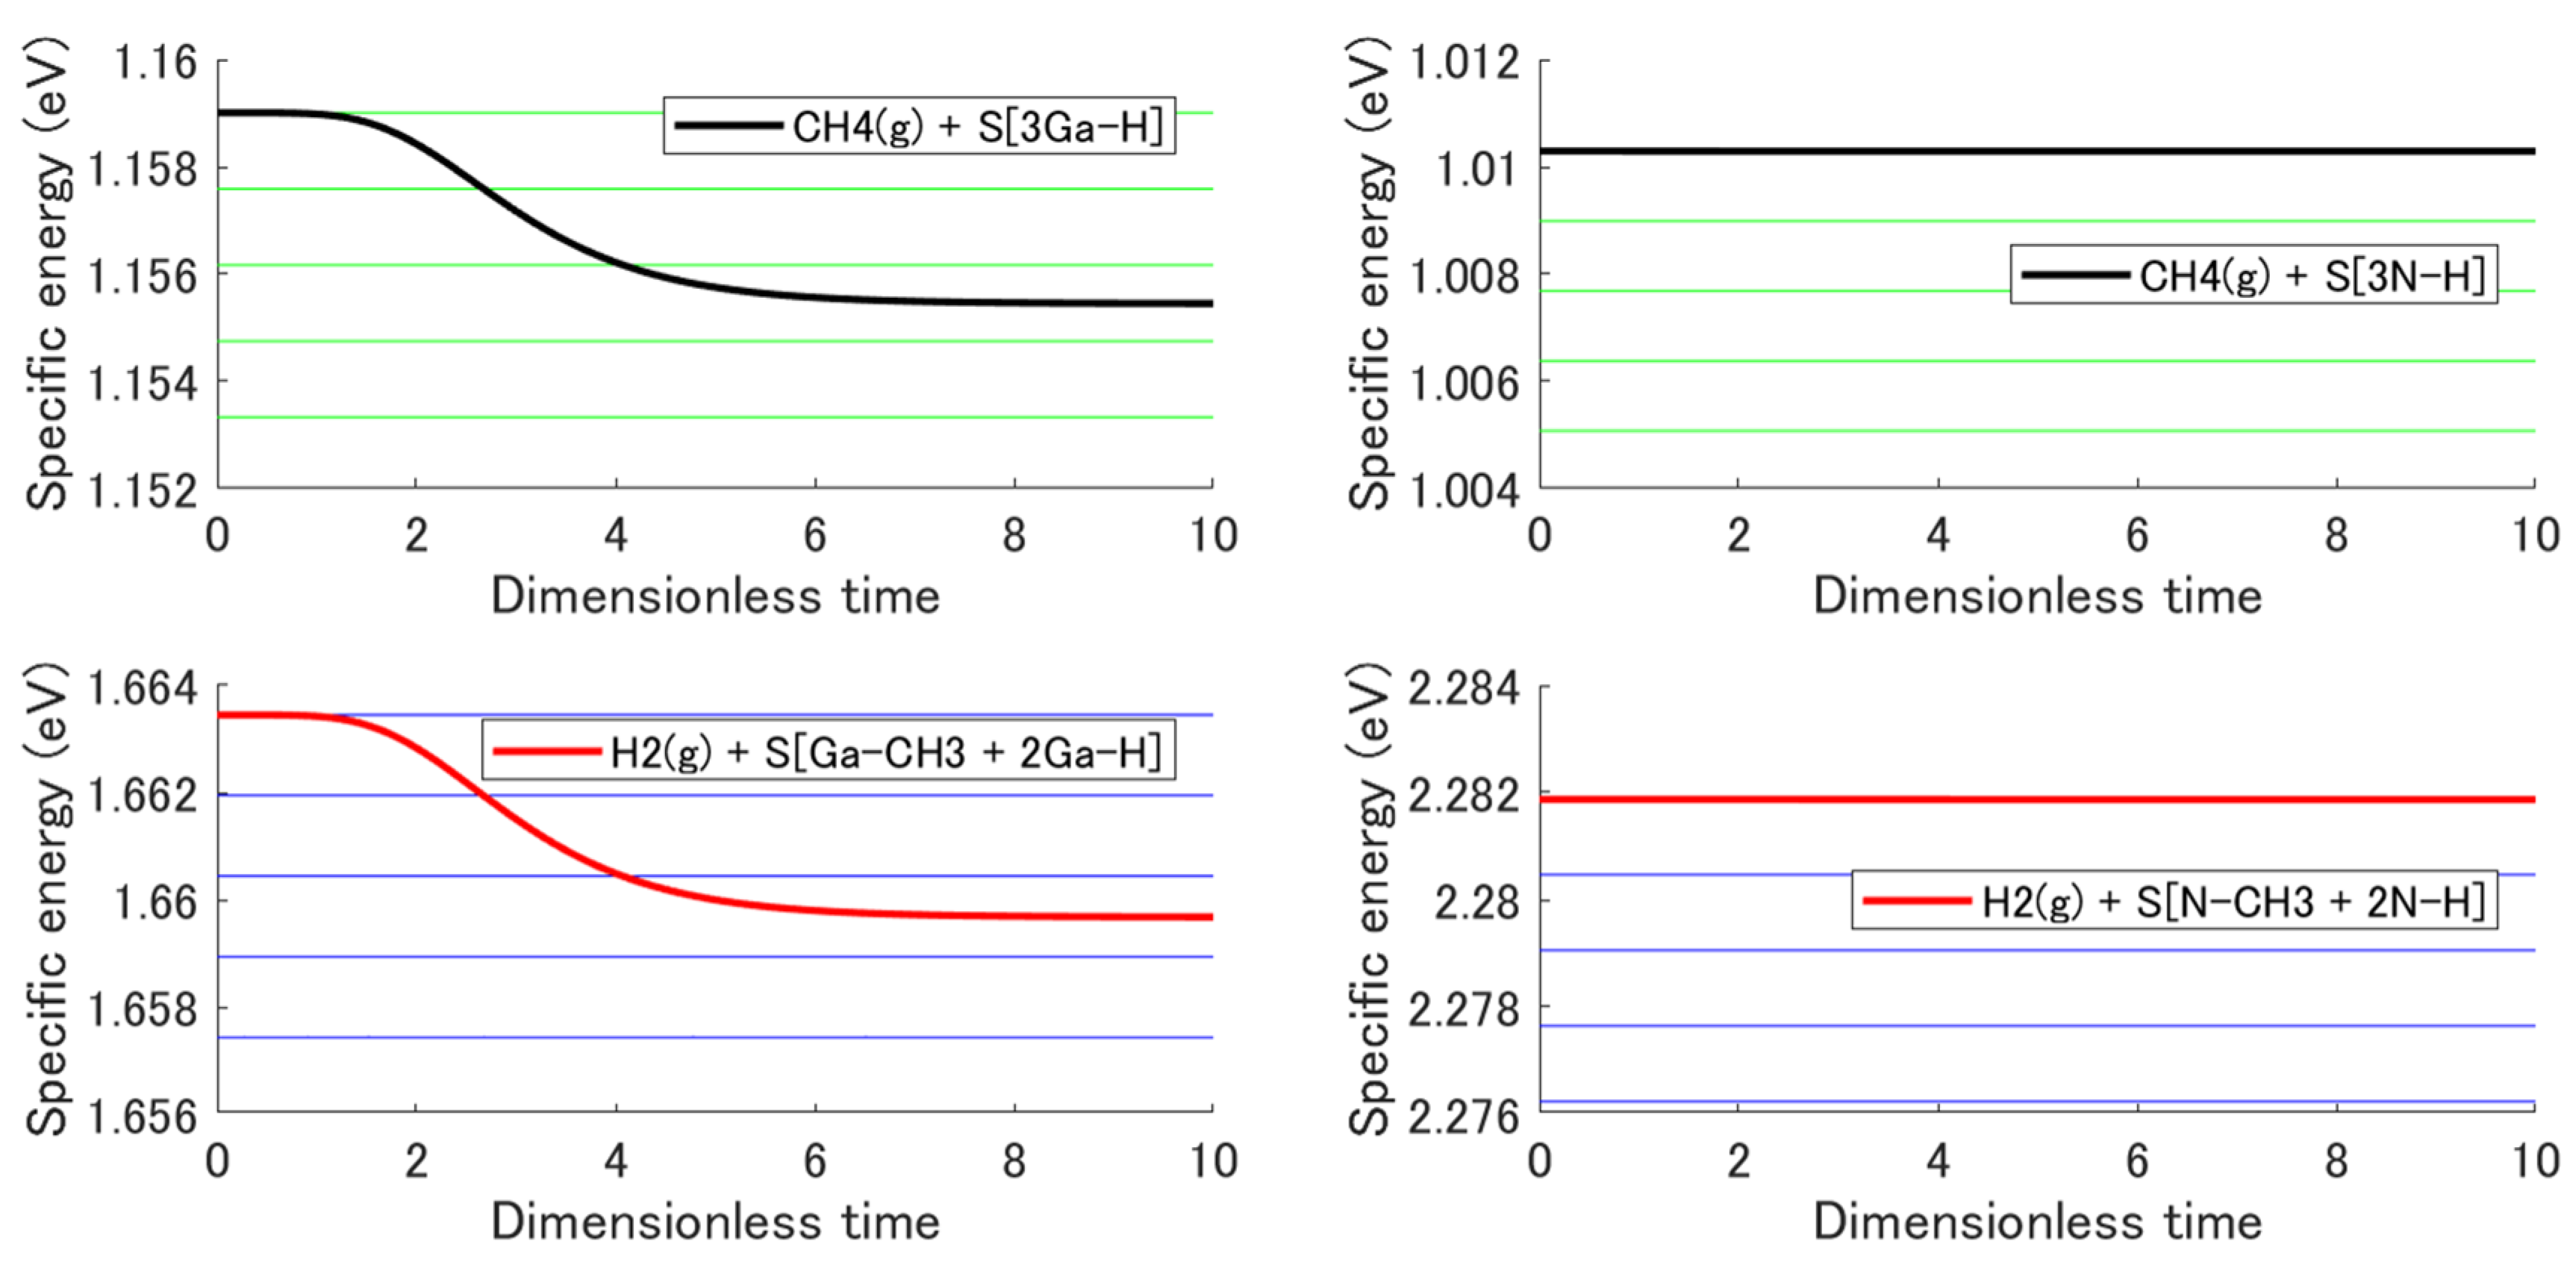
3.3. Non-Equilibrium State Evolution
4. Impurity Concentration
5. Conclusions
Author Contributions
Funding
Conflicts of Interest
References
- Amano, H.; Baines, Y.; Beam, E.; Borga, M.; Bouchet, T.; Chalker, P.R.; Charles, M.; Chen, K.J.; Chowdhury, N.; Chu, R.; et al. The 2018 GaN Power Electronics Roadmap. J. Phys. D Appl. Phys. 2018, 51, 163001. [Google Scholar] [CrossRef]
- Kachi, T. Recent Progress of GaN Power Devices for Automotive Applications. Jpn. J. Appl. Phys. 2014, 53, 100210. [Google Scholar] [CrossRef]
- Sekiguchi, K.; Shirakawa, H.; Chokawa, K.; Araidai, M.; Kangawa, Y.; Kakimoto, K.; Shiraishi, K. Thermodynamic Analysis of Trimethylgallium Decomposition during GaN Metal Organic Vapor Phase Epitaxy. Jpn. J. Appl. Phys. 2018, 57, 04FJ03. [Google Scholar] [CrossRef]
- Nagamatsu, K.; Nitta, S.; Ye, Z.; Nagao, H.; Miki, S.; Honda, Y.; Amano, H. Decomposition of Trimethylgallium and Adduct Formation in a Metalorganic Vapor Phase Epitaxy Reactor Analyzed by High-Resolution Gas Monitoring System. Phys. Status Solidi B 2017, 254, 1600737. [Google Scholar] [CrossRef]
- Ikenaga, K.; Mishima, A.; Yano, Y.; Tabuchi, T.; Matsumoto, K. Growth of Silicon-Doped Al0.6Ga0.4N with Low Carbon Concentration at High Growth Rate Using High-Flow-Rate Metal Organic Vapor Phase Epitaxy Reactor. Jpn. J. Appl. Phys. 2016, 55, 05FE04. [Google Scholar] [CrossRef]
- Kaess, F.; Mita, S.; Xie, J.; Reddy, P.; Klump, A.; Hernandez-Balderrama, L.H.; Washiyama, S.; Franke, A.; Kirste, R.; Hoffmann, A.; et al. Correlation between Mobility Collapse and Carbon Impurities in Si-Doped GaN Grown by Low Pressure Metalorganic Chemical Vapor Deposition. J. Appl. Phys. 2016, 120, 105701. [Google Scholar] [CrossRef]
- Kangawa, Y.; Ito, T.; Taguchi, A.; Shiraishi, K.; Ohachi, T. A New Theoretical Approach to Adsorption–Desorption Behavior of Ga on GaAs Surfaces. Surf. Sci. 2001, 493, 178–181. [Google Scholar] [CrossRef]
- Kangawa, Y.; Akiyama, T.; Ito, T.; Shiraishi, K.; Nakayama, T. Surface Stability and Growth Kinetics of Compound Semiconductors: An Ab Initio-Based Approach. Materials 2013, 6, 3309–3360. [Google Scholar] [CrossRef] [Green Version]
- Akiyama, T.; Ito, T.; Kangawa, Y.; Nakayama, T.; Shiraishi, K. Epitaxial Growth of III-Nitride Compounds: Computational Approach; Matsuoka, T., Kangawa, Y., Eds.; Springer Series in Materials Science; Springer International Publishing: Basel, Switzerland, 2018; ISBN 978-3-319-76640-9. [Google Scholar]
- Northrup, J.E.; Di Felice, R.; Neugebauer, J. Energetics of H and NH2 on GaN(10−10) and Implications for the Origin of Nanopipe Defects. Phys. Rev. B 1997, 56, R4325–R4328. [Google Scholar] [CrossRef]
- Northrup, J.E.; Neugebauer, J. Strong Affinity of Hydrogen for the GaN(000−1) Surface: Implications for Molecular Beam Epitaxy and Metalorganic Chemical Vapor Deposition. Appl. Phys. Lett. 2004, 85, 3429–3431. [Google Scholar] [CrossRef]
- Van de Walle, C.G.; Neugebauer, J. First-Principles Surface Phase Diagram for Hydrogen on GaN Surfaces. Phys. Rev. Lett. 2002, 88, 066103. [Google Scholar] [CrossRef]
- Van de Walle, C.G.; Neugebauer, J. Structure and Energetics of Nitride Surfaces under MOCVD Growth Conditions. J. Cryst. Growth 2003, 248, 8–13. [Google Scholar] [CrossRef]
- Ito, T.; Akiyama, T.; Nakamura, K. Ab Initio-Based Approach to Structural Change of Compound Semiconductor Surfaces during MBE Growth. J. Cryst. Growth 2009, 311, 698–701. [Google Scholar] [CrossRef]
- Ito, T.; Akiyama, T.; Nakamura, K. An Ab Initio-Based Approach to the Stability of GaN(0001) Surfaces under Ga-Rich Conditions. J. Cryst. Growth 2009, 311, 3093–3096. [Google Scholar] [CrossRef]
- Akiyama, T.; Ammi, D.; Nakamura, K.; Ito, T. Surface Reconstruction and Magnesium Incorporation on Semipolar GaN(1−101) Surfaces. Phys. Rev. B 2010, 81, 245317. [Google Scholar] [CrossRef]
- Akiyama, T.; Nakamura, K.; Ito, T. Stability of Carbon Incorpoated Semipolar GaN(1101) Surface. Jpn. J. Appl. Phys. 2011, 50, 080216. [Google Scholar] [CrossRef]
- Kempisty, P.; Strak, P.; Sakowski, K.; Krukowski, S. Thermodynamics of GaN(s)-NH3(v)+N2(v)+H2(v) System—Electronic Aspects of the Processes at GaN(0001) Surface. Surf. Sci. 2017, 662, 12–33. [Google Scholar] [CrossRef]
- Kusaba, A.; Kangawa, Y.; Kempisty, P.; Valencia, H.; Shiraishi, K.; Kumagai, Y.; Kakimoto, K.; Koukitu, A. Thermodynamic Analysis of (0001) and GaN Metalorganic Vapor Phase Epitaxy. J. Appl. Phys. 2017, 56, 070304. [Google Scholar] [CrossRef]
- Pashley, M.D.; Haberern, K.W.; Friday, W.; Woodall, J.M.; Kirchner, P.D. Structure of GaAs(001) (2 × 4) -c(2 × 8) Determined by Scanning Tunneling Microscopy. Phys. Rev. Lett. 1988, 60, 2176–2179. [Google Scholar] [CrossRef]
- Delley, B. An All-electron Numerical Method for Solving the Local Density Functional for Polyatomic Molecules. J. Chem. Phys. 1990, 92, 508–517. [Google Scholar] [CrossRef]
- Delley, B. From Molecules to Solids with the DMol3 Approach. J. Chem. Phys. 2000, 113, 7756–7764. [Google Scholar] [CrossRef]
- Perdew, J.P.; Burke, K.; Ernzerhof, M. Generalized Gradient Approximation Made Simple. Phys. Rev. Lett. 1996, 77, 3865–3868. [Google Scholar] [CrossRef] [PubMed]
- Shiraishi, K. A New Slab Model Approach for Electronic Structure Calculation of Polar Semiconductor Surface. J. Phys. Soc. Jpn. 1990, 59, 3455–3458. [Google Scholar] [CrossRef]
- Monkhorst, H.J.; Pack, J.D. Special Points for Brillouin-Zone Integrations. Phys. Rev. B 1976, 13, 5188–5192. [Google Scholar] [CrossRef]
- Beretta, G.P.; Gyftopoulos, E.P.; Park, J.L.; Hatsopoulos, G.N. Quantum Thermodynamics. A New Equation of Motion for a Single Constituent of Matter. Nuovo Cim B 1984, 82, 169–191. [Google Scholar] [CrossRef]
- Beretta, G.P.; Gyftopoulos, E.P.; Park, J.L. Quantum Thermodynamics. A New Equation of Motion for a General Quantum System. Nuov Cim B 1985, 87, 77–97. [Google Scholar] [CrossRef]
- Beretta, G.P. Nonlinear Model Dynamics for Closed-System, Constrained, Maximal-Entropy-Generation Relaxation by Energy Redistribution. Phys. Rev. E 2006, 73, 026113. [Google Scholar] [CrossRef]
- Beretta, G.P. Nonlinear Quantum Evolution Equations to Model Irreversible Adiabatic Relaxation with Maximal Entropy Production and Other Nonunitary Processes. Rep. Math. Phys. 2009, 64, 139–168. [Google Scholar] [CrossRef]
- Beretta, G.P. Steepest Entropy Ascent Model for Far-Nonequilibrium Thermodynamics: Unified Implementation of the Maximum Entropy Production Principle. Phys. Rev. E 2014, 90, 042113. [Google Scholar] [CrossRef] [PubMed]
- Montefusco, A.; Consonni, F.; Beretta, G.P. Essential Equivalence of the General Equation for the Nonequilibrium Reversible-Irreversible Coupling (GENERIC) and Steepest-Entropy-Ascent Models of Dissipation for Nonequilibrium Thermodynamics. Phys. Rev. E 2015, 91, 042138. [Google Scholar] [CrossRef]
- Smith, C.E.; von Spakovsky, M.R. Comparison of the Non-Equilibrium Predictions of Intrinsic Quantum Thermodynamics at the Atomistic Level with Experimental Evidence. J. Phys. Conf. Ser. 2012, 380, 012015. [Google Scholar] [CrossRef]
- Cano-Andrade, S.; von Spakovsky, M.R.; Beretta, G.P. Steepest-Entropy-Ascent Quantum Thermodynamic Non-Equilibrium Modeling of Decoherence of a Composite System of Two Interacting Spin-½ Systems. In Proceedings of the ASME 2013 International Mechanical Engineering Congress and Exposition, San Diego, CA, USA, 15–21 November 2013; p. V08BT09A043. [Google Scholar] [CrossRef]
- von Spakovsky, M.R.; Gemmer, J. Some Trends in Quantum Thermodynamics. Entropy 2014, 16, 3434–3470. [Google Scholar] [CrossRef] [Green Version]
- Cano-Andrade, S.; Beretta, G.P.; von Spakovsky, M.R. Steepest-Entropy-Ascent Quantum Thermodynamic Modeling of Decoherence in Two Different Microscopic Composite Systems. Phys. Rev. A 2015, 91, 013848. [Google Scholar] [CrossRef]
- Beretta, G.P.; Al-Abbasi, O.; von Spakovsky, M.R. Steepest-Entropy-Ascent Nonequilibrium Quantum Thermodynamic Framework to Model Chemical Reaction Rates at an Atomistic Level. Phys. Rev. E 2017, 95, 042139. [Google Scholar] [CrossRef] [PubMed]
- Yamada, R.; von Spakovsky, M.R.; Reynolds, W.T. A Method for Predicting Non-Equilibrium Thermal Expansion Using Steepest-Entropy-Ascent Quantum Thermodynamics. J. Phys. Condens. Matter 2018, 30, 325901. [Google Scholar] [CrossRef] [PubMed]
- Li, G.; Al-Abbasi, O.; von Spakovsky, M.R. Atomistic-Level Non-Equilibrium Model for Chemically Reactive Systems Based on Steepest-Entropy-Ascent Quantum Thermodynamics. J. Phys. Conf. Ser. 2014, 538, 012013. [Google Scholar] [CrossRef]
- Li, G.; von Spakovsky, M.R. Application of Steepest-Entropy-Ascent Quantum Thermodynamics to Predicting Heat and Mass Diffusion From the Atomistic Up to the Macroscopic Level. In Proceedings of the ASME 2015 International Mechanical Engineering Congress and Exposition, Houston, TX, USA, 13–19 November 2015; p. V06BT07A015. [Google Scholar] [CrossRef]
- Li, G.; von Spakovsky, M.R. Study of the Transient Behavior and Microstructure Degradation of a SOFC Cathode Using an Oxygen Reduction Model Based on Steepest-Entropy-Ascent Quantum Thermodynamics. In Proceedings of the ASME 2015 International Mechanical Engineering Congress and Exposition, Houston, TX, USA, 13–19 November 2015; p. V06BT07A016. [Google Scholar] [CrossRef]
- Li, G.; von Spakovsky, M.R. Steepest-Entropy-Ascent Quantum Thermodynamic Modeling of the Relaxation Process of Isolated Chemically Reactive Systems Using Density of States and the Concept of Hypoequilibrium State. Phys. Rev. E 2016, 93, 012137. [Google Scholar] [CrossRef] [PubMed]
- Li, G.; von Spakovsky, M.R. Generalized Thermodynamic Relations for a System Experiencing Heat and Mass Diffusion in the Far-from-Equilibrium Realm Based on Steepest Entropy Ascent. Phys. Rev. E 2016, 94, 032117. [Google Scholar] [CrossRef] [PubMed]
- Li, G.; von Spakovsky, M.R. Modeling the Nonequilibrium Effects in a Nonquasi-Equilibrium Thermodynamic Cycle Based on Steepest Entropy Ascent and an Isothermal-Isobaric Ensemble. Energy 2016, 115, 498–512. [Google Scholar] [CrossRef]
- Li, G.; von Spakovsky, M.R. Steepest-Entropy-Ascent Model of Mesoscopic Quantum Systems Far from Equilibrium along with Generalized Thermodynamic Definitions of Measurement and Reservoir. Phys. Rev. E 2018, 98, 042113. [Google Scholar] [CrossRef]
- Li, G.; von Spakovsky, M.R. Study of Nonequilibrium Size and Concentration Effects on the Heat and Mass Diffusion of Indistinguishable Particles Using Steepest-Entropy-Ascent Quantum Thermodynamics. J. Heat Transfer 2017, 139, 122003. [Google Scholar] [CrossRef]
- Li, G.; von Spakovsky, M.R.; Shen, F.; Lu, K. Multiscale Transient and Steady-State Study of the Influence of Microstructure Degradation and Chromium Oxide Poisoning on Solid Oxide Fuel Cell Cathode Performance. J. Non-Equilib. Thermodyn. 2018, 43, 21–42. [Google Scholar] [CrossRef] [Green Version]
- Li, G.; von Spakovsky, M.R.; Hin, C. Steepest Entropy Ascent Quantum Thermodynamic Model of Electron and Phonon Transport. Phys. Rev. B 2018, 97, 024308. [Google Scholar] [CrossRef]
- Gyftopoulos, E.P.; ̧Cubuķcu, E. Entropy: Thermodynamic Definition and Quantum Expression. Phys. Rev. E 1997, 55, 3851–3858. [Google Scholar] [CrossRef]
- Zanchini, E.; Beretta, G.P. Recent Progress in the Definition of Thermodynamic Entropy. Entropy 2014, 16, 1547–1570. [Google Scholar] [CrossRef] [Green Version]
- Kusaba, A.; Li, G.; von Spakovsky, M.R.; Kangawa, Y.; Kakimoto, K. Modeling the Non-Equilibrium Process of the Chemical Adsorption of Ammonia on GaN(0001) Reconstructed Surfaces Based on Steepest-Entropy-Ascent Quantum Thermodynamics. Materials 2017, 10, 948. [Google Scholar] [CrossRef] [PubMed]
- Kempisty, P.; Kangawa, Y.; Kusaba, A.; Shiraishi, K.; Krukowski, S.; Bockowski, M.; Kakimoto, K.; Amano, H. DFT Modeling of Carbon Incorporation in GaN(0001) and GaN(000−1) Metalorganic Vapor Phase Epitaxy. Appl. Phys. Lett. 2017, 111, 141602. [Google Scholar] [CrossRef]
- Fichtenbaum, N.A.; Mates, T.E.; Keller, S.; DenBaars, S.P.; Mishra, U.K. Impurity Incorporation in Heteroepitaxial N-Face and Ga-Face GaN Films Grown by Metalorganic Chemical Vapor Deposition. J. Cryst. Growth 2008, 310, 1124–1131. [Google Scholar] [CrossRef]
- An, Q.; Jaramillo-Botero, A.; Liu, W.-G.; Goddard, W.A. Reaction Pathways of GaN (0001) Growth from Trimethylgallium and Ammonia versus Triethylgallium and Hydrazine Using First Principle Calculations. J. Phys. Chem. C 2015, 119, 4095–4103. [Google Scholar] [CrossRef]


© 2019 by the authors. Licensee MDPI, Basel, Switzerland. This article is an open access article distributed under the terms and conditions of the Creative Commons Attribution (CC BY) license (http://creativecommons.org/licenses/by/4.0/).
Share and Cite
Kusaba, A.; Li, G.; Kempisty, P.; von Spakovsky, M.R.; Kangawa, Y. CH4 Adsorption Probability on GaN(0001) and (000−1) during Metalorganic Vapor Phase Epitaxy and Its Relationship to Carbon Contamination in the Films. Materials 2019, 12, 972. https://doi.org/10.3390/ma12060972
Kusaba A, Li G, Kempisty P, von Spakovsky MR, Kangawa Y. CH4 Adsorption Probability on GaN(0001) and (000−1) during Metalorganic Vapor Phase Epitaxy and Its Relationship to Carbon Contamination in the Films. Materials. 2019; 12(6):972. https://doi.org/10.3390/ma12060972
Chicago/Turabian StyleKusaba, Akira, Guanchen Li, Pawel Kempisty, Michael R. von Spakovsky, and Yoshihiro Kangawa. 2019. "CH4 Adsorption Probability on GaN(0001) and (000−1) during Metalorganic Vapor Phase Epitaxy and Its Relationship to Carbon Contamination in the Films" Materials 12, no. 6: 972. https://doi.org/10.3390/ma12060972