Binary Oxides Prepared by Microwave-Assisted Solution Combustion: Synthesis, Characterization and Catalytic Activity


Abstract
:
1. Introduction
2. Materials and Methods
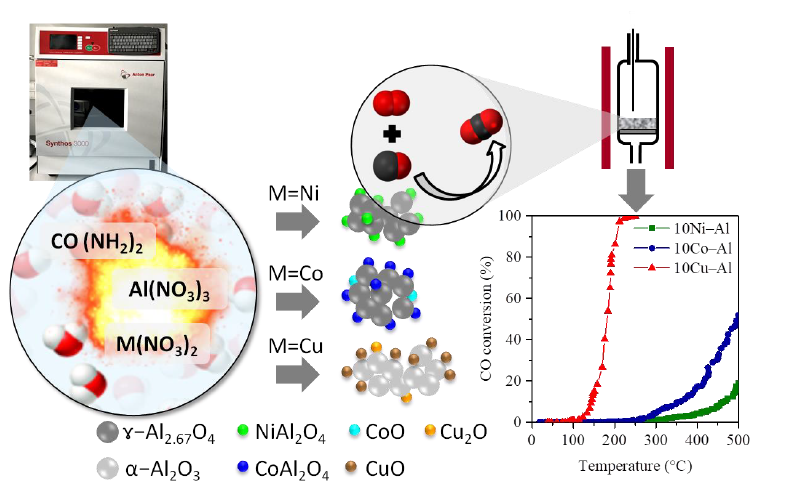
2.1. Materials Preparation
2.2. Materials Characterization
2.3. Catalytic Activity Tests
3. Results and Discussion
3.1. Physico-Chemical Characterization
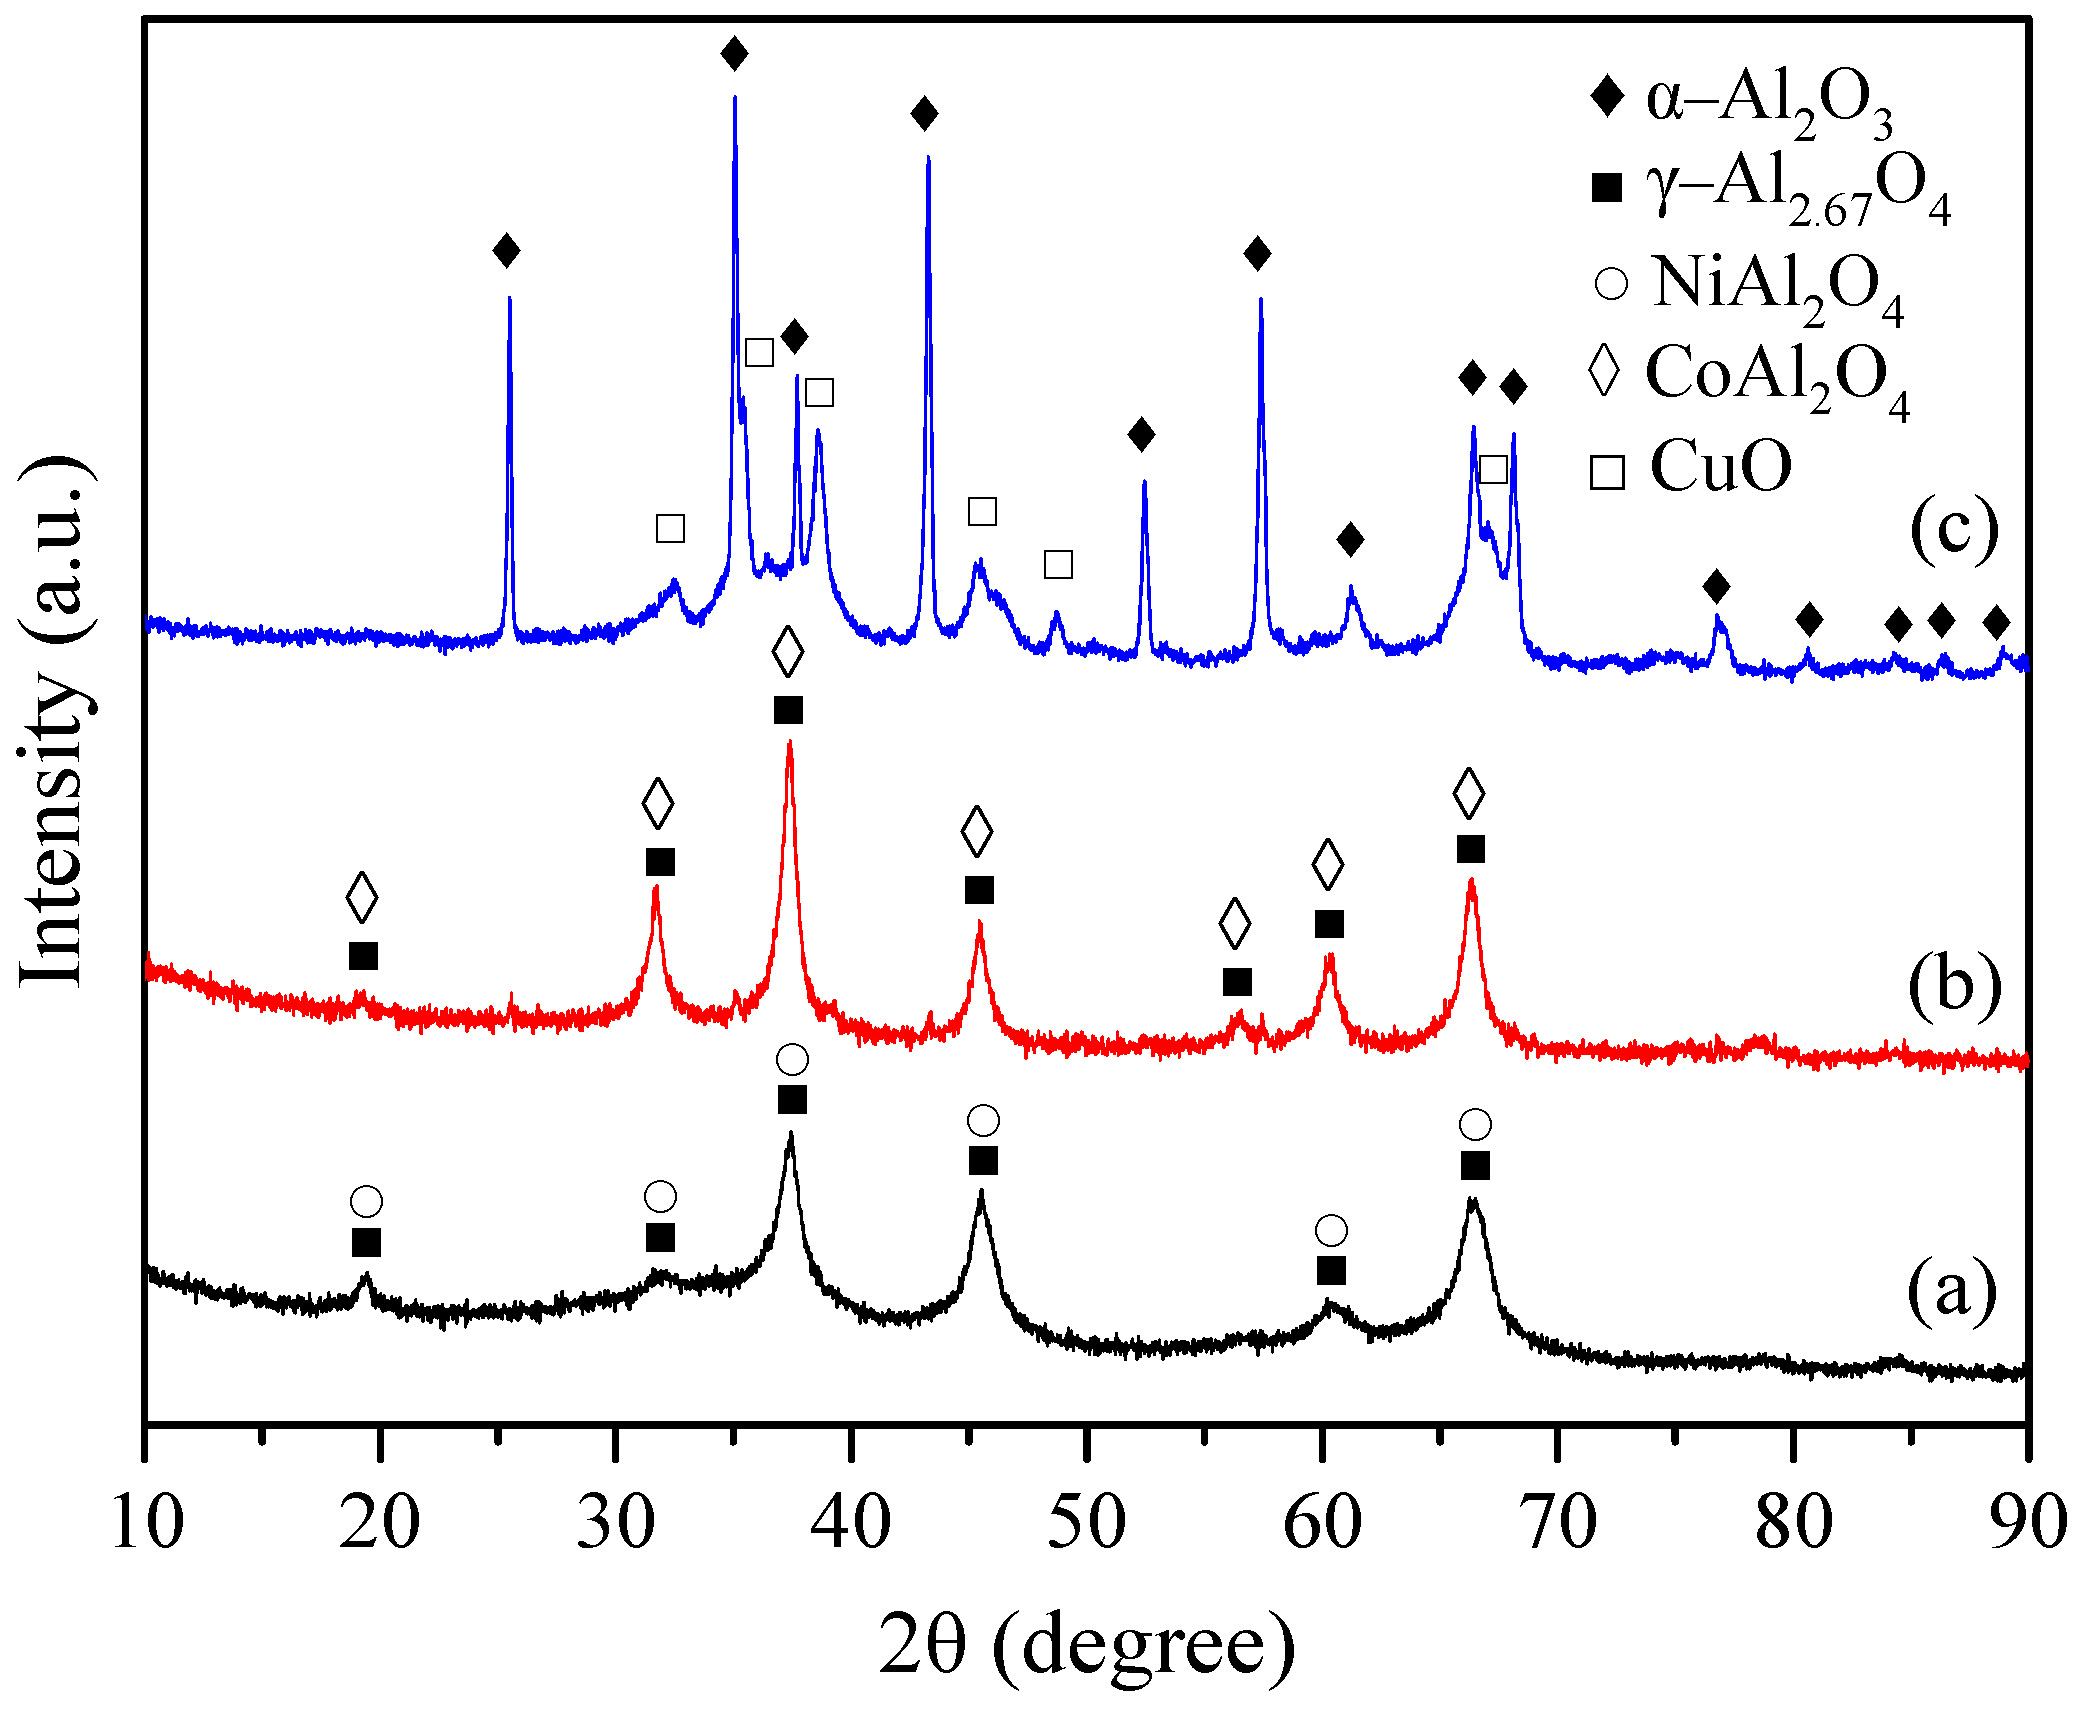
3.1.1. XRD
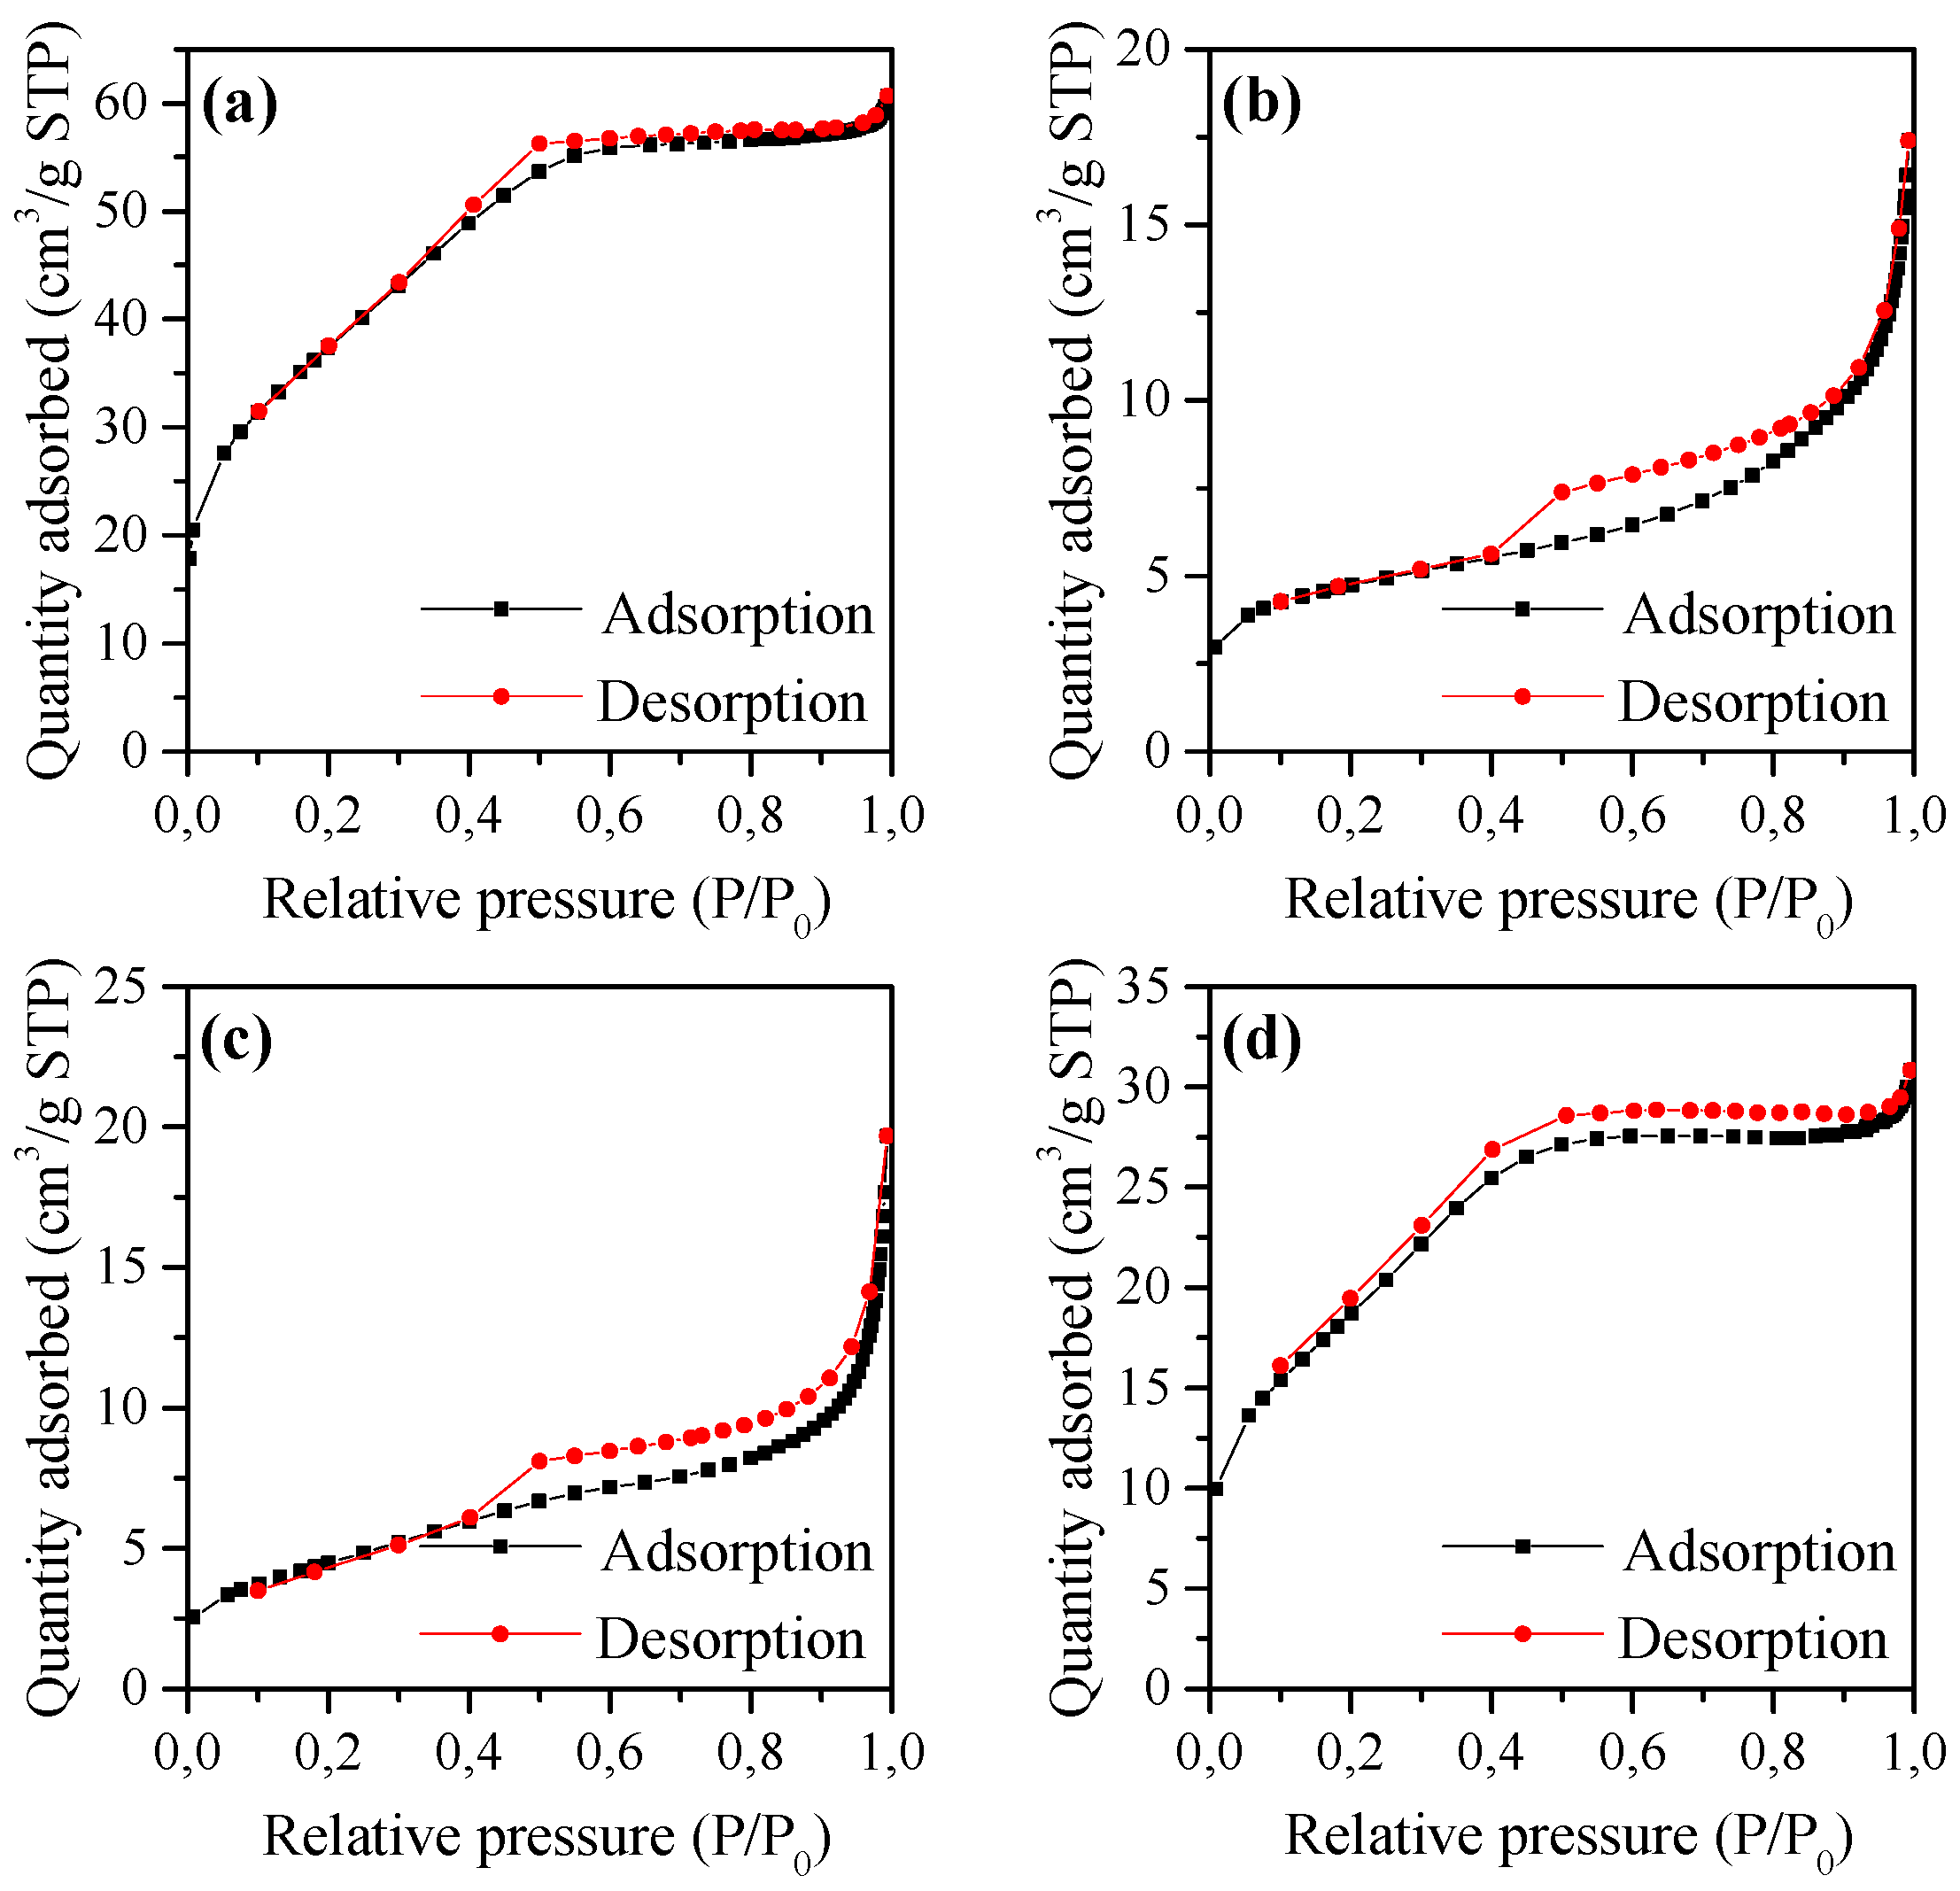
3.1.2. Adsorption/Desorption Isotherms
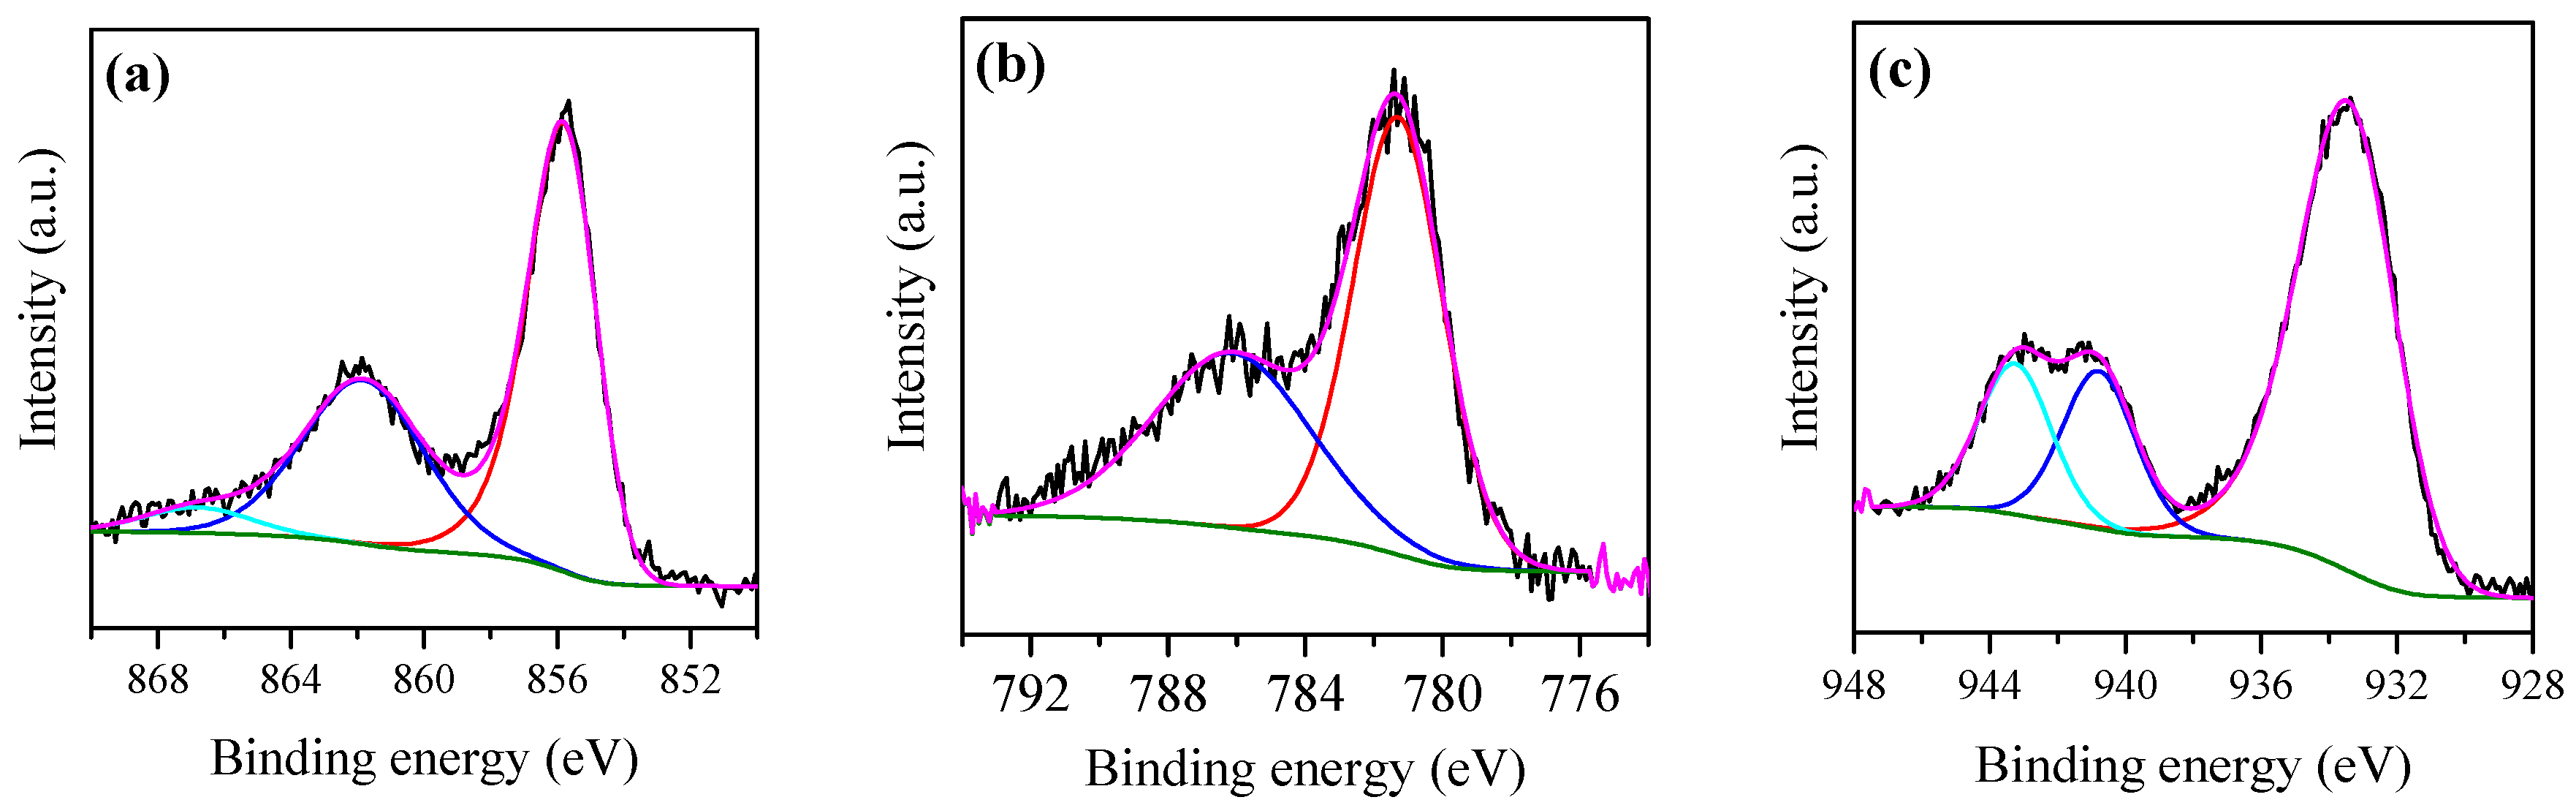
3.1.3. XPS
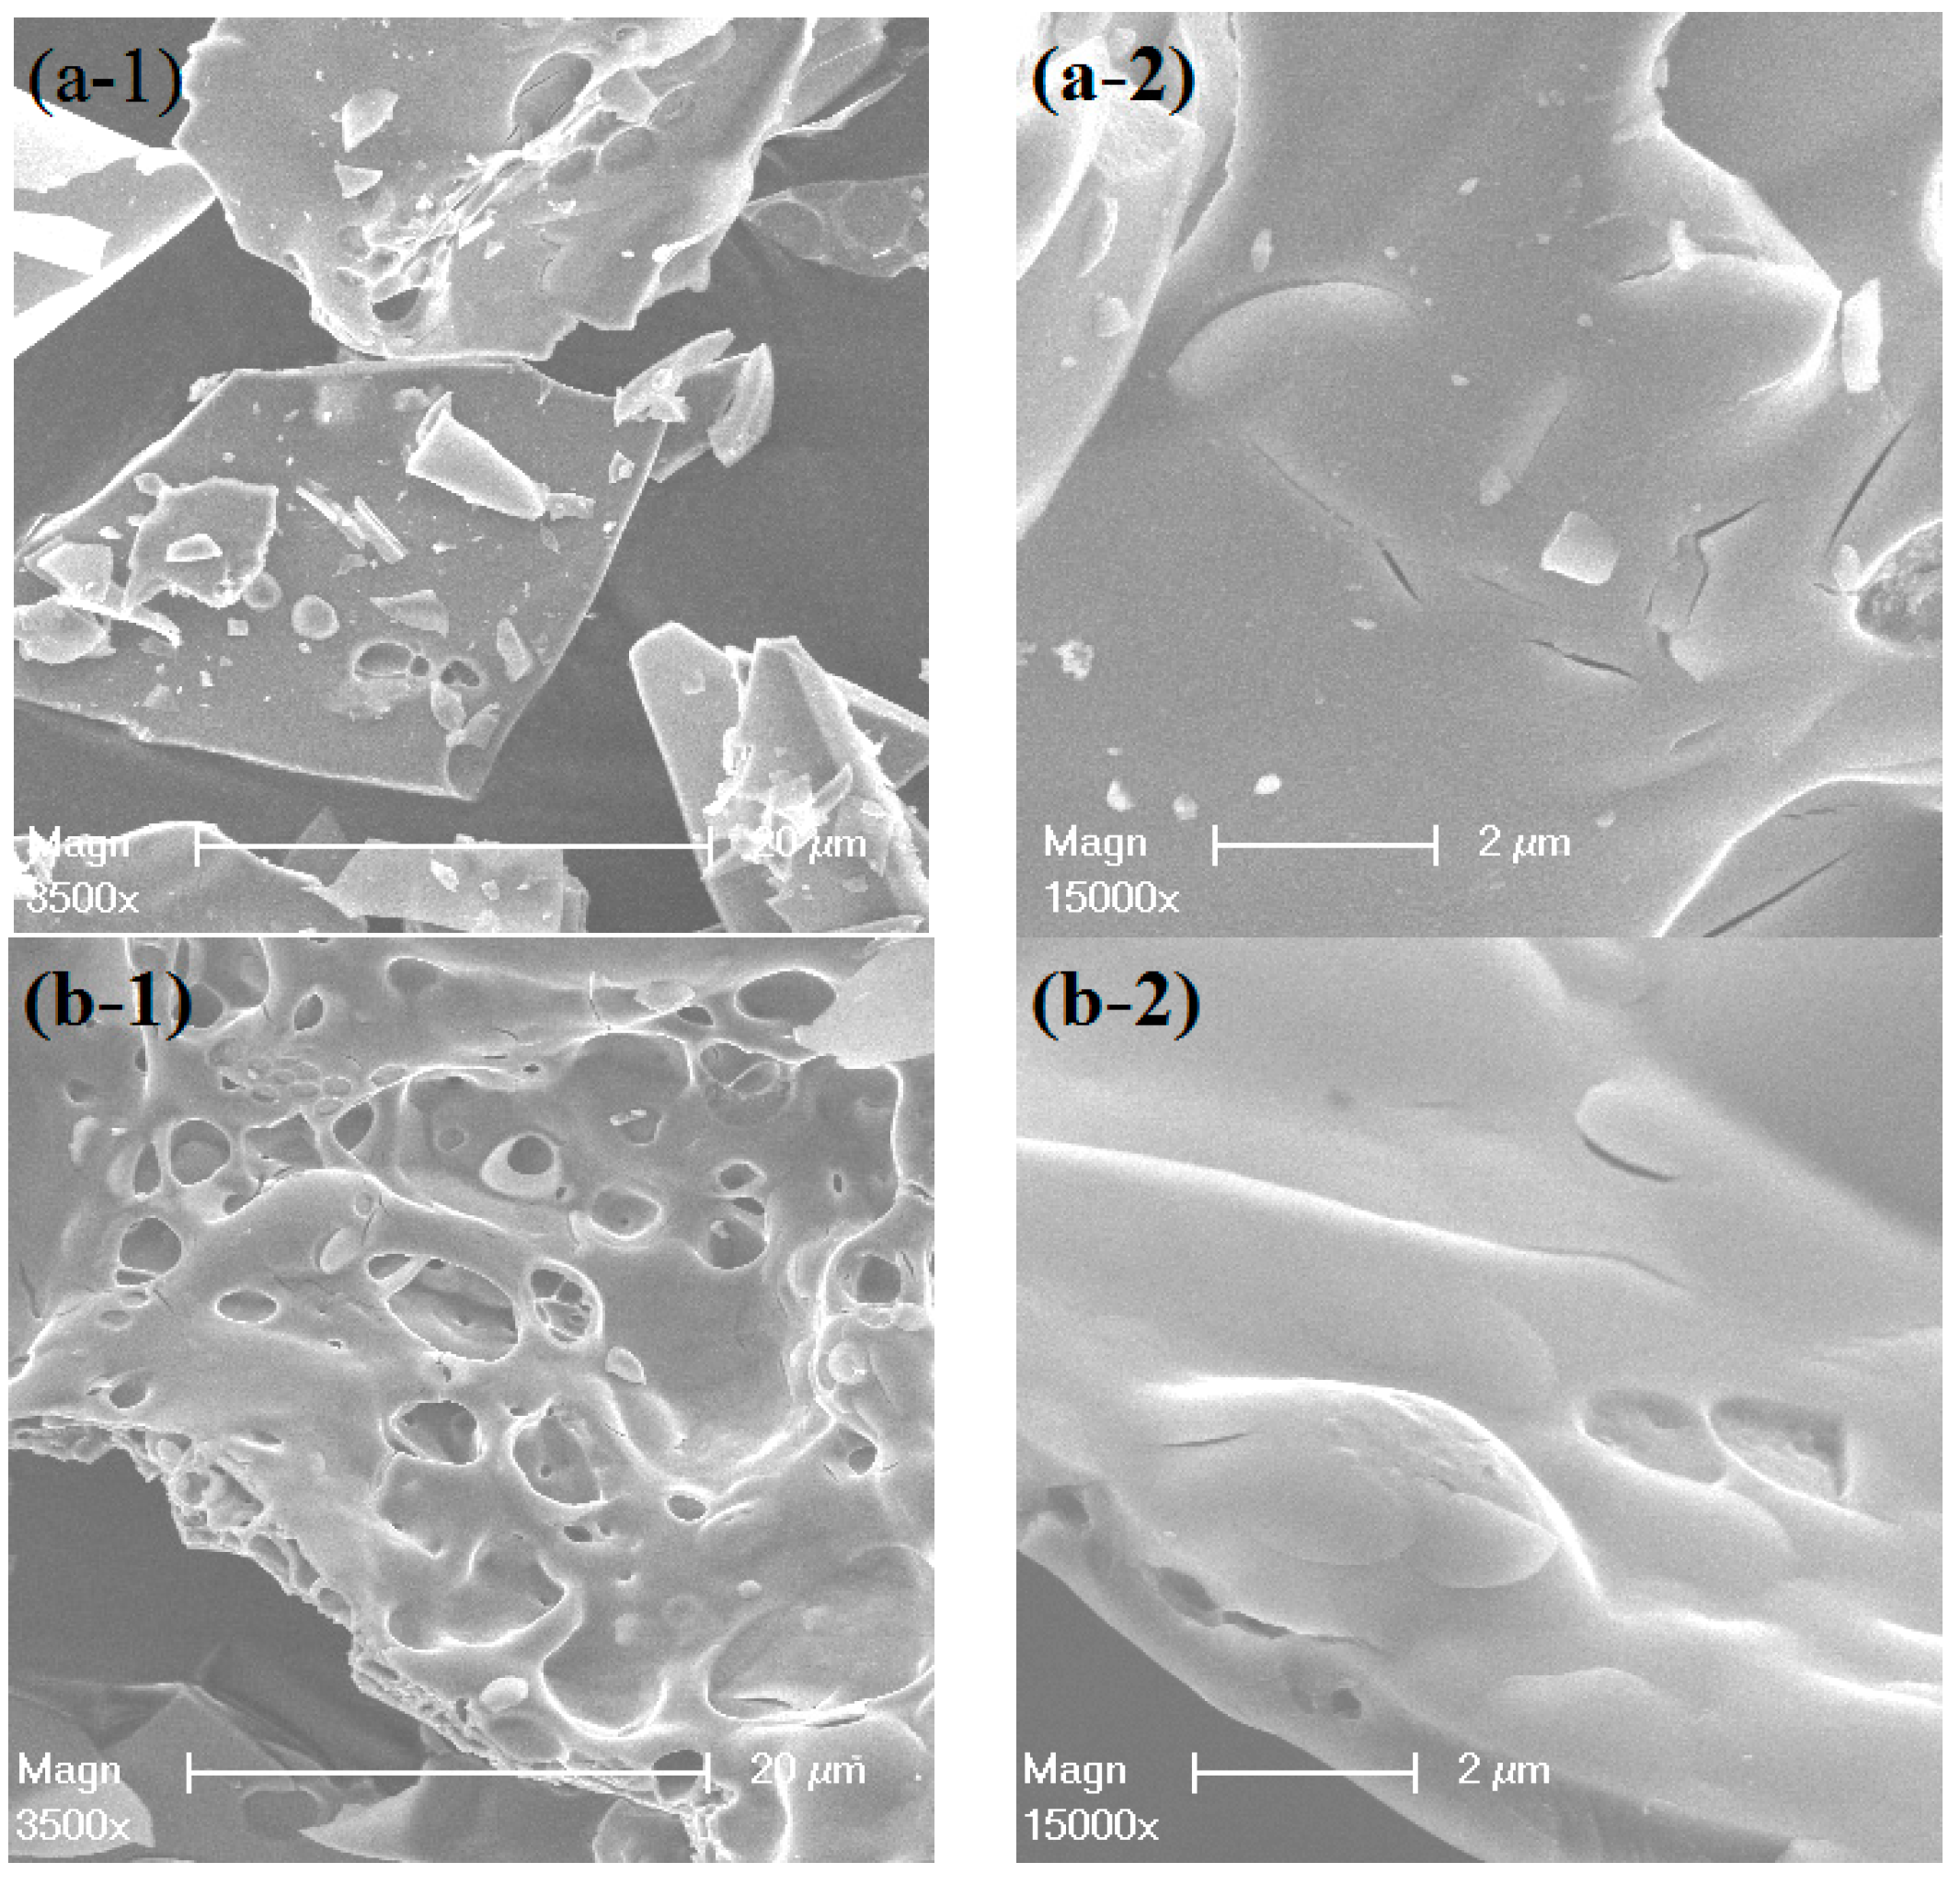
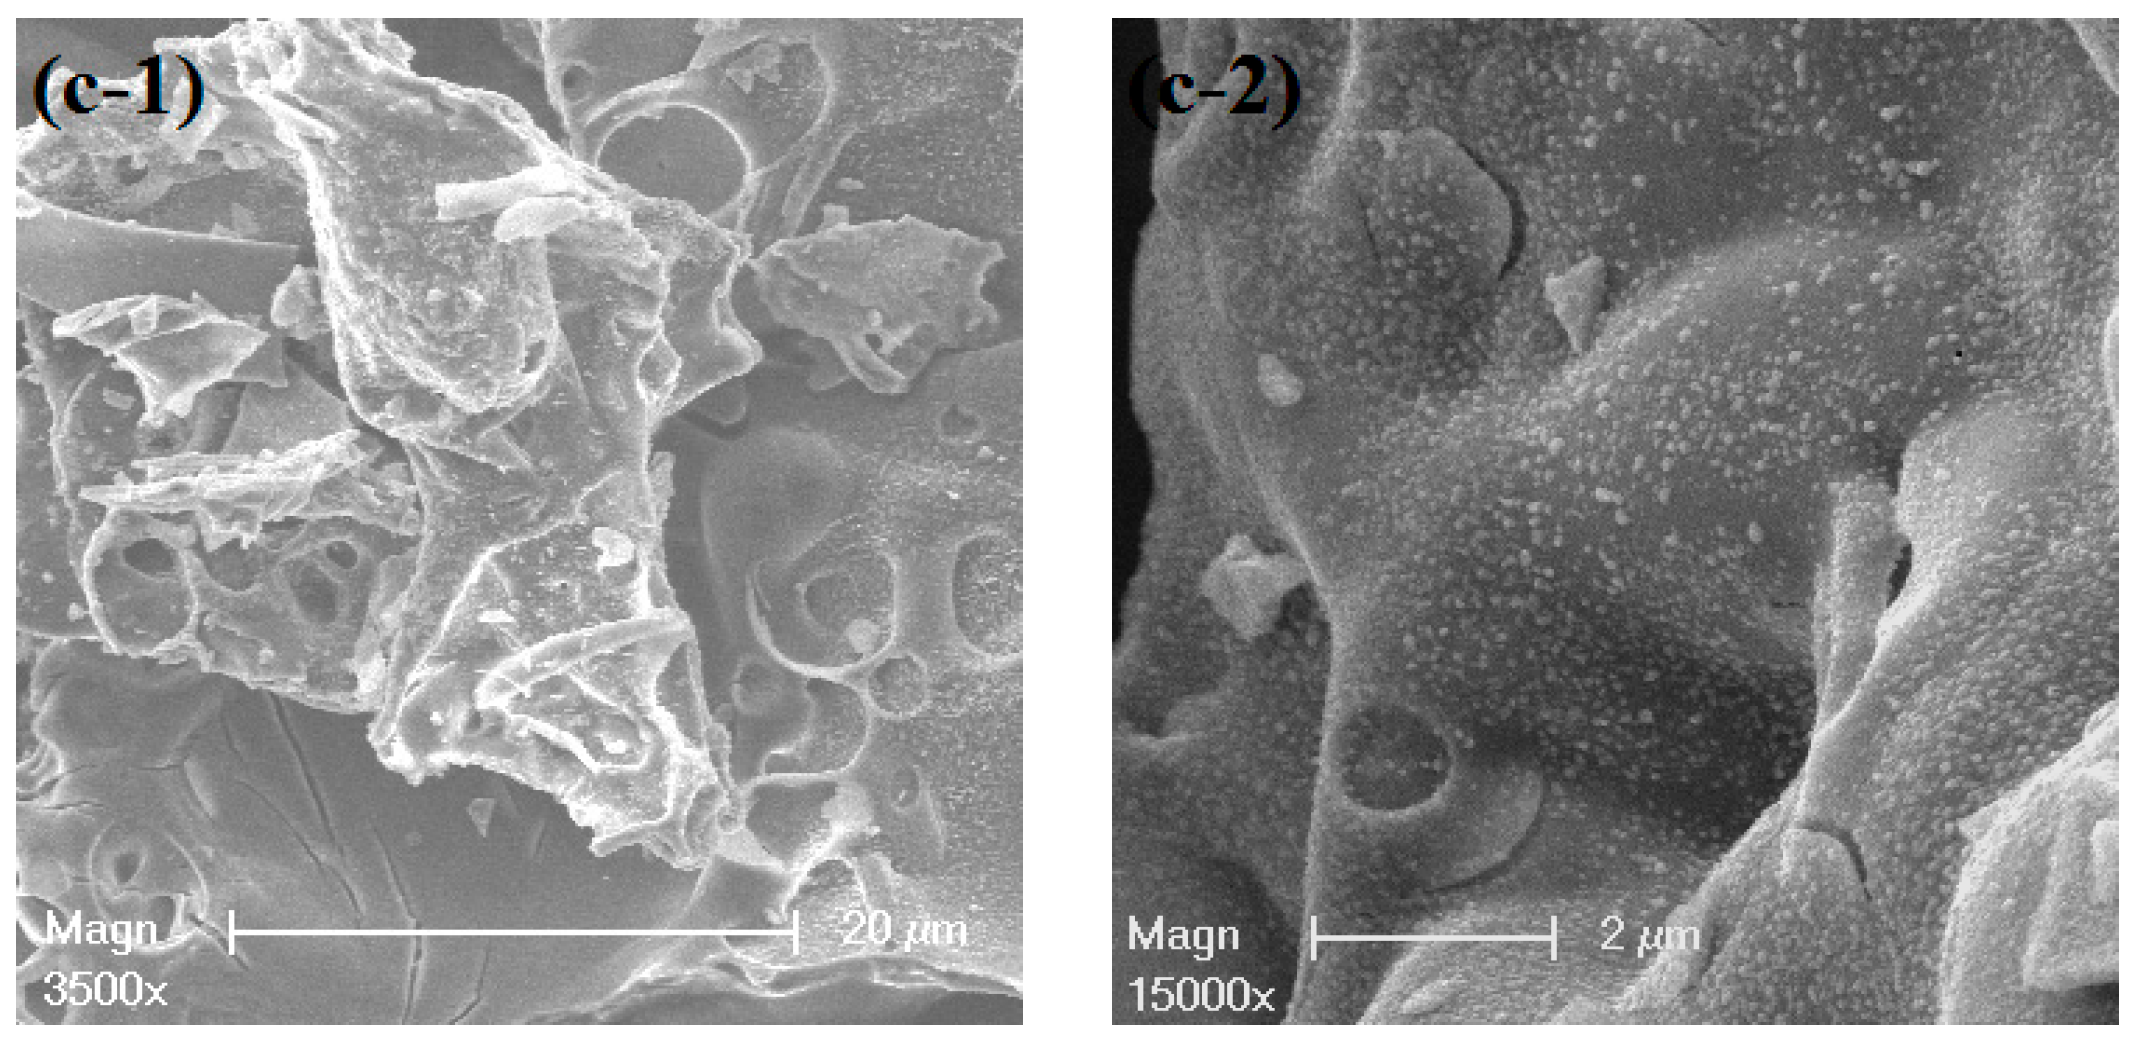
3.1.4. SEM
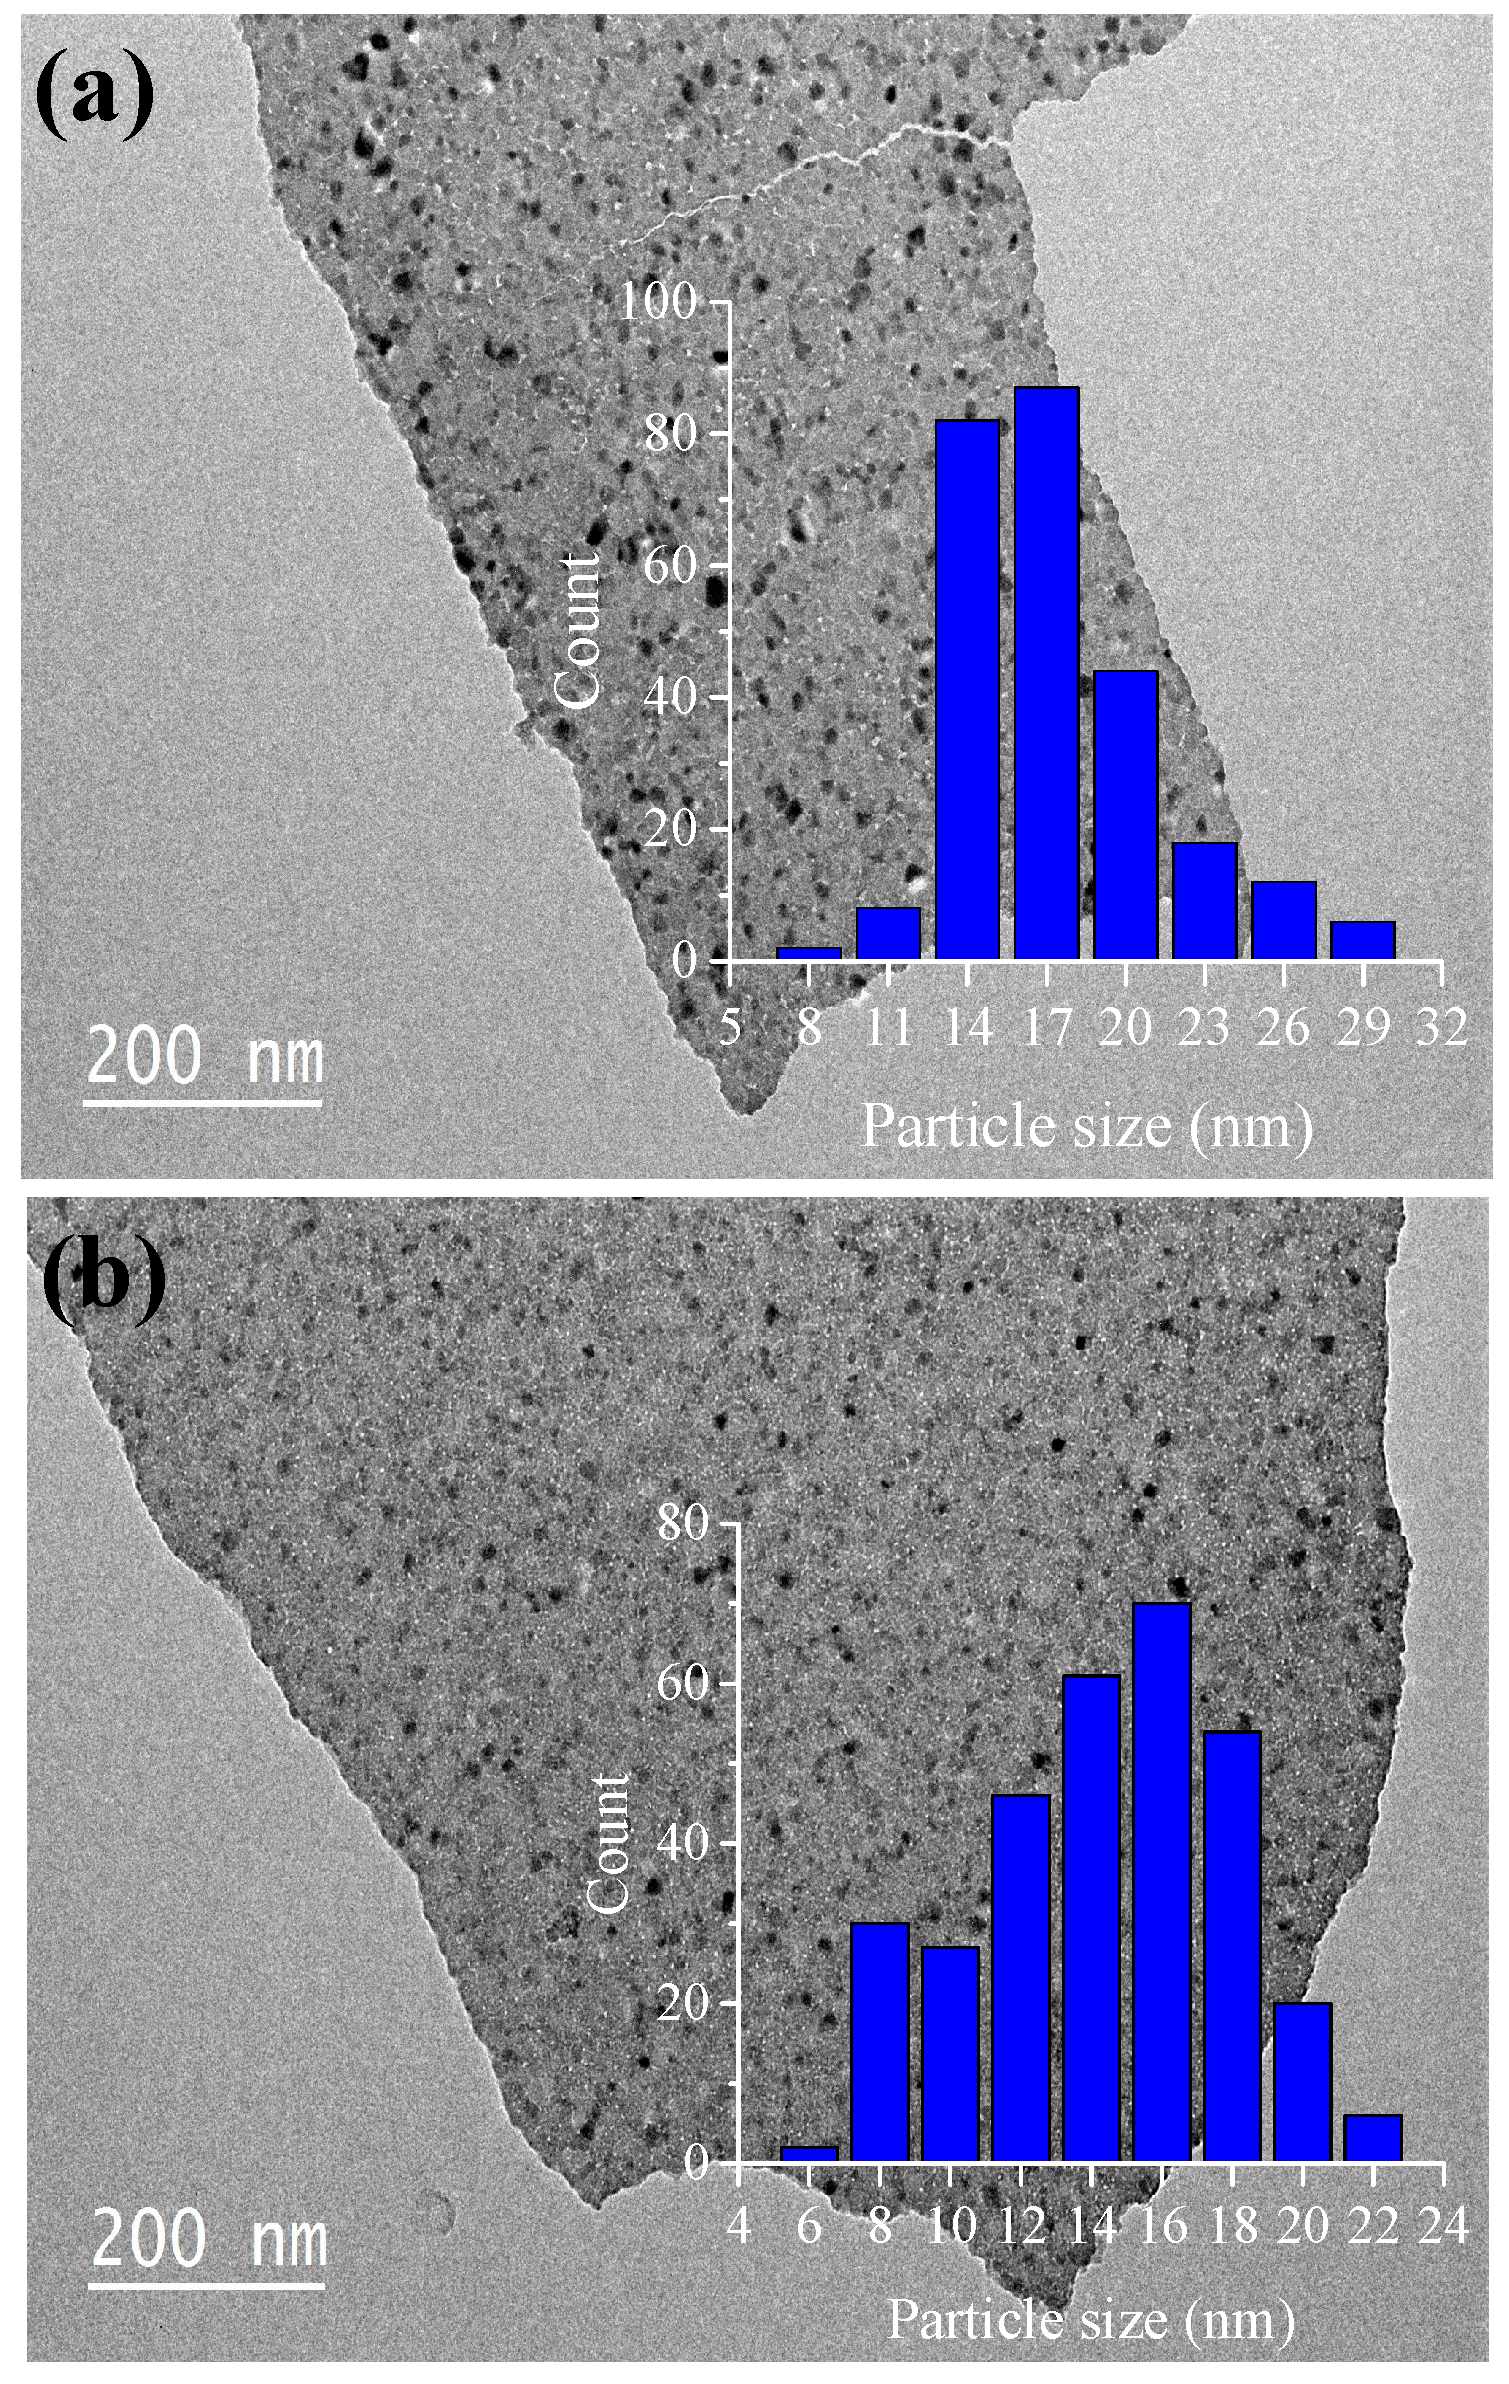
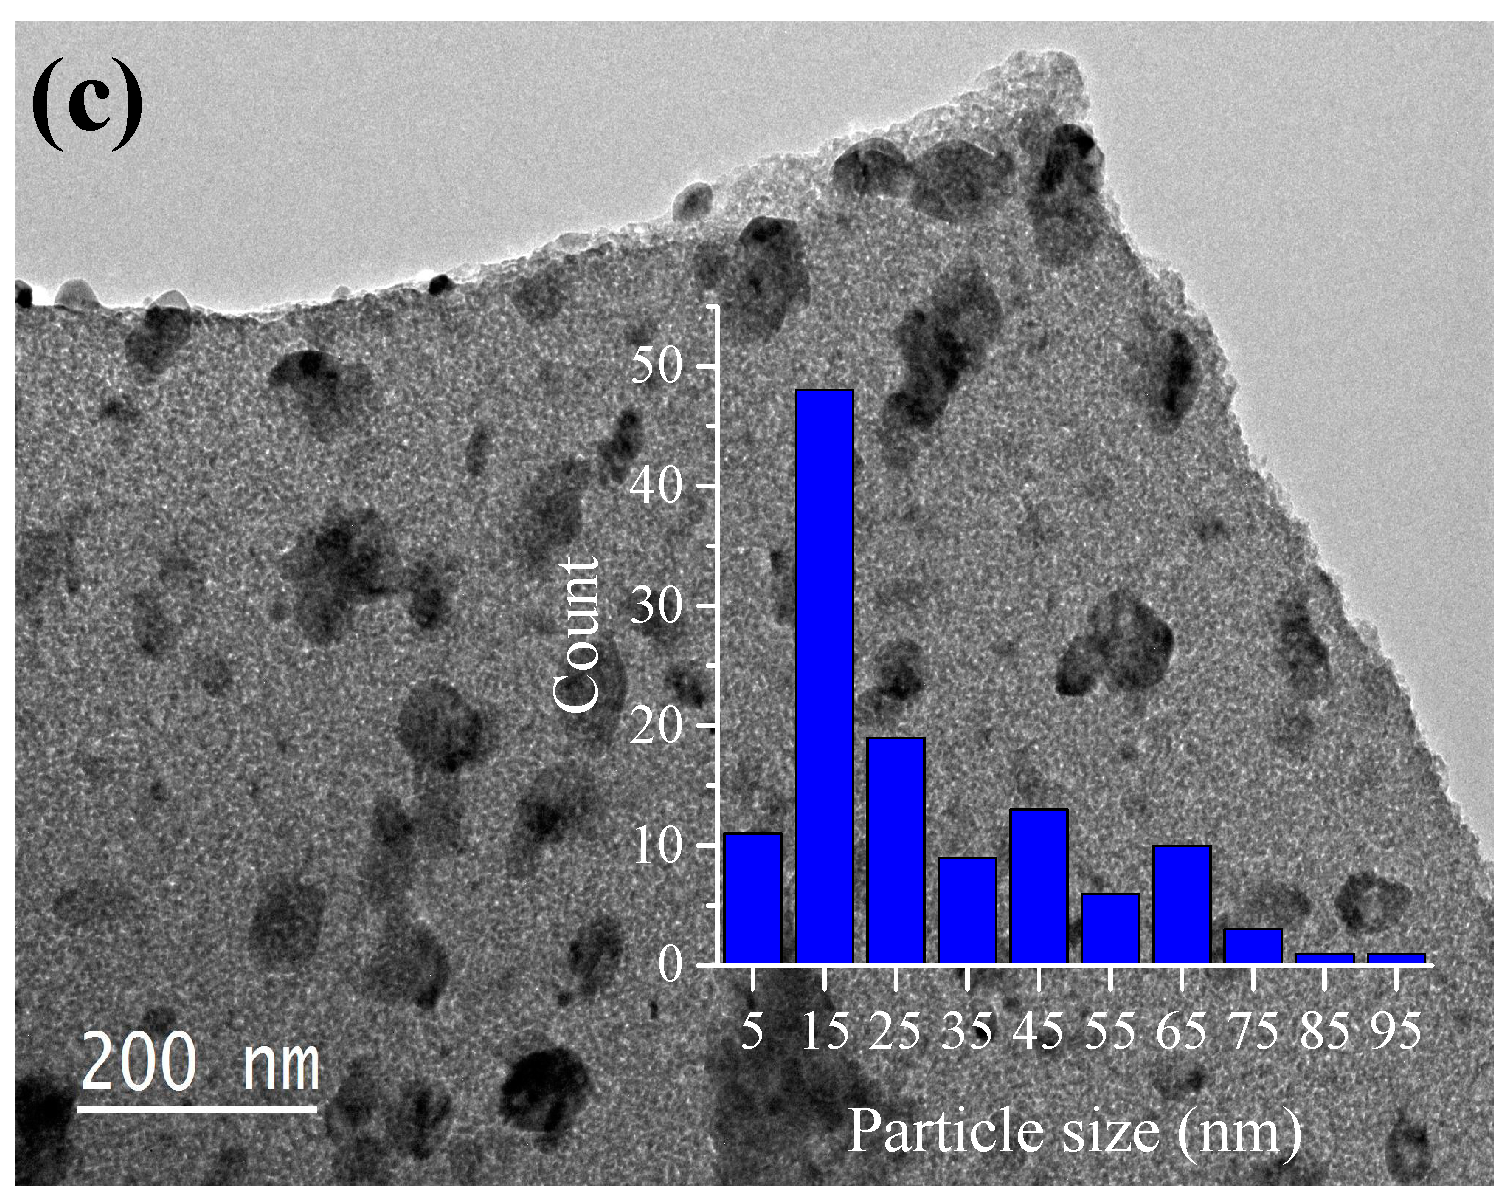
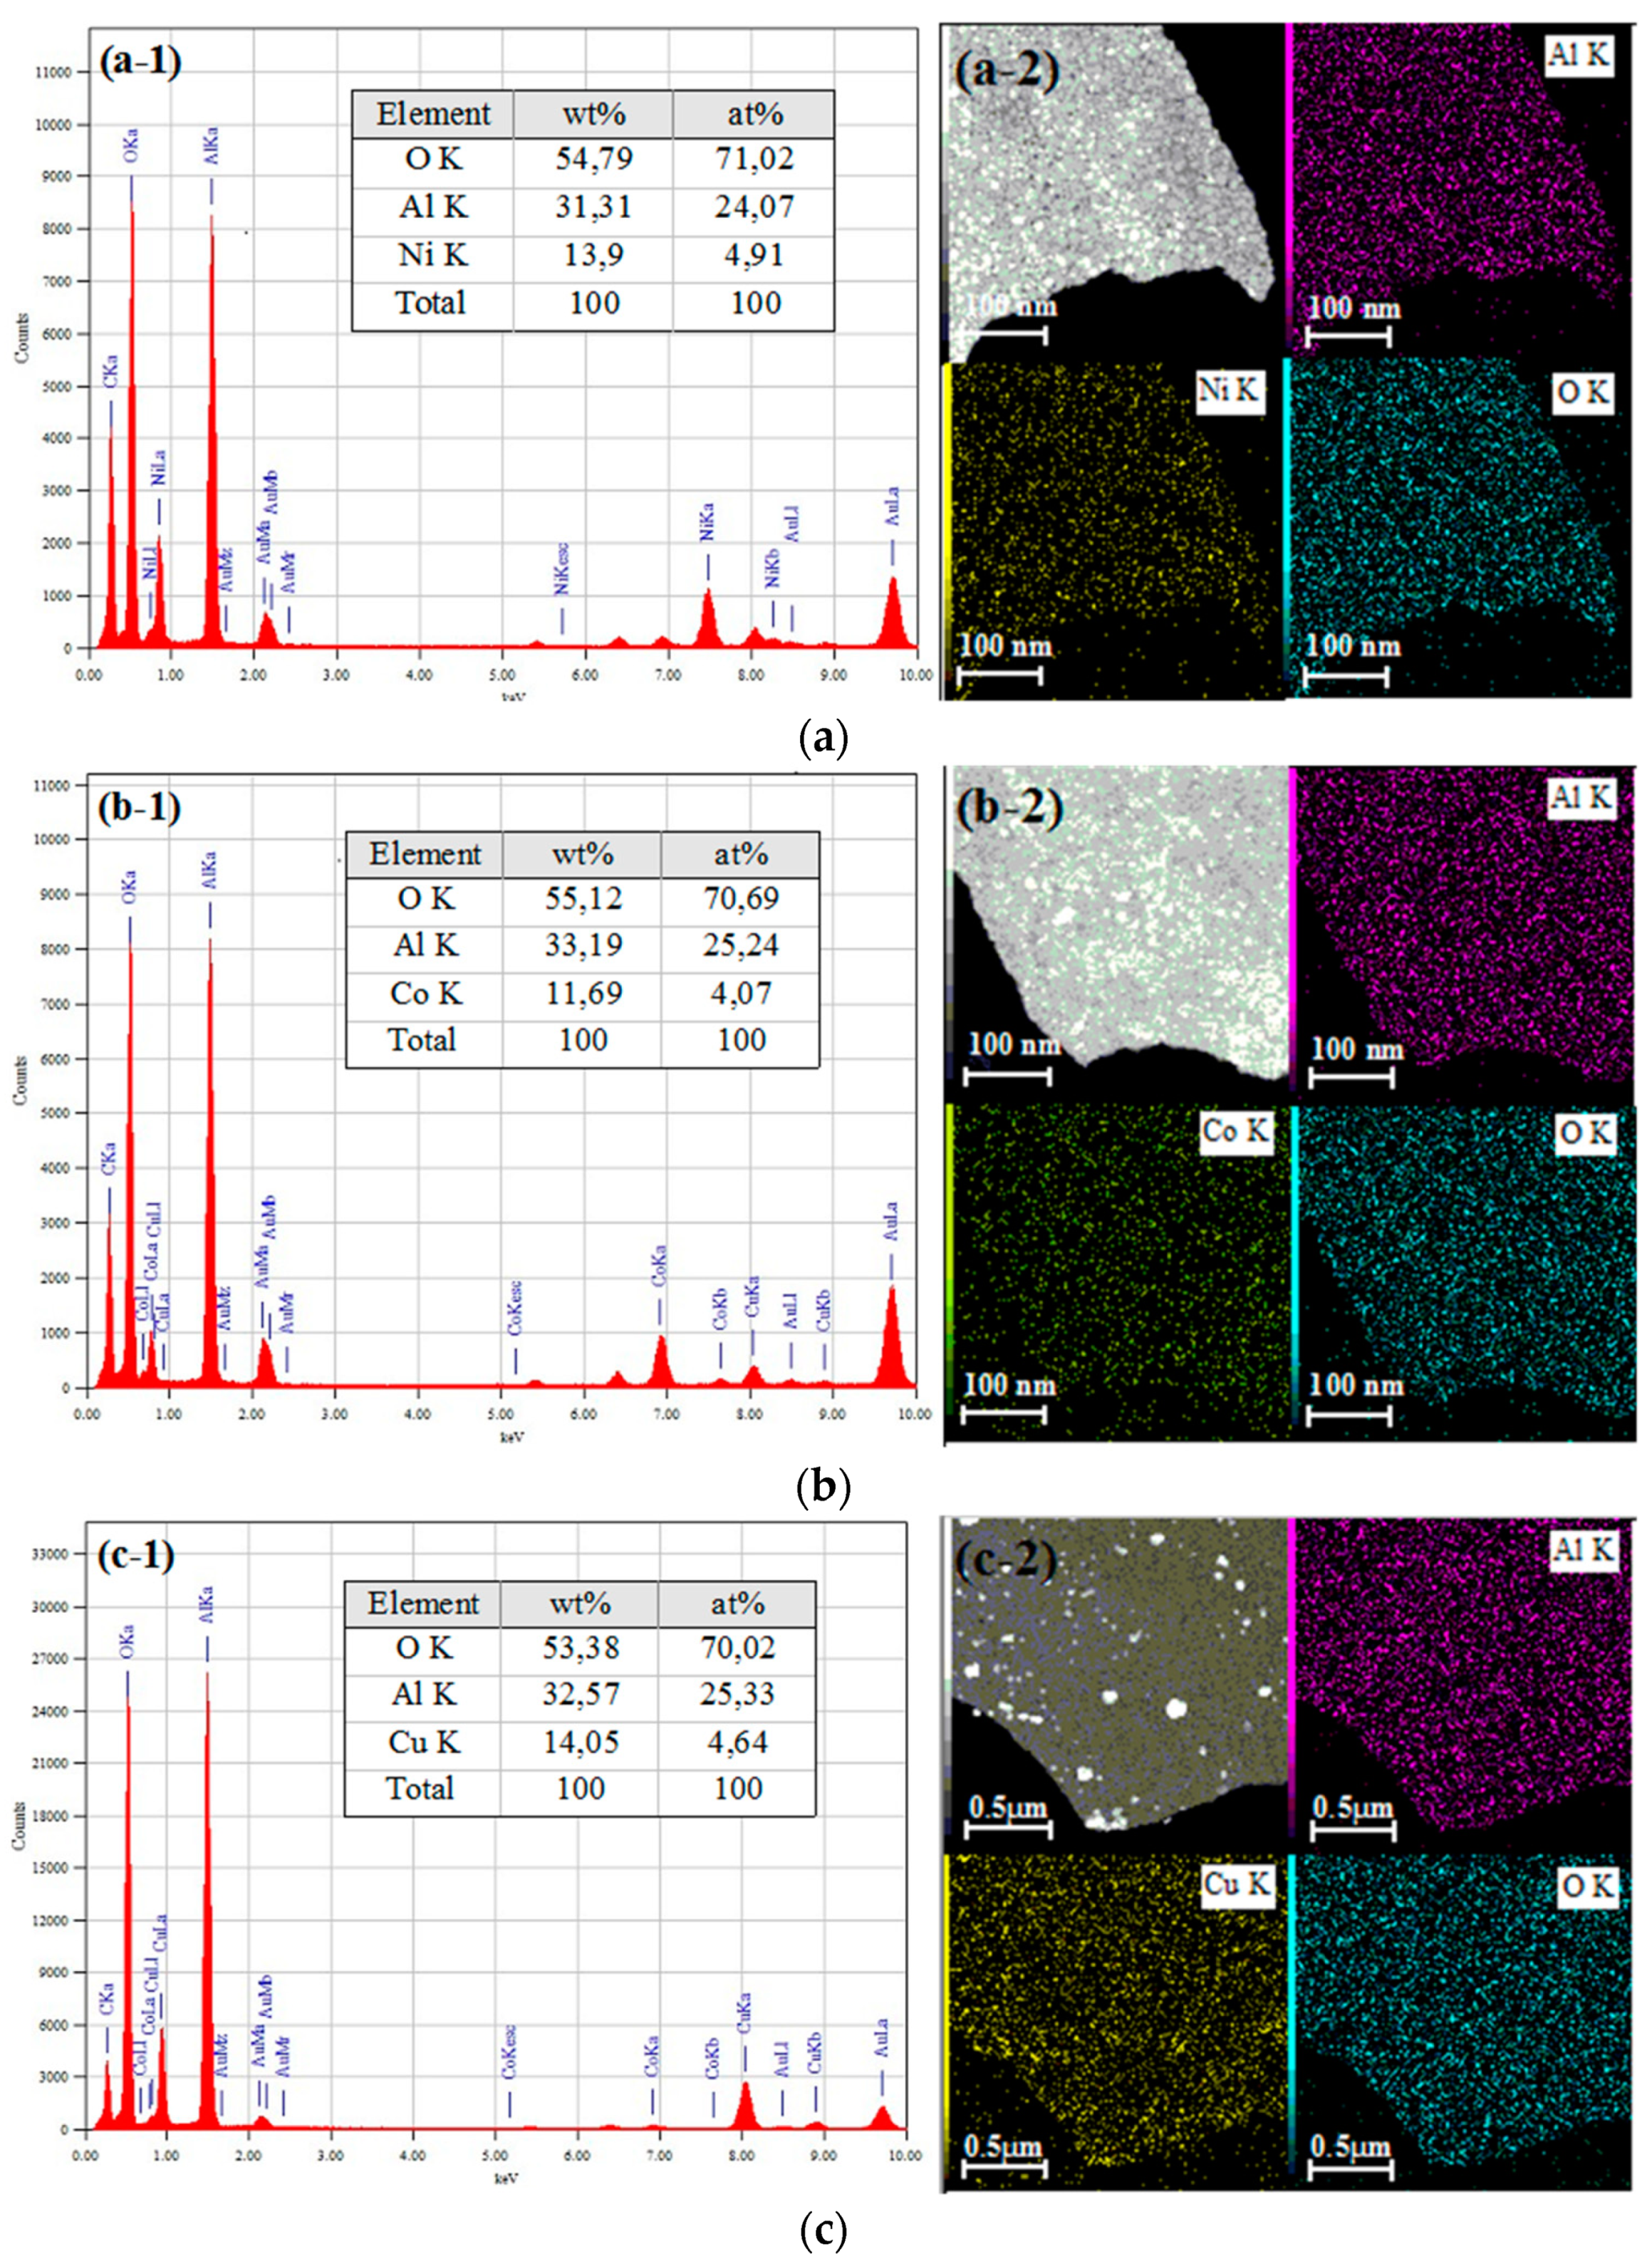
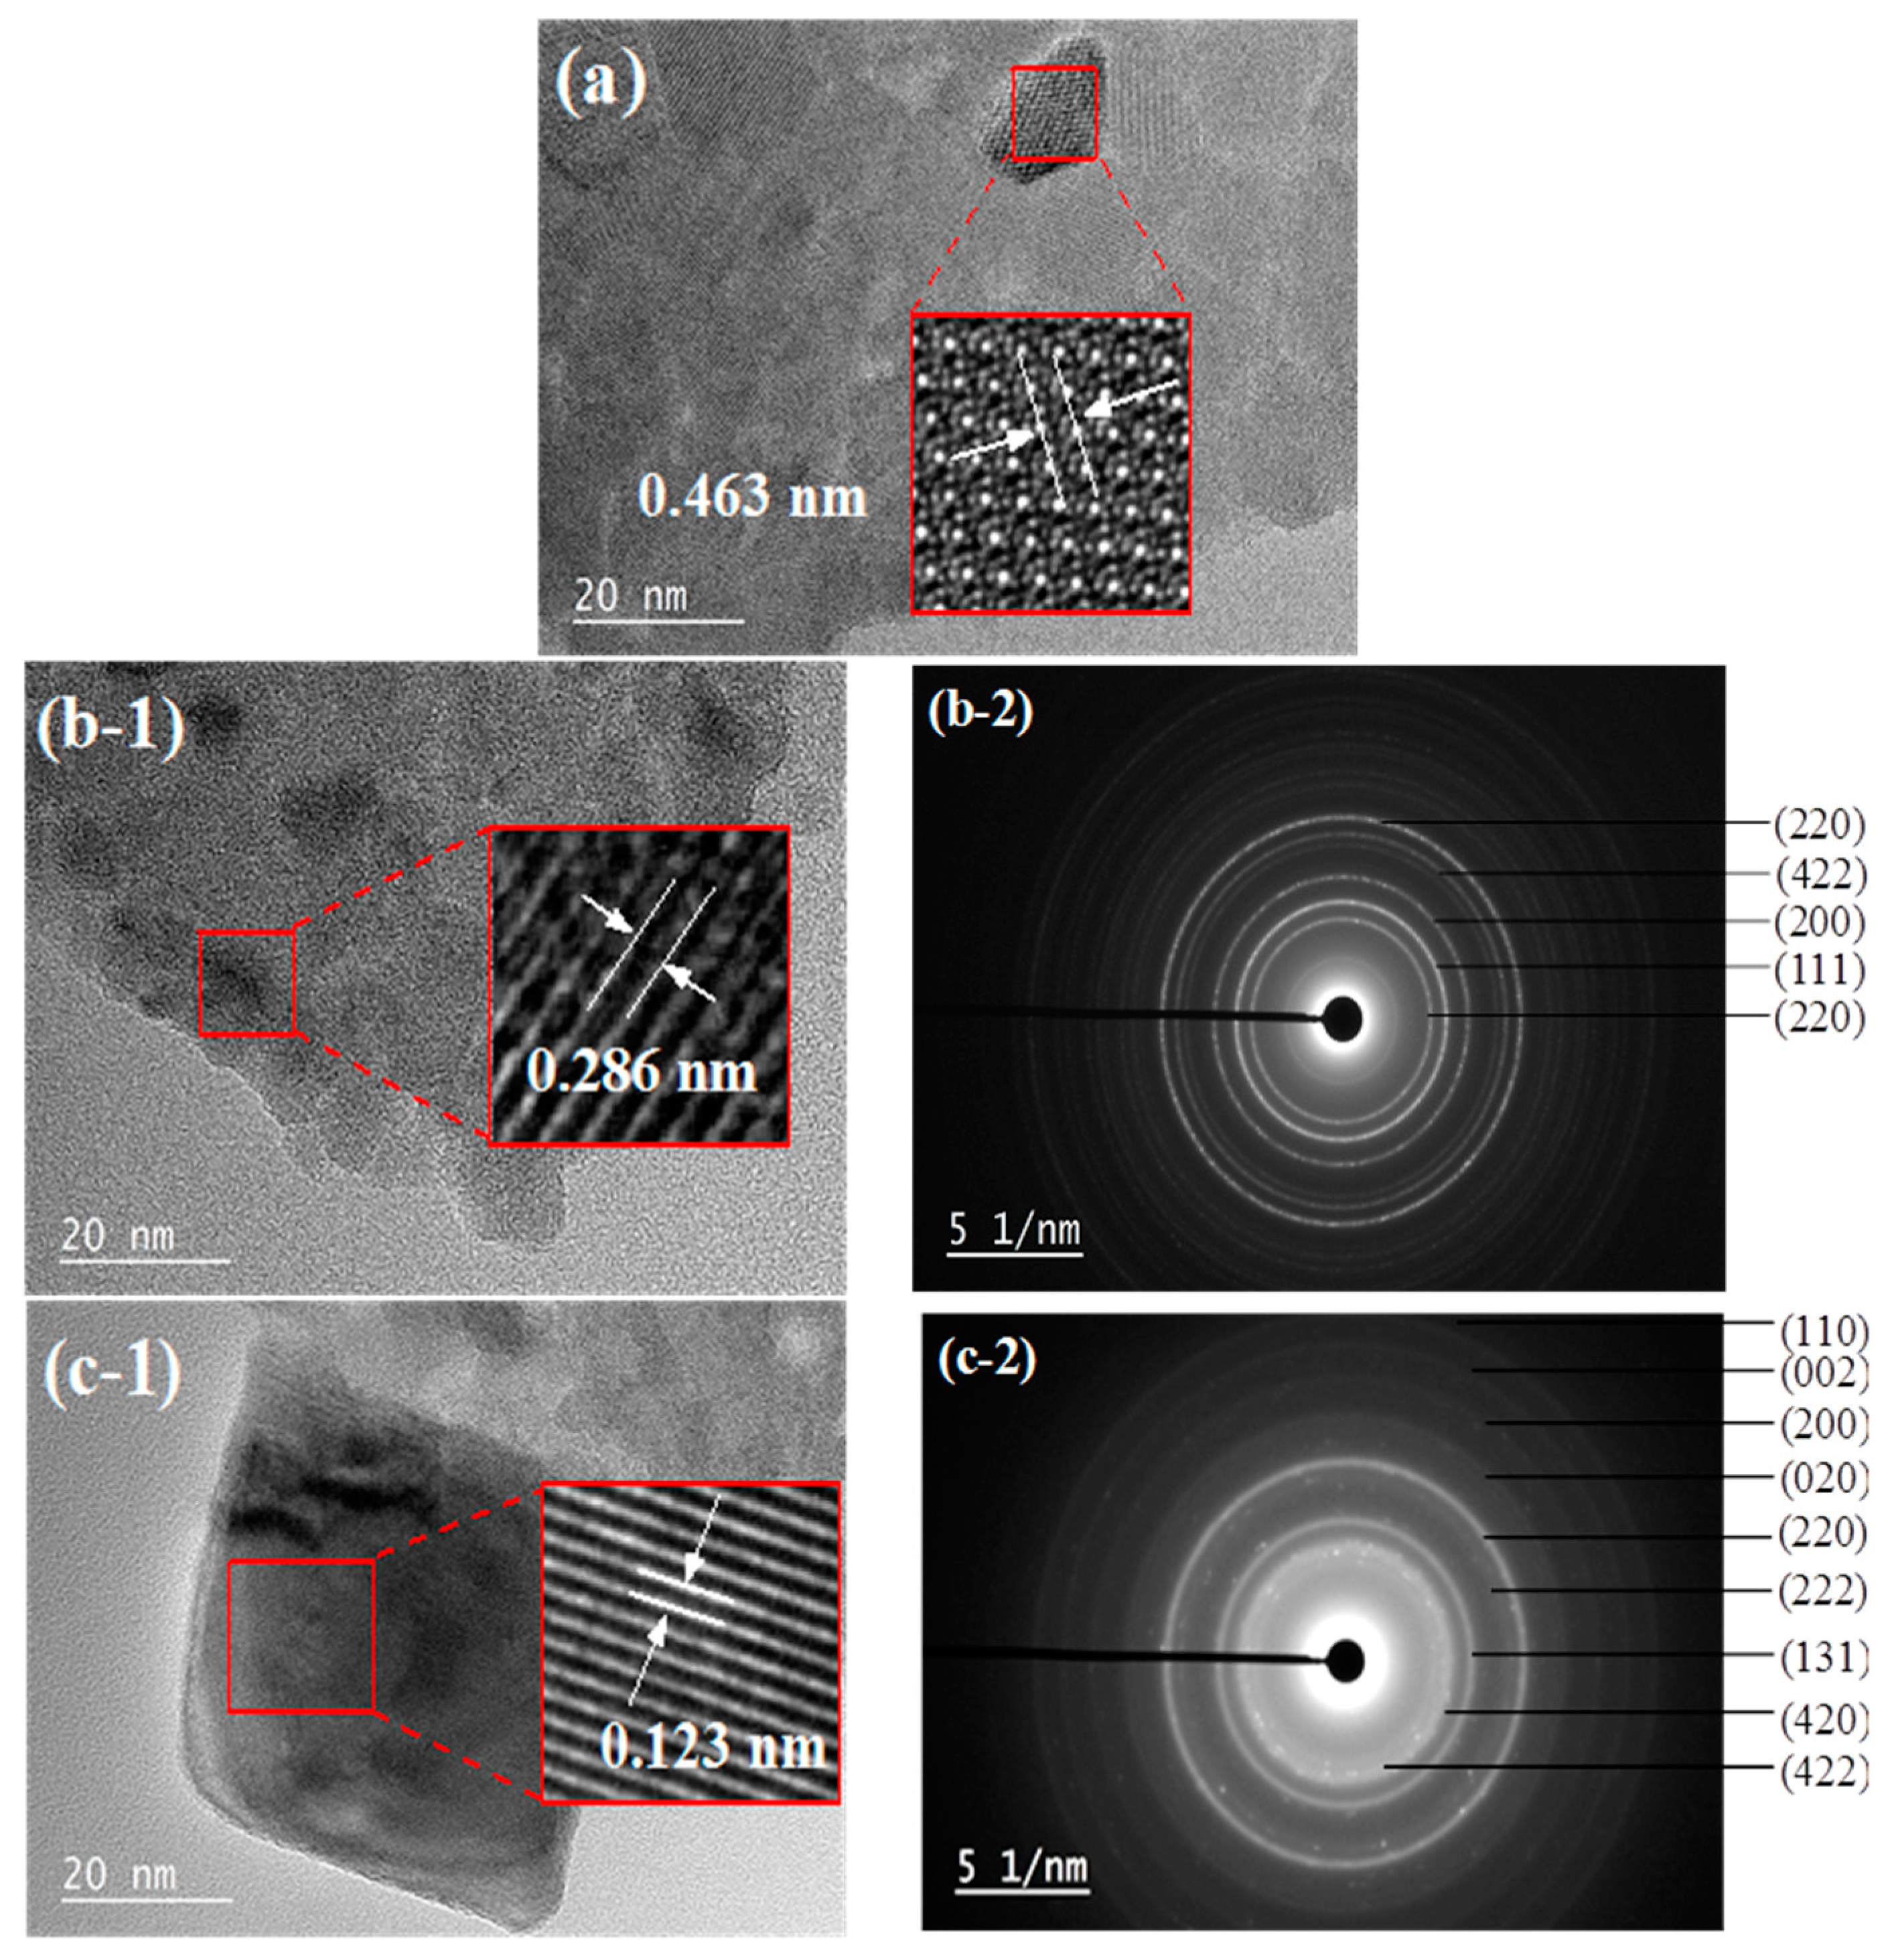
3.1.5. TEM-EDX and Elements Mapping
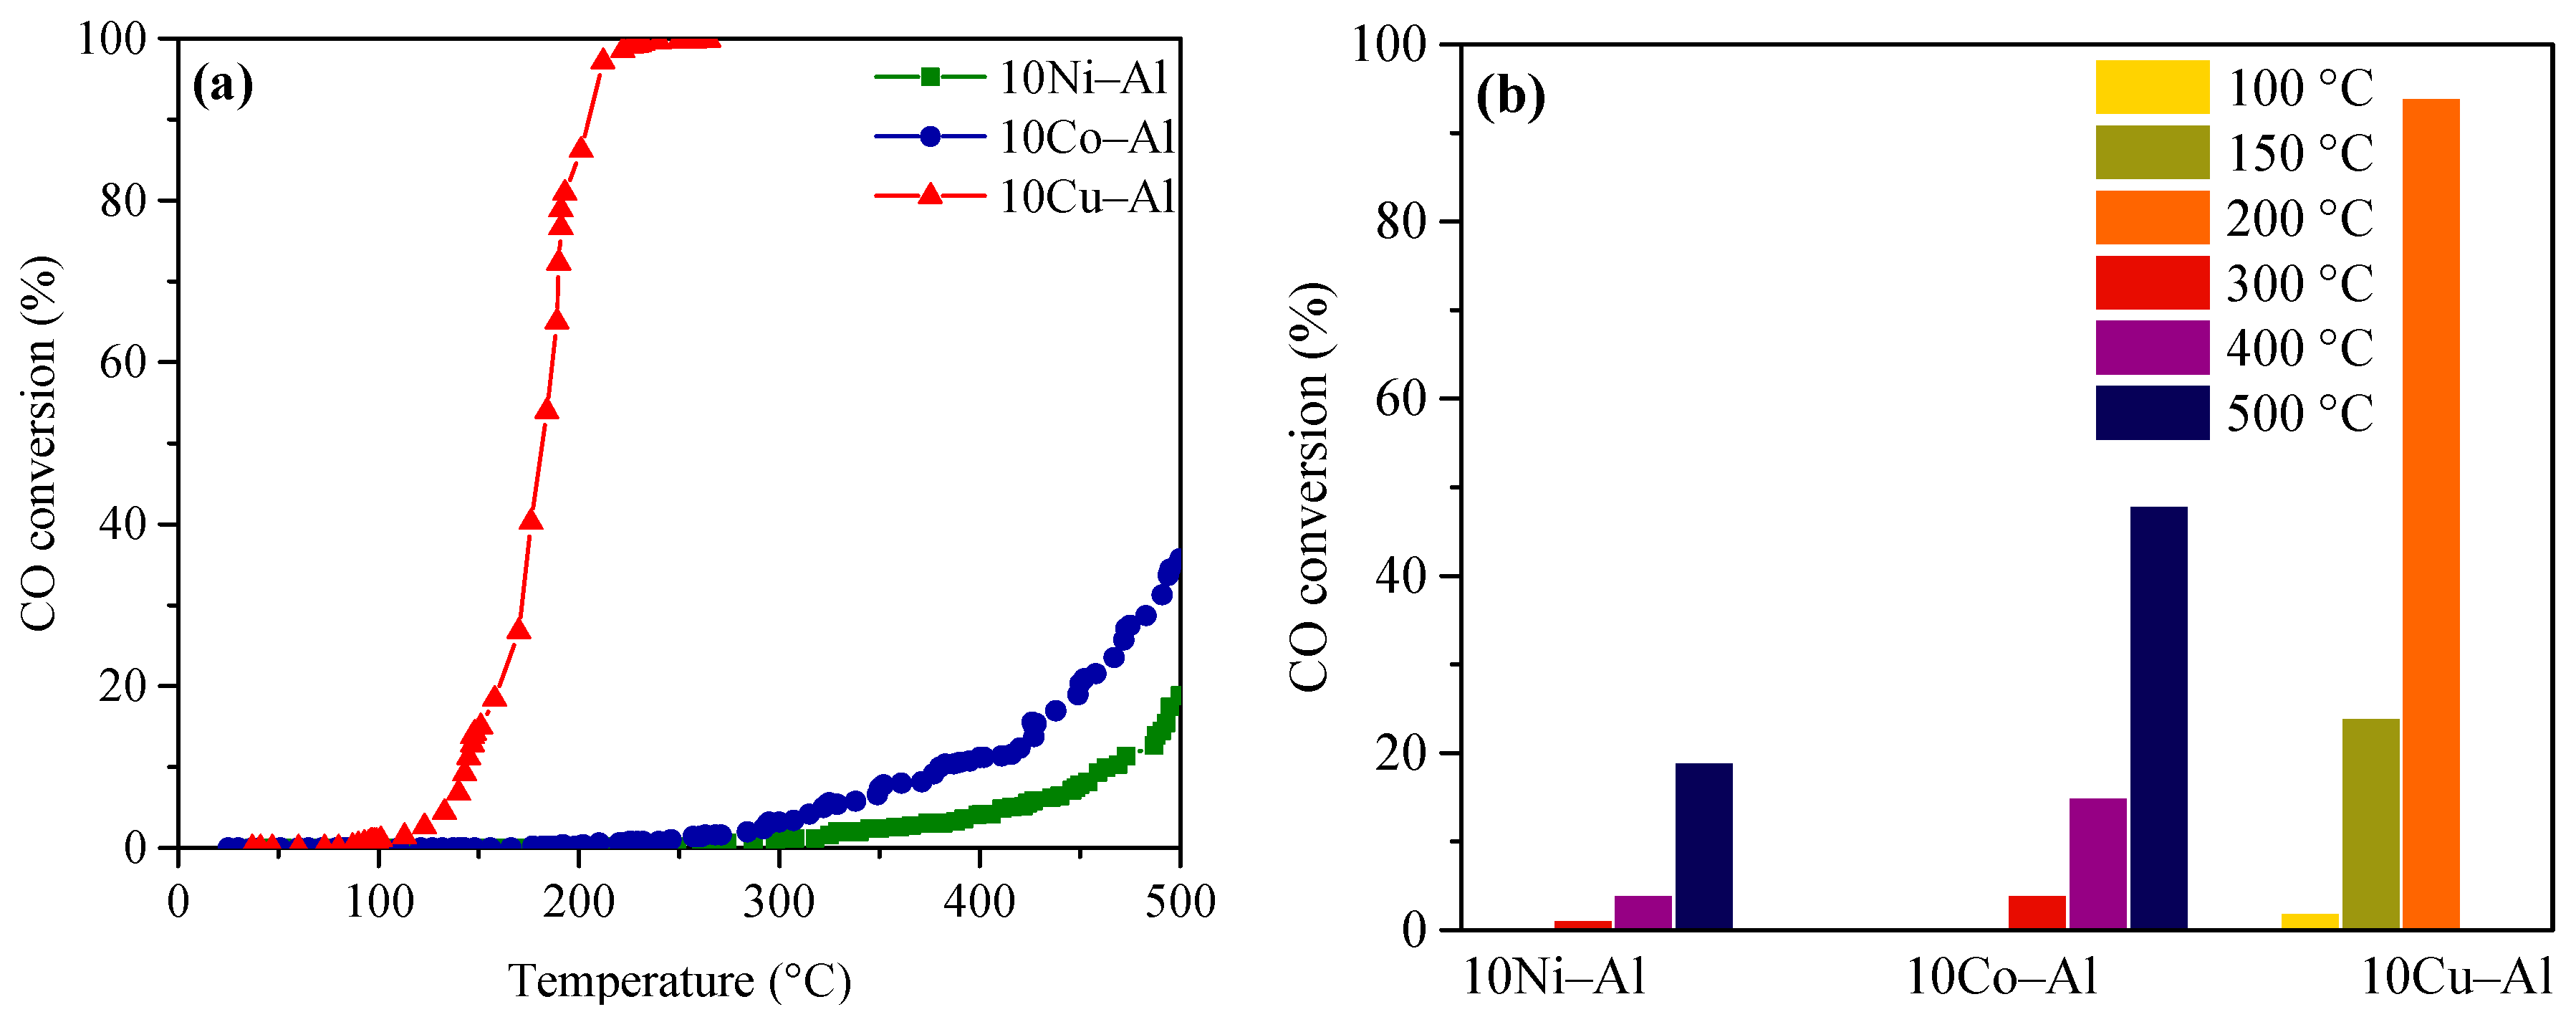
3.2. Evaluation of the Catalytic Activity of the Catalysts in CO Total Oxidation
4. Conclusions
Author Contributions
Funding
Acknowledgments
Conflicts of Interest
References
- Varma, A.; Mukasyan, A.S.; Rogachev, A.S.; Manukyan, K.V. Solution Combustion Synthesis of Nanoscale Materials. Chem. Rev. 2016, 116, 14493–14586. [Google Scholar] [CrossRef] [PubMed]
- Patil, K.C.; Aruna, S.T.; Mimani, T. Combustion Synthesis: An Update. Curr. Opin. Solid State Mater. Sci. 2002, 6, 507–512. [Google Scholar] [CrossRef]
- Aruna, S.T.; Mukasyan, A.S. Combustion Synthesis and Nanomaterials. Curr. Opin. Solid State Mater. Sci. 2008, 12, 44–50. [Google Scholar] [CrossRef]
- González-Cortés, S.L.; Imbert, F.E. Fundamentals, Properties and Applications of Solid Catalysts Prepared by Solution Combustion Synthesis (SCS). Appl. Catal. A Gen. 2013, 452, 117–131. [Google Scholar] [CrossRef]
- Frikha, K.; Limousy, L.; Bouaziz, J.; Bennici, S.; Chaari, K.; Jeguirim, M. Elaboration of Alumina-Based Materials by Solution Combustion Synthesis: A Review. C. R. Chim. 2019, in press. [Google Scholar] [CrossRef]
- Jain, S.R.; Adiga, K.C.; Pai Verneker, V.R. A New Approach to Thermochemical Calculations of Condensed Fuel-Oxidizer Mixtures. Combust. Flame 1981, 40, 71–79. [Google Scholar] [CrossRef]
- Patil, K.C.; Hegde, M.S.; Rattan, T.; Aruna, S.T. Chemistry of Nanocrystalline Oxide Materials-Combustion Synthesis, Properties and Applications; World Scientific Publishing Co. Pte. Ltd.: Singapore, 2008. [Google Scholar]
- Kopp Alves, A.; Bergmann, C.P.; Berutti, F.A. Combustion Synthesis. In Novel Synthesis and Characterization of Nanostructured Materials; Engineering Materials; Springer: Berlin/Heidelberg, Germany, 2013; pp. 11–22. [Google Scholar]
- Kingsley, J.J.; Patil, K.C. A Novel Combustion Process for the Synthesis of Fine Particle α-Alumina and Related Oxide Materials. Mater. Lett. 1988, 6, 427–432. [Google Scholar] [CrossRef]
- Bhaduri, S.; Zhou, E.; Bhaduri, S.B. Auto Ignition Processing of Nanocrystalline α-Al2O3. Nanostruct. Mater. 1996, 7, 487–496. [Google Scholar] [CrossRef]
- Chick, L.A.; Pederson, L.R.; Maupin, G.D.; Bates, J.L.; Thomas, L.E.; Exarhos, G.J. Glycine-Nitrate Combustion Synthesis of Oxide Ceramic Powders. Mater. Lett. 1990, 10, 6–12. [Google Scholar] [CrossRef]
- Chen, C.C.; Huang, K.T. Parametric Effects of Low-Temperature Combustion Synthesis of Alumina. J. Mater. Res. 2005, 20, 424–431. [Google Scholar] [CrossRef]
- Ianoş, R.; Lazău, I.; Păcurariu, C.; Barvinschi, P. Fuel Mixture Approach for Solution Combustion Synthesis of Ca3Al2O6 Powders. Cem. Concr. Res. 2009, 39, 566–572. [Google Scholar] [CrossRef]
- Bilecka, I.; Niederberger, M. Microwave Chemistry for Inorganic Nanomaterials Synthesis. Nanoscale 2010, 2, 1358–1374. [Google Scholar] [CrossRef]
- Rosa, R.; Veronesi, P.; Leonelli, C. A Review on Combustion Synthesis Intensification by Means of Microwave Energy. Chem. Eng. Process. Process Intensif. 2013, 71, 2–18. [Google Scholar] [CrossRef]
- Zhu, Y.J.; Chen, F. Microwave-Assisted Preparation of Inorganic Nanostructures in Liquid Phase. Chem. Rev. 2014, 114, 6462–6555. [Google Scholar] [CrossRef]
- Farrauto, R.J.; Heck, R.M. Environmental Catalysis into the 21st Century. Catal. Today 2000, 55, 179–187. [Google Scholar] [CrossRef]
- Fechete, I.; Wang, Y.; Védrine, J.C. The Past, Present and Future of Heterogeneous Catalysis. Catal. Today 2012, 189, 2–27. [Google Scholar] [CrossRef]
- Twigg, M.V. Progress and Future Challenges in Controlling Automotive Exhaust Gas Emissions. Appl. Catal. B Environ. 2007, 70, 2–15. [Google Scholar] [CrossRef]
- Twigg, M.V. Catalytic Control of Emissions from Cars. Catal. Today 2011, 163, 33–41. [Google Scholar] [CrossRef]
- Gandhi, H.S.; Graham, G.W.; McCabe, R.W. Automotive Exhaust Catalysis. J. Catal. 2003, 216, 433–442. [Google Scholar] [CrossRef]
- Rodriguez, J.A. Gold-Based Catalysts for CO Oxidation, the Water-Gas Shift, and Desulfurization Processes. In New and Future Developments in Catalysis; Suib, S.L., Ed.; Elsevier: Waltham, MA, USA, 2013; ISBN 978-0-444-53874-1. [Google Scholar]
- Langmuir, I. The Mechanism of the Catalytic Action of Platinum in the Reactions 2CO + O2= 2CO2 and 2H2+ O2= 2H2O. Trans. Faraday Soc. 1922, 17, 621–654. [Google Scholar] [CrossRef]
- Stone, F.S. Chemisorption and Catalysis on Metallic Oxides. In Advances in Catalysis; Academic Press: Cambridge, MA, USA, 1962; Volume 13, pp. 1–53. [Google Scholar]
- Royer, S.; Duprez, D. Catalytic Oxidation of Carbon Monoxide over Transition Metal Oxides. ChemCatChem 2011, 3, 24–65. [Google Scholar] [CrossRef]
- Moreno, M.; Bergamini, L.; Baronetti, G.T.; Laborde, M.A.; Mariño, F.J. Mechanism of CO Oxidation over CuO/CeO2 Catalysts. Int. J. Hydrogen Energy 2010, 35, 5918–5924. [Google Scholar] [CrossRef]
- El Shobaky, H.G. Surface and Catalytic Properties of Co, Ni and Cu Binary Oxide Systems. Appl. Catal. A Gen. 2004, 278, 1–9. [Google Scholar] [CrossRef]
- Yao, Y.F.Y. The Oxidation of Hydrocarbons and CO over Metal Oxides III. Co3O4. J. Catal. 1974, 33, 108–122. [Google Scholar] [CrossRef]
- Jansson, J. Low-Temperature CO Oxidation over Co3O4/Al2O3. J. Catal. 2000, 194, 55–60. [Google Scholar] [CrossRef]
- Wang, C.B.; Tang, C.W.; Tsai, H.C.; Kuo, M.C.; Chien, S.H. In Situ FT-IR Spectroscopic Studies on the Mechanism of the Catalytic Oxidation of Carbon Monoxide over Supported Cobalt Catalysts. Catal. Lett. 2006, 107, 31–37. [Google Scholar] [CrossRef]
- Wang, C.B.; Tang, C.W.; Tsai, H.C.; Chien, S.H. Characterization and Catalytic Oxidation of Carbon Monoxide over Supported Cobalt Catalysts. Catal. Lett. 2006, 107, 223–230. [Google Scholar] [CrossRef]
- YAO, Y.F.Y.; Kummer, J.T. A Study of High Temperature Treated Supported Metal Oxide Catalysts. J. Catal. 1977, 46, 388–401. [Google Scholar] [CrossRef]
- Pierron, E.D.; Rashkin, J.A.; Roth, J.F. Copper Oxide on Alumina I. XRD Studies of Catalyst Composition during Air Oxidation of Carbon Monoxide. J. Catal. 1967, 9, 38–44. [Google Scholar] [CrossRef]
- Luo, M.F.; Fang, P.; He, M.; Xie, Y.L. In Situ XRD, Raman, and TPR Studies of CuO/Al2O3 Catalysts for CO Oxidation. J. Mol. Catal. A Chem. 2005, 239, 243–248. [Google Scholar] [CrossRef]
- Chen, C.S.; You, J.H.; Lin, J.H.; Chen, C.R.; Lin, K.M. The Effect of a Nickel Promoter on the Reducibility of a Commercial Cu/ZnO/Al2O3 Catalyst for CO Oxidation. Catal. Commun. 2008, 9, 1230–1234. [Google Scholar] [CrossRef]
- Sahli, N.; Petit, C.; Roger, A.C.; Kiennemann, A.; Libs, S.; Bettahar, M.M. Ni Catalysts from NiAl2O4 Spinel for CO2 Reforming of Methane. Catal. Today 2006, 113, 187–193. [Google Scholar] [CrossRef]
- Li, G.; Hu, L.; Hill, J.M. Comparison of Reducibility and Stability of Alumina-Supported Ni Catalysts Prepared by Impregnation and Co-Precipitation. Appl. Catal. A Gen. 2006, 301, 16–24. [Google Scholar] [CrossRef]
- Kiš, E.; Marinković-Nedučin, R.; Lomić, G.; Bošković, G.; Obadovič, D.Ž.; Kiurski, J.; Putanov, P. Structural and Textural Properties of the NiO-Al2O3 Catalyst. Polyhedron 1998, 17, 27–34. [Google Scholar] [CrossRef]
- Zhao, A.; Ying, W.; Zhang, H.; Ma, H.; Fang, D. Ni–Al2O3 Catalysts Prepared by Solution Combustion Method for Syngas Methanation. Catal. Commun. 2012, 17, 34–38. [Google Scholar] [CrossRef]
- Zangouei, M.; Moghaddam, A.Z.; Arasteh, M. The Influence of Nickel Loading on Reducibility of NiO/Al2O3 Catalysts Synthesized by Sol-Gel Method. Chem. Eng. Res. Bull. 2010, 14, 97–102. [Google Scholar] [CrossRef]
- Ewbank, J.L.; Kovarik, L.; Diallo, F.Z.; Sievers, C. Effect of Metal-Support Interactions in Ni/Al2O3 Catalysts with Low Metal Loading for Methane Dry Reforming. Appl. Catal. A Gen. 2015, 494, 57–67. [Google Scholar] [CrossRef]
- Richardson, J.T.; Vernon, L.W. The Magnetic Properties of the Cobalt Oxides and the System Cobalt-Alumina. J. Phys. Chem. 1958, 62, 1153. [Google Scholar] [CrossRef]
- Wang, W.J.; Chen, Y.W. Influence of Metal Loading on the Reducibility and Hydrogenation Activity of Cobalt/Alumina Catalysts. Appl. Catal. 1991, 77, 223–233. [Google Scholar] [CrossRef]
- Kingsley, J.J.; Suresh, K.; Patil, K.C. Combustion Synthesis of Fine-Particle Metal Aluminates. J. Mater. Sci. 1990, 25, 1305–1312. [Google Scholar] [CrossRef]
- Biesinger, M.C.; Payne, B.P.; Grosvenor, A.P.; Lau, L.W.M.; Gerson, A.R.; Smart, R.S.C. Resolving Surface Chemical States in XPS Analysis of First Row Transition Metals, Oxides and Hydroxides: Cr, Mn, Fe, Co and Ni. Appl. Surf. Sci. 2011, 257, 2717–2730. [Google Scholar] [CrossRef]
- Biesinger, M.C.; Payne, B.P.; Lau, L.W.M.; Gerson, A.; Smart, R.S.C. X-ray Photoelectron Spectroscopic Chemical State Quantification of Mixed Nickel Metal, Oxide and Hydroxide Systems. Surf. Interface Anal. 2009, 41, 324–332. [Google Scholar] [CrossRef]
- Payne, B.P.; Biesinger, M.C.; McIntyre, N.S. Use of Oxygen/Nickel Ratios in the XPS Characterisation of Oxide Phases on Nickel Metal and Nickel Alloy Surfaces. J. Electron Spectrosc. Relat. Phenomena 2012, 185, 159–166. [Google Scholar] [CrossRef]
- Grosvenor, A.P.; Biesinger, M.C.; Smart, R.S.C.; McIntyre, N.S. New Interpretations of XPS Spectra of Nickel Metal and Oxides. Surf. Sci. 2006, 600, 1771–1779. [Google Scholar] [CrossRef]
- Duan, X.; Pan, M.; Yu, F.; Yuan, D. Synthesis, Structure and Optical Properties of CoAl2O4 Spinel Nanocrystals. J. Alloys Compd. 2011, 509, 1079–1083. [Google Scholar] [CrossRef]
- Han, J.K.; Jia, L.T.; Hou, B.; Li, D.B.; Liu, Y.; Liu, Y.C. Catalytic Properties of CoAl2O4/Al2O3 Supported Cobalt Catalysts for Fischer-Tropsch Synthesis. J. Fuel Chem. Technol. 2015, 43, 846–851. [Google Scholar] [CrossRef]
- Biesinger, M.C.; Lau, L.W.M.; Gerson, A.R.; Smart, R.S.C. Resolving Surface Chemical States in XPS Analysis of First Row Transition Metals, Oxides and Hydroxides: Sc,Ti,V,Cu and Zn. Appl. Surf. Sci. 2010, 257, 887–898. [Google Scholar] [CrossRef]
- Fu, L.; Yang, H. Tailoring the Electronic Structure of Mesoporous Spinel γ-Al2O3 at Atomic Level: Cu-Doped Case. J. Phys. Chem. C 2014, 118, 14299–14315. [Google Scholar] [CrossRef]
- Bennici, S.; Auroux, A.; Guimon, C.; Gervasini, A. Supported Binary Oxide Catalysts Containing CuO Coupled with Ga2O3 and SnO2. Chem. Mater. 2006, 18, 3641–3650. [Google Scholar] [CrossRef]
- Biesinger, M.C. Advanced Analysis of Copper X-ray Photoelectron Spectra. Surf. Interface Anal. 2017, 49, 1325–1334. [Google Scholar] [CrossRef]
- Thirumalairajan, S.; Mastelaro, V.R.; Escanhoela, C.A. In-Depth Understanding of the Relation between CuAlO2 Particle Size and Morphology for Ozone Gas Sensor Detection at a Nanoscale Level. ACS Appl. Mater. Interfaces 2014, 6, 21739–21749. [Google Scholar] [CrossRef]
- Xiong, D.; Zeng, X.; Zhang, W.; Wang, H.; Zhao, X.; Chen, W.; Cheng, Y.-B. Synthesis and Characterization of CuAlO2 and AgAlO2 Delafossite Oxides through Low-Temperature Hydrothermal Methods. Inorg. Chem. 2014, 53, 4106–4116. [Google Scholar] [CrossRef]


| Catalyst | Metal Loading 1 (wt %) | BET Surface (m2g−1) | Pore Volume 2 (cm3g−1) | Pore Diameter 3 (nm) |
|---|---|---|---|---|
| α-Al2O3 | - | 69.2 | 0.044 | 2.6 |
| 10Ni–Al | 10.3 | 135.1 | 0.084 | 2.7 |
| 10Co–Al | 10.7 | 16.1 | 0.024 | 7.9 |
| 10Cu–Al | 10.7 | 16.4 | 0.031 | 6.5 |
| Catalyst | T1 | T50 | T100 |
|---|---|---|---|
| 10Ni–Al | 301 | – | – |
| 10Co–Al | 246 | 497 | – |
| 10Cu–Al | 97 | 180 | 250 |
© 2019 by the authors. Licensee MDPI, Basel, Switzerland. This article is an open access article distributed under the terms and conditions of the Creative Commons Attribution (CC BY) license (http://creativecommons.org/licenses/by/4.0/).
Share and Cite
Frikha, K.; Limousy, L.; Bouaziz, J.; Chaari, K.; Josien, L.; Nouali, H.; Michelin, L.; Vidal, L.; Hajjar-Garreau, S.; Bennici, S. Binary Oxides Prepared by Microwave-Assisted Solution Combustion: Synthesis, Characterization and Catalytic Activity. Materials 2019, 12, 910. https://doi.org/10.3390/ma12060910
Frikha K, Limousy L, Bouaziz J, Chaari K, Josien L, Nouali H, Michelin L, Vidal L, Hajjar-Garreau S, Bennici S. Binary Oxides Prepared by Microwave-Assisted Solution Combustion: Synthesis, Characterization and Catalytic Activity. Materials. 2019; 12(6):910. https://doi.org/10.3390/ma12060910
Chicago/Turabian StyleFrikha, Kawthar, Lionel Limousy, Jamel Bouaziz, Kamel Chaari, Ludovic Josien, Habiba Nouali, Laure Michelin, Loic Vidal, Samar Hajjar-Garreau, and Simona Bennici. 2019. "Binary Oxides Prepared by Microwave-Assisted Solution Combustion: Synthesis, Characterization and Catalytic Activity" Materials 12, no. 6: 910. https://doi.org/10.3390/ma12060910