Plasma-Induced Crystallization of TiO2 Nanotubes
by
 , , ,
, , ,
Metka Benčina
1 ,
,
Ita Junkar
1,*,
Rok Zaplotnik
1,
Matjaz Valant
2,3,
Aleš Iglič
4 and 
Miran Mozetič
1 1
Department of Surface Engineering and Optoelectronics, Jožef Stefan Institute, Jamova 39, Ljubljana 1000, Slovenia
2
Materials Research Laboratory, University of Nova Gorica, Vipavska 13, Nova Gorica 5000, Slovenia
3
Institute of Fundamental and Frontier Sciences, University of Electronic Science and Technology of China, Chengdu 610054, China
4
Laboratory of Biophysics, Faculty of Electrical Engineering, University of Ljubljana, Tržaška 25, Ljubljana 1000, Slovenia
*
Author to whom correspondence should be addressed.
Materials 2019, 12(4), 626; https://doi.org/10.3390/ma12040626
Submission received: 21 January 2019
/
Revised: 14 February 2019
/
Accepted: 18 February 2019
/
Published: 20 February 2019
(This article belongs to the Special Issue Ti-Based Biomaterials: Synthesis, Properties and Applications)
Abstract
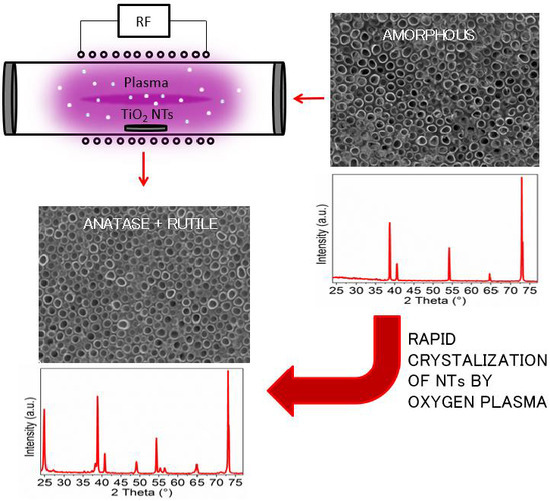
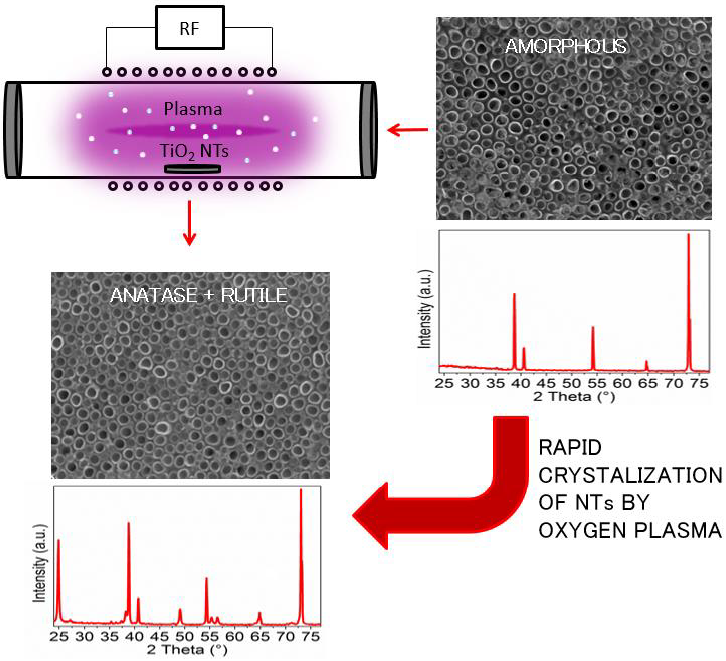
:Facile crystallization of titanium oxide (TiO2) nanotubes (NTs), synthesized by electrochemical anodization, with low pressure non-thermal oxygen plasma is reported. The influence of plasma processing conditions on TiO2 NTs crystal structure and morphology was examined by X-ray diffraction (XRD) and scanning electron microscopy (SEM). For the first time we report the transition of amorphous TiO2 NTs to anatase and rutile crystal structures upon treatment with highly reactive oxygen plasma. This crystallization process has a strong advantage over the conventional heat treatments as it enables rapid crystallization of the surface. Thus the crystalline structure of NTs is obtained in a few seconds of treatment and it does not disrupt the NTs’ morphology. Such a crystallization approach is especially suitable for medical applications in which stable crystallized nanotubular morphology is desired. The last part of the study thus deals with in vitro biological response of whole blood to the TiO2 NTs. The results indicate that application of such surfaces for blood connecting devices is prospective, as practically no platelet adhesion or activation on crystallized TiO2 NTs surfaces was observed.
1. Introduction
Self-aligned TiO2 nanotubes synthesized by electrochemical anodization of Ti foil are highly promising materials for biomedical applications due to their advanced biocompatibility in comparison to commonly used plain metal surfaces, and as such can be employed as orthopaedic and dental implants, vascular stents, antibacterial devices or surfaces and smart drug-delivery platforms [1,2,3,4,5,6,7,8]. Improved biological response to the TiO2 NTs is, among others, the result of increased surface roughness and larger surface area. Moreover, the tunable morphology of NTs that can be controlled by altering the anodization parameters such as voltage and time, allows for selective response of biological material. For instance, proteins, platelets and cell adhesion, cell morphology, proliferation and differentiation are highly affected by the TiO2 NTs diameter [9]. This is especially important in applications, in which the adhesion of certain cell types is preferred, as in the case of vascular stents.
As-anodized amorphous TiO2 NTs are, therefore, often subjected to crystallization process in order to enhance their bio-performance. It has been shown that annealed TiO2 NTs layers with anatase crystal structure have a much better corrosion resistance and bioactivity than amorphous NTs; moreover, they tend to induce more, and faster, hydroxyapatite deposition, which is crucial for successful bone bonding (osteointegration) ability of the body implants [10,11,12]. In addition, the proliferation and mineralization of osteoblasts cultured on anatase or a mixture of anatase⁄rutile TiO2 NTs was significantly higher than on the surface of as-anodized amorphous TiO2 NTs [13]. Crystallized TiO2 NTs have also good bacterial resistance; it was found that such layers inhibit the growth of S. aureus and P. aeruginosa [5], which is important for designing medical devices, since implant-associated infections present a serious health care concern. In addition, the enhanced biocompatibility of crystalline TiO2 NTs could also be linked with increasing Ti-OH functional groups, responsible for enhancing wettability and apatite deposition [14,15] and increasing stability in bioliquids [16].
Crystallization of TiO2 NTs induced by annealing in a conventional furnace is a well-established process; the atom rearrangements occur due to elevated temperatures. However, such crystallization requires high temperatures and is time consuming in comparison with the plasma-induced crystallization presented in this contribution. For instance, in order to achieve anatase, mixture of anatase/rutile and rutile crystal structure, TiO2 NTs should undergo annealing in the furnace for at least 2 h at 450 °C, 550 °C [10] and 800 °C [17], respectively. Besides, changes in the morphology of TiO2 NTs present a significant drawback of such crystallization process; the annealing in a furnace at 800 °C results in the transition of anatase NTs to a dense rutile layer [17]. By contrast, hydrothermal treatment presents an intriguing low-temperature crystallization method that is catalysed by pressure and mineralizing agents [18]. Liu et al. [19] reported hydrothermal reaction in an autoclave at a temperature of less than 180 °C for 4 h, which led to the amorphous-to-ananase transition of TiO2 NTs. In spite of low temperature requirements, hydrothermal crystallization adversely alters TiO2 NTs morphology and leads to the formation of aggregated anatase nano-particles on the surface of NTs at about 200 °C [20]. Lamberti et al. [14] demonstrated another attractive near-room temperature (50 °C) crystallization process of amorphous TiO2 NTs, which led to anatase crystal phase formation after only 30 min of sample exposure to water vapour [14,20]. However, such a crystallization method also initiates the formation of crystals at the outer and inner walls of the NTs, which finally leads to transformation of nanotubes to nanorods. For this reason, there is an indispensable need to develop novel crystallization processes that would preserve the morphology of the materials.
In the present research, the transformation of rather amorphous TiO2 NTs to anatase or mixture of anatase/rutile crystal structure by a non-thermal oxygen plasma process, is, according to our best knowledge, reported for the first time. Fast amorphous-to-anatase or -anatase/rutile transition and unaltered NTs morphology are the major advantages of such crystallization before conventional processes, for which the preservation of morphology is still a challenge. Although such a time-saving method is convenient for inducing crystallinity of the nanomaterials/thin films [21,22,23], there is a lack of information about the mechanisms involved in the crystallization process. In this contribution, the influence of plasma processing conditions on the crystal structure and morphology of the TiO2 NTs is therefore examined. In addition, the biological aspects of plasma treated TiO2 NTs are presented. It has already been shown that surfaces treated by highly reactive oxygen plasma improve biological response. For instance, Junkar et al. [24] showed that plasma treatment allows for TiO2 NTs surface functionalization and enhancement of osteoblast-like cell responses. Authors also confirmed cleaning and sterilizing effects of plasma treatment [25]. Moreover, the wettability of ZrO2 was noticeably improved by an oxygen plasma treatment, which promoted the attachment, proliferation and differentiation of human osteoblast-like cells [26]. Therefore, simultaneous plasma treatment and crystallization of the material with already tunable morphology offers highly needed improvements for devices used in biomedical applications.
2. Materials and Methods
2.1. Materials
Titanium foil (Advent, 0.1 mm thickness, 99.6%), ethylene glycol (Fluka, ≥99.5%), ammonium fluoride—NH4F (Sigma Aldrich, 28.0–30.0%), hydrofluoric acid—HF (Sigma Aldrich, ≥40%) acetone (Honeywell Riedel–de Haen, 99.5%), ethanol (Sigma Aldrich, 96%), phosphate-buffered saline—PBS (Sigma Aldrich), and glutaraldehyde solution (Sigma Aldrich, 25% in H2O) deionized water (miliQ).
2.2. Synthesis of TiO2 NTs by Electrochemical Anodization
The TiO2 NTs were fabricated by an electrochemical anodization method as described in Refs. [24,25]. The synthesis was carried out at room temperature (≈20 °C) in a two electrode system (Pt/Ti) with the size 10 × 10 mm2 and working distance of 15 mm. The thickness of the Ti electrode was 0.10 mm. Before anodization, the Ti foil was ultrasonically cleaned in acetone, ethanol and deionized water for 5 min in each and further dried under a nitrogen stream. The electrolyte used in this step was composed of ethylene glycol and NH4F (0.35 wt.%) and H2O (1.7 wt.%). The nanotubular layer grown in this step was then detached from the substrate with a successive ultrasonication in H2O, acetone and ethanol in order to obtain a pre-dimpled surface, which led to enhanced homogeneity of the NTs’ surface. In the second step of anodization process, the pre-treated Ti foils were used as a substrate to grow NTs. The electrolyte based on the ethylene glycol, containing water and HF was used and the detailed synthesis parameters of these steps are presented in Table 1. The as-synthesized NTs were kept in ethanol for 2 h in order to remove components from the electrolyte and then dried under a nitrogen stream. The as-prepared NTs were used for further plasma processing (output power 200–800 W for different times) or annealed at 450 °C for 2 h in a furnace with annealing/cooling rate 8 °C/min.
2.3. Oxygen Plasma Treatment
Treatment of TiO2 NTs was performed by oxygen plasma in the plasma reactor designed in house. The system was evacuated with a two-stage oil rotary pump with a nominal pumping speed of 80 m3 h−1. The discharge chamber was a Pyrex tube with a length of 80 cm and an inner diameter of 3.6 cm. Gaseous plasma was created with an inductively coupled radiofrequency (RF) generator (CESAR 1310, Advanced Energy, Fort Collins, Colorado, USA), operating at a frequency of 13.56 MHz and a nominal power of 1000 W. Generator powers between 200–800 W were used. Commercially available oxygen was leaked into the discharge chamber and the pressure was measured with an absolute vacuum gauge. The pressure during the plasma treatment was fixed at 50 Pa which allows for the highest degree of dissociation of oxygen molecules for this particular plasma reactor. The samples were placed on an object glass and treated for different periods of time and with different output powers, one at a time. Details about the behaviour of reactive gaseous species versus nominal power of the RF generator are presented elsewhere [27].
2.4. Characterization
2.4.1. X-ray Diffraction (XRD) Spectroscopy Analysis
X-ray diffraction (XRD) was performed using MiniFlex 600 Benchtop X-ray diffractometer (Rigaku, Tokyo, Japan) equipped with Cu K-α radiation (1.541 Å) over the 2θ range 10–70°, with a step size of 0.017°, divergence slit of 0.218° and counting step time of 25 s in continuous scanning mode. Carbon tape was used to mount the samples on the glass holder.
2.4.2. Scanning Electron Microscope (SEM) Analysis
Morphology of the materials was analysed with a JSM 7100F scanning electron microscope (SEM, JEOL Ltd., Tokyo, Japan). For biological evaluation of platelets on the surface, the samples were coated with gold/palladium and examined by SEM at an accelerating voltage of 15 kV. The test was done in triplicates and only representative images are shown in this paper.
2.4.3. Temperature Measurements
During the exposure of the samples to plasma, the temperature was measured with a custom-made K-type thermocouple). Chromel and alumel wires (Goodfellow Cambridge Ltd., Huntingdon, UK) were spot welded on the rear of the samples so they were not influenced by plasma. A Keithley Model 2100 digital multimeter (Keithley Instruments/Tektronix, OH, USA) and custom-made software were used to record the time evolution of the samples temperature.
2.5. In Vitro Biological Response—Interaction With Whole Blood
All subjects gave their informed consent for inclusion before they participated in the study. The study was conducted in accordance with the Declaration of Helsinki, and the protocol was approved by the Ethics Committee of Slovenia (56/03/10). Whole blood was obtained from healthy volunteers via vein puncture. The blood was drawn into 9 ml tubes already coated with trisodium citrate anticoagulant. The material samples—Ti foil, amorphous and annealed (anatase) TiO2 NTs of 100 nm in diameter (7 × 7 mm2)—were incubated with the 250 μL of whole blood for 45 min at room temperature in the 24-well cell culture plates. Afterwards, 250 μL of PBS was added to the incubated samples. The blood with PBS was then removed and the samples were rinsed 3 times with 250 μL of PBS in order to remove weakly adherent platelets and other biological material. The adherent platelets were further fixed by 400 μL of 0.5% glutaraldehyde solution for 2 h at room temperature. Then the materials were rinsed with PBS and dehydrated by using a graded ethanol series (50 vol.%, 70 vol.%, 80 vol.%, 90 vol.%, 100 vol.% and again 100 vol.% of ethanol) for 5 min and in the last stage (100 vol.% ethanol) for 10 min. Afterwards the samples were dried with liquid nitrogen and stored in vacuum.
3. Results and Discussion
3.1. Crystal Structure Analysis
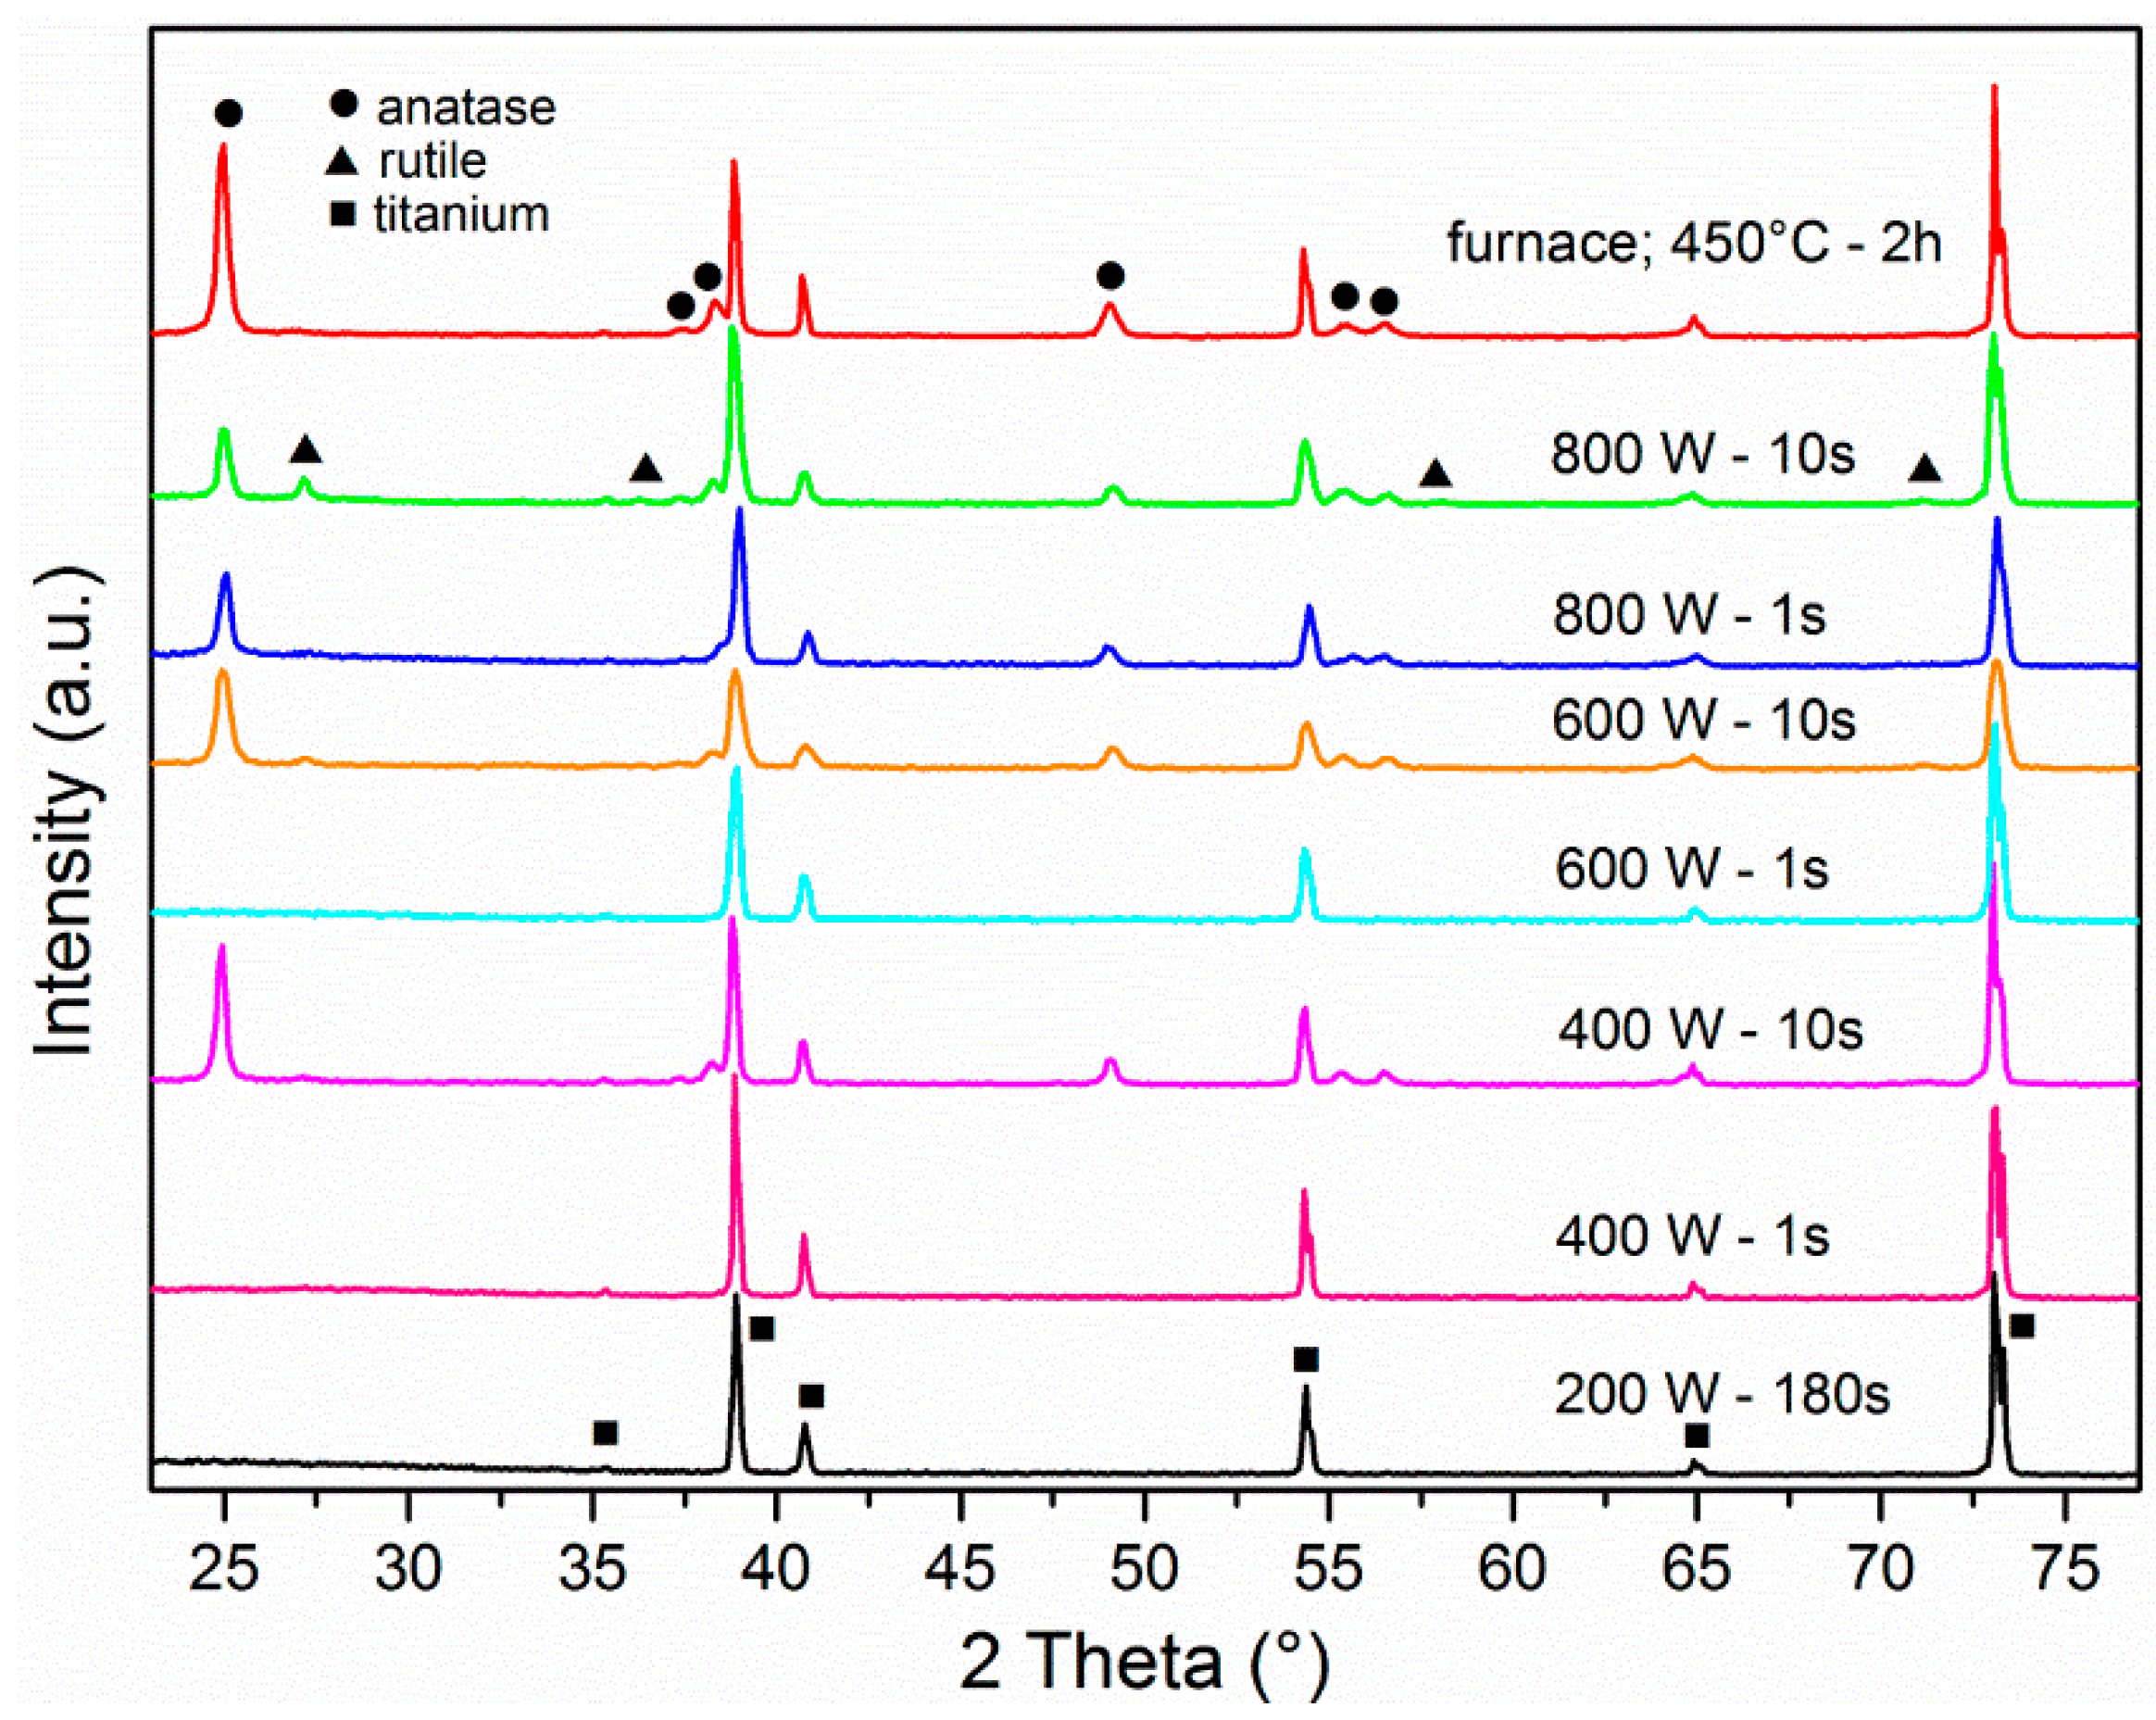
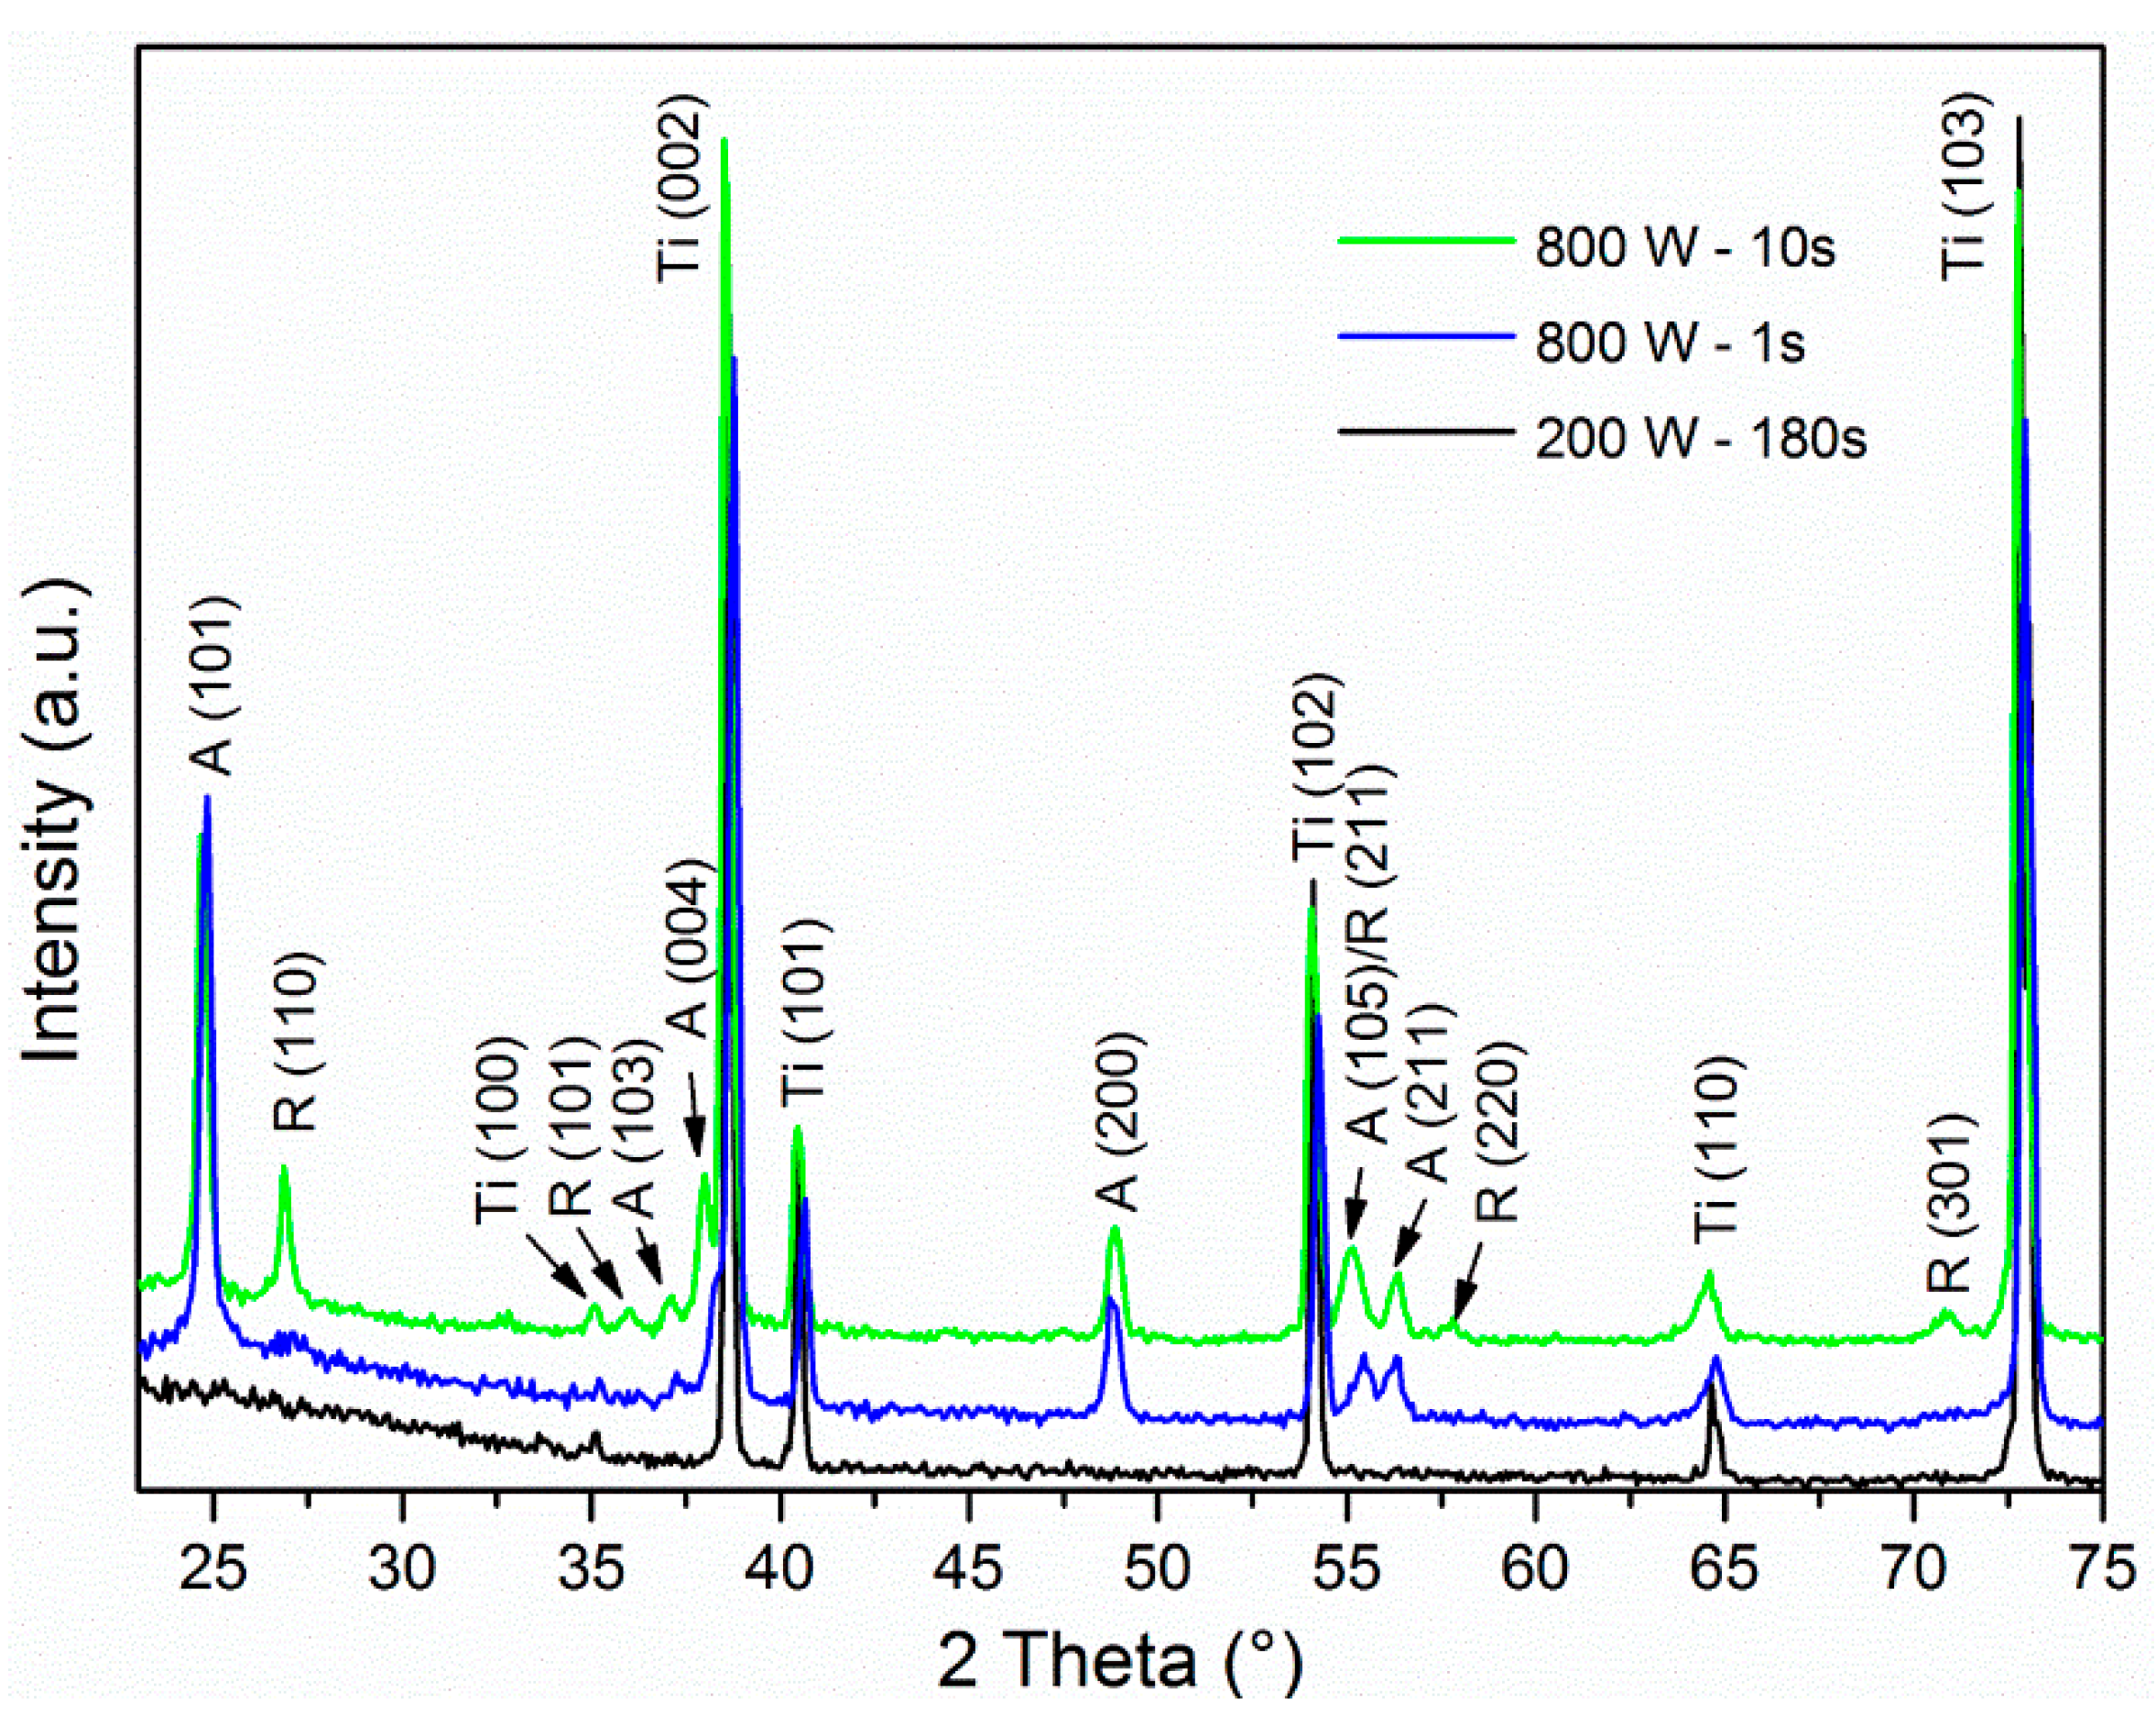
The TiO2 NTs were subjected either to annealing or highly reactive oxygen plasma treatment at different input powers and at different treatment times and the influence of such treatments was further studied in terms of altered surface morphology and crystallization. It has been shown in our previous work [25] and recently also in Ref. [28] that TiO2 NTs were deformed after exposure to elevated temperatures and that NTs’ stability depended on diameter (larger diameter NTs are more resistant to thermal degradation). In the present study, the alteration in crystallinity of TiO2 NTs was studied by X-ray diffraction spectroscopy, which revealed that the treatment with highly reactive oxygen plasma at different powers significantly influences the TiO2 NTs crystal structure. The as-anodized TiO2 NTs samples are amorphous and remain uncrystallized even after 3 min of exposure to highly reactive oxygen plasma at 200 W (Figure 1). The XRD data show that the Ti foil, which is used as a substrate for TiO2 NTs fabrication, is detected by XRD although NTs of 100 nm in diameter have a length of about 2.5 µm. The higher power of plasma, more than 400 W, seems to already induce crystallization if samples are exposed to plasma for more than 10 s. Actually a mixture of anatase and rutile crystal phase (hardy observable peak at 2θ = 36.5° as seen in Figure 1) appears after the treatment of TiO2 NTs for 10 s in plasma with the power of 400 W and 600 W. Interestingly, the 1 s plasma exposure at these conditions is not enough to initiate the change of crystal structure, since no anatase nor rutile peaks were detected. However, the plasma treatment at 800 W for 1 s and 10 s results in anatase and a mixture of anatase/rutile crystal phases, respectively (Figure 1 and Figure 2). For comparison, the annealing of TiO2 NTs in a conventional furnace at 450 °C requires 2 h to induce the transition of amorphous phase to anatase crystal structure.
In order to study the effect of synthesized TiO2 layer thickness on the crystallization in plasma, TiO2 NTs of 15 nm in diameter and length of about 0.2 µm were treated with oxygen plasma at 800 W for 1 s and 10 s. Only one anatase-phase peak at 2θ = 25° (101) was detected for the TiO2 NTs sample treated with plasma at 800 W for 1 s, indicating that the sample is still mainly amorphous (Figure 3). Interestingly, for TiO2 NTs of 100 nm in diameter the anatase crystal phase is already observed after 1 s of treatment at 800 W (Figure 1 and Figure 2). However, the rutile crystal phase without any evidence of anatase prevails when plasma treatment at 800 W is prolonged to 10 s for TiO2 NTs of 15 nm in diameter (Figure 3). For comparison, TiO2 NTs of 100 nm in diameter crystallize in mixture of anatase/rutile phase after prolonged plasma treatment (10 s). The XRD spectra of plain Ti foil, which is used as a substrate for TiO2 NTs fabrication, are presented in Figure 3; it can be observed that XRD pattern of the plasma-treated sample at 800 W for 1 s exhibit small rutile and anatase peaks at 2θ = 36.5° and 37.5°, respectively. However, an intense rutile-phase peak at 2θ = 27° is confirmed after the exposure of the Ti foil to plasma of power 800 W for 10 s. These results show that although smaller-sized nanoparticles require less intensive plasma conditions to induce crystallization [21,29], the thermal effects on TiO2 NTs with 2.5 µm length and 0.21 µm length may be different. It is also noteworthy that plasma treatment induce the formation of crystalline oxide layer on the surface of the Ti foil.
3.2. Morphology Analysis
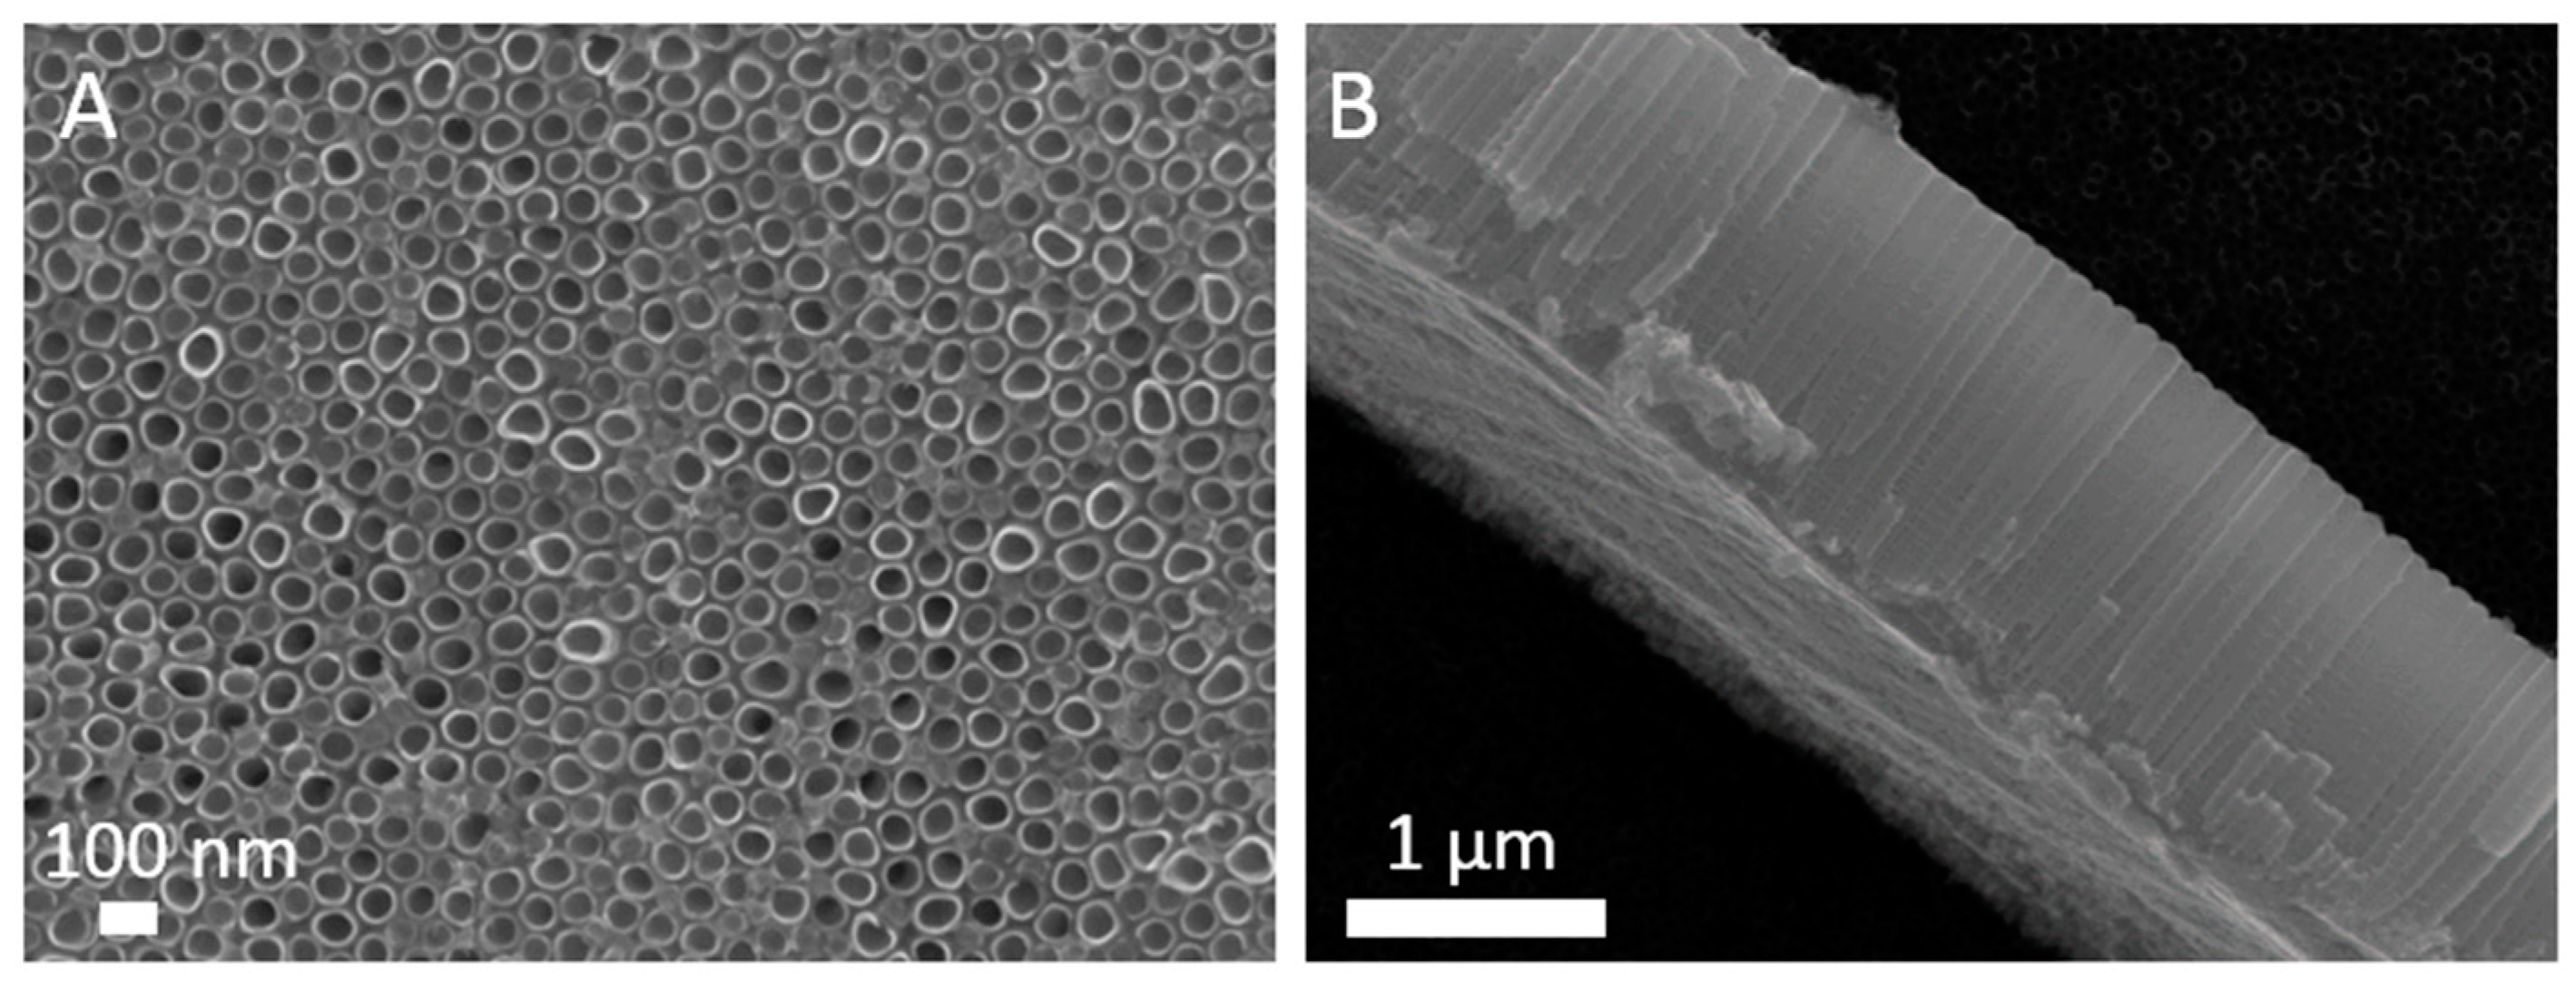
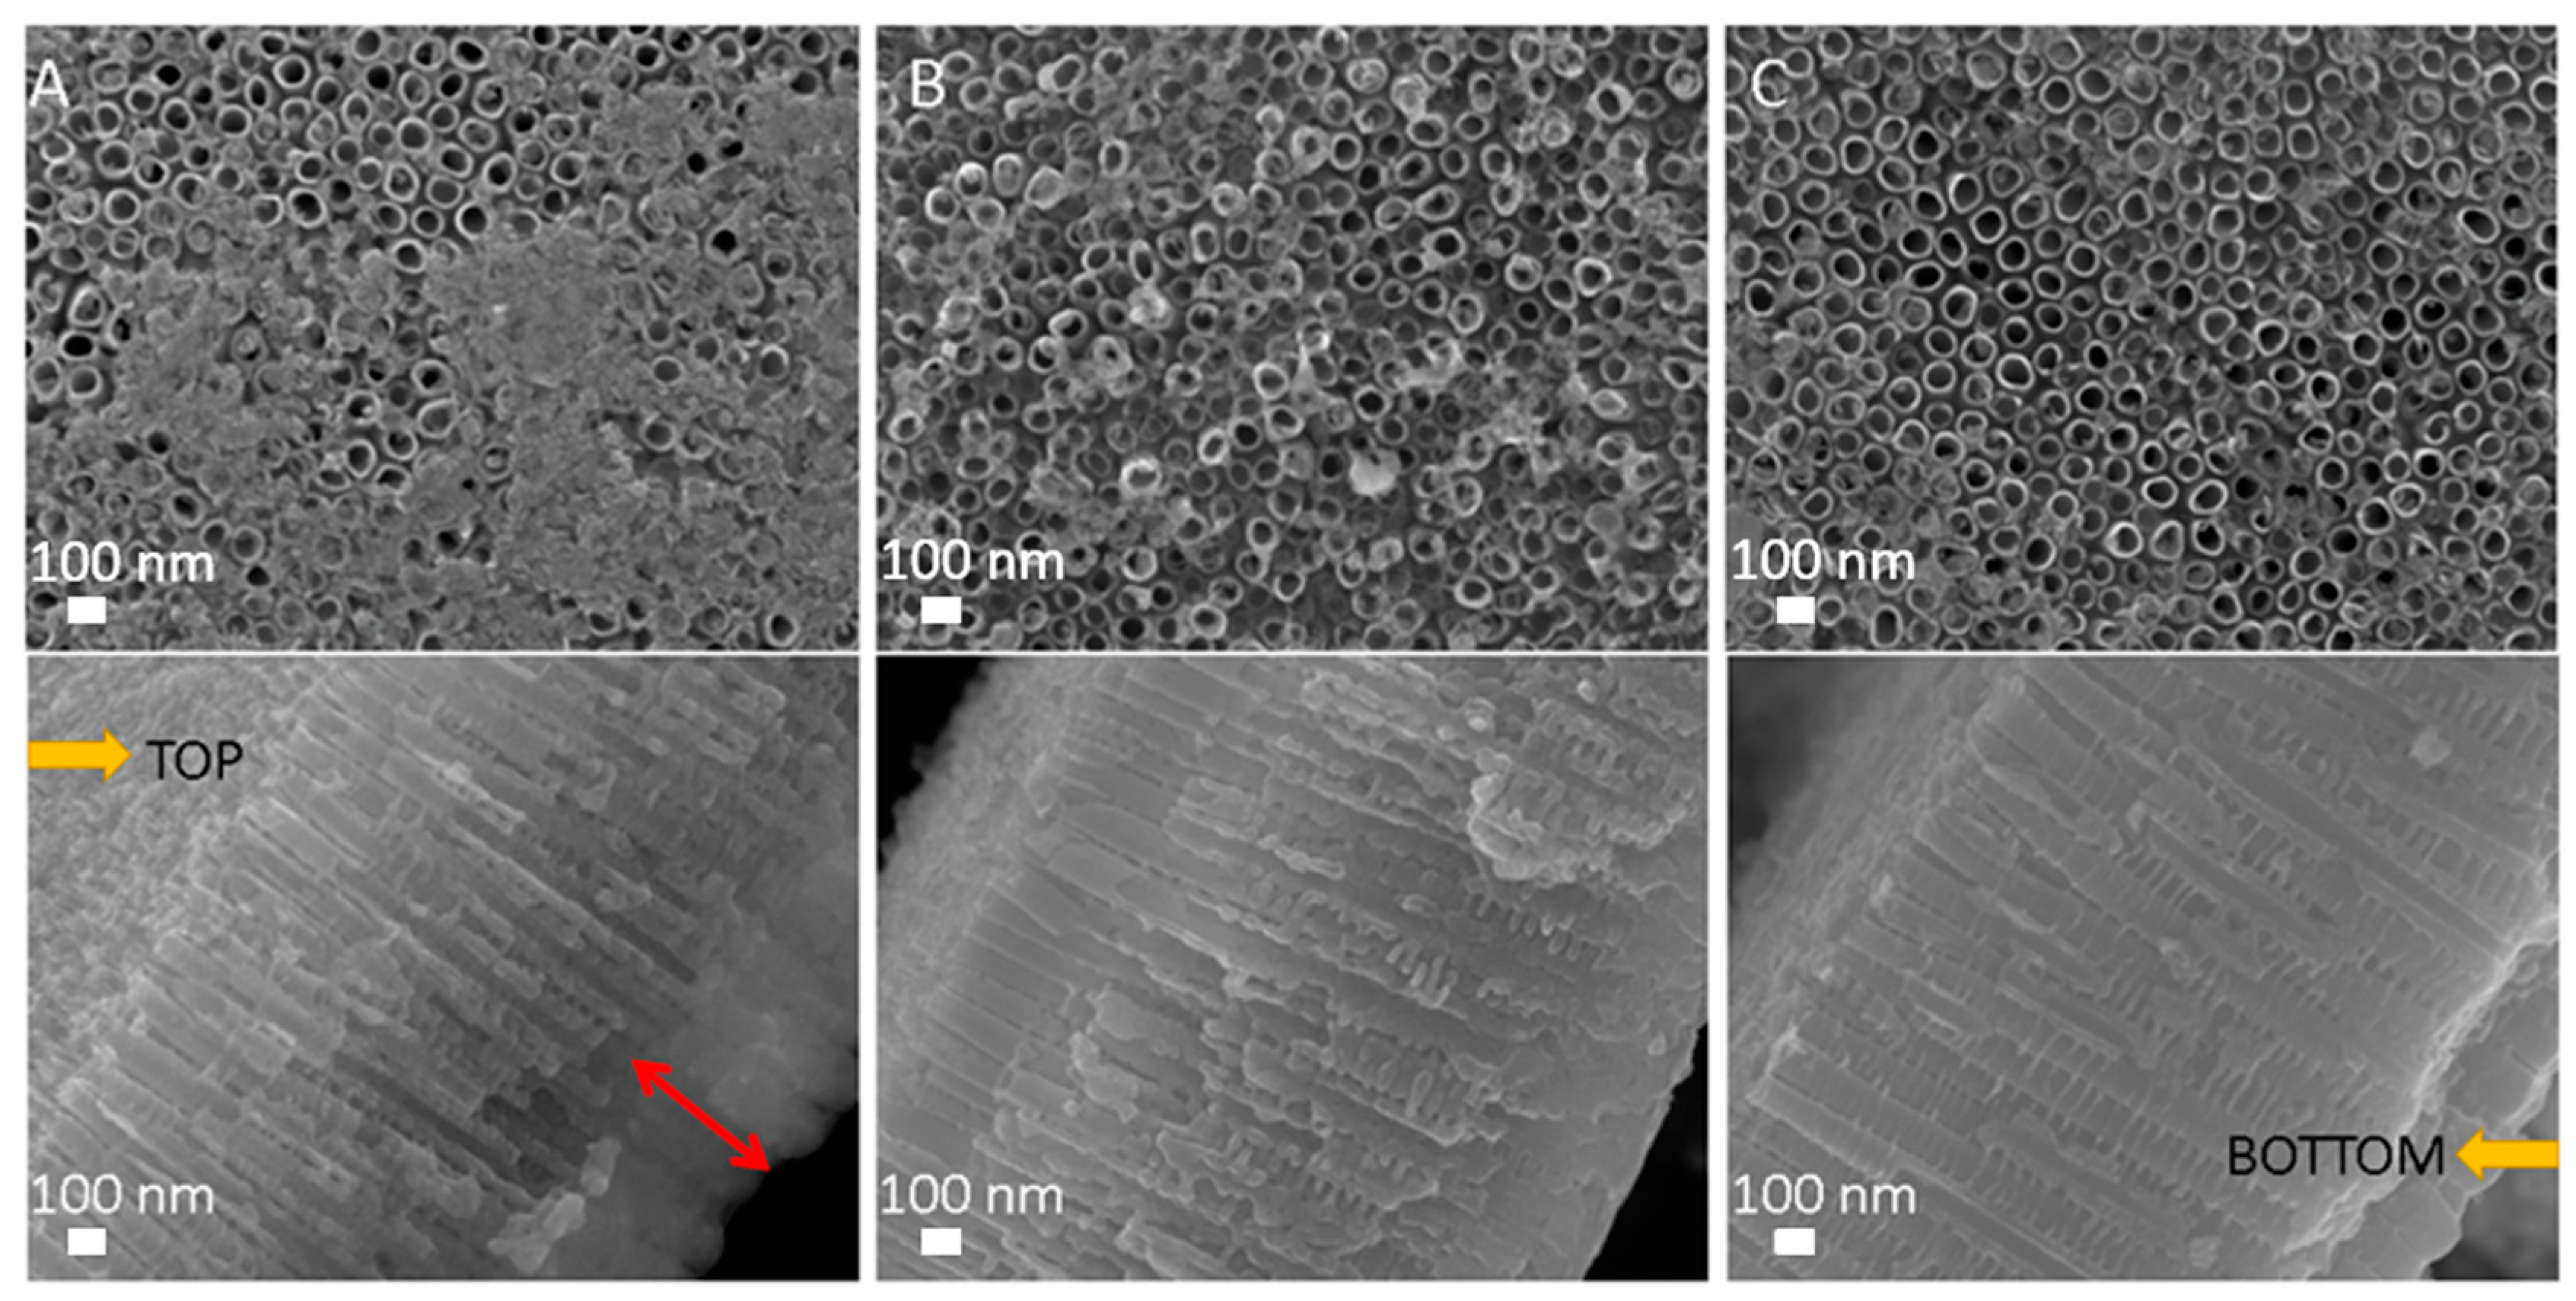
The morphology of as-anodized TiO2 NTs (100 nm in diameter) is shown in Figure 4, while the morphology of TiO2 NTs exposed to oxygen plasma is shown in Figure 5. It is noteworthy that TiO2 NTs formed on the Ti foil are stable at plasma conditions used in the present study, except the NTs treated with plasma of power 800 W for 10 s. SEM analysis of TiO2 NTs treated at 800 W for 10 s showed that the NTs structure is destroyed as can be seen from Figure 5, where the comparisons between plasma-treated samples at 800 W for 10 s, 800 W for 1 s and 400 W for 10 s are presented. The tops of TiO2 NTs treated at 800 W for 10 s are partially closed, most probably due to collapsing of NTs walls (Figure 5A) and increase in stoichiometric oxide on the surface. It is also evident form Figure 5A that the bottom layer of the NTs is destroyed or even that there is a formation of oxide layer as already observed in Ref. [30], which could be caused by a longer exposure to high temperatures. Mazare et al. [5] observed the same loss of nanotubular structure after annealing at high temperatures (i.e., 550 °C, 650 °C and 750 °C). It was previously reported that the formation of a rutile oxide layer is initiated at the metal-nanotube interface during the annealing [30], and therefore changes in crystal structure firstly occur at the bottom layer of the NTs. A similar structure, although not destroyed, was formed when the TiO2 NTs were treated at 800 W for 1 s (Figure 5B). However, the morphology of TiO2 NTs treated at 400 W for 10 s is not destroyed and the tubes are well defined and opened (Figure 5C).
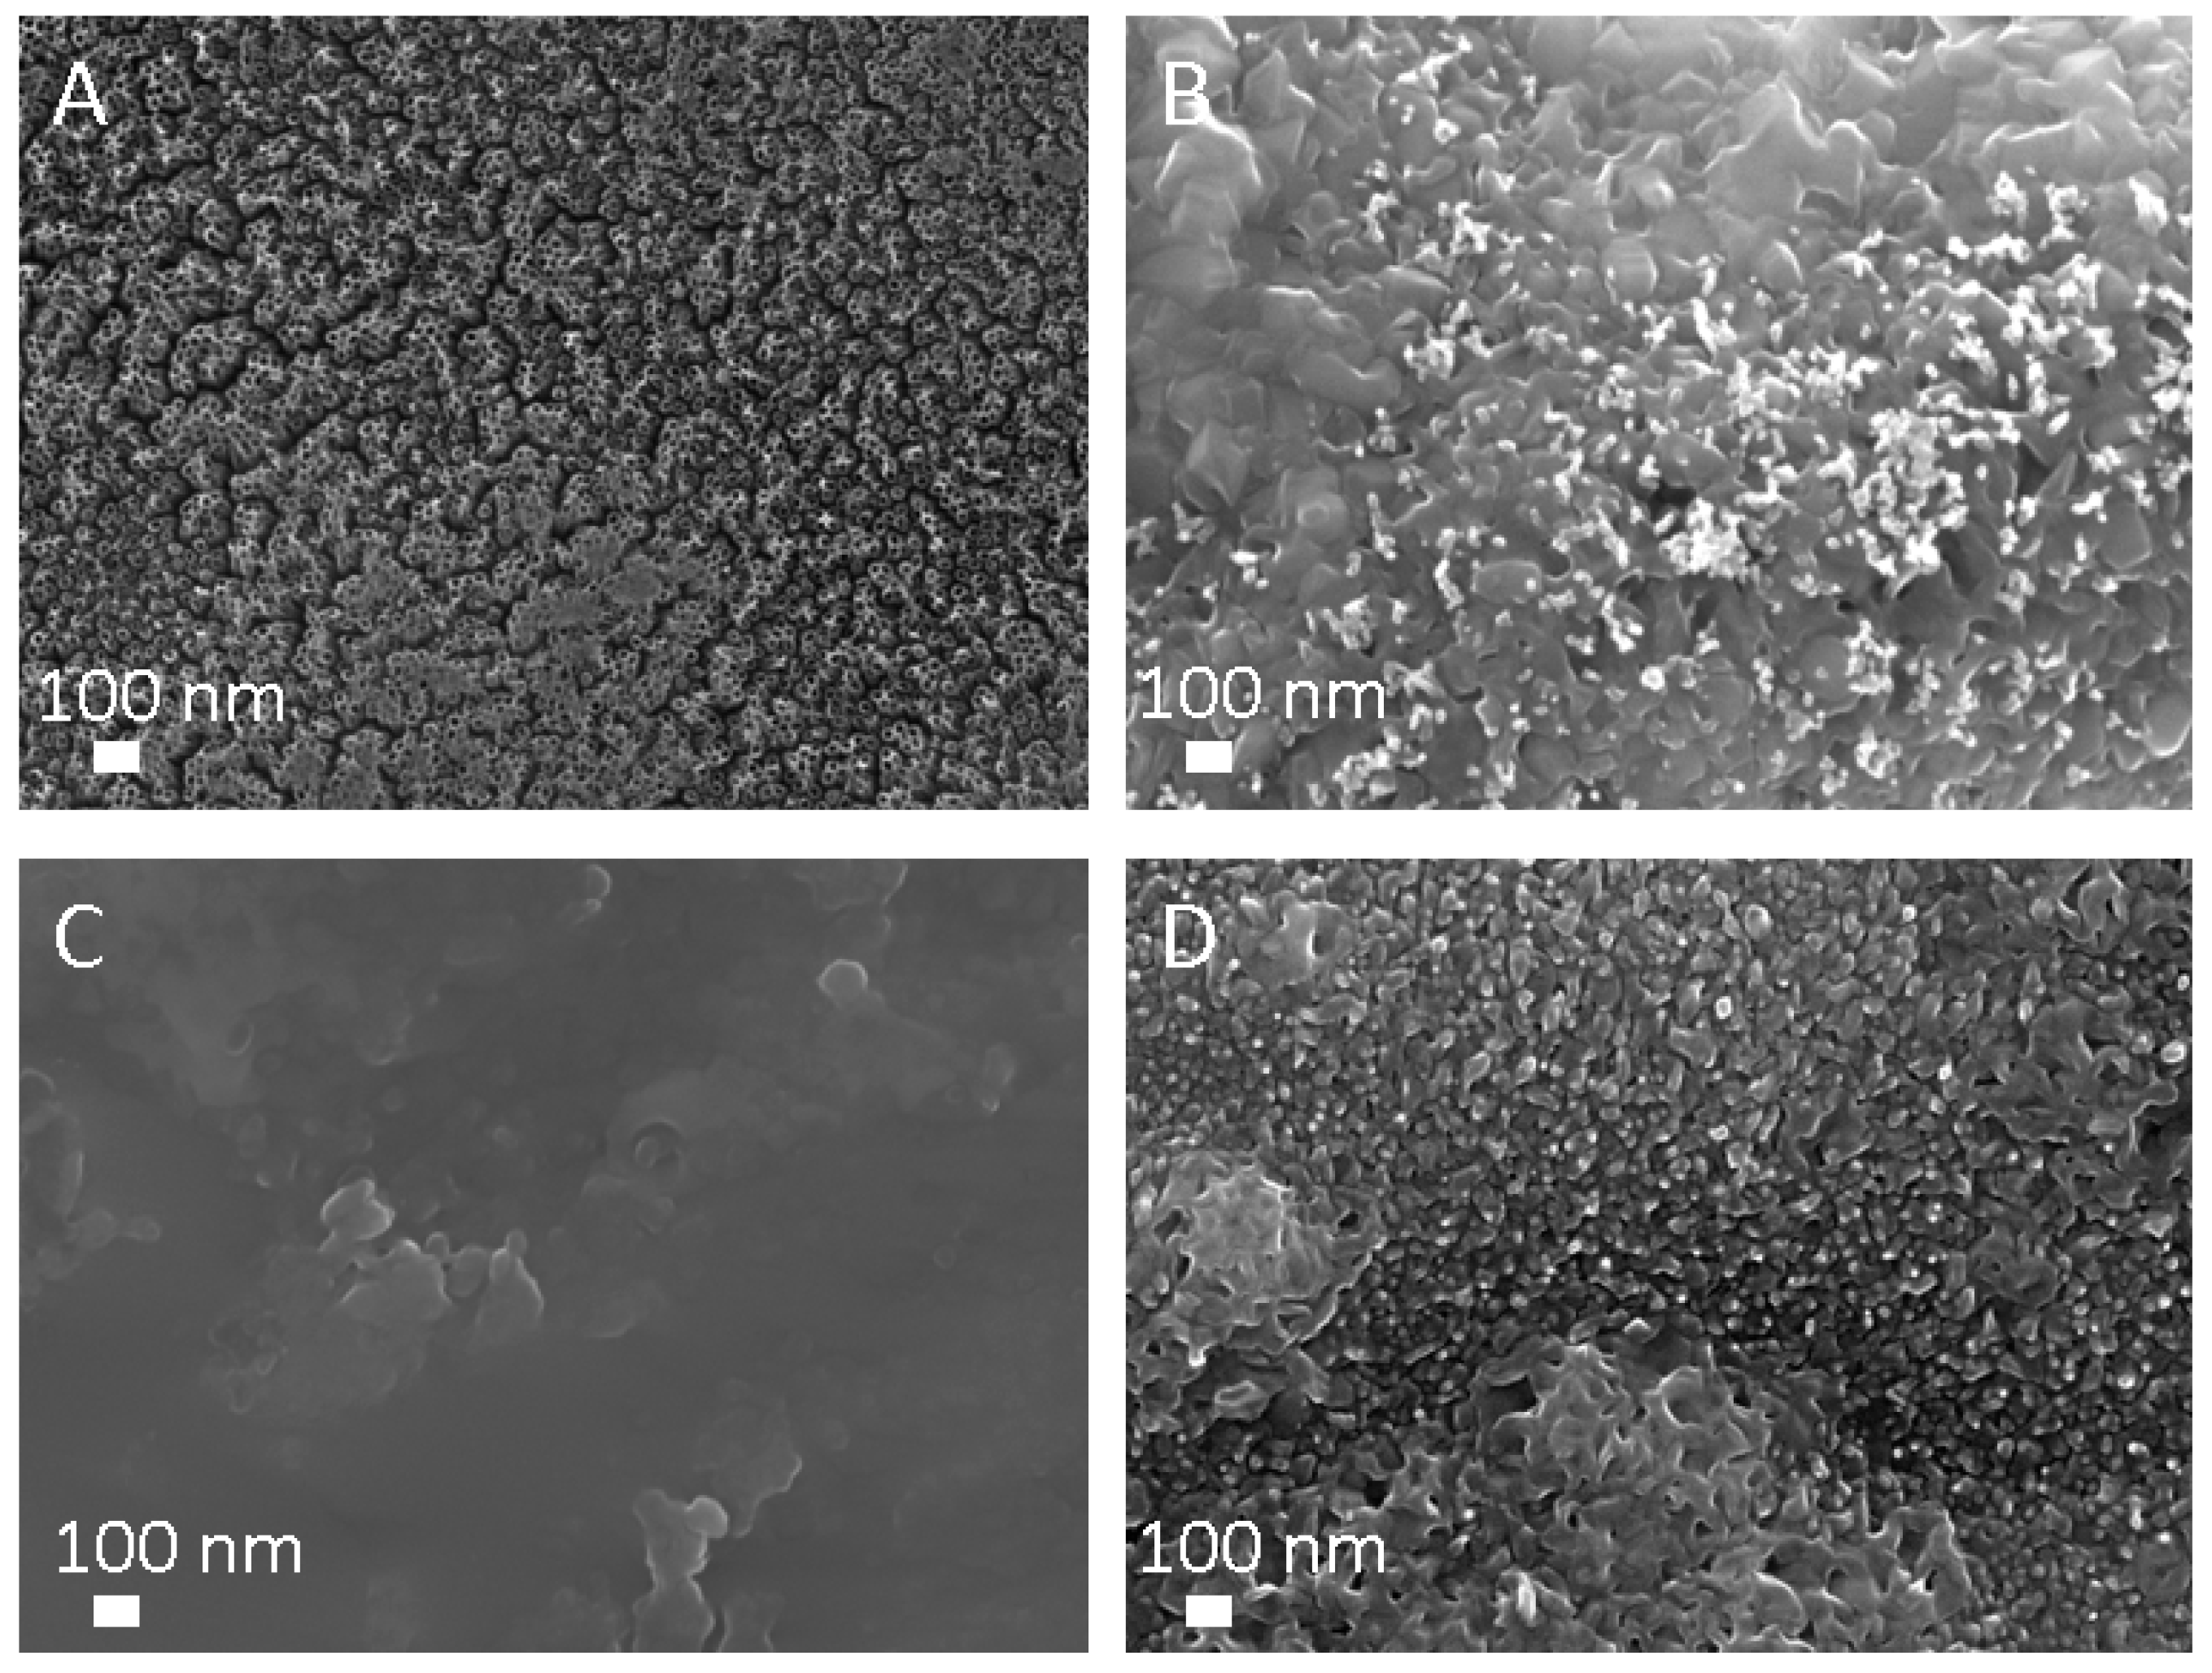
SEM analysis revealed that TiO2 NTs of 15 nm in diameter have open tops and their structure is not destroyed after treatment with plasma at 800 W for 1 s (Figure 6A). However, NTs are completely destroyed after plasma treatment at 800 W for 10 s (Figure 6B). Ti foil morphology is unaltered after 1 s plasma treatment at 800 W (Figure 6C), while changes in the morphology of Ti foil after plasma treatment at 800 W for 10 s can be observed; the surface is covered with nanostructures (fused oxide particles) as seen in Figure 6D.
3.3. Temperature Measurements
Crystallization of the materials in a furnace is governed by the change in temperature. Several studies report on light-induced [31,32,33], laser-induced [34,35], and microwave-induced [36] crystallization, which are also correlated with sample heating. In the present study we used a plasma treatment and the temperature of the samples during the treatments in correlation with plasma output power were measured. As evident from Table 2, the temperature of the sample increases with increasing output power of the plasma reactor in the time range up to about 10 s. It has been previously reported that plasma used in the present study operates in two different modes, E and H; The E-mode prevails at a low input power and is defined by a relatively low electron density, high electron temperature and low light emission, while the H-mode at higher input power represents a higher electron density, somehow lower electron temperature and higher light emission [37]. Zaplotnik et al. [27] measured the transition from E- to H–mode in the same plasma system as used in this study. It was found that the E–H transition occurs at the generator power of about 400 W at the pressure of 50 Pa. Below the output power of 400 W, the power transmission to plasma is not ideal; for example, at generator forward power of 200 W, the forward minus reflected power is about 65 W, while for example at 400 W, there is much lower reflected power which means the transmission of power is much better. Exposure of TiO2 NTs to H-mode plasma subjects the sample, among others, to more intense electron density and light emission. Therefore, the samples exposed to H-mode for a sufficient time could crystallize in seconds, while exposure of samples to E-mode, even for 3 min, does not initiate the crystallization.
Although the process of nanoparticles synthesis by plasma treatment has already been reported [21], there is a lack of reports and detailed mechanisms about the crystallization upon treatment with non-thermal plasmas. Ohsaki et al. [23] claim that the crystallization of sol-gel derived TiO2 thin films can be achieved within a few minutes by a non-thermal plasma processing. The authors suggest that crystallization of the materials should be derived from the excitation by the RF electromagnetic field and not plasma itself. Similarly, An et al. [38] speculate that formation of the crystalline grains of BaTiO3 is due to the energy provided by ion bombardment. Contrary, Kramer et al. [21] suggested that the silicon nanoparticles exceed the gas temperature in non-thermal plasmas (370–430 K/97–157 °C) to the point of sufficient temperature for crystallization (up to 700 K/427 °C), although measurements showed that the average temperature of the silicon nanoparticles exposed to plasma was close to the gas temperature. According to the authors [21], crystallization of the nanoparticles by non-thermal plasma occurs due to the electron ion recombination and reactions of radicals on the nanoparticle’s surface. Similarly, Lopez et al. [22] demonstrated that plasma exposure allowed for crystallization of silicon nanoparticles due to the heating of the nanoparticles to the temperature of 1100 K/827 °C.
In present study, the correlations between TiO2 NTs crystal structure and plasma processing conditions have been studied. It has been shown that TiO2 NTs crystallize to anatase and at appropriate conditions also to rutile phase when exposed to highly reactive oxygen plasma for sufficient time and at appropriate plasma power. It was shown that the mixture of anatase/rutile crystal structure was achieved after 10 s at the power of 400 W, where the measured temperature of the sample was above 1210 °C. These operating conditions allow more intense physical processes which occur during interaction of plasma species with the sample. We presume that these interactions contribute to the alteration of the sample’s crystal structure, mainly due to rapid heating of the sample induced by surface recombination of neutral oxygen atoms and ion neutralization. However, the contribution of these two mechanisms to the floating sample heating in electrodes low pressure oxygen plasma are not of the same order. The densities of the ions are a few orders of magnitude lower than the densities of the neutral oxygen atoms and, therefore, the heating of the sample due to the ion neutralization can be neglected [39]. Therefore, the heating of samples (PH) can be expressed with the formula (1):
where γ is the recombination coefficient of the oxygen atoms for the specific surface, j is the flux of the oxygen atoms onto the sample surface and WD is the dissociation energy of oxygen molecules. At the same time the sample is being cooled, where two most important mechanisms are radiation and convection. The radiation part (Pr) is described with the Stefan–Boltzmann law (2):
where A is the surface area of the sample, ε is the emissivity, σ is the Stefan–Boltzmann constant and T is the sample temperature. The convection part (Pc) is a linear function of temperature and can be described as (3):
where h is the convection coefficient. The sample immersed in plasma reaches steady temperature when the heating part is equal to the sum of the cooling parts (4):
PH = γ·j·WD/2,
Pr = A·ε·σ·T4,
Pc = h·A·T,
PH = Pr + Pc,
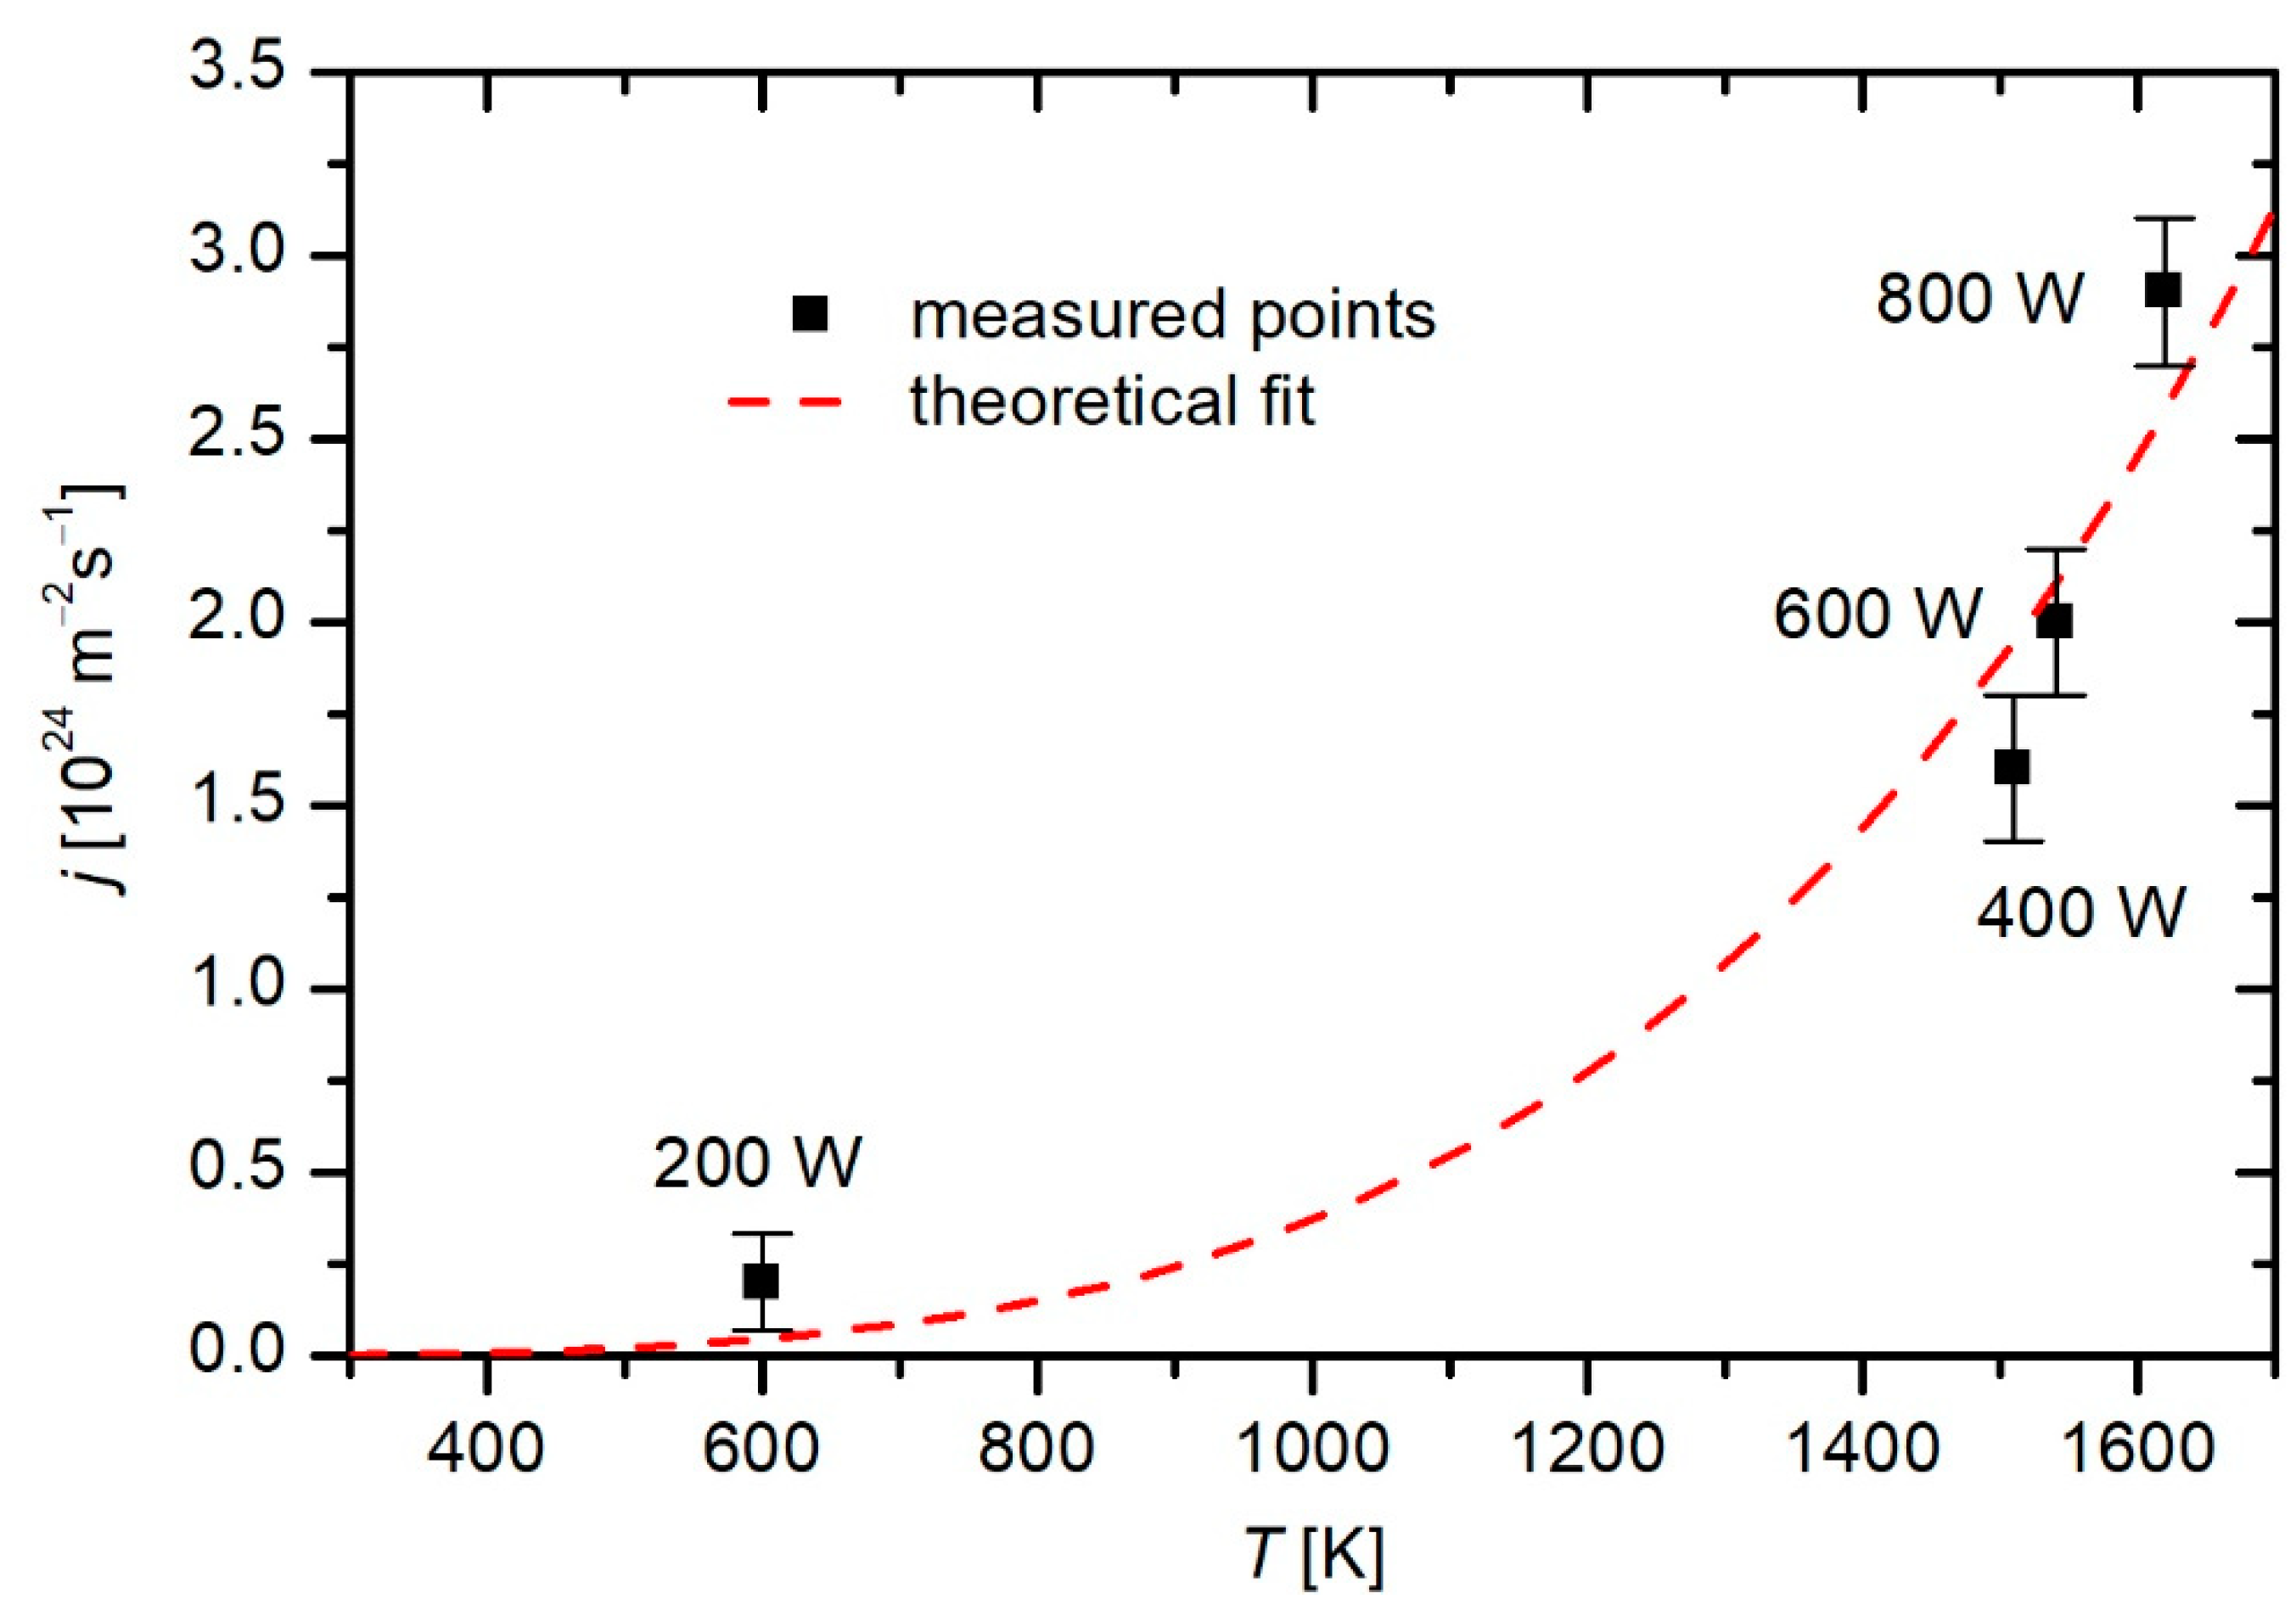
From here we can see that larger flux of the oxygen atoms means a higher temperature of the sample. In Figure 7 the flux of oxygen atoms versus the steady temperature of the samples of NTs of 100 nm in diameter are presented. In this figure the measure points are those presented in Table 2, and the corresponding fluxes were measured with a cobalt catalytic probe. The detailed measurement technique is described elsewhere [27]. It should be noted that in this case only the measured points of samples that reached the steady temperature were used. The theoretical fit is that derived from previous formulas for cooling and heating of samples in plasma [27] taking into account the coefficient γ = 1.
Destruction of the NTs was observed at higher power plasma (800 W) at prolonged treatment (more than a second). The crystallization mechanisms of TiO2 in plasma can be correlated with RF electromagnetic field, vacuum ultraviolet radiation, interaction with radicals and ions which induce sample heating, and chemical reactions. However, the prevailing influence of each parameter alone and its possible synergistic influence is not yet understood and definitely beyond the scope of this paper. Further studies in this direction should be conducted. The results of this study confirmed that the temperature, which was measured on the bottom surface of the samples during the treatments, plays an important role in TiO2 NTs crystallization.
3.4. In Vitro Biological Response—Interaction with Whole Blood
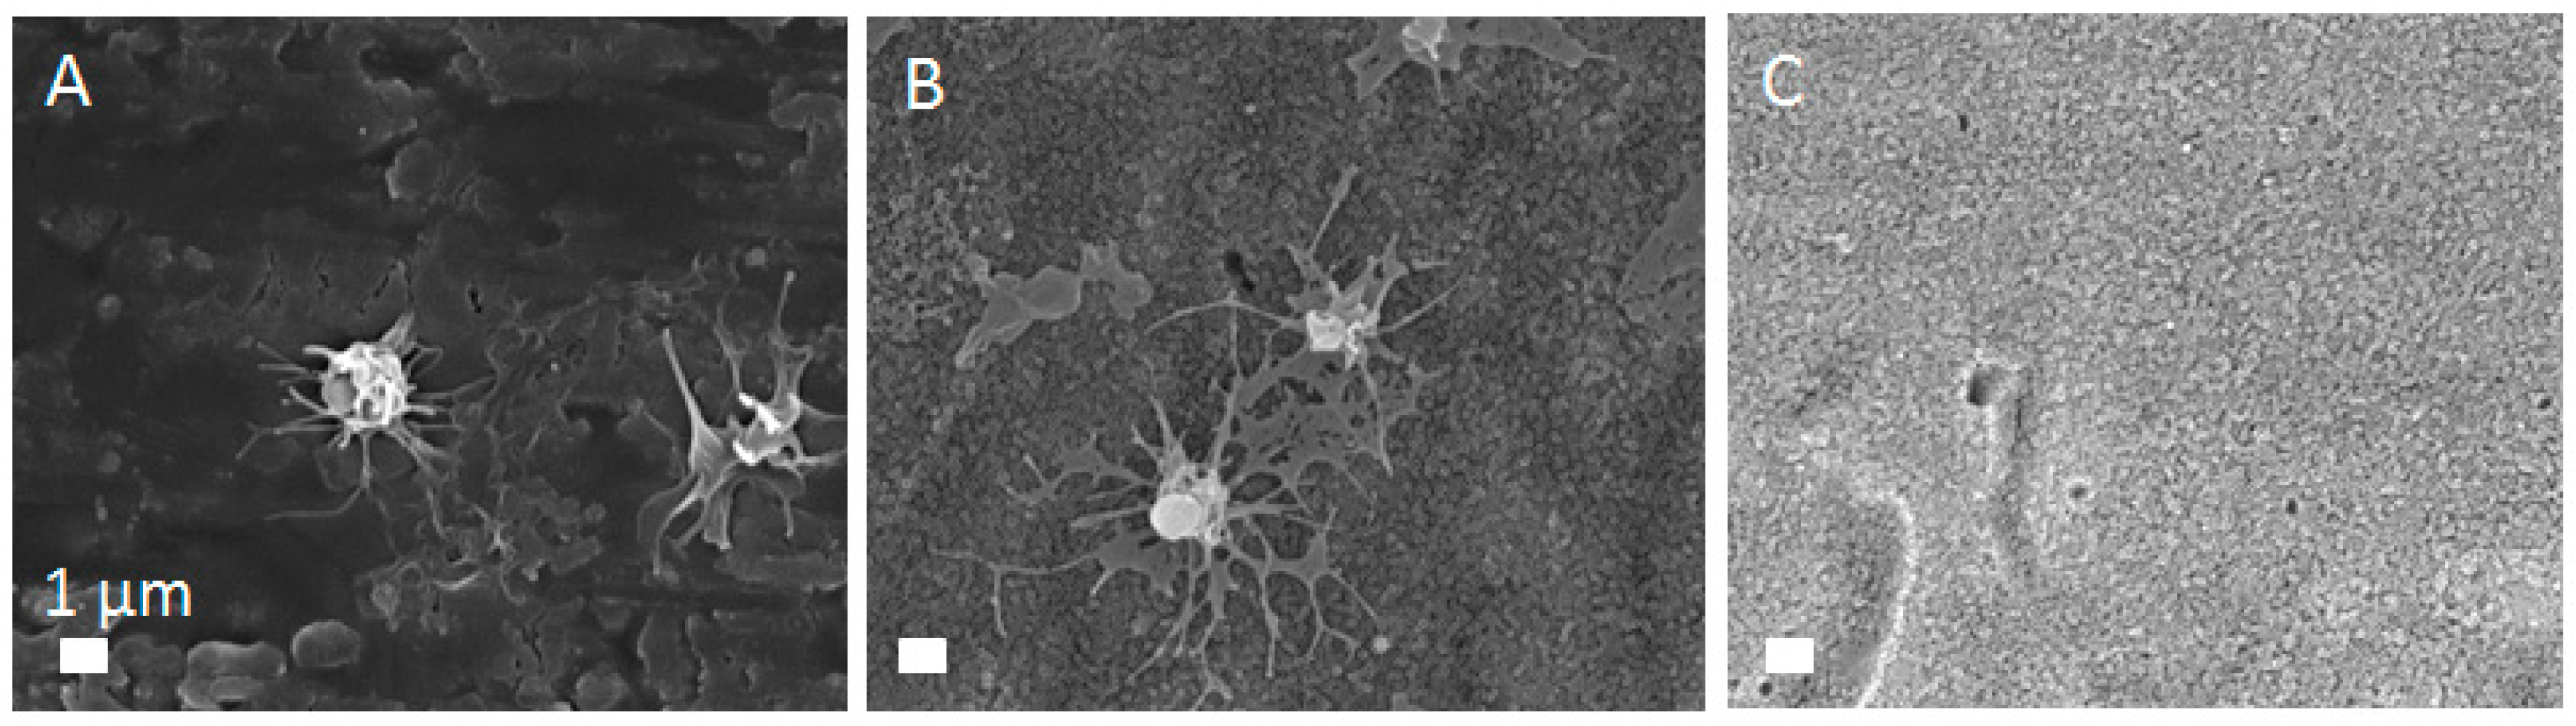
The approach to rapidly alter the crystal structure of TiO2 NTs without influencing their morphology is an intriguing way for surface modification of NTs used in bio-applications. As mentioned before, the crystal structure of a material affects its performance in biological applications. For instance, it has been shown that platelet adhesion and activation on the crystallized TiO2 NTs depends of the annealing temperature and crystal phase [40]. More precisely, authors showed that a certain amount of pure anatase in the TiO2 NTs leads to better platelet adhesion, which is beneficial for successfully integration of dental implants. By contrast, rutile-phase TiO2 NTs reduced platelet adhesion and activation, perhaps due to the formation of a hydration layer, which reduced intimate contact area between a platelet and the surface [28]. This particular case is advantageous for vascular stents, for which the inhibition of adhesion and activation of platelets is preferred, since platelets’ aggregation leads to a blood clot formation and stent thrombosis. Results of platelets performance on the surface of TiO2 NTs of 100 nm in diameter prepared in present study are shown in Figure 8. Platelets adhere to the surface of Ti foil with filopodia, while adhesion on the amorphous TiO2 NTs is done via lamelopodia and fillopodia. This indicates that the amorphous TiO2 NTs provide a better environment for platelet adhesion and activation. By contrast, platelets could not be found on the surface of annealed TiO2 NTs with anatase crystal structure. No biological material was detected on these surfaces, as platelets seemed not to adhere on these surfaces. These results indicate that anatase crystal structure (obtained by plasma or annealing) of TiO2 NTs does not provide appropriate conditions for platelets adhesion, which is beneficial from the perspective of vascular stent applications. In previous publications we showed increased hydrophilicity and reduced electrolyte residual (fluorine) on the surface of annealed TiO2 NTs [26]. Since fluorine is toxic to cells, its lowered content could be the reason for the better performance of platelets. It should be also considered that besides crystal structure also surface chemistry and wettability (surface charge), as well as morphology of the material play important role in platelet response, therefore further studies of TiO2 NTs interactions with platelets are needed.
4. Conclusions
Non-thermal oxygen plasma induced crystallization of TiO2 NTs synthesized by electrochemical anodization of Ti foil. The transition of the NTs’ amorphous phase to anatase and/or rutile crystal structure was obtained within a few seconds of exposure to oxygen plasma without changing the desired morphology of NTs. Although the gas temperature of non-thermal plasma was well below the thermal crystallization temperature, the sample temperature rose above 1300 °C at a certain plasma treatment condition e.g. the output power of 800 W and 10 s plasma treatment time. Results provide evidence that a rapid temperature increase of samples treated in plasma is correlated with crystallization of TiO2 NTs. Good correlation between the flux of oxygen atoms and increase in temperature of the sample was found; however, other parameters in plasma may also play a vital role in crystallization and should be further studied. It should be emphasized that crystallization in plasma is also influenced by the NTs diameter, as NTs with 15 nm in diameter seem to crystalize prevalently to the rutile phase, which was at our experimental conditions not the case for NTs of 100 nm in diameter. Moreover, the in vitro biological response of whole blood with crystalline TiO2 NTs showed that the crystallization reduces adhesion and activation of blood platelets, which is of particular interest for designing medical devices that are likely to contact blood, such as vascular stents.
Author Contributions
Methodology, formal analysis and investigation: M.B., I.J., R.Z., M.M. and M.V., writing—original draft preparation: M.B., I.J., writing—review and editing: I.J., R.Z, M.M. and A.I, conceptualization: M.M.
Funding
This research was funded by the Slovenian Research Agency for financial support [grant numbers Z3-4261, J3-9262, J1-9162, J2-8166, J2-8169, J5-7098, P2-0232] and Slovenian Ministry of Education, Science and Sport [grant “Public call for encouraging young investigators at the beginning of their career 2.0”, No. 5442-15/2016/18].
Conflicts of Interest
The authors declare no conflict of interest.
References
- Wang, Q.; Huang, J.-Y.; Li, H.-Q.; Zhao, A.Z.-J.; Wang, Y.; Zhang, K.-Q.; Sun, H.-T.; Lai, Y.-K. Recent advances on smart TiO2 nanotube platforms for sustainable drug delivery applications. Int. J. Nanomed. 2017, 12, 151–165. [Google Scholar] [CrossRef] [PubMed]
- Cipriano, A.F.; Miller, C.; Liu, H. Anodic growth and biomedical applications of TiO2 nanotubes. J. Biomed. Nanotechnol. 2014, 10, 2977–3003. [Google Scholar] [CrossRef] [PubMed]
- Wu, S.; Weng, Z.; Liu, X.; Yeung, K.W.K.; Chu, P.K. Functionalized TiO2 based nanomaterials for biomedical applications. Adv. Funct. Mater. 2014, 24, 5464–5481. [Google Scholar] [CrossRef]
- Hamlekhan, A.; Butt, A.; Patel, S.; Royhman, D.; Takoudis, C.; Sukotjo, C.; Yuan, J.; Jursich, G.; Mathew, M.T.; Hendrickson, W. Fabrication of anti-aging TiO2 nanotubes on biomedical Ti alloys. PLoS ONE 2014, 9, e96213. [Google Scholar] [CrossRef] [PubMed]
- Mazare, A.; Totea, G.; Burnei, C.; Schmuki, P.; Demetrescu, I.; Ionita, D. Corrosion, antibacterial activity and haemocompatibility of TiO2 nanotubes as a function of their annealing temperature. Corros. Sci. 2016, 103, 215–222. [Google Scholar] [CrossRef]
- Ji, M.-K.; Oh, G.; Kim, J.-W.; Park, S.; Yun, K.-D.; Bae, J.-C.; Lim, H.-P. Effects on antibacterial activity and osteoblast viability of non-thermal atmospheric pressure plasma and heat treatments of TiO2 nanotubes. J. Nanosci. Nanotechnol. 2017, 17, 2312–2315. [Google Scholar] [CrossRef]
- Kulkarni, M.; Flašker, A.; Lokar, M.; Mrak-Poljšak, K.; Mazare, A.; Artenjak, A.; Čučnik, S.; Kralj, S.; Velikonja, A.; Schmuki, P. Binding of plasma proteins to titanium dioxide nanotubes with different diameters. Int. J. Nanomed. 2015, 10, 1359–1373. [Google Scholar]
- Kulkarni, M.; Mazare, A.; Schmuki, P.; Iglič, A. Biomaterial surface modification of titanium and titanium alloys for medical applications. Nanomedicine 2014, 111, 111–136. [Google Scholar]
- Kulkarni, M.; Mazare, A.; Gongadze, E.; Perutkova, Š.; Kralj-Iglič, V.; Milošev, I.; Schmuki, P.; Iglič, A.; Mozetič, M. Titanium nanostructures for biomedical applications. Nanotechnology 2015, 26, 062002. [Google Scholar] [CrossRef] [Green Version]
- Hilario, F.; Roche, V.; Nogueira, R.P.; Junior, A.M.J. Influence of morphology and crystalline structure of TiO2 nanotubes on their electrochemical properties and apatite-forming ability. Electrochim. Acta 2017, 245, 337–349. [Google Scholar] [CrossRef]
- Liu, Y.; Kim, S.; McLeod, J.A.; Li, J.; Guo, X.; Sham, T.-K.; Liu, L. The effect of crystal structure of TiO2 nanotubes on the formation of calcium phosphate coatings during biomimetic deposition. Appl. Surf. Sci. 2017, 396, 1212–1219. [Google Scholar] [CrossRef]
- Bai, Y.; Park, I.S.; Park, H.H.; Lee, M.H.; Bae, T.S.; Duncan, W.; Swain, M. The effect of annealing temperatures on surface properties, hydroxyapatite growth and cell behaviors of TiO2 nanotubes. Surf. Interface Anal. 2011, 43, 998–1005. [Google Scholar] [CrossRef]
- Yu, W.; Zhang, Y.; Jiang, X.; Zhang, F. In vitro behavior of MC3T3-E1 preosteoblast with different annealing temperature titania nanotubes. Oral Dis. 2010, 16, 624–630. [Google Scholar] [CrossRef] [PubMed]
- Lamberti, A.; Chiodoni, A.; Shahzad, N.; Bianco, S.; Quaglio, M.; Pirri, C.F. Ultrafast room-temperature crystallization of TiO2 nanotubes exploiting water-vapor treatment. Sci. Rep. 2015, 5, 7808. [Google Scholar] [CrossRef] [PubMed]
- Wu, J.-M.; Wang, M.; Li, Y.-W.; Zhao, F.-D.; Ding, X.-J.; Osaka, A. Crystallization of amorphous titania gel by hot water aging and induction of in vitro apatite formation by crystallized titania. Surf. Coat. Technol. 2006, 201, 755–761. [Google Scholar] [CrossRef]
- Mazare, A.; Dilea, M.; Ionita, D.; Titorencu, I.; Trusca, V.; Vasile, E. Changing bioperformance of TiO2 amorphous nanotubes as an effect of inducing crystallinity. Bioelectrochemistry 2012, 87, 124–131. [Google Scholar] [CrossRef] [PubMed]
- Yang, L.; Zhang, M.; Shi, S.; Lv, J.; Song, X.; He, G.; Sun, Z. Effect of annealing temperature on wettability of TiO2 nanotube array films. Nanoscale Res. Lett. 2014, 9, 621. [Google Scholar] [CrossRef]
- Kundu, S.; Polshettiwar, V. Hydrothermal crystallization of nano-titanium dioxide for enhanced photocatalytic hydrogen generation. ChemPhotoChem 2018, 2, 796–800. [Google Scholar] [CrossRef]
- Liu, J.; Liu, Z.; Zhang, T.; Zhai, J.; Jiang, L. Low-temperature crystallization of anodized TiO2 nanotubes at the solid–gas interface and their photoelectrochemical properties. Nanoscale 2013, 5, 6139–6144. [Google Scholar] [CrossRef]
- Yu, J.; Dai, G.; Cheng, B. Effect of crystallization methods on morphology and photocatalytic activity of anodized TiO2 nanotube array films. J. Phys. Chem. C 2010, 114, 19378–19385. [Google Scholar] [CrossRef]
- Kramer, N.; Anthony, R.; Mamunuru, M.; Aydil, E.; Kortshagen, U. Plasma-induced crystallization of silicon nanoparticles. J. Phys. D Appl. Phys. 2014, 47, 075202. [Google Scholar] [CrossRef]
- Lopez, T.; Mangolini, L. On the nucleation and crystallization of nanoparticles in continuous-flow nonthermal plasma reactors. J. Vac. Sci. Technol. B Nanotechnol. Microelectron. 2014, 32, 061802. [Google Scholar] [CrossRef]
- Ohsaki, H.; Shibayama, Y.; Yoshida, N.; Watanabe, T.; Kanemaru, S. Room-temperature crystallization of amorphous films by RF plasma treatment. Thin Solid Films 2009, 517, 3092–3095. [Google Scholar] [CrossRef]
- Junkar, I.; Kulkarni, M.; Drašler, B.; Rugelj, N.; Recek, N.; Drobne, D.; Kovač, J.; Humpolicek, P.; Iglič, A.; Mozetič, M. Enhanced biocompatibility of TiO2 surfaces by highly reactive plasma. J. Phys. D Appl. Phys. 2016, 49, 244002. [Google Scholar] [CrossRef]
- Junkar, I.; Kulkarni, M.; Drašler, B.; Rugelj, N.; Mazare, A.; Flašker, A.; Drobne, D.; Humpolíček, P.; Resnik, M.; Schmuki, P. Influence of various sterilization procedures on TiO2 nanotubes used for biomedical devices. Bioelectrochemistry 2016, 109, 79–86. [Google Scholar] [CrossRef] [PubMed]
- Wu, C.-C.; Wei, C.-K.; Ho, C.-C.; Ding, S.-J. Enhanced hydrophilicity and biocompatibility of dental zirconia ceramics by oxygen plasma treatment. Materials 2015, 8, 684–699. [Google Scholar] [CrossRef] [PubMed]
- Zaplotnik, R.; Vesel, A.; Mozetic, M. Transition from E to H mode in inductively coupled oxygen plasma: Hysteresis and the behaviour of oxygen atom density. EPL 2011, 95, 55001. [Google Scholar] [CrossRef] [Green Version]
- Huang, Q.; Yang, Y.; Zheng, D.; Song, R.; Zhang, Y.; Jiang, P.; Vogler, E.A.; Lin, C. Effect of construction of TiO2 nanotubes on platelet behaviors: Structure-property relationships. Acta Biomater. 2017, 51, 505–512. [Google Scholar] [CrossRef] [PubMed]
- Kramer, N.; Aydil, E.; Kortshagen, U. Requirements for plasma synthesis of nanocrystals at atmospheric pressures. J. Phys. D Appl. Phys. 2015, 48, 035205. [Google Scholar] [CrossRef]
- Das, S.; Zazpe, R.; Prikryl, J.; Knotek, P.; Krbal, M.; Sopha, H.; Podzemna, V.; Macak, J.M. Influence of annealing temperatures on the properties of low aspect-ratio TiO2 nanotube layers. Electrochim. Acta 2016, 213, 452–459. [Google Scholar] [CrossRef]
- Feinleib, J.; Moss, S.; Ovshinsky, S. Rapid Reversible Light-Induced Crystallization of Amorphous Semiconductors. In Disordered Materials; Springer: Boston, MA, USA, 1991; pp. 34–37. [Google Scholar]
- Krylova, G.; Na, C. Photoinduced crystallization and activation of amorphous titanium dioxide. J. Phys. Chem. C 2015, 119, 12400–12407. [Google Scholar] [CrossRef]
- Nishio, T.; Naka, K. Photoinduced crystallization of calcium carbonate from a homogeneous precursor solution in the presence of partially hydrolyzed poly (vinyl alcohol). J. Cryst. Growth 2015, 416, 66–72. [Google Scholar] [CrossRef]
- Janotta, A.; Dikce, Y.; Schmidt, M.; Eisele, C.; Stutzmann, M.; Luysberg, M.; Houben, L. Light-induced modification of a-SiO x II: Laser crystallization. J. Appl. Phys. 2004, 95, 4060–4068. [Google Scholar] [CrossRef]
- Andrä, G.; Bergmann, J.; Falk, F.; Ose, E.; Stafast, H. Laser induced crystallization of amorphous silicon films on glass for thin film solar cells. Phys. Status Solidi (a) 1998, 166, 629–634. [Google Scholar] [CrossRef]
- Shaporev, A.; Ivanov, V.; Baranchikov, A.; Tret’yakov, Y.D. Microwave-assisted hydrothermal synthesis and photocatalytic activity of ZnO. Inorg. Mater. 2007, 43, 35–39. [Google Scholar] [CrossRef]
- Kempkes, P.; Singh, S.; Pargmann, C.; Soltwisch, H. Temporal behaviour of the E to H mode transition in an inductively coupled argon discharge. Plasma Sources Sci. Technol. 2006, 15, 378–383. [Google Scholar] [CrossRef]
- An, J.; Usui, T.; Logar, M.; Park, J.; Thian, D.; Kim, S.; Kim, B.; Prinz, F.B. Plasma processing for crystallization and densification of atomic layer deposition BaTiO3 thin films. ACS Appl. Mater. Interfaces 2014, 6, 10656–10660. [Google Scholar] [CrossRef]
- Zaplotnik, R.; Vesel, A.; Mozetič, M. A fiber optic catalytic sensor for neutral atom measurements in oxygen plasma. Sensors 2012, 12, 3857–3867. [Google Scholar] [CrossRef]
- Zhang, L.; Liao, X.; Fok, A.; Ning, C.; Ng, P.; Wang, Y. Effect of crystalline phase changes in titania (TiO2) nanotube coatings on platelet adhesion and activation. Mater. Sci. Eng. C 2018, 82, 91–101. [Google Scholar] [CrossRef]
Figure 1.
X-ray diffraction (XRD) patterns of TiO2 NTs of 100 nm diameter measured after plasma treatment at different powers; 200, 400, 600 and 800 W for different times and TiO2 NTs of 100 nm diameter after annealing in a furnace at 450 °C for 2 h.
Figure 1.
X-ray diffraction (XRD) patterns of TiO2 NTs of 100 nm diameter measured after plasma treatment at different powers; 200, 400, 600 and 800 W for different times and TiO2 NTs of 100 nm diameter after annealing in a furnace at 450 °C for 2 h.

Figure 2.
Magnified X-ray diffraction (XRD) patterns of TiO2 NTs of 100 nm diameter measured after plasma treatment at different powers; 200 and 800 W for different times, in order to show the difference between amorphous, anatase and rutile crystal phase of TiO2 NTs. A = characteristic XRD peaks for anatase crystal structure, R = characteristic XRD peaks for rutile crystal structure and Ti = characteristic XRD peaks for Ti foil.

Figure 3.
X-ray diffraction (XRD) patterns of untreated Ti foil and Ti foil and TiO2 NTs of diameter 15 nm (NT15) measured after plasma treatment at 800 W for 1 s and 10 s. A = characteristic XRD peaks for anatase crystal structure, R = characteristic XRD peaks for rutile crystal structure and Ti = characteristic XRD peaks for Ti foil.
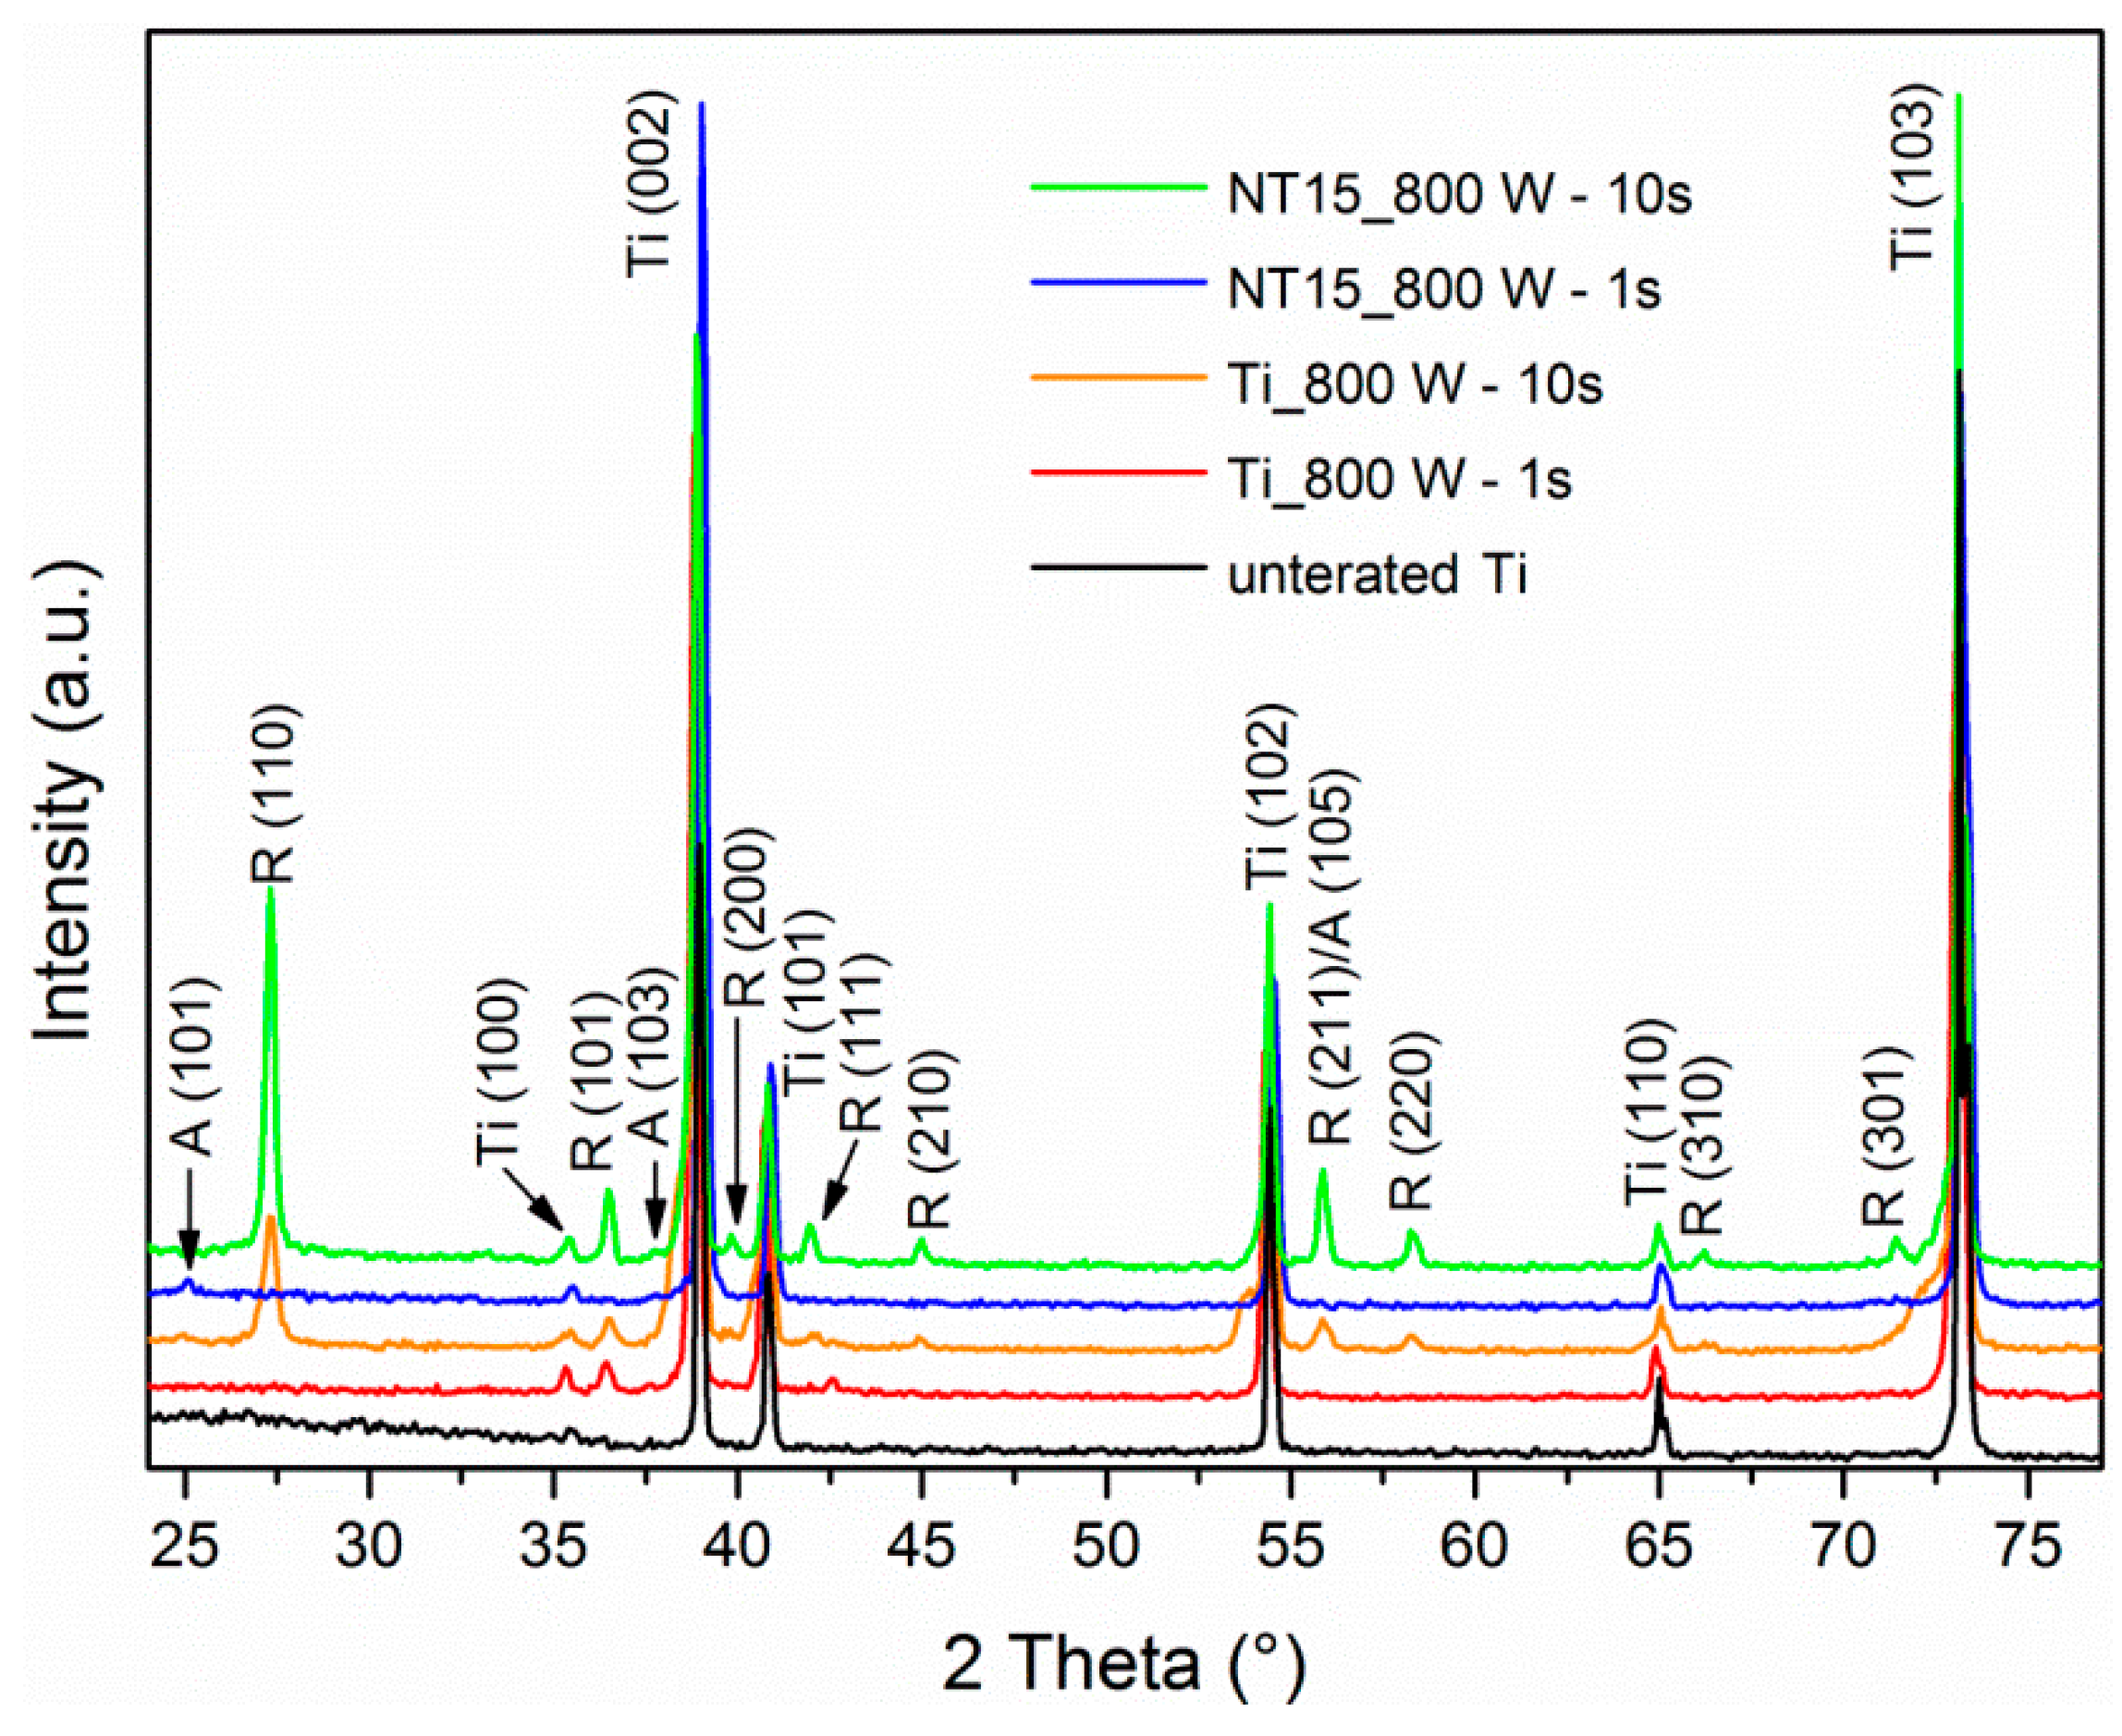
Figure 4.
Scanning electron microscope (SEM) images of untreated as-anodized TiO2 NTs with diameter of 100 nm; (A) top view, (B) side view.
Figure 4.
Scanning electron microscope (SEM) images of untreated as-anodized TiO2 NTs with diameter of 100 nm; (A) top view, (B) side view.

Figure 5.
SEM images (above: top view and below: cross sectional view) of TiO2 NTs of 100 nm in diameter treated with oxygen plasma at (A) 800 W for 10 s, (B) 800 W for 1 s and (C) 400 W for 10 s. The red arrow indicates destroyed bottom layer of NTs.
Figure 5.
SEM images (above: top view and below: cross sectional view) of TiO2 NTs of 100 nm in diameter treated with oxygen plasma at (A) 800 W for 10 s, (B) 800 W for 1 s and (C) 400 W for 10 s. The red arrow indicates destroyed bottom layer of NTs.

Figure 6.
SEM images (top view) of TiO2 NTs of 15 nm in diameter after plasma treatment at (A) 800 W for 1 s, (B) 800 W for 10 s and Ti foil after plasma treatment at (C) 800 W for 1s and (D) 800 W for 10 s.
Figure 6.
SEM images (top view) of TiO2 NTs of 15 nm in diameter after plasma treatment at (A) 800 W for 1 s, (B) 800 W for 10 s and Ti foil after plasma treatment at (C) 800 W for 1s and (D) 800 W for 10 s.

Figure 7.
Flux of oxygen atoms and the steady temperature of the NTs samples of 100 nm in diameter.

Figure 8.
Platelets adhesion and activation on (A) Ti foil, (B) amorphous and (C) annealed TiO2 NTs with 100 nm in diameter.
Figure 8.
Platelets adhesion and activation on (A) Ti foil, (B) amorphous and (C) annealed TiO2 NTs with 100 nm in diameter.

Table 1.
Influence of synthesis conditions on the diameter and length of the TiO2 nanotubes (NTs).
| Sample | Voltage (V) | Time (h) | Electrolyte (wt.%) | Diameter (nm) | Length (µm) |
|---|---|---|---|---|---|
| TiO2 NTs–15 nm | 10 | 1 | HF (1.1), H2O (15.3), EG | 15 | 0.21 |
| TiO2 NTs–100 nm | 58 | 2.5 | HF (1.0), H2O (11.0), EG | 100 | 2.53 |
Table 2.
Effect of radiofrequency (RF) forward (output) power and plasma processing time on the temperature and the crystal structure of TiO2 NTs of 100 nm in diameter.
Table 2.
Effect of radiofrequency (RF) forward (output) power and plasma processing time on the temperature and the crystal structure of TiO2 NTs of 100 nm in diameter.
| Forward Power (W) | Time (s) | Temperature (°C) | Crystal Structure |
|---|---|---|---|
| 200 | 180 | 300 | amorphous |
| 400 | 1 | 660 | amorphous |
| 400 | 10 | 1210 | anatase + rutile |
| 600 | 1 | 970 | amorphous |
| 600 | 10 | 1240 | anatase + rutile |
| 800 | 1 | 1030 | anatase |
| 800 | 10 | 1320 | anatase + rutile |
© 2019 by the authors. Licensee MDPI, Basel, Switzerland. This article is an open access article distributed under the terms and conditions of the Creative Commons Attribution (CC BY) license (http://creativecommons.org/licenses/by/4.0/).
Share and Cite
MDPI and ACS Style
Benčina, M.; Junkar, I.; Zaplotnik, R.; Valant, M.; Iglič, A.; Mozetič, M. Plasma-Induced Crystallization of TiO2 Nanotubes. Materials 2019, 12, 626. https://doi.org/10.3390/ma12040626
AMA Style
Benčina M, Junkar I, Zaplotnik R, Valant M, Iglič A, Mozetič M. Plasma-Induced Crystallization of TiO2 Nanotubes. Materials. 2019; 12(4):626. https://doi.org/10.3390/ma12040626
Chicago/Turabian StyleBenčina, Metka, Ita Junkar, Rok Zaplotnik, Matjaz Valant, Aleš Iglič, and Miran Mozetič. 2019. "Plasma-Induced Crystallization of TiO2 Nanotubes" Materials 12, no. 4: 626. https://doi.org/10.3390/ma12040626
Note that from the first issue of 2016, this journal uses article numbers instead of page numbers. See further details here.