Notch (In)Sensitivity of Aluminum Matrix Syntactic Foams


1
Department of Materials Science and Engineering, Faculty of Mechanical Engineering, Budapest University of Technology and Economics, Műegyetem rakpart 3., 1111 Budapest, Hungary
2
MTA–BME Lendület Composite Metal Foams Research Group, Műegyetem rakpart 3., 1111 Budapest, Hungary
*
Author to whom correspondence should be addressed.
Materials 2019, 12(4), 574; https://doi.org/10.3390/ma12040574
Submission received: 22 January 2019
/
Revised: 11 February 2019
/
Accepted: 13 February 2019
/
Published: 14 February 2019
(This article belongs to the Special Issue Advanced and High Performance Metallic Foams)
Abstract
:Aluminum alloy (Al99.5 or AlSi12)-based metal matrix syntactic foams (MMSFs) were produced by pressure infiltration with ~65 vol % Globocer filler (33 wt % Al2O3, 48 wt % SiO2, 19 wt % Al2O3∙SiO2). The infiltrated blocks were machined by different geometry tools in order to produce notched samples. The samples were loaded in three-point bending, and the loading force values were recorded against the cross-head displacements and the crack opening displacements. To measure up the notch sensitivity and toughness of the MMSFs, the fracture energies and the fracture toughness values were determined. The results showed that the mentioned quantities are needed to describe the behavior of MMSFs. The fracture energies were shown to be notch-sensitive, while the fracture toughness values were dependent only on the matrix material and were insensitive to the notch geometry. The complex investigation of the fracture surfaces revealed strong bonding between the hollow spheres and the Al99.5 matrix due to a chemical reaction, while this bonding was found to be weaker in the case of the AlSi12 matrix. This difference resulted in completely different crack propagation modes in the case of the different matrices.

1. Introduction
Metal matrix syntactic foams (MMSFs) or composite metal foams (CMFs) are foams with high specific strength. In MMSFs the incorporated porosities—necessary for a foam structure—are ensured by low wall thickness hollow spheres. This structure leads to higher relative density (~0.5) foams exhibiting outstanding compressive properties compared at least to the “conventional” open and/or closed cell metallic foams. MMSFs can be produced from any kind of metal in theory, but Al alloys are the most common [1,2,3,4,5,6,7,8,9,10], but Mg [11,12,13,14,15,16,17], Fe [18,19,20,21,22,23,24,25], Ti [26,27,28,29], and even Zn [30,31,32,33]-based MMSFs can also be found in the literature. The filler material can also be various ranging from mixed oxide ceramics [15,34,35,36,37,38,39,40] to high purity and quality alumina [41,42,43,44] or silicon carbide [2,10,12]. Moreover, Taherishargh et al. have studied the application of cheaper expanded perlite as filler material [45,46,47,48,49,50,51,52,53,54,55]. Most of the above mentioned studies deals with the room temperature compressive properties of MMSFs, but efforts have been made to map their properties at cryogenic and elevated temperatures [33,56,57,58,59].
Recently, weight reduction and increasing loads on low-weight structures enhance the more extensive application of low absolute density foams having high specific strength. As a consequence, the mechanical and fracture properties as well as the failure mechanisms of metallic foams are becoming increasingly important. According to the authors, no comprehensive information is available up to now for MMSFs in this field. Only a few papers have been published on the toughness, fracture behavior, and even the crack propagation of “conventional” metallic foams.
In the simplest way, Chernousov and Chan defined the toughness as the absorbed mechanical energy (in Jcm−3 and its specific value, with respect to the density in Jg−1) during compression up to the appearance of the first crack [60]. The corresponding standard about the mechanical testing of cellular metals (ISO13314-2011 Mechanical testing of metals–Ductility testing–Compression test for porous and cellular metals [61]) does not contain any specification for the toughness of the material. It only defines the energy absorption and the energy absorption efficiency of the cellular materials. The approach of Chernousov and Chan is interesting and worth considering, as the main load type of foams is the compression; however, it is most often addressed as fracture energy, which can of course be interpreted as a specific kind of toughness as well.
McCullough et al. applied a more classic fracture mechanics approach and investigated the toughness of closed cell AlMg1Si0.6 and AlMg1Si10 foams, with relative density range of 0.1–0.4. Compact tension (CT) samples were tested based on the J-integral theory. The effect of the materials composition and the relative density on the toughness was evaluated and discussed in detail. Low Si content resulted in tougher foams, while the fracture toughness increased with the relative density. The authors also found that the pre-fatigue procedures suggested in the corresponding standards (ASTM E399 [62], ASTM E813 [63] (withdrawn) and ASTM E1152 [64] (withdrawn), and ASTM E1820 [65]) are negligible and the difference between the results of pre-fatigue and simply notched samples is indistinguishable. The foams exhibited increasing crack propagation resistance with crack growth, which was explained by the development of a certain crack bridging zone behind the crack tip. Another important finding of McCullough et al. was the notch insensitivity of the investigated closed cell “conventional” foams (tested on samples with a central, go-through hole). In both tensile and compressive load, the strength of the net cross section of the notched samples was equal to the un-notched strength [66].
Olurin et al. described the tensile and compressive deformation and the fracture properties of closed cell metallic foams in terms of their microstructures. Besides other mechanical properties, the notch sensitivity and the toughness of the foams were tested on double edge notched and CT samples, respectively. Tests on notched samples proved the notch-insensitivity of the investigated foams. During the toughness tests, a significant R-curve behavior was observed due to a bridging effect behind the actual crack tip, caused by the special microstructure of the foams [67].
Subsequently, the same research group studied the fatigue crack propagation. The investigated foams were in the 0.1–0.4 relative density range, and the ASTM E647 [68] standard was applied for the tests at 20 Hz. The authors found that linear elastic fracture mechanics can be used to describe the fatigue crack advance. The Paris–Erdogan relationship was applied to evaluate the results, and the exponent of the relationship proved to be quite high (m = 20–25). The high exponent led to the suggestion to keep the ΔK stress intensity range below the threshold (ΔKth) by proper design process for safety [69].
Motz et al. published two studies in the early 2000s. The first one dealt with ductile closed cell metallic foams in the aspects of fracture behavior and fracture toughness [70], while the second one discussed the fatigue crack propagation in cellular metals [71]. The densities of the investigated closed cell foams were in the 0.2–0.4 gcm−3 range. The tests were performed on different size CT samples (W = 50–300 mm). The pre-crack, which is required for the tests, was produced in different ways: by fatigue pre-cracking, by a razor blade polishing method (notch tip radius ~30 μm), and by a cut with the diamond wire saw (notch tip radius ~150 μm). The differences between the results of the three different notch tip preparations were indistinguishable, as was also observed by McCullough et al. [66,70]. To characterize the materials KIC tests, JIC tests and COD tests were performed. Due to the plasticity of the foams, the KIC tests were not valid. The JIC tests resulted in valid values, but the initiation toughness showed large scatter. The toughness was significantly influenced by the cell wall and edge thicknesses as well as by the inhomogeneities in the foams [70]. Later, Motz et al. performed a fatigue crack propagation test on the same foams and on a 316 L made hollow sphere structure (locally bonded stainless steel hollow spheres) with 0.3 gcm−3 density. The tests were performed at 20 Hz on CT samples (W of 50 and 140 mm). According to the test, again quite large Paris–Erdogan exponents (m = 6–12) were reported [71].
Combaz and Mortensen studied replicated Al foams, produced by the replication of the voids in a pack of NaCl particles with the relative density range of 0.10–0.24. The tests were performed on disk shape compact tension (DCT) samples. The measurements were evaluated according to the ASTM E1820 [65] standard. None of the tests resulted in valid KIC values, so the data were evaluated for the R-curves and for the critical J-integral value for crack. During the fracture of the samples, a strong bridging effect behind the crack tip was observed [72]. Later their focus turned to the hole and notch sensitivity of replicated Al foams and found strong stress triaxiality in the ligament of notched samples [73].
Kashef et al. studied titanium alloy foams for medical application in the aspect of fracture toughness [74] and fatigue crack propagation [75]. The foams were made by powder metallurgy from 45 μm average size 99.9% purity titanium and an ammonium bicarbonate NH4HCO3 space holder (a purity of 99.0% and a size range of 500–800 μm). Two foams were produced with the relative densities of 0.3 and 0.4, respectively. CT samples were machined from the produced blocks according to the ASTM E1820 [65] standard and the samples were notched by a wire. The R-curves of the samples were measured. The authors reported that the titanium foams with higher relative density were tougher than the ones with lower relative density. Regarding the failure mechanism, the titanium CT samples had a plastic collapse in their ligament [74]. The authors later performed fatigue crack propagation tests on the higher relative density samples. Again, relatively high Paris–Erdogan exponents were reported (m ≈ 17) [75].
As is obvious from the above-mentioned papers, the community interested in metallic foams has invested some effort into the study of the notch sensitivity, crack initialization, and fatigue crack growth of various but “conventional” metallic foams, either open or closed cell. However, there are no results, nor have there even been any attempts, with respect to the notch sensitivity and toughness of MMSFs or CMFs. According to this, the main aims of this paper are to describe the notch sensitivity and to determine the fracture toughness of specific, aluminum alloy-based, ceramic hollow sphere-filled MMSFs.
2. Materials and Methods
Al99.5 or AlSi12 MMSFs were produced by inert gas pressure infiltration [76]. The chemical compositions of the matrices are listed in Table 1. As filler, mixed oxide ceramic hollow spheres (available under the trade name Globocer (GC), provided by Hollomet GmbH, Dresden, Germany) were applied at ~65 vol % [77,78]. The chemical composition of the hollow spheres was measured as 33 wt % Al2O3, 48 wt % SiO2, and 19 wt % Al2O3∙SiO2) [11,12]. The infiltration temperature was Tmelting +50°C (710°C for Al99.5 and 625°C for AlSi12 matrices, respectively). The infiltration pressure and time were set to 400 kPa and 30 s, respectively.
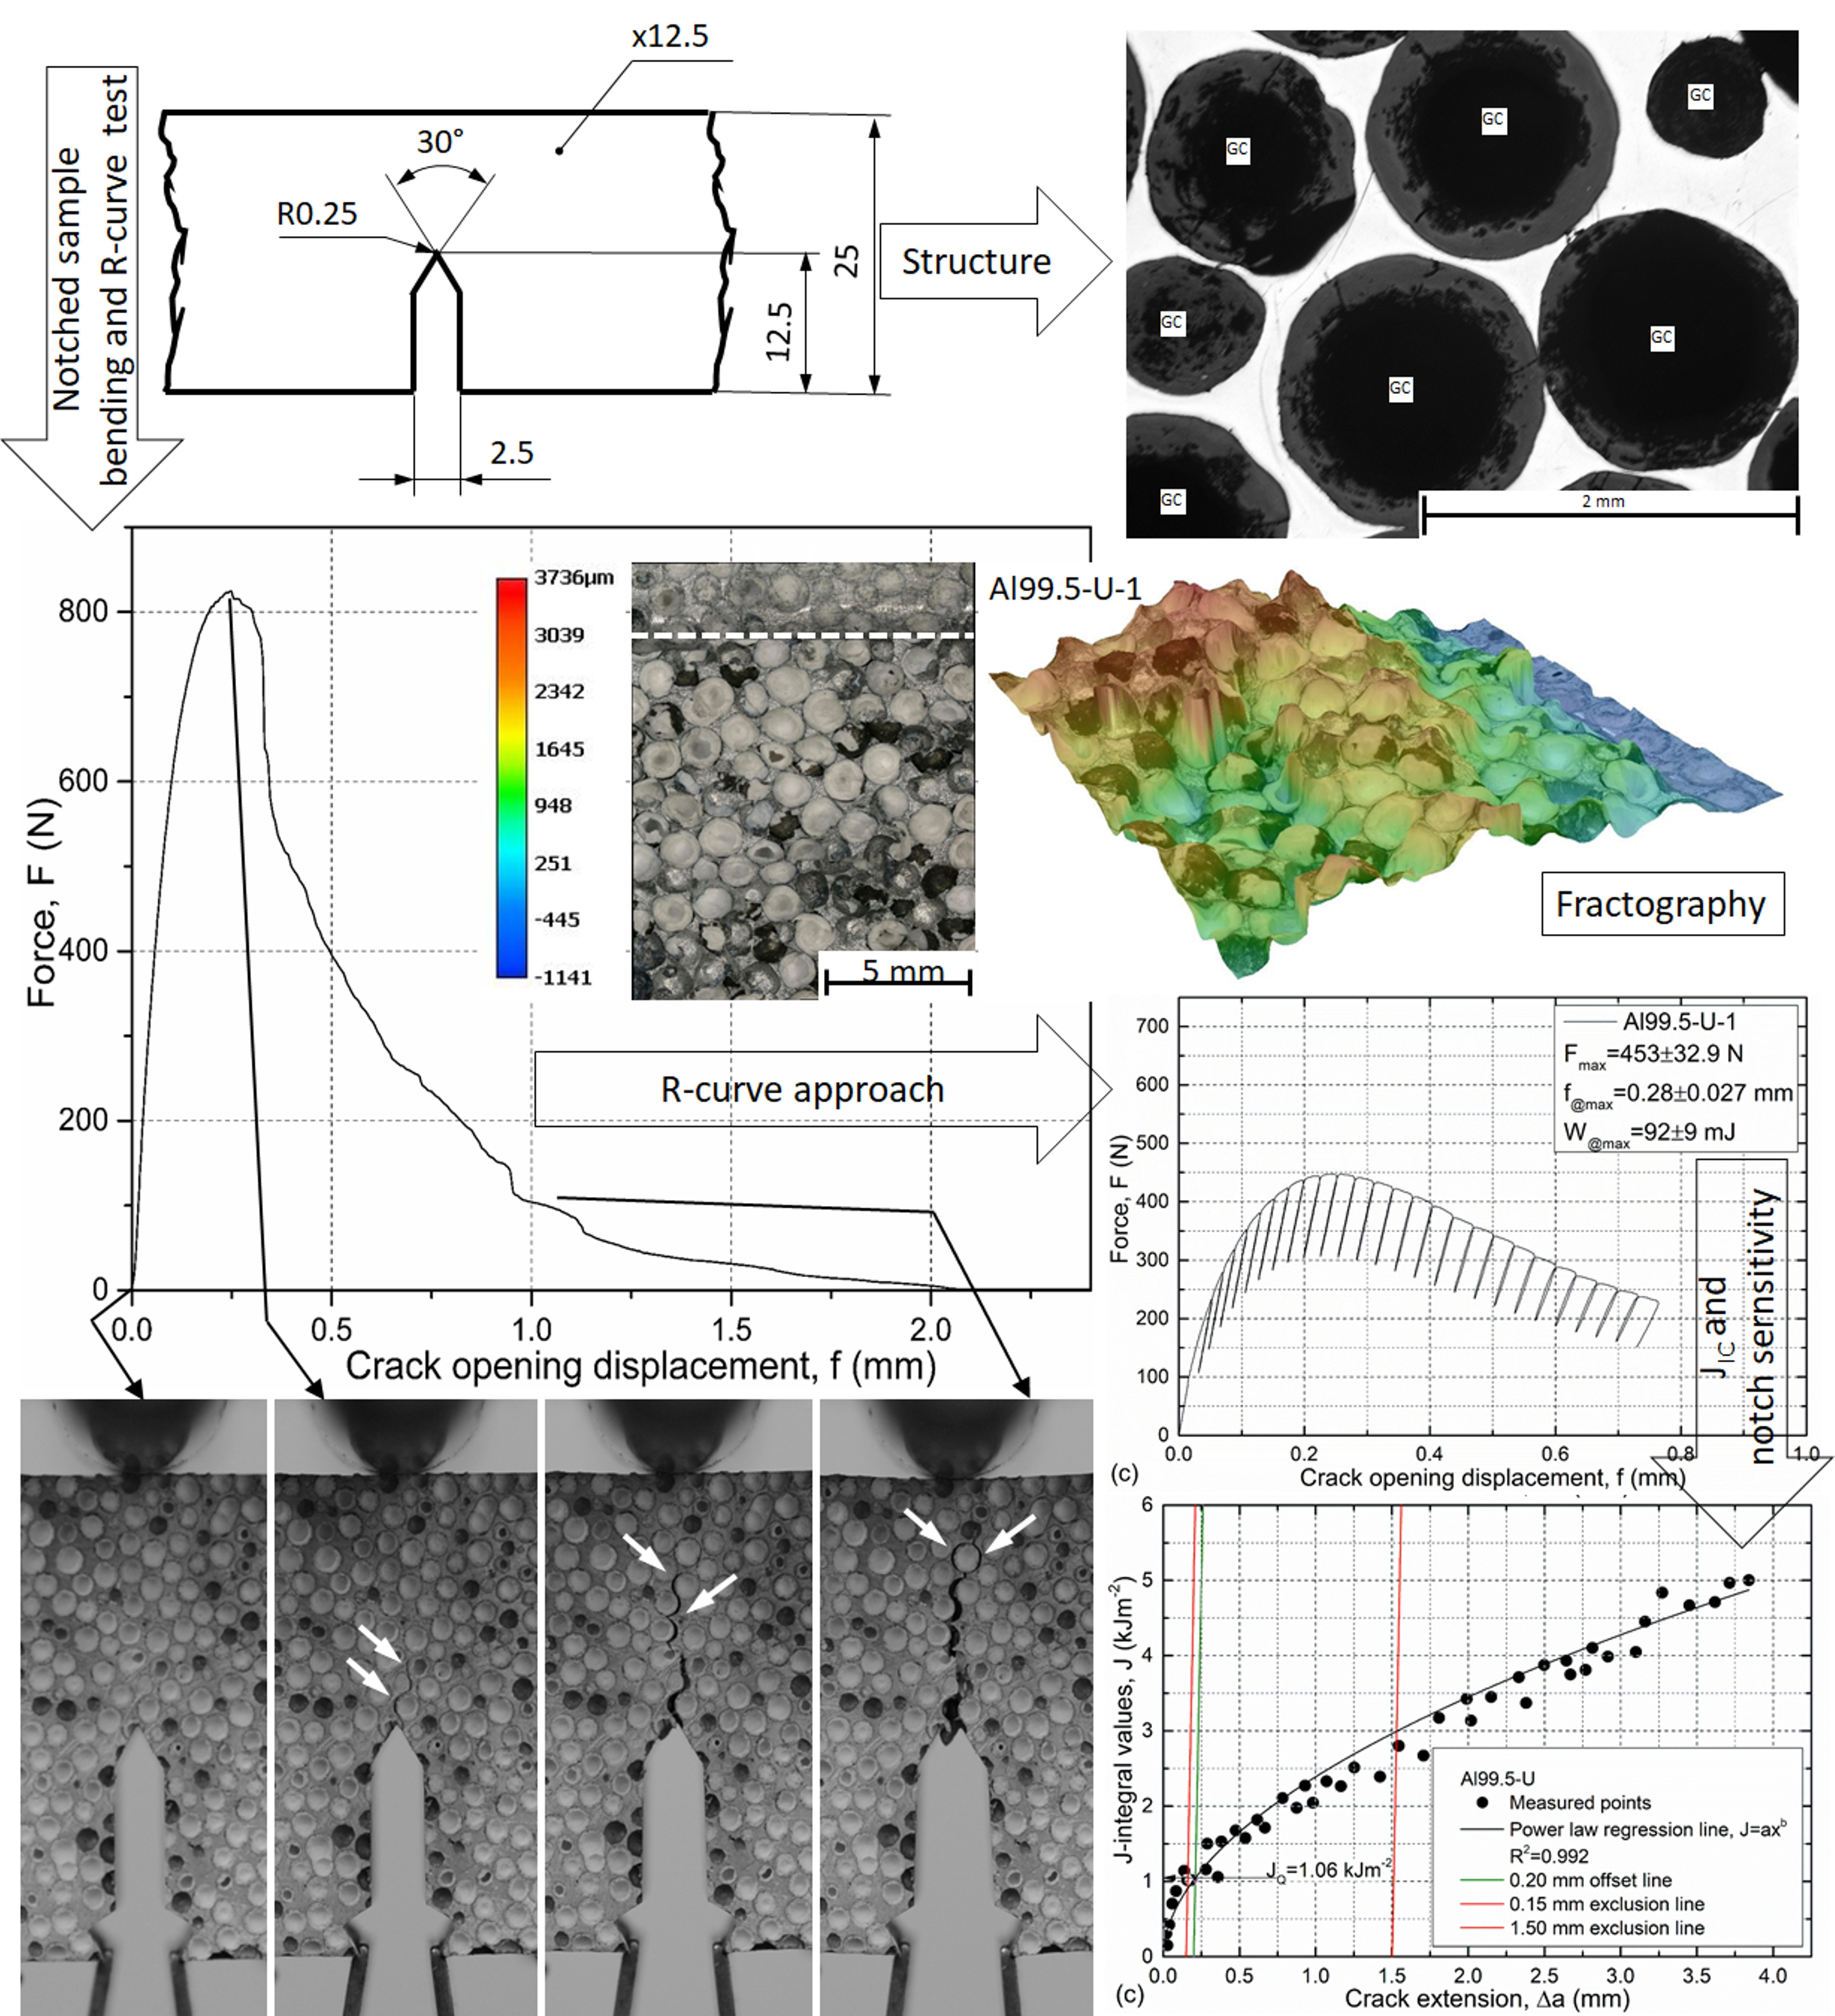
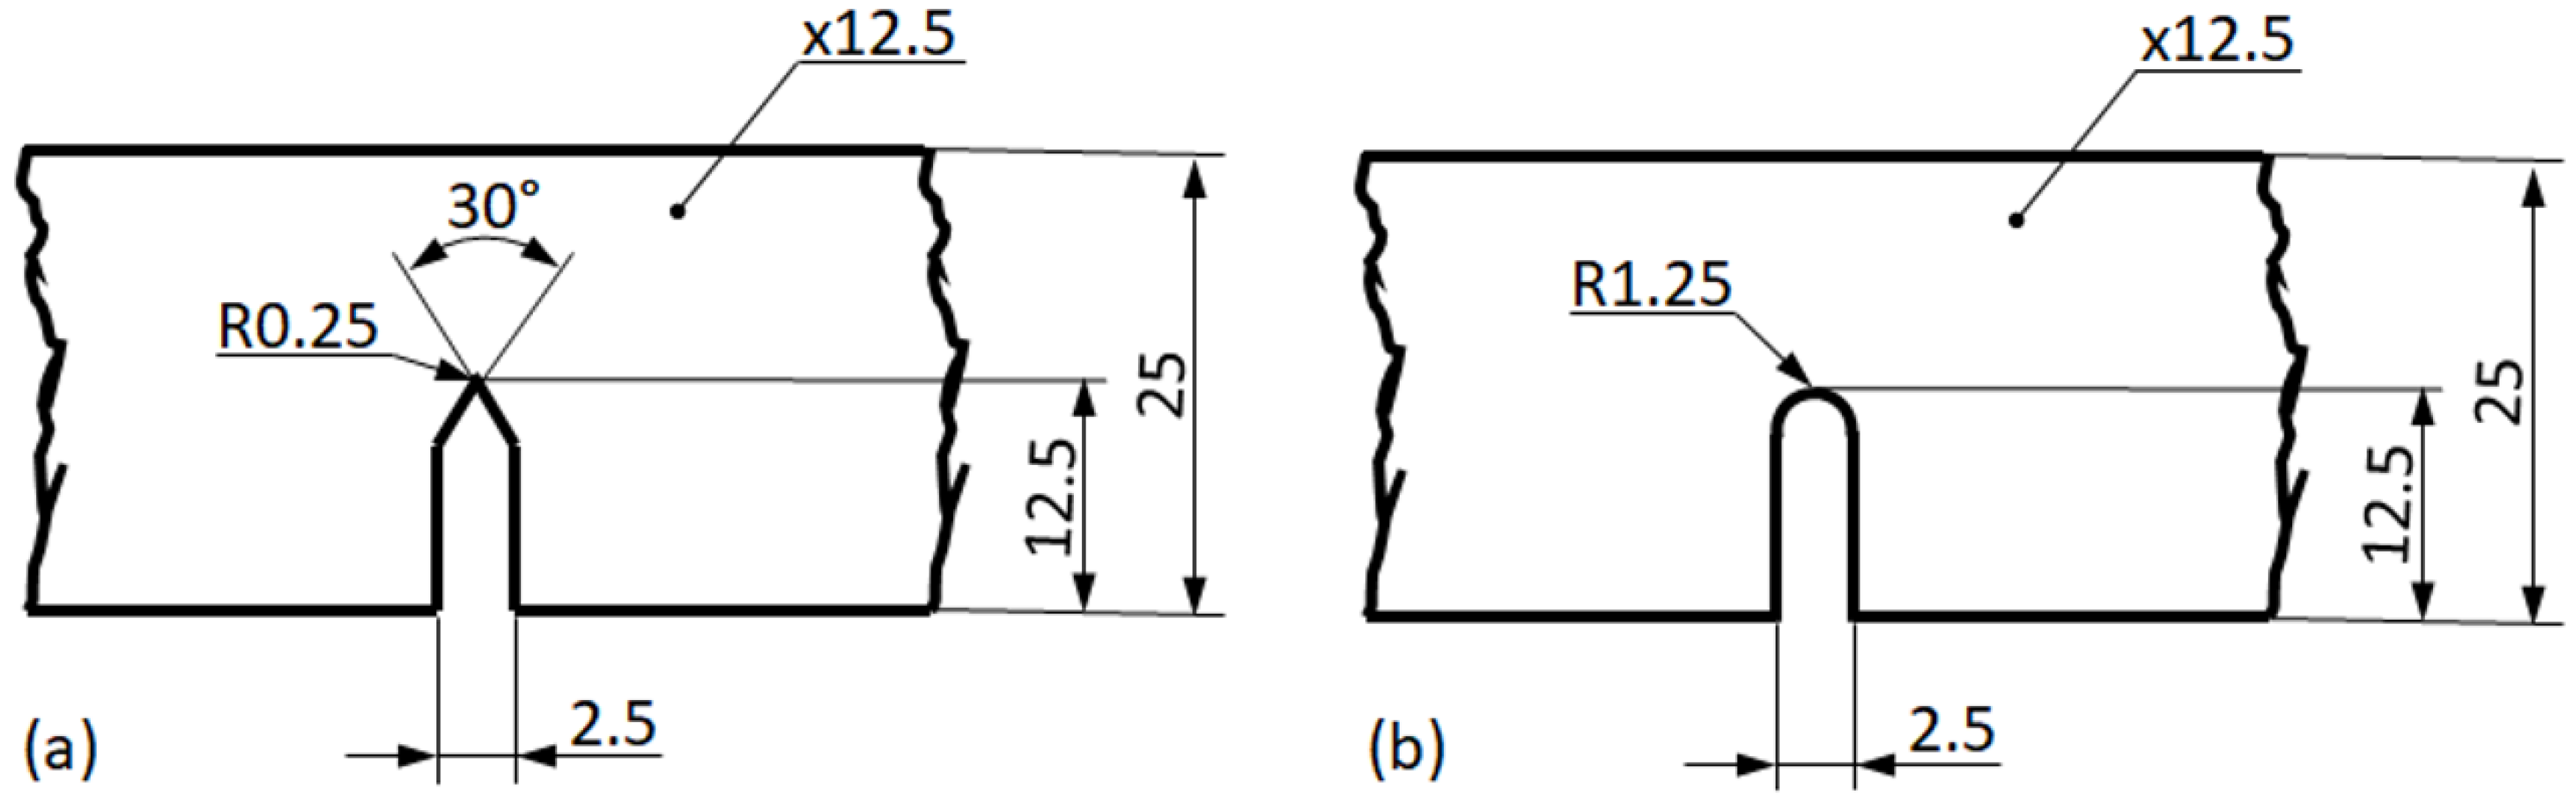
Samples for three-point bending tests were machined from the infiltrated blocks (Figure 1). The width (W), the thickness (B), and the length (L) of the samples were W = 25 mm, B = 12.5 mm, and L = 105 mm, respectively. The span (S) of the three-point bending apparatus was S = 100 mm, while the diameter of the supporting and loading rods was 10 mm. In order to investigate the notch sensitivity of the produced MMSFs, the samples were manufactured with different notches (see Figure 1): (i) with a sharp, 12.5 mm long notch, identical to a fracture mechanics three-point bending (TPB) sample according to [62] (notch tip radius R = 0.25) and (ii) with a blunt, 12.5 mm long notch (notch tip radius R = 1.25 mm). All of the notches were straight and went through the whole thickness of the samples. The samples were designated according to their matrix material and notch type. For example, Al99.5-U-1 means the first Al99.5 matrix, GC-filled MMSF with a U notch.
Due to the findings of McCollough et al., no pre-fatigue cracks were initialized, because the difference between the results of pre-fatigue and simply notched samples was indistinguishable [66]. At least three samples were tested for each notch and material configuration (12 samples in sum). During the tests, the opening of the notch was followed by a double cantilever clip-in displacement gage. The cross head speed of the test was 1 mm/min. The tests were performed on an Instron 5965 testing machine (Instron, Norwood, MA, USA). During the tests, the load was recorded as a function of the notch opening. For the macroscopic observations of the fracture surfaces, an Olympus SZX-16 type microscope (Olympus Corporation, Tokyo, Japan) was used. The fracture surfaces were also scanned and mapped with a VHX 5000 microscope (Keyence, Osaka, Japan) in order to obtain 3D insight from the development of the fracture surface. The fracture surfaces were also investigated by scanning electron microscopy (SEM, Zeiss EVO MA10, Carl Zeiss AG, Oberkochen, Germany) extended with energy dispersive spectrometry (EDS, EDAX Z2, EDAX Inc., Mahwah, NJ, USA).
3. Results and Discussion
Based on a short structural insight (to reveal the macroscopic and microscopic features of the materials), the results are summarized and discussed in this section according to two approaches, namely in terms of (i) toughness and (ii) fractographic features. Figure 2 represents the micrographs of Al99.5- and AlSi12-based MMSFs. The micrographs show almost perfect infiltration. During the production process, the molten alloy (lighter phase in the figures) could infiltrate even the narrowest gaps between the adjacent hollow ceramic spheres (labeled by “GC”). In the case of the AlSi12 matrix, the eutectic structure can be observed (Figure 2c).
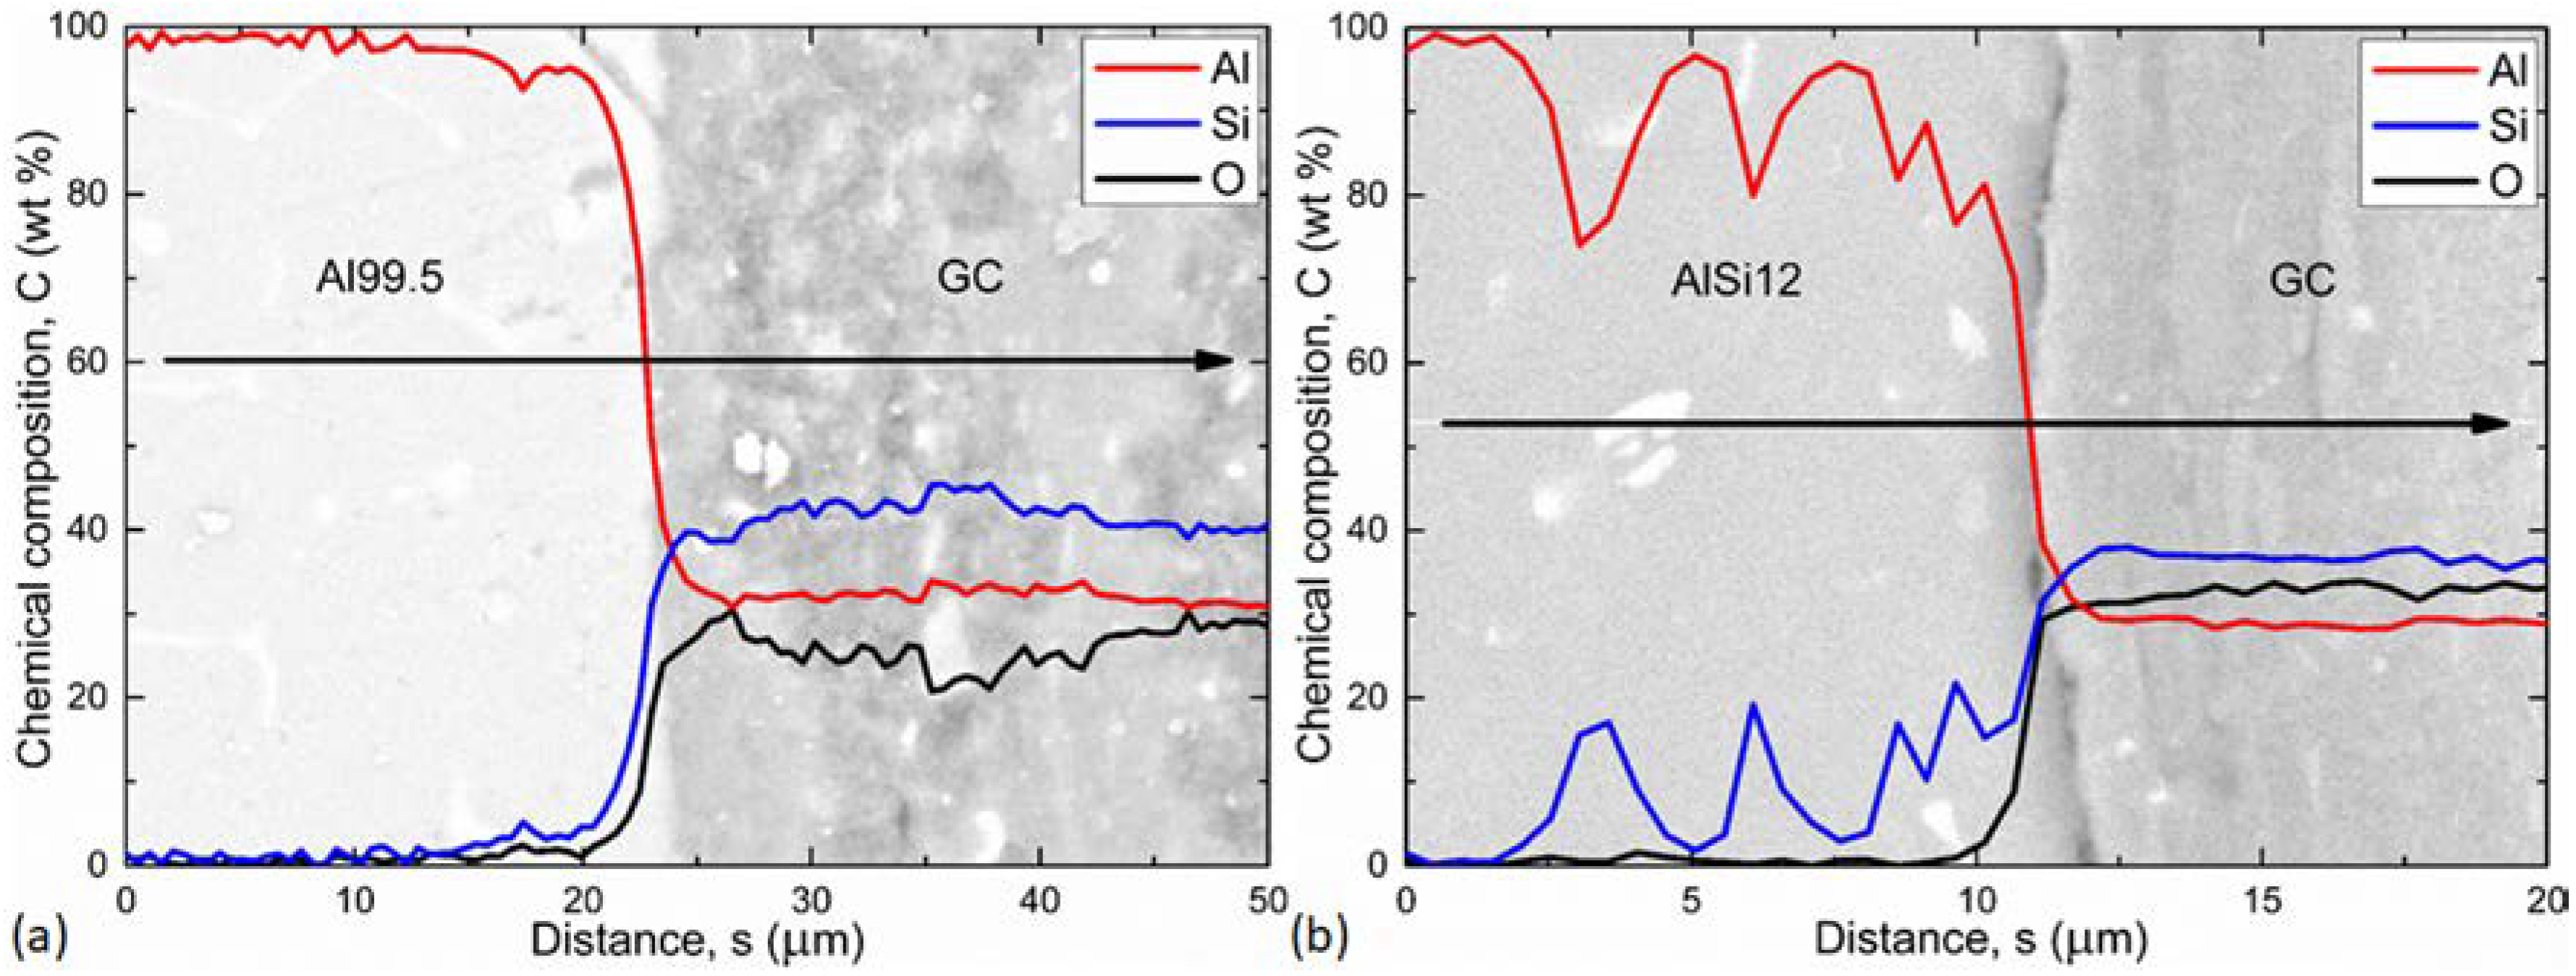
The structure of the MMSFs was further investigated by SEM. The aim of these measurements was to investigate the connection between the hollow spheres and the matrix material, which is crucial in the structural integrity point of view. The connection can be adhesive or cohesive. In the case of adhesive connection, the bonding is based only on the geometrical features of the hollow spheres’ surfaces. In the case of cohesive connection, a thin interface layer is formed during the production of the MMSFs, due to the possible chemical reactions between the molten metal and the ceramic hollow spheres (the molten Al reduces the SiO2 content of the hollow spheres to form Al2O3 and solve Si:4Al + 3SiO2 = 2Al2O3 + 3Si). In reality, the two phenomena are often overlapping and result in a complex connection. To investigate the interface layers, EDS measurement along lines perpendicular to the interface layer between a hollow sphere and the matrix material was performed (Figure 3).
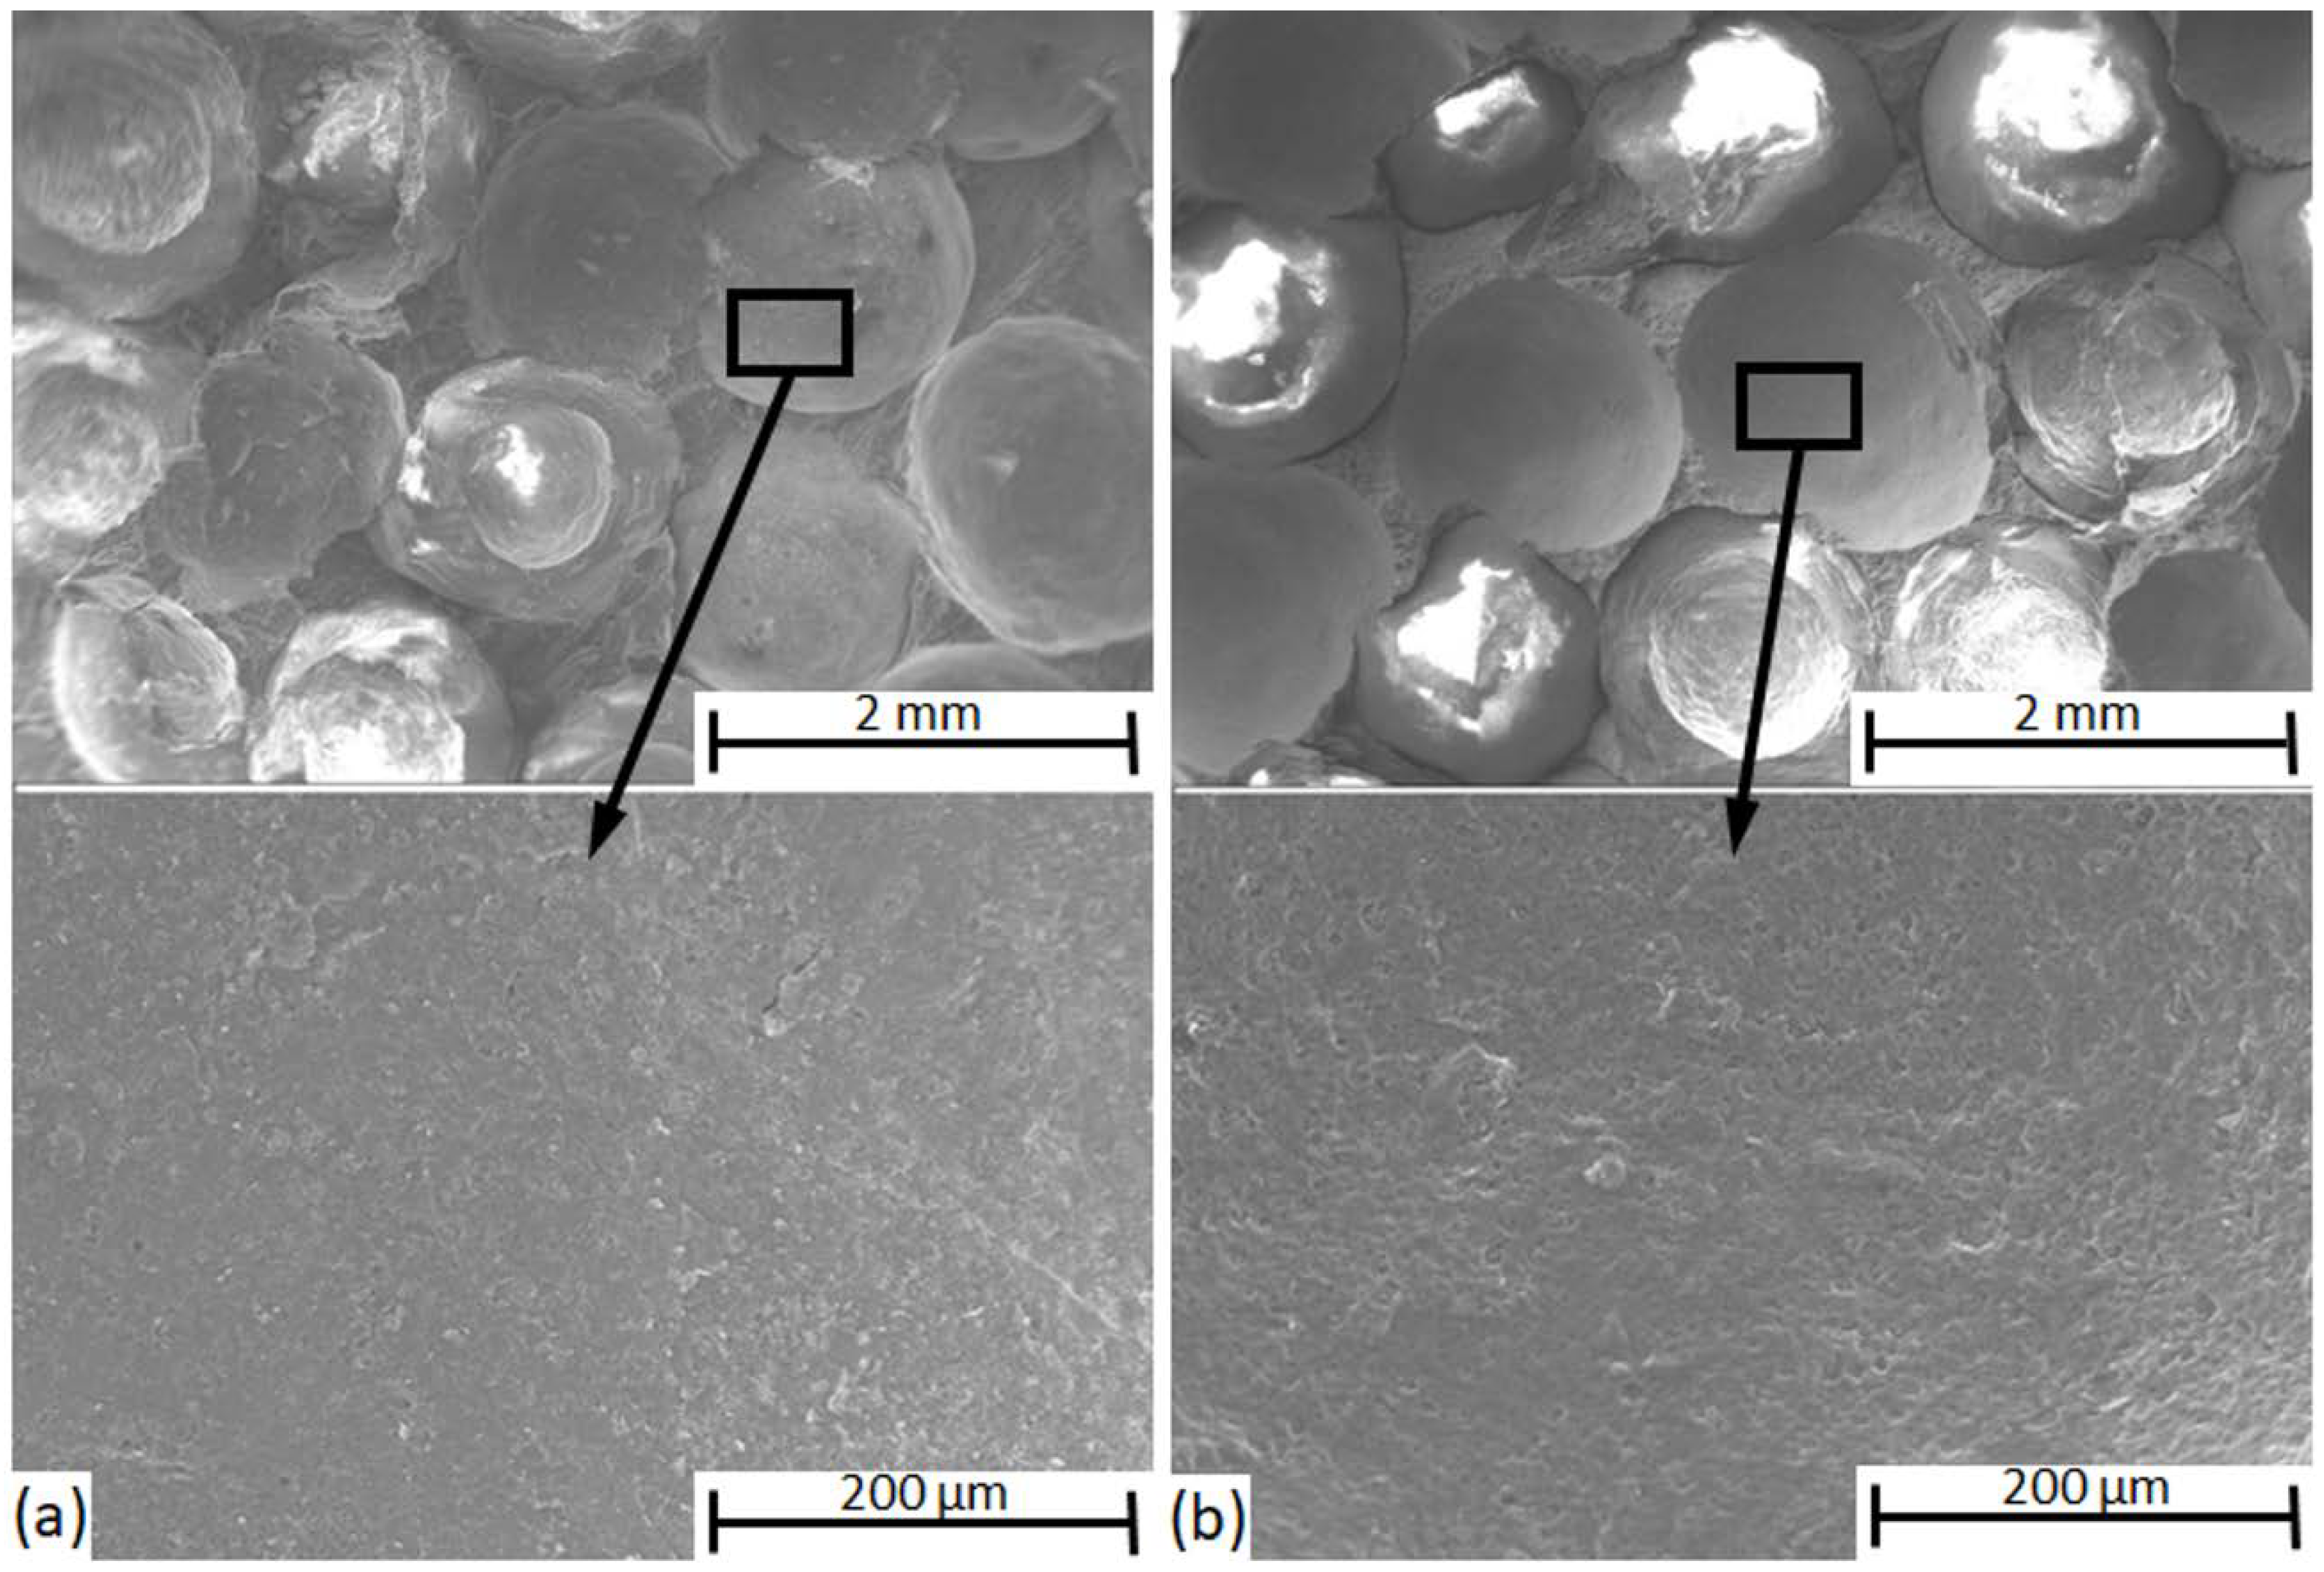
The line EDS profiles show the actual chemical composition (in wt %). The transition in the lines of the elements identify ~5.0 and ~2.5 μm thick interface layers in the case of Al99.5 and AlSi12 matrix, respectively (Figure 3). These interface layer thicknesses are quite low (especially in the case of the AlSi12 matrix, which was loaded by the ~0.3 μm uncertainty of the measurement due to the impact volume of the electron beam), so the chemical reaction between the matrix and the ceramic hollow spheres was constrained to the formation of an ideally thin interface layer in the case of the Al99.5 matrix. The large fluctuations in Figure 3b are due to the presence of Si lamellae in the eutectic AlSi12 matrix. The Si precipitations can also be observed in the SEM image of Figure 3b (light area along the investigation line). The Si lamellae sometimes remain “hidden” below the surface, but they can be tracked in the diagram, since the EDS technique investigates a larger volume of the material, not only the surface features. The qualitative difference between the two matrix materials is due to the relatively high Si content of the AlSi12 matrix (12 wt %), which hinders the diffusive chemical reactions, resulting in a weaker bonding between the spheres and the AlSi12 matrix. Besides the investigation of the cohesive connection, the SEM measurements were ideal for a closer look at the surface of the matrix material in sites from which the hollow spheres were removed during the fracture. Such SEM micrographs are represented in Figure 4.
In both subfigures, the smooth surface of the craters from which the ceramic hollow spheres were removed during the crack propagation and fracture can be clearly observed. The ratio of the adhesive bonding force within the whole bonding force between the constituents can be considered low; however, this is indirect evidence. The actual bonding force is hard to measure directly, but the qualitative investigation detailed above will be a good background for the investigation of the fracture surfaces (in Section 3.2) and will be beneficial to understand the crack propagation in the MMSFs.
3.1. Toughness
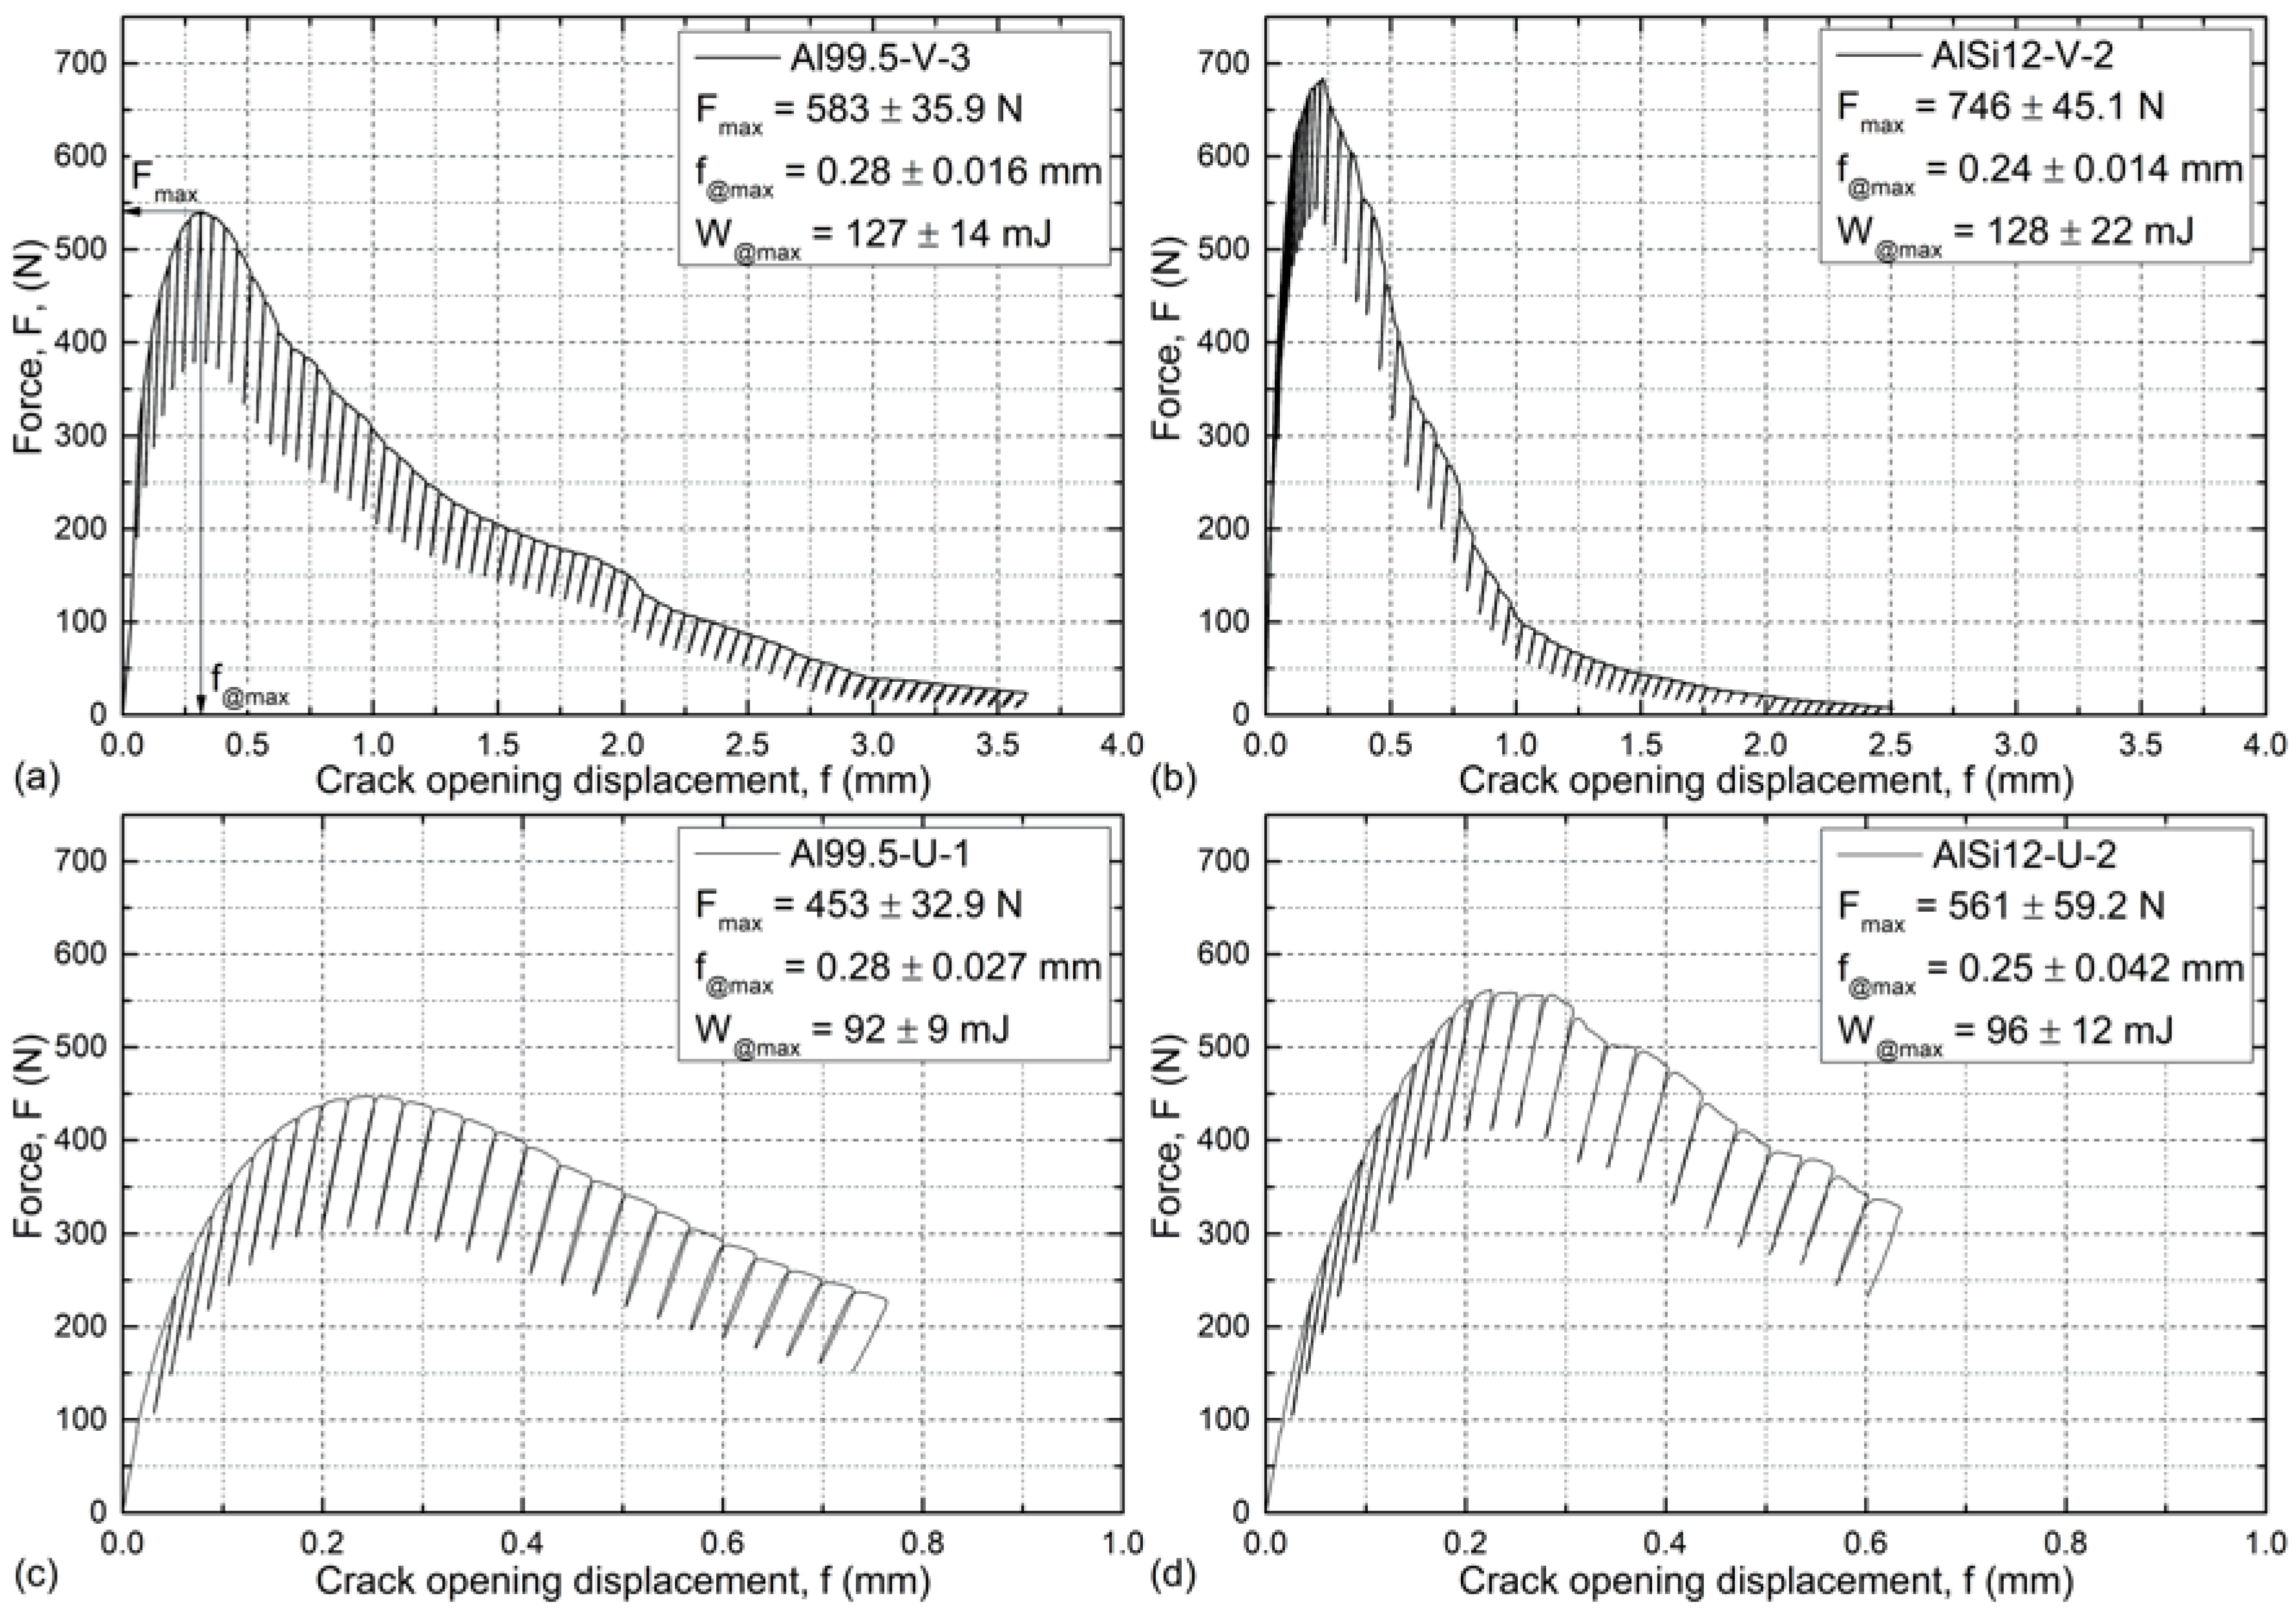
The typical load–crack opening curves for the investigated material and notch combinations with the unloading cycles are shown in Figure 5. In general, after a linear elastic part, a short range plastic deformation occurred and resulted in a maximal force. Up to this point, no pop-ins were detected. At the load maximum, a crack initialized at the notch tip and subsequently propagated, while the force decreased continuously. The force decrement was steeper in the case of the AlSi12 matrix due to the preferred crack propagation mode, detailed later in Section 3.2. The maximal force values and the corresponding crack opening displacements as well as the energy values up to the maximal fore (until the initialization of the first crack) are characteristic properties of the investigated MMSFs; they are listed in Figure 5.
The AlSi12 matrix MMSFs showed higher (~+25%) Fmax values in all cases compared to the Al99.5 matrix foams. Due to the more brittle nature of the matrix, AlSi12 MMSFs showed higher scatter in their maximum forces. Similarly, the higher maximal forces were connected to lower (~−15%) crack opening displacements. In the notch tip geometry point of view, the notches with blunter tips resulted in lower maximal forces, while the corresponding crack opening displacements were geometry-independent and remained the same. The absorbed mechanical energies up to the appearance of the initial cracks (fracture energy, W@max) at the Fmax values were calculated via numerically integrating the force–cross-head displacement curves (very similar to the F–f curves) up to the Fmax force values (summarized in Table 2). These energies can be interpreted as toughness quantities since they show the energy required to break the samples. The fracture energy values were affected by the geometry of the notches only, so this method is not suitable to investigate the effect of the matrix material but yields notch-sensitive results. The samples with different matrix materials showed almost identical W@max values. The effect of force increment and displacement decrement compensated each other; however, the higher scatters for the AlSi12 matrix were inherited to the fracture energy values as well. Regarding the notch geometries, unexpectedly, the blunter notches showed lower fracture energies, which can be explained by the higher probability of critical sites along the surface of the notch in the vicinity of the notch tip (refer to Section 3.2, on fractography) and, due to this, the higher probability of initializing the crack at lower force (and energy) values.
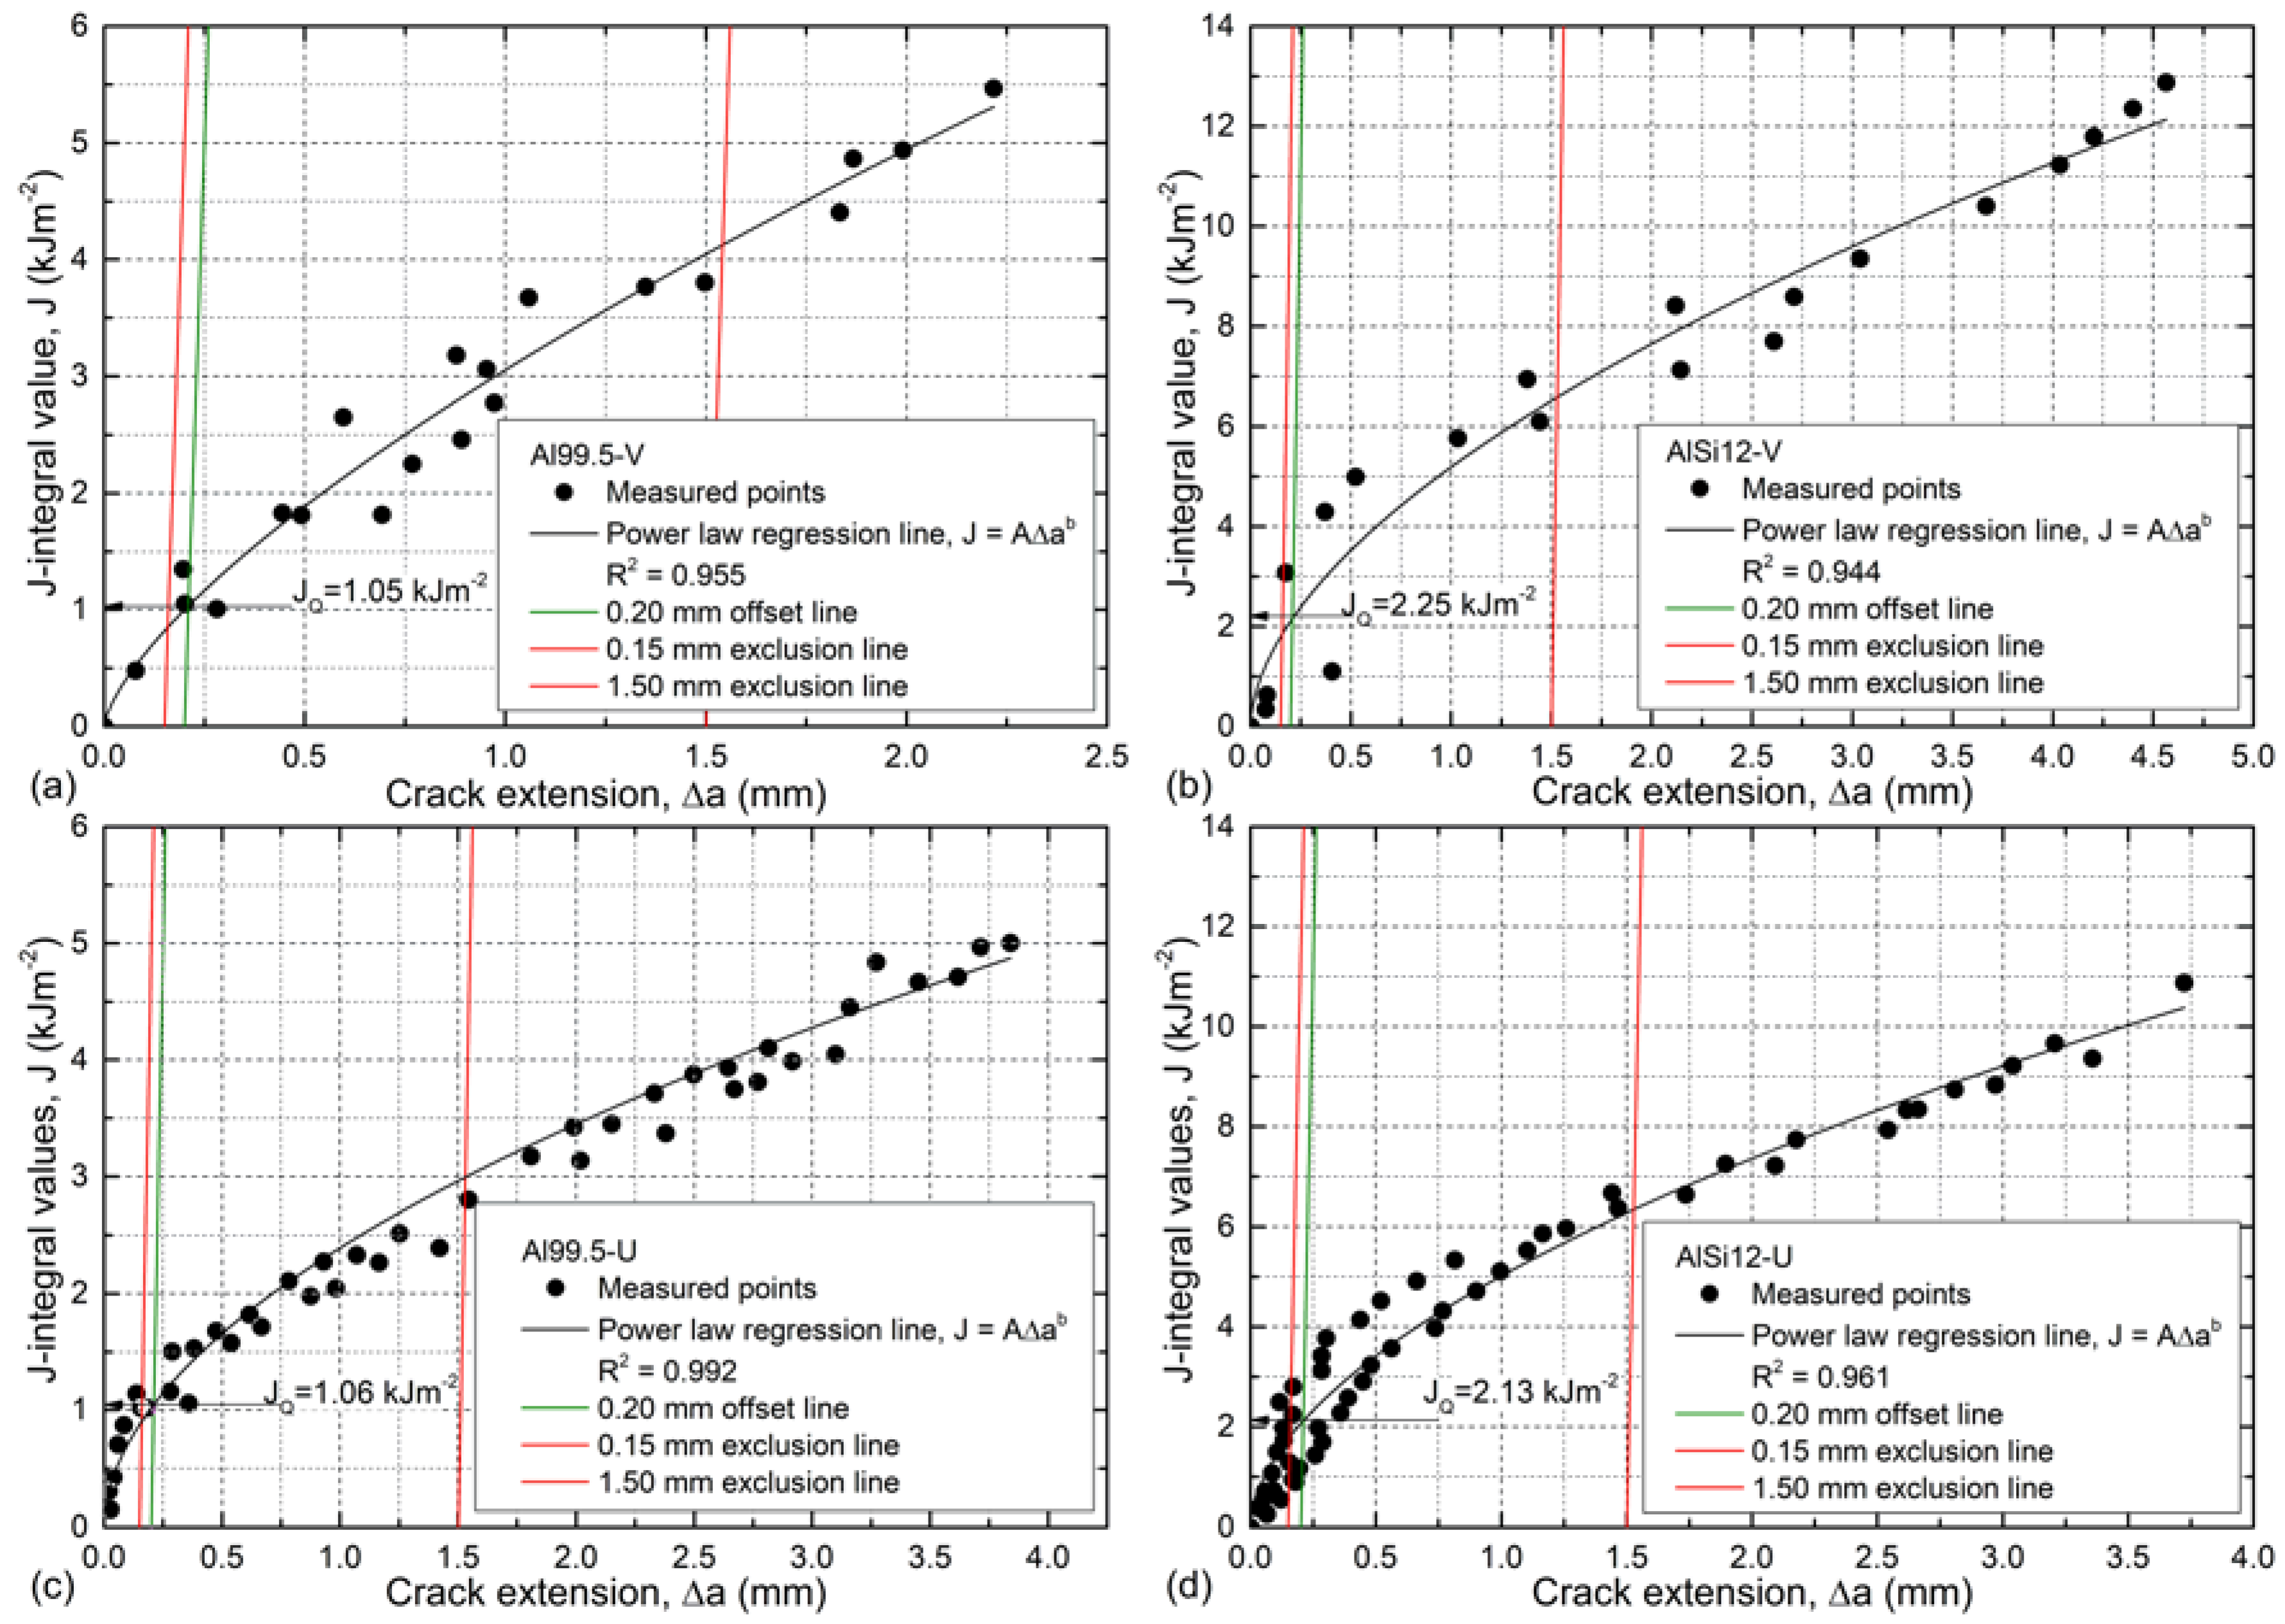
From a fracture mechanics point of view, all of the combinations show elastic-plastic behavior, and no KIC values can be calculated by the 95% secant method, since the criterion Fmax/FQ < 1.1 is clearly violated [65]. Therefore, the resistance curve approach was applied to evaluate the measurements. In this method, the force–crack opening displacement curves are transformed to a J-integral–crack extension curve (J–R curve, according to [65]). The J–R curves can be then evaluated for the questionable value of J-integral (JQ), which can be checked as to whether it is a critical value of J-integral and can be considered as dimension-independent fracture toughness (JIC) (in this case, JQ is only valid for the investigated thickness of the sample). The J–R curves for the investigated configurations are plotted in Figure 6.
The J–R curves plot the agglomerated data of all samples within one MMSF type. Power law lines corresponding to the equation J = A · Δab were fitted on the measured points with R2 > 0.944 values. The fittings can be considered good. According to the standard, the 0.15 and 1.50 mm exclusion lines were constructed (red lines in Figure 6) as well as the 0.20 mm blunting line (green lines in Figure 6), which is a construction line that is key to finding the JQ value as the intersection point with a fitted regression line (marked by labeled arrows in Figure 6). The slope of the blunting line was determined as 2σY, where σY is the so-called effective yield strength (50 MPa for Al99.5-based and 115 MPa for AlSi12-based MMSFs respectively). The determined JQ values are valid fracture toughness (JIC) values if both the original ligament thickness b0 (b0 = W − a0, where a0 is the length of the machined notch) and the thickness B are larger than 25 JQ/σY. These criteria were fulfilled in every case, so the JQ values are valid fracture toughness (JIC) values. The obtained fracture toughness values are one magnitude higher than measured in the case of “conventional” foams [66,72]. Considering the effect of the matrix material and the notch geometry, the situation is contrary to the experienced in the fracture energy evaluation. The fracture toughness was affected by the matrix material only, so in this aspect the MMSFs were found to be notch-insensitive (Table 2).
Due to this phenomenon, the judgement of the toughness of an MMSF structure is a complex decision and depends on the notch geometry (represented by W@max) and on the matrix material (through JIC). Among the investigated material and notch geometry combinations, the AlSi12-V type MMSFs performed better since they unite high fracture energy and high fracture toughness.
3.2. Fractography
First, the fracture process during the loading of the samples was observed. Figure 7 shows the force–crack opening diagram for the AlSi12-V-1 sample and the corresponding pictures taken from the surfaces of the sample, showing the crack propagation and crack surface after the test. Starting from zero load, the specimen was unharmed and ready for the test (Figure 7b). As the increasing load reached its maximum a crack initialized in the notch tip (Figure 7c), the crack path ran along the interfaces between the hollow spheres and the matrix material (arrows in Figure 7c,d). In the case of the AlSi12 matrix, due to its relative brittleness (compared to Al99.5) normally an uncertainty appeared in the recorded load diagram (small amplitude waves just after the peak). As the crack propagated, the load gradually decreased (Figure 7a). In a point in the load–crack opening diagram, a sudden drop appeared and the crack branched into subcracks, as can be observed in Figure 7d, shown by the arrows. Finally, the sample broke into two parts.
As is mentioned in Section 3.1, the different notch geometries allowed different crack initializations, which is the reason behind the unexpectedly lower fracture energies in the case of blunter notches. The surface for the crack initialization is larger in the case of blunter U notches, since the stress concentration is lower and a similar stress distribution can be found on the perimeter of the notch tip, as is sketched in red at the top-left corners of the subfigures in Figure 8, representing the macrographs of the notch tips from the direction of the notch (referring to Figure 1, the viewpoint is from below).
In the case of the V notch, all of the stress is concentrated at the very tip of the notch, forcing the crack to initialize at this site within a small volume (the width of the affected zone was found to be 1.12 ± 0.11 mm). Contrarily, in the case of the U notch, the size of the available crack initialization site (surface) is larger (a width of 2.25 ± 0.24 mm), so the possibility of having a critical site in this larger surface is higher; due to this, the crack can be initialized by lower fracture energy levels. The fracture surfaces were further analyzed through 3D macroscopic images (Figure 9).
Figure 9 represents the macrographs and their corresponding 3D surfaces. These macrographs allow one to map the preferred crack propagation sites, and they yield information on the bonding between the hollow spheres and the matrix material. A simple method is to count the broken and unbroken hollow spheres in the macrograph. The broken spheres indicate strong bonding to the matrix, since the bond was strong enough to hold the spheres tight and the crack broke them. The unbroken ones mean that the bonding was weaker, and due to this the hollow spheres remained in one sample-half. The counted values are listed in Table 3.
In the case of the Al99.5 matrix, the ratio of the broken spheres to the number of all spheres in the fracture surface was about 55–60%, while this ratio was ~15% in the case of the AlSi12 matrix, proving weaker bonding. However, the distance required for the crack to propagate was longer in the case of the AlSi12 matrix, resulting in a higher JIC value and a more quickly increasing R-curve, as is plotted in Figure 6. The 3D images show some deviation from the middle plane of the sample, but the deviation remained within ±2 mm at maximum, and the extreme values were typically far from the crack initialization site.
4. Conclusions
From the above detailed experiments, results, and discussion, aiming to map the fracture behavior and notch sensitivity of MMSFs, the following conclusions can be drawn:
- MMSFs showed elastic-plastic fracture behavior; therefore, besides the measurement of the fracture energies, the R-curve approach is suggested for investigating the toughness of MMSFs.
- The fracture energy up to the maximal force values and the critical value of the J-integral are both necessary to judge the toughness of the MMSFs. The W@max values were sensitive to the notch geometry, while the JIC values were affected only by the matrix material.
- In the case of the U notches, the probability of the presence of a critical site at the end of the notch was larger, so U-notched samples broke at lower W@max values.
- The crack initialized at the crack tip propagated differently in the different matrix MMSFs, resulting different failure modes. In the case of the Al99.5 matrix, the cracks went through the hollow spheres, and this fact indicates a high bonding strength between the hollow spheres and the matrix material. In the case of the AlSi12 matrix, almost all of the hollow spheres were bypassed by the crack that propagated along the surfaces of the weakly bonded hollow spheres, resulting in longer propagation distance and higher R-curves.
Author Contributions
A.S. and B.K. performed the mechanical tests and evaluated the results. A.S. and D.K. performed the macro- and microstructural observations and investigations. I.N.O. was responsible for the organization and wrote the manuscript.
Acknowledgments
This study was supported by the ÚNKP-18-3 New National Excellence Program of the Ministry of Human Capacities (A.S.). The research reported in this paper was supported by the Higher Education Excellence Program of the Ministry of Human Capacities in the frame of Nanotechnology research area of Budapest University of Technology and Economics (BME FIKP-NAT).
Conflicts of Interest
The authors declare no conflict of interest. The founding sponsors had no role in the design of the study; in the collection, analyses, or interpretation of data; in the writing of the manuscript; or in the decision to publish the results.
References
- Zhang, Q.; Lin, Y.; Chi, H.; Chang, J.; Wu, G. Quasi-static and dynamic compression behavior of glass cenospheres/5A03 syntactic foam and its sandwich structure. Compos. Struct. 2018, 183, 499–509. [Google Scholar] [CrossRef]
- Luong, D.D.; Strbik, O.M.; Hammond, V.H.; Gupta, N.; Cho, K. Development of high performance lightweight aluminum alloy/SiC hollow sphere syntactic foams and compressive characterization at quasi-static and high strain rates. J. Alloys Compd. 2013, 550, 412–422. [Google Scholar] [CrossRef]
- Licitra, L.; Luong, D.D.; Strbik, O.M.; Gupta, N. Dynamic properties of alumina hollow particle filled aluminum alloy A356 matrix syntactic foams. Mater. Des. 2015, 66, 504–515. [Google Scholar] [CrossRef]
- Kiser, M.; He, M.Y.; Zok, F.W. The mechanical response of ceramic microballoon reinforced aluminum matrix composites under compressive loading. Acta Mater. 1999, 47, 2685–2694. [Google Scholar] [CrossRef]
- Wu, G.H.; Dou, Z.Y.; Sun, D.L.; Jiang, L.T.; Ding, B.S.; He, B.F. Compression behaviors of cenosphere–pure aluminum syntactic foams. Scr. Mater. 2007, 56, 221–224. [Google Scholar] [CrossRef]
- Zhang, B.; Lin, Y.; Li, S.; Zhai, D.; Wu, G. Quasi-static and high strain rates compressive behavior of aluminum matrix syntactic foams. Compos. Part B Eng. 2016, 98, 288–296. [Google Scholar] [CrossRef]
- Goel, M.D.; Peroni, M.; Solomos, G.; Mondal, D.P.; Matsagar, V.A.; Gupta, A.K.; Larcher, M.; Marburg, S. Dynamic compression behavior of cenosphere aluminum alloy syntactic foam. Mater. Des. 2012, 42, 418–423. [Google Scholar]
- Balch, D.K.; O’Dwyer, J.G.; Davis, G.R.; Cady, C.M.; Gray, G.T.; Dunand, D.C. Plasticity and damage in aluminum syntactic foams deformed under dynamic and quasi-static conditions. Mater. Sci. Eng. A 2005, 391, 408–417. [Google Scholar] [CrossRef]
- Vendra, L.J.; Rabiei, A. A study on aluminum–steel composite metal foam processed by casting. Mater. Sci. Eng. A 2007, 465, 59–67. [Google Scholar] [CrossRef]
- Cox, J.; Luong, D.D.; Shunmugasamy, V.C.; Gupta, N.; Strbik, O.M.; Cho, K. Dynamic and Thermal Properties of Aluminum Alloy A356/Silicon Carbide Hollow Particle Syntactic Foams. Metals 2014, 4, 530–548. [Google Scholar] [CrossRef] [Green Version]
- Anbuchezhiyan, G.; Mohan, B.; Sathianarayanan, D.; Muthuramalingam, T. Synthesis and characterization of hollow glass microspheres reinforced magnesium alloy matrix syntactic foam. J. Alloys Compd. 2017, 719, 125–132. [Google Scholar] [CrossRef]
- Anantharaman, H.; Shunmugasamy, V.C.; Strbik, O.M.; Gupta, N.; Cho, K. Dynamic properties of silicon carbide hollow particle filled magnesium alloy (AZ91D) matrix syntactic foams. Int. J. Impact Eng. 2015, 82, 14–24. [Google Scholar] [CrossRef]
- Xia, X.; Feng, J.; Ding, J.; Song, K.; Chen, X.; Zhao, W.; Liao, B.; Hur, B. Fabrication and characterization of closed-cell magnesium-based composite foams. Mater. Des. 2015, 74, 36–43. [Google Scholar] [CrossRef]
- Braszczyńska-Malik, K.N.; Kamieniak, J. Analysis of interface between components in AZ91 magnesium alloy foam composite with Ni-P coated fly ash cenospheres. J. Alloys Compd. 2017, 720, 352–359. [Google Scholar] [CrossRef]
- Braszczyńska-Malik, K.N.; Kamieniak, J. AZ91 magnesium matrix foam composites with fly ash cenospheres fabricated by negative pressure infiltration technique. Mater. Charact. 2017, 128, 209–216. [Google Scholar] [CrossRef]
- Movahedi, N.; Taherishargh, M.; Belova, I.V; Murch, G.E.; Fiedler, T. Mechanical and Microstructural Characterization of an AZ91—Activated Carbon Syntactic Foam. Materials 2018, 12, 3. [Google Scholar] [CrossRef] [PubMed]
- Xia, X.; Wang, J.; Peng, Y.; Wang, N.; He, X.; Qiu, C.; Ding, J.; Chen, X. Temperature-Time Superposition Effect on Compressive Properties of AZ31B Magnesium Composite Foams. Metals 2018, 8, 434. [Google Scholar] [CrossRef]
- Luong, D.D.; Shunmugasamy, V.C.; Gupta, N.; Weise, J.; Baumeister, J. Quasi-static and high strain rates compressive response of iron and Invar matrix syntactic foams. Mater. Des. 2015, 66, 516–531. [Google Scholar] [CrossRef]
- Peroni, L.; Scapin, M.; Avalle, M.; Weise, J.; Lehmhus, D.; Baumeister, J.; Busse, M. Syntactic Iron Foams—On Deformation Mechanisms and Strain-Rate Dependence of Compressive Properties. Adv. Eng. Mater. 2012, 14, 909–918. [Google Scholar] [CrossRef]
- Peroni, L.; Scapin, M.; Fichera, C.; Lehmhus, D.; Weise, J.; Baumeister, J.; Avalle, M. Investigation of the mechanical behaviour of AISI 316L stainless steel syntactic foams at different strain-rates. Compos. Part B Eng. 2014, 66, 430–442. [Google Scholar] [CrossRef]
- Lehmhus, D.; Weise, J.; Baumeister, J.; Peroni, L.; Scapin, M.; Fichera, C.; Avalle, M.; Busse, M. Quasi-static and Dynamic Mechanical Performance of Glass Microsphere- and Cenosphere-based 316L Syntactic Foams. Procedia Mater. Sci. 2014, 4, 383–387. [Google Scholar] [CrossRef]
- Castro, G.; Nutt, S.R. Synthesis of syntactic steel foam using mechanical pressure infiltration. Mater. Sci. Eng. A 2012, 535, 274–280. [Google Scholar] [CrossRef]
- Castro, G.; Nutt, S.R. Synthesis of syntactic steel foam using gravity-fed infiltration. Mater. Sci. Eng. A 2012, 553, 89–95. [Google Scholar] [CrossRef]
- Hu, L.; Ngai, T.; Peng, H.; Li, L.; Zhou, F.; Peng, Z. Microstructure and Properties of Porous High-N Ni-Free Austenitic Stainless Steel Fabricated by Powder Metallurgical Route. Materials 2018, 11, 1058. [Google Scholar] [CrossRef] [PubMed]
- Szlancsik, A.; Katona, B.; Májlinger, K.; Orbulov, I.N. Compressive Behavior and Microstructural Characteristics of Iron Hollow Sphere Filled Aluminum Matrix Syntactic Foams. Materials 2015, 8, 7926–7937. [Google Scholar] [CrossRef] [PubMed] [Green Version]
- Jha, N.; Mondal, D.P.; Goel, M.D.; Majumdar, J.D.; Das, S.; Modi, O.P. Titanium cenosphere syntactic foam with coarser cenosphere fabricated by powder metallurgy at lower compaction load. Trans. Nonferrous Met. Soc. China 2014, 24, 89–99. [Google Scholar] [CrossRef]
- Xue, X.; Zhao, Y. Ti matrix syntactic foam fabricated by powder metallurgy: Particle breakage and elastic modulus. JOM 2011, 63, 43–47. [Google Scholar] [CrossRef]
- Xue, X.; Wang, L.; Wang, M.; Lü, W.; Zhang, D. Manufacturing, compressive behaviour and elastic modulus of Ti matrix syntactic foam fabricated by powder metallurgy. Trans. Nonferrous Met. Soc. China 2012, 22, s188–s192. [Google Scholar] [CrossRef]
- Mondal, D.P.; Datta Majumder, J.; Jha, N.; Badkul, A.; Das, S.; Patel, A.; Gupta, G. Titanium-cenosphere syntactic foam made through powder metallurgy route. Mater. Des. 2012, 34, 82–89. [Google Scholar] [CrossRef]
- Daoud, A. Synthesis and characterization of novel ZnAl22 syntactic foam composites via casting. Mater. Sci. Eng. A 2008, 488, 281–295. [Google Scholar] [CrossRef]
- Sánchez-Martínez, A.; Cruz, A.; González-Nava, M.; Suárez, M.A. Main process parameters for manufacturing open-cell Zn-22Al-2Cu foams by the centrifugal infiltration route and mechanical properties. Mater. Des. 2016, 108, 494–500. [Google Scholar] [CrossRef]
- Aragon-Lezama, J. A.; Garcia-Borquez, A.; Torres-Villaseñor, G. Foam behavior of solid glass spheres—Zn22Al2Cu composites under compression stresses. Mater. Sci. Eng. A 2015, 638, 165–173. [Google Scholar] [CrossRef]
- Linul, E.; Lell, D.; Movahedi, N.; Codrean, C.; Fiedler, T. Compressive properties of zinc syntactic foams at elevated temperatures. Compos. Part B Eng. 2018, 167, 122–134. [Google Scholar] [CrossRef]
- Rohatgi, P.K.; Kim, J.K.; Gupta, N.; Alaraj, S.; Daoud, A. Compressive characteristics of A356/fly ash cenosphere composites synthesized by pressure infiltration technique. Compos. Part A Appl. Sci. Manuf. 2006, 37, 430–437. [Google Scholar] [CrossRef]
- Rohatgi, P.K.; Guo, R.Q. Mechanism of abrasive wear of Al-Si hypoeutectic alloycontaining 5 vol % fly ash. Tribol. Lett. 1997, 3, 339–347. [Google Scholar] [CrossRef]
- Rohatgi, P.K.; Daoud, A.; Schultz, B.F.; Puri, T. Microstructure and mechanical behavior of die casting AZ91D-Fly ash cenosphere composites. Compos. Part A Appl. Sci. Manuf. 2009, 40, 883–896. [Google Scholar] [CrossRef]
- Zhang, Q.; Lee, P.D.; Singh, R.; Wu, G.; Lindley, T.C. Micro-CT characterization of structural features and deformation behavior of fly ash/aluminum syntactic foam. Acta Mater. 2009, 57, 3003–3011. [Google Scholar] [CrossRef]
- Guo, R.Q.; Rohatgi, P.K. Chemical reactions between aluminum and fly ash during synthesis and reheating of Al-fly ash composite. Metall. Mater. Trans. B 1998, 29, 519–525. [Google Scholar] [CrossRef]
- Rohatgi, P.K.; Guo, R.Q.; Iksan, H.; Borchelt, E.J.; Asthana, R. Pressure infiltration technique for synthesis of aluminum–fly ash particulate composite. Mater. Sci. Eng. A 1998, 244, 22–30. [Google Scholar] [CrossRef]
- Rajan, T.P.D.; Pillai, R.M.; Pai, B.C.; Satyanarayana, K.G.; Rohatgi, P.K. Fabrication and characterisation of Al–7Si–0.35Mg/fly ash metal matrix composites processed by different stir casting routes. Compos. Sci. Technol. 2007, 67, 3369–3377. [Google Scholar] [CrossRef]
- Omar, M.Y.; Xiang, C.; Gupta, N.; Strbik, O.M.; Cho, K. Data characterizing flexural properties of Al/Al2O3 syntactic foam core metal matrix sandwich. Data Br. 2015, 5, 564–571. [Google Scholar] [CrossRef] [PubMed]
- Santa Maria, J.A.; Schultz, B.F.; Ferguson, J.B.; Rohatgi, P.K. Al–Al2O3 syntactic foams—Part I: Effect of matrix strength and hollow sphere size on the quasi-static properties of Al-A206/Al2O3 syntactic foams. Mater. Sci. Eng. A 2013, 582, 415–422. [Google Scholar] [CrossRef]
- Ferguson, J.B.; Santa Maria, J.A.; Schultz, B.F.; Rohatgi, P.K. Al–Al2O3 syntactic foams—Part II: Predicting mechanical properties of metal matrix syntactic foams reinforced with ceramic spheres. Mater. Sci. Eng. A 2013, 582, 423–432. [Google Scholar] [CrossRef]
- Santa Maria, J.A.; Schultz, B.F.; Ferguson, J.B.; Gupta, N.; Rohatgi, P.K. Effect of hollow sphere size and size distribution on the quasi-static and high strain rate compressive properties of Al-A380—Al2O3 syntactic foams. J. Mater. Sci. 2014, 49, 1267–1278. [Google Scholar] [CrossRef]
- Taherishargh, M.; Belova, I.V.; Murch, G.E.; Fiedler, T. The effect of particle shape on mechanical properties of perlite/metal syntactic foam. J. Alloys Compd. 2017, 693, 55–60. [Google Scholar] [CrossRef]
- Taherishargh, M.; Vesenjak, M.; Belova, I.V.; Krstulović-Opara, L.; Murch, G.E.; Fiedler, T. In situ manufacturing and mechanical properties of syntactic foam filled tubes. Mater. Des. 2016, 99, 356–368. [Google Scholar] [CrossRef]
- Taherishargh, M.; Belova, I.V.; Murch, G.E.; Fiedler, T. Low-density expanded perlite–aluminium syntactic foam. Mater. Sci. Eng. A 2014, 604, 127–134. [Google Scholar] [CrossRef]
- Borovinšek, M.; Taherishargh, M.; Vesenjak, M.; Ren, Z.; Fiedler, T. Geometrical characterization of perlite-metal syntactic foam. Mater. Charact. 2016, 119, 209–215. [Google Scholar] [CrossRef]
- Sulong, M.A.; Taherishargh, M.; Belova, I.V.; Murch, G.E.; Fiedler, T. On the mechanical anisotropy of the compressive properties of aluminium perlite syntactic foam. Comput. Mater. Sci. 2015, 109, 258–265. [Google Scholar] [CrossRef]
- Taherishargh, M.; Katona, B.; Fiedler, T.; Orbulov, I.N. Fatigue properties of expanded perlite/aluminum syntactic foams. J. Compos. Mater. 2017, 51, 773–781. [Google Scholar] [CrossRef]
- Taherishargh, M.; Belova, I.V.; Murch, G.E.; Fiedler, T. On the mechanical properties of heat-treated expanded perlite–aluminium syntactic foam. Mater. Des. 2014, 63, 375–383. [Google Scholar] [CrossRef]
- Taherishargh, M.; Sulong, M.A.; Belova, I.V.; Murch, G.E.; Fiedler, T. On the particle size effect in expanded perlite aluminium syntactic foam. Mater. Des. 2015, 66, 294–303. [Google Scholar] [CrossRef]
- Broxtermann, S.; Taherishargh, M.; Belova, I.V.; Murch, G.E.; Fiedler, T. On the compressive behaviour of high porosity expanded Perlite-Metal Syntactic Foam (P-MSF). J. Alloys Compd. 2017, 691, 690–697. [Google Scholar] [CrossRef]
- Fiedler, T.; Taherishargh, M.; Krstulović-Opara, L.; Vesenjak, M. Dynamic compressive loading of expanded perlite/aluminum syntactic foam. Mater. Sci. Eng. A 2015, 626, 296–304. [Google Scholar] [CrossRef]
- Fiedler, T.; Belova, I.V.; Murch, G.E. On the thermal properties of expanded perlite—Metallic syntactic foam. Int. J. Heat Mass Transf. 2015, 90, 1009–1014. [Google Scholar] [CrossRef]
- Linul, E.; Marşavina, L.; Linul, P.-A.; Kovacik, J. Cryogenic and high temperature compressive properties of Metal Foam Matrix Composites. Compos. Struct. 2019, 209, 490–498. [Google Scholar] [CrossRef]
- Movahedi, N.; Linul, E.; Marsavina, L. The Temperature Effect on the Compressive Behavior of Closed-Cell Aluminum-Alloy Foams. J. Mater. Eng. Perform. 2018, 27, 99–108. [Google Scholar] [CrossRef]
- Taherishargh, M.; Linul, E.; Broxtermann, S.; Fiedler, T. The mechanical properties of expanded perlite-aluminium syntactic foam at elevated temperatures. J. Alloys Compd. 2018, 737, 590–596. [Google Scholar] [CrossRef]
- Linul, E.; Movahedi, N.; Marsavina, L. The temperature and anisotropy effect on compressive behavior of cylindrical closed-cell aluminum-alloy foams. J. Alloys Compd. 2018, 740, 1172–1179. [Google Scholar] [CrossRef]
- Chernousov, A.A.; Chan, B.Y.B. Optimising in-situ nitridation in piled aluminium flakes for novel closed cell composites with high fracture stress and toughness. Mater. Des. 2018, 150, 113–123. [Google Scholar] [CrossRef]
- ISO13314:2011–Mechanical Testing of Metals—Ductility Testing—Compression Test for Porous and Cellular Metals; International Organization for Standardization: Geneva, Switzerland, 2011.
- ASTM E399-17–Standard Test Method for Linear-Elastic Plane-Strain Fracture Toughness KIc of Metallic Materials; ASTM International: West Conshohocken, PA, USA, 2017.
- ASTM E813-89E01–Test Method for JIC, A Measure of Fracture Toughness (Withdrawn 1997); ASTM International: West Conshohocken, PA, USA, 1989.
- ASTM E1152-95–Test Method for Determining J-R Curves (Withdrawn 1997); ASTM International: West Conshohocken, PA, USA, 1995.
- ASTM E1820-18–Standard Test Method for Measurement of Fracture Toughness; ASTM International: West Conshohocken, PA, USA, 2018.
- McCullough, K.Y.G.; Fleck, N.A.; Ashby, M.F. Toughness of aluminium alloy foams. Acta Mater. 1999, 47, 2331–2343. [Google Scholar] [CrossRef] [Green Version]
- Olurin, O.B.; Fleck, N.A.; Ashby, M.F. Deformation and fracture of aluminium foams. Mater. Sci. Eng. A 2000, 291, 136–146. [Google Scholar] [CrossRef] [Green Version]
- ASTM E647-15e1–Standard Test Method for Measurement of Fatigue Crack Growth Rates; ASTM International: West Conshohocken, PA, USA, 2015.
- Olurin, O.B.; McCullough, K.Y.G.; Fleck, N.A.; Ashby, M.F. Fatigue crack propagation in aluminium alloy foams. Int. J. Fatigue 2001, 23, 375–382. [Google Scholar] [CrossRef]
- Motz, C.; Pippan, R. Fracture behaviour and fracture toughness of ductile closed-cell metallic foams. Acta Mater. 2002, 50, 2013–2033. [Google Scholar] [CrossRef]
- Motz, C.; Friedl, O.; Pippan, R. Fatigue crack propagation in cellular metals. Int. J. Fatigue 2005, 27, 1571–1581. [Google Scholar] [CrossRef]
- Combaz, E.; Mortensen, A. Fracture toughness of Al replicated foam. Acta Mater. 2010, 58, 4590–4603. [Google Scholar] [CrossRef]
- Combaz, E.; Rossoll, A.; Mortensen, A. Hole and notch sensitivity of aluminium replicated foam. Acta Mater. 2011, 59, 572–581. [Google Scholar] [CrossRef]
- Kashef, S.; Asgari, A.; Hilditch, T.B.; Yan, W.; Goel, V.K.; Hodgson, P.D. Fracture toughness of titanium foams for medical applications. Mater. Sci. Eng. A 2010, 527, 7689–7693. [Google Scholar] [CrossRef]
- Kashef, S.; Asgari, A.; Hilditch, T.B.; Yan, W.; Goel, V.K.; Hodgson, P.D. Fatigue crack growth behavior of titanium foams for medical applications. Mater. Sci. Eng. A 2011, 528, 1602–1607. [Google Scholar] [CrossRef]
- Orbulov, I.N. Metal matrix syntactic foams produced by pressure infiltration—The effect of infiltration parameters. Mater. Sci. Eng. A 2013, 583, 11–19. [Google Scholar] [CrossRef] [Green Version]
- Jaeger, H.M.; Nagel, S.R. Physics of the Granular State. Science 1992, 255, 1523–1531. [Google Scholar] [CrossRef]
- Torquato, S.; Truskett, T.M.; Debenedetti, P.G. Is Random Close Packing of Spheres Well Defined? Phys. Rev. Lett. 2000, 84, 2064–2067. [Google Scholar] [CrossRef] [Green Version]
Figure 1.
The investigated notch geometries: (a) sharp notch; (b) blunt notch.

Figure 2.
Micrographs of (a) Al99.5-based and (b) AlSi12-based metal matrix syntactic foams (MMSFs); (c) magnified part from subfigure (b).
Figure 2.
Micrographs of (a) Al99.5-based and (b) AlSi12-based metal matrix syntactic foams (MMSFs); (c) magnified part from subfigure (b).
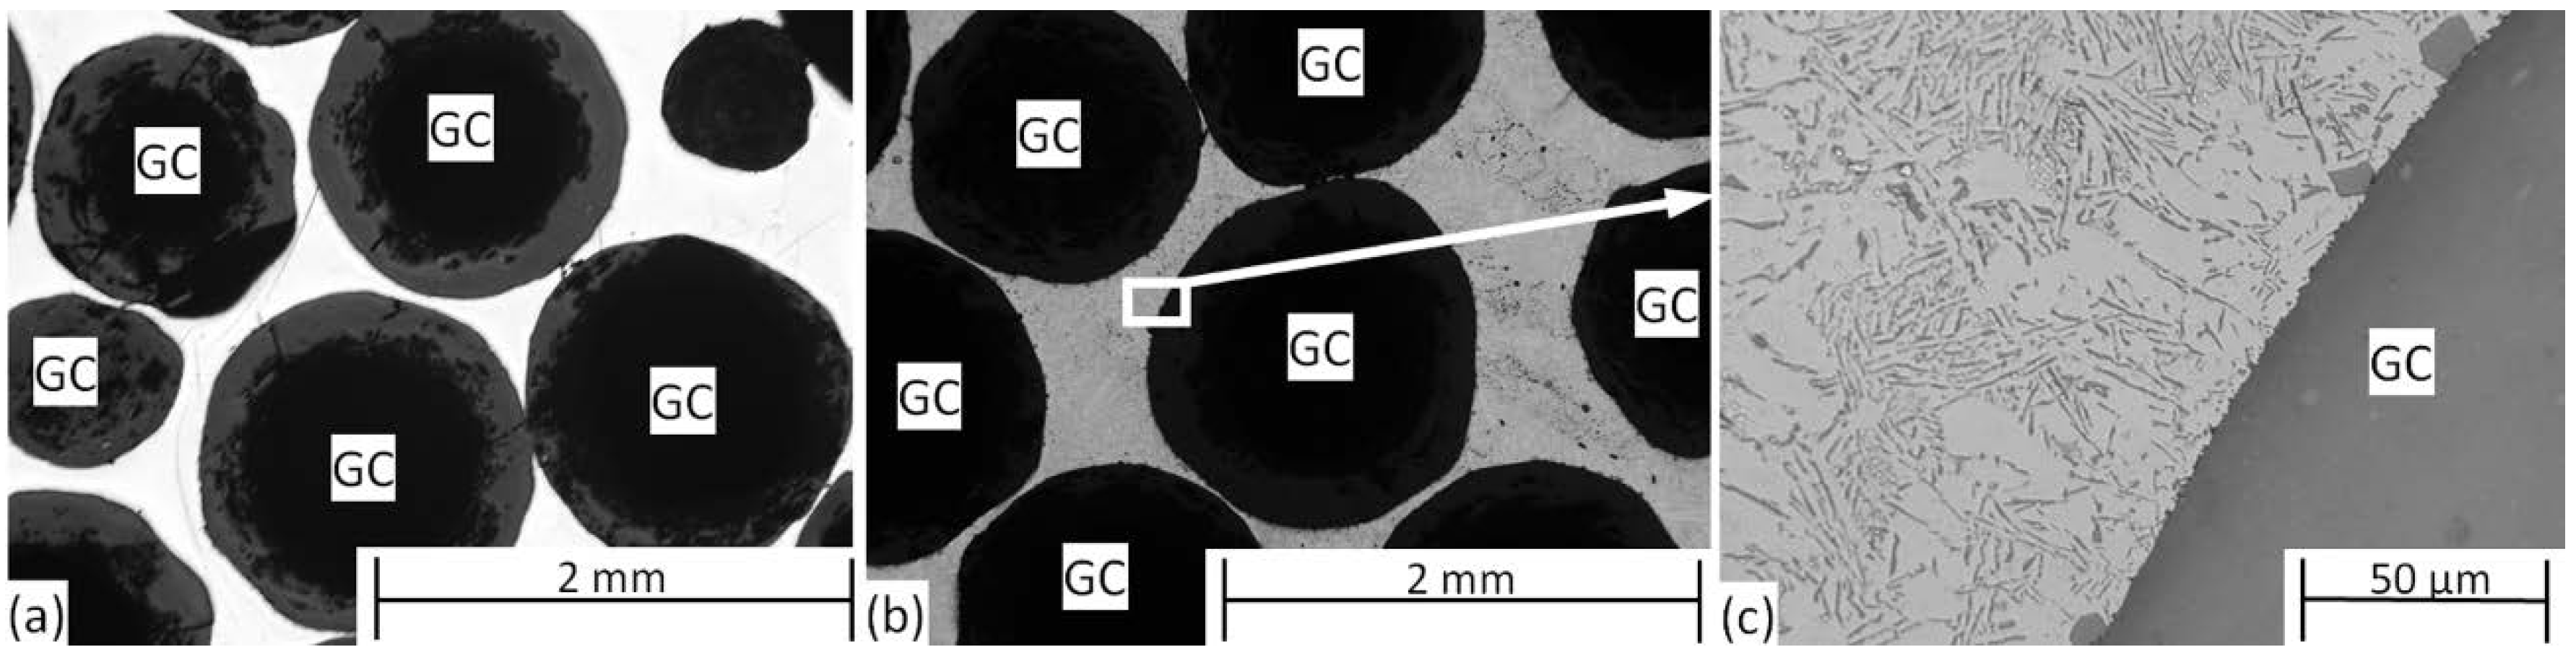
Figure 3.
Line EDS element profiles of (a) Al99.5-based and (b) AlSi12-based MMSFs.

Figure 4.
SEM micrographs of craters from the hollow spheres are removed during the fracture phenomenon: (a) Al99.5-based and (b) AlSi12-based MMSFs.
Figure 4.
SEM micrographs of craters from the hollow spheres are removed during the fracture phenomenon: (a) Al99.5-based and (b) AlSi12-based MMSFs.

Figure 5.
Typical force–crack opening displacement curves of (a) Al99.5-V, (b) AlSi12-V, (c) Al99.5-U, and (d) AlSi12-U MMSFs.
Figure 5.
Typical force–crack opening displacement curves of (a) Al99.5-V, (b) AlSi12-V, (c) Al99.5-U, and (d) AlSi12-U MMSFs.

Figure 6.
J–R curves of (a) Al99.5-V, (b) AlSi12-V, (c) Al99.5-U, and (d) AlSi12-U type MMSFs.

Figure 7.
Fracture process of notched MMSFs (a) the force–crack opening displacement curve and the fracture surface of the AlSi12-V-1 sample; (b–d) crack propagation in the sample.
Figure 7.
Fracture process of notched MMSFs (a) the force–crack opening displacement curve and the fracture surface of the AlSi12-V-1 sample; (b–d) crack propagation in the sample.
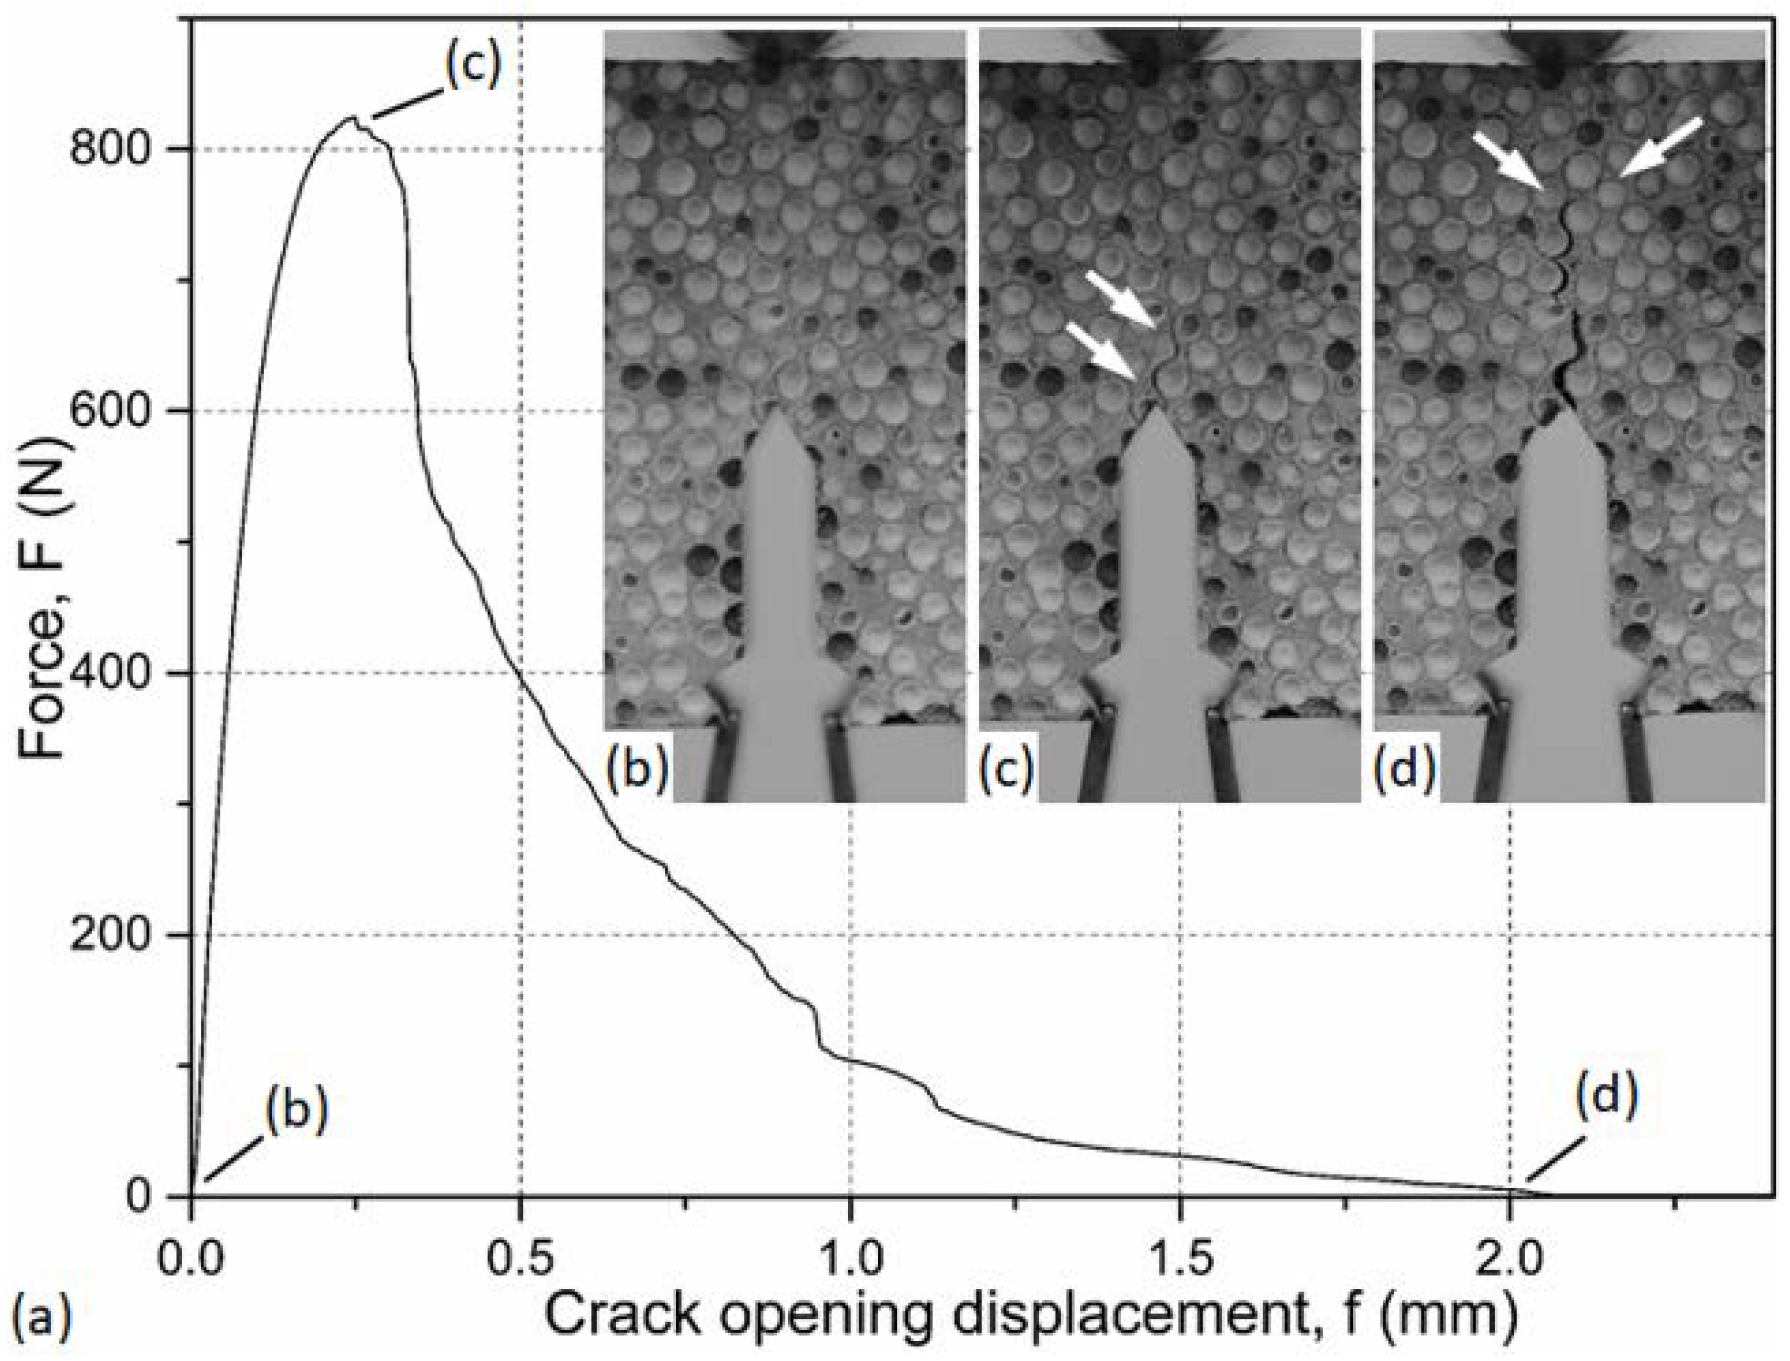
Figure 8.
Initialized crack in the (a) AlSi12-V-3 and (b) Al99.5-U-3 sample.

Figure 9.
Typical fracture surfaces of MMSFs: (a,b) Al99.5-V-2, (c,d) AlSi12-V-1, (e,f) Al99.5-U-1, and (g,h) AlSi12-U-3 sample.
Figure 9.
Typical fracture surfaces of MMSFs: (a,b) Al99.5-V-2, (c,d) AlSi12-V-1, (e,f) Al99.5-U-1, and (g,h) AlSi12-U-3 sample.


Table 1.
Chemical composition of the matrices (in wt %).
| Alloy | Al | Si | Fe | Cu | Mn | Mg | Zn | V | Ti |
|---|---|---|---|---|---|---|---|---|---|
| Al99.5 | 99.070 | 0.250 | 0.400 | 0.050 | 0.050 | 0.050 | 0.050 | 0.050 | 0.030 |
| AlSi12 | 87.019 | 12.83 | 0.127 | 0.002 | 0.005 | 0.010 | 0.007 | 0.000 | 0.000 |
Table 2.
Results of the toughness measurements.
| MMSF Type | Fracture Energy, W@max (mJ) | Fracture Toughness, JIC (kJm−2) |
|---|---|---|
| Notch-Sensitive | Notch-Insensitive | |
| Al99.5-V | 127 ± 14 | 1.05 |
| AlSi12-V | 128 ± 22 | 2.25 |
| Al99.5-U | 92 ± 9 | 1.06 |
| AlSi12-U | 96 ± 12 | 2.13 |
Table 3.
Ratio of the broken hollow spheres on the fracture surface.
| MMSF Type | Broken Spheres | All Spheres | Ratio (%) |
|---|---|---|---|
| Al99.5-V | 52 | 87 | 59.8 |
| AlSi12-V | 15 | 98 | 15.3 |
| Al99.5-U | 49 | 89 | 55.1 |
| AlSi12-U | 14 | 96 | 14.6 |
© 2019 by the authors. Licensee MDPI, Basel, Switzerland. This article is an open access article distributed under the terms and conditions of the Creative Commons Attribution (CC BY) license (http://creativecommons.org/licenses/by/4.0/).
Share and Cite
MDPI and ACS Style
Szlancsik, A.; Katona, B.; Károly, D.; Orbulov, I.N. Notch (In)Sensitivity of Aluminum Matrix Syntactic Foams. Materials 2019, 12, 574. https://doi.org/10.3390/ma12040574
AMA Style
Szlancsik A, Katona B, Károly D, Orbulov IN. Notch (In)Sensitivity of Aluminum Matrix Syntactic Foams. Materials. 2019; 12(4):574. https://doi.org/10.3390/ma12040574
Chicago/Turabian StyleSzlancsik, Attila, Bálint Katona, Dóra Károly, and Imre Norbert Orbulov. 2019. "Notch (In)Sensitivity of Aluminum Matrix Syntactic Foams" Materials 12, no. 4: 574. https://doi.org/10.3390/ma12040574
Note that from the first issue of 2016, this journal uses article numbers instead of page numbers. See further details here.