The Photodynamic Properties and the Genotoxicity of Heat-Treated Silicalite-1 Films
by
 , ,
, ,
Ivan Jirka
1,* ,
,
Ivana Kopová
2,
Pavel Kubát
1,
Edyta Tabor
1,
Lucie Bačáková
2,
Milan Bouša
1 and
Petr Sajdl
3 1
J. Heyrovský Institute of Physical Chemistry of the Czech Academy of Sciences, v.v.i, Dolejškova 3, 182 23 Prague 8, Czech Republic
2
Institute of Physiology of the Czech Academy of Sciences, v.v.i., Vídeňská 1083, 142 20 Prague 4, Czech Republic
3
Power Engineering Department, University of Chemistry and Technology, Technická 3, 166 28 Prague 6, Czech Republic
*
Author to whom correspondence should be addressed.
Materials 2019, 12(4), 567; https://doi.org/10.3390/ma12040567
Submission received: 4 January 2019
/
Revised: 31 January 2019
/
Accepted: 10 February 2019
/
Published: 14 February 2019
Abstract
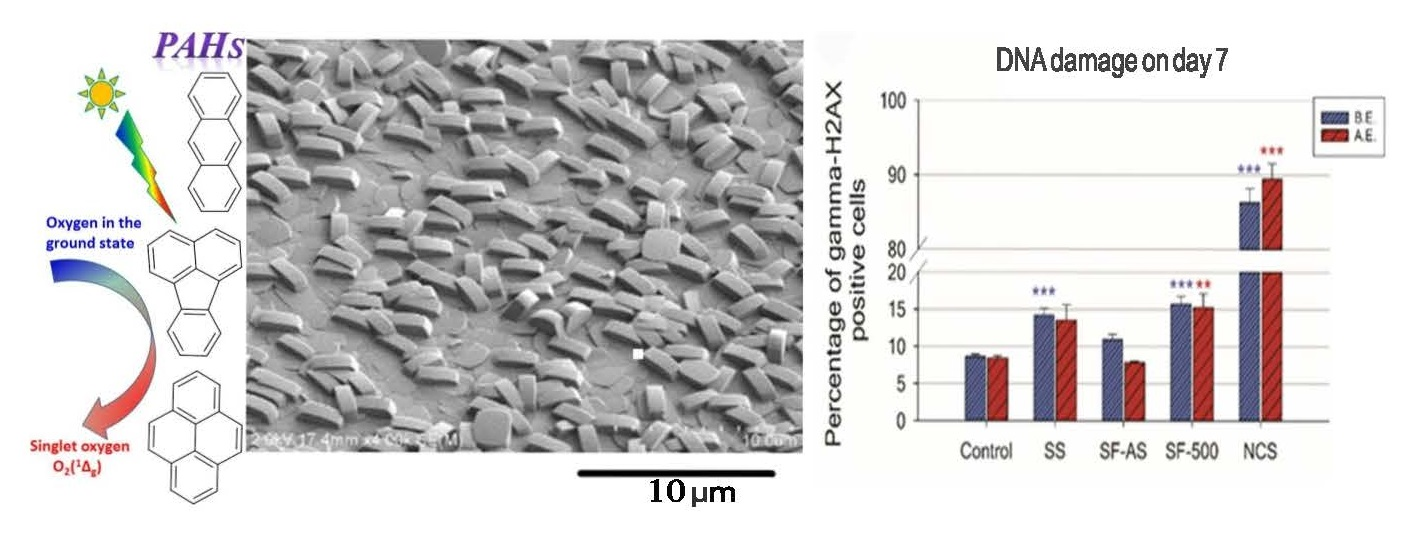
:We investigated the use of a supported silicalite-1 film (SF) as a promising coating for metallic materials used in the fabrication of prostheses. The role of carbonaceous residua present on high-temperature calcined-SF in generating singlet oxygen for future use as a sterilization method has also been addressed, and the potential genotoxicity of these residua in osteoblast-like cells has been investigated. Calcination of as-synthesized SF induced the appearance of a rather complicated mixture of aliphatic and aromatic species on its outer surface. A series of variously volatile polycyclic aromatic hydrocarbons (PAH), including naphthalene, fluorene, phenanthrene, anthracene, fluoranthene, and pyrene, were identified in micromole concentrations. Irradiation of these PAHs on calcined-SF immersed in air-saturated chloroform led to the formation of very low concentrations of singlet oxygen. However, an increased level of DNA damage was observed on calcined-SF by immunofluorescence staining of phosphorylated histone H2AX analyzed by flow cytometry.

1. Introduction
Appropriate selection of implant biomaterials is a key factor for the long-term success of implants. Implant biomaterials should be selected to reduce the negative biological response, while maintaining adequate function. The relatively long and complicated healing process after the introduction of a joint prosthesis into an organism (i.e., long-term implant osseointegration), and the limited mean lifetime of a joint prosthesis are important problems [1]. The application of prosthetic materials is further complicated by formation of a biofilm with resistant bacteria on its surfaces. These resistant bacteria are difficult to remove by sterilization [2]. In addition, the most widely-used metallic materials, such as stainless steel and titanium-based alloys, mainly Ti6Al4V, are associated with a risk of the release of cytotoxic and allergenic ions [3,4].
One way to improve the biocompatibility of an implant material is to modify its surface in an appropriate manner, e.g., by grinding; by polishing [4,5]; with the use of various oxidative treatments, such as acid and alkaline etching [6,7]; anodic and thermal oxidation [6,8,9]; and coating with a bioactive, chemically stable, and mechanically resistant film [1]. Mordenite Framework Inverted (MFI) zeolite films are candidates for use as a film for this purpose [10,11,12].
Supported MFI zeolite films are potentially applicable as a noncytotoxic, robust siliceous porous coating, which can improve the mechanical and anticorrosive properties of the coated material [3,10,11,12,13]. Some researchers have reported good biocompatibility and improved osseointegration of zeolite-coated materials. When applied on Ti6Al4V alloy samples, these films increased the adhesion, proliferation, and osteogenic differentiation of bone-derived and stem cells in vitro in comparison with the bare alloy [11,12,13]. Similarly in vivo, these films significantly enhanced osseointegration and bone regeneration after the implantation of Ti6Al4V samples into rabbit femoral condylar defects [14]. In addition, MFI films showed a greater loading capacity for antibiotics and higher bactericidal activity than conventionally used hydroxyapatite coatings [15].
Medium-pore MFI zeolite with channels defined by ten-member rings belongs to the pentasil zeolite group, and can be prepared in a pure siliceous form (Si/Al → ) known as silicalite-1 [16]. Silicalite-1 crystals (SCs) can be grown hydrothermally on the surface of suitable supports in the form of continuous films composed of intergrown zeolite crystals typically varying in thickness from ~102 to ~103 nm. Several procedures have been published for growing these films with various thicknesses and with various orientations of the intergrown crystals relative to the support surface [17]. The most practical procedure is the one-step in situ crystallization method, which can coat surfaces with a complex geometry [17,18,19,20]. The silicalite-1 film (SF) is promising as an anticorrosive robust siliceous coating for prosthetic materials [10,11,12,13,14,15].
Hydrothermal synthesis of MFI zeolite often requires the application of molecules of a structure-directing agent (SDA), which fills its micropores. To eliminate SDA, high-temperature calcination is most frequently used [21]. Calcination of MFI zeolite induces thermal degradation of SDA (typically tetrapropyl ammonium (TPA+)), which is assumed to proceed via the Hofmann elimination reaction and subsequent β degradation [22,23]. Some of the SDA degradation products (propylene and lower amines) are burned to low molecular species that desorb from the sample. Other products remain bound to the zeolitic phase and form carbonaceous residues from the evolved propylene. Propylene undergoes various reactions, e.g., oligomerization, addition, cyclization, and hydrogen transfer reactions, in which aromatics are produced, together with aliphatic and olefinic species, in the pores of the zeolite [24]. The quantity, the nature, and the stability of the deposits depend on the mode of SDA thermal degradation and on their interaction with the crystal framework. Complete elimination of carbonaceous residues is difficult to achieve, even at high temperatures and with prolonged treatment time [25].
Residual aromatic species were observed on both outermost surfaces of high temperature-treated MFI zeolite (partially graphitized large two-dimensional polycyclic aromatic hydrocarbons (PAHs)) and in the zeolite channels (linear PAHs) [24,26]. These findings were obtained for MFI zeolites with skeletal aluminum, i.e., with acid Brønsted sites, on which dehydrogenation of carbonaceous residues proceeds. In addition, ill-defined aromatic species were also observed in calcined silicalite-1 crystals [25,27]. However, detailed information on concentration and distribution of these PAHs between porous structure of zeolite and its outer surface is missing.
Irradiation of PAH molecules induces the formation of singlet oxygen, i.e., O2(1Δg), which is a key species in antibacterial photodynamic therapy [28,29]. Photosensitizers such as PAHs immobilized on nano-/microstructured surfaces may under certain conditions preserve their photophysical properties [30]. Photodynamic activity would be promising as a powerful tool for the elimination of resistant bacteria on the surface of the material, which are difficult to remove by any other method. However, the PAHs may not only act as an O2(1Δg) sensitizer activated by irradiation [31,32], but they could also be cytotoxic or genotoxic. The last both properties would make calcined-SF inapplicable as a prosthetic material.
The cytotoxicity and the genotoxicity of various PAH molecules are issues that have been widely discussed [33]. The toxicity of PAH molecules depends on their metabolic activation. After entering cells, PAH molecules undergo metabolic activation, catalyzed by cytochrome P450 enzymes or by aldo-reductases or keto-reductases, forming reactive metabolites (e.g., dihydrodiol epoxides or o-quinones, respectively) [34,35]. These metabolites can interact directly with cell proteins and DNA. One of these proteins is glutathione, an intracellular antioxidant which is depleted by PAH binding [36,37]. This depletion reduces the cellular antioxidant capacity (i.e., cellular detoxification), increases the oxidative stress and disrupts other physiological processes, including Ca2+ homeostasis [38].
Another mechanism of PAH genotoxicity is the direct binding of PAH metabolites to the N3 and N7 positions of guanine and adenine in the DNA molecule, creating depurinating DNA adducts [39,40,41]. DNA adducts are known to inhibit the activity of DNA polymerase, resulting in an accumulation of DNA damage [42]. The loss of modified DNA bases generates apurinic sites which, if unrepaired, can cause permanent mutations or DNA double-strand breaks [43]. If these mutations are situated at critical sites, e.g., oncogenes or tumor suppressor genes, they may lead to cellular transformation and the development of cancer. One of the main tumor suppressor genes is p53, with mutations associated with PAH exposure [44,45]. For example, benzo[a]pyrene has been classified as a Group 1 carcinogen by the International Agency for Research on Cancer (IARC) [46].
In this study, the a,b-oriented SF on stainless steel support were prepared. Part of them was calcined at 500 °C, which induced the creation of PAH species. The photodynamic activity and also the cytotoxicity and genotoxicity of PAHs on SF were then investigated. They depend on various parameters, including the type, volatility, and the dispersion of PAH, its concentration and distribution between the SF bulk and the SF surface. The PAHs created on SF were thus thoroughly characterized using gas chromatography with mass spectroscopy detection (GC–MS), Fourier transform infrared spectroscopy (FTIR), and X-ray photoelectron spectroscopy (XPS). We focused our attention on identifying PAH species in calcined-SF and on estimating their concentration and distribution between the outer surface and microporous structure of the samples.
2. Materials and Methods
2.1. Preparation of Silicalite-1 Films (SFs) and Silicalite-1 Crystals (SCs)
Polished stainless steel foil (AISI 316 L, thickness 1 mm), purchased from Goodfellow Metals (GB), was cut into 1 × 1 cm coupons. These coupons were cleaned by sonication in acetone (10 min, 150 W), and were then rinsed in ethanol and in deionized water, and were dried in air. The SFs were synthesized in situ from the reaction mixture of tetrapropylammonium hydroxide, tetraethylorthosilicalite (both Sigma Aldrich), and deionized water, as described in the literature [19]. The reaction mixture was aged for 2 h. Synthesis proceeded for 3 h in a Teflon-lined autoclave under autogenous pressure at 165 °C. The coupons were oriented upside down during synthesis. This arrangement eliminated sedimentation of the silicalite-1 crystals (SCs) formed during synthesis in the bulk of the reaction slurry. The as-prepared silicalite-1 film (SF-AS) was sonicated in deionized water (10 min, 150 W), and was dried in an air atmosphere at 120 °C. The conditions for this last preparation step were identical with the sterilization of the samples used in the biological experiment. The SFs consisted of a well intergrown layer of silicalite-1 crystals covered by a discontinuous layer of only partially intergrown a,b-oriented coffin-shaped crystals (Figure 1A). We investigated both as-synthesized and heat-treated silicalite-1 films. The heat treatment proceeded as follows: the heating rate was 1 °C min−1 up to 500 °C. The sample was maintained at this level for 4 hours, and was then cooled at a rate of 1 °C min−1 in a stream of dry air (300 mL min−1). No cracks were introduced into the SF by the heat treatment. The heat-treated sample was designated as SF-500.
The silicalite crystals (SCs) created in the bulk of the reaction slurry during the synthesis of SF (Figure 1B) were used for Gas Chromatography with Mass Spectrometry detection (GC MS) and Fourier Transform Infrared Spectrosocpy (FTIR) analysis. The external surface of the grained samples was several orders of magnitude larger than the SF surface, and should contain more carbonaceous residues. The freshly-prepared crystals were extensively washed with deionized water and were dried overnight at 120 °C. The crystals contained 1180 ppm iron (Fe) and 10 ppm aluminum (Al). This sample was designated as SC-AS. An amount of ~0.2 g of this sample was calcined in a quartz boat in a stream of dry air, using the same temperature program as for SF-500. The calcined grained sample was designated as SC-500.
2.2. Characterization of SFs and SCs
2.2.1. Scanning Electron Microscopy (SEM)
The morphology of the SF and SC samples was characterized using an S 4800-I scanning electron microscope (Hitachi, Tokyo, Jpn). Acceleration voltage of 1 kV was applied.
2.2.2. Gas Chromatography with Mass Spectrometry Detection (GC–MS)
A GC–MS analysis was performed using GC Trace Ultra with a DSQ II mass spectrometer (Thermo Fischer Science, Waltham, MA, USA). To analyze the aliphatic hydrocarbons on the outer surface of the zeolite, the SC-500 (~0.1 g) was suspended in 20 mL of chloroform in a Teflon-lined autoclave at 120 °C for 2 h. A GC–MS analysis on a DB ms 5 m × 0.32 mm column (Agilent, Santa Clara, CA, USA) was carried out with the extract diluted by toluene. The Supelco standard for aliphatic hydrocarbons (Sigma-Aldrich, St. Louis, MO, USA) was utilized for identifying the hydrocarbons in the extract.
The solid SC-500 was analyzed in direct thermal desorption (DTD) mode. The solid was heated in an Optic-2 (Atas, Eindhoven, NL) injection system in a stream of carrier gas (He) to 350 °C (heating rate 15 °C s−1). Desorption proceeded directly into GC Trace Ultra. An HPms UI 30 m × 0.25 mm × 0.25 mm film column (Agilent) was utilized. The sample was analyzed before and after evacuation at room temperature (RT) (1 h, ~10−4 Pa).
2.2.3. X-ray Photoelectron Spectroscopy (XPS)
An Omicron Nanotechnology ESCAProbe P spectrometer (Omicron Nanotechnology GmbH, Taunusstein, DE) was used to measure the photoelectron spectra. XPS analysis was performed at a pressure of ~10−8 Pa. The X-ray source was monochromatic at 1486.6 eV. The photoelectron spectra were measured at low resolution (survey spectra in the energy region of 0 to 1200 eV with a step size of 0.6 eV) and at high resolution (C 1s, N 1s, and Si 2p spectra in 30 eV scans with a step size of 0.1 eV). The detection angle of the photoelectrons was 90°. The binding energies Eb of the C 1s and N 1s photoelectron lines were calibrated by Eb of the Si 2p photoelectron line (103.8 eV).
The concentrations of N atoms and variously coordinated C atoms, assigned as c(N) and c(C), were evaluated as N/Si and C/Si atomic ratios calculated from the integral intensities of the C 1s, N 1s, and Si 2p photoelectron spectra normalized on the probability of photoemission [47]. The distribution of various carbonaceous species was evaluated from the intensities of the C 1s lines obtained by curve fitting of the C 1s spectrum. A damped nonlinear least-squares fitting procedure was used to distinguish partially resolved lines in the C 1s photoelectron spectra [48]. The fitted lines are marked as c(C 1s)x, where x is the number of lines and is assigned using the NIST database [49].
2.2.4. Fourier Transform Infrared Spectroscopy (FTIR)
Infrared spectra were recorded using an FTIR Nicolet 6700 spectrometer (Thermo Nicolet Co. Madison, USA) equipped with a liquid N2-cooled MCT-B detector. SC-AS and SC-500 were measured in transmission mode, using a heated quartz cell with KBr windows connected to a vacuum. Thin, self-supporting wafers of the samples (8–10 mg cm−2) were placed in the holder, which transported the sample from the heating region to the measurement position. FTIR spectra were recorded between 4000 and 400 cm−1 at a resolution of 2 cm−1 at RT. Hydrated SC-500 was measured first. Then, SC-500 was evacuated under the following conditions (i) 1 h at RT, (ii) 3 h at 250 °C, (iii), overnight at 420 °C, and (iv) overnight at 550 °C. The spectra were normalized relative to the unit height of the most intense skeletal vibration.
The FTIR spectra of SF-AS and SF-500 were measured using another FTIR Nicolet 6700 spectrometer in the same region and resolution under the ambient atmosphere in reflection mode. For a comparison of samples SC-500 and SF-500, the latter was pretreated at 250 °C for 3 h in vacuum (10−6 Pa) ex situ.
2.3. Photogeneration of Singlet Oxygen
Luminescence of O2(1Δg) at 1270 nm was recorded after excitation of both SF-500 and an extract from SC-500 in chloroform by a COMPEX 102 excimer laser (wavelength 308 nm, pulse width ~28 ns) using a Judson Ge diode and interference filters. The signal from the detector was collected in a 600 MHz oscilloscope (Agilent Infiniium, Colorado Springs, USA) and was transferred to a computer for further analysis. The signal-to-noise ratio of the signals was improved by averaging at least 2000 individual traces. The initial part of the traces failed due to the large scattering of the laser light, and it was not used for the evaluation. The resulting kinetics of singlet oxygen luminescence were fitted to a single exponential decay function I = I0 exp(−t/τΔ), where τΔ is the lifetime of O2(1Δg) and I and I0 denote the luminescence intensity of O2(1Δg) at time t and after excitation (t = 0), respectively. Further details can be found in our previous paper [50].
2.4. Cell Culture Conditions and an Evaluation of the DNA Damage Response
Samples of stainless steel and stainless steel covered by SF-AS and by SF-500 were sterilized in a hot-air sterilizer at 120 °C for 2 h, and were inserted into polystyrene 24-well culture plates (diameter 15.4 mm; TPP, Trasadingen, Switzerland). The samples were immediately used for DNA damage analysis, or were evacuated before the evaluation in a vacuum drying chamber (Binder, Tuttlingen, Germany).
The osteosarcoma cell line U-2 OS (ATCC-LGC, Manassas, VA, USA) with wild-type p53 and Rb genes was used to investigate the potential DNA damage to the cells. All samples were seeded with U-2 OS at initial densities ranging from 4200 cells cm−2 to 16,100 cells cm−2 and were cultured for 7 or 3 days, respectively, in Dulbecco’s Modified Eagle’s Medium (Sigma-Aldrich, St. Louis, MO, USA) supplemented with 10% fetal bovine serum (FBS; Sebak GmbH, Aidenbach, Germany) and gentamicin (40 μgM; LEK, Ljubljana, Slovenia) at 37 °C in a humidified air atmosphere containing 5% CO2.
The DNA damage response of the U-2 OS cells was evaluated by immunofluorescence staining analyzed by flow cytometry. Gamma-H2AX antibody (specific to phosphorylated histone H2AX) was used as a marker of DNA double-strand breaks. After 3 and 7 days of cultivation, all samples were transferred to new polystyrene 24-well culture plates and were rinsed with phosphate buffered saline (PBS; Sigma-Aldrich, St. Louis, MO, USA). Cells were then detached by a trypsin-EDTA solution (Sigma-Aldrich, St. Louis, MO, USA), fixed with cold 70% ethanol and were stored at −20 °C for up to two weeks. Fixed cells were rinsed in PBS with 5% FBS and were incubated with Alexa Fluor 488 anti-H2AX-Phosphorylated (Ser139) antibody (5 μg 10–6 cells; Bio-Legend, San Diego, CA, USA; clone 2F3). After 1 h of incubation, the cells were rinsed again and were resuspended in PBS. The stained cells were analyzed using an Accuri C6 Flow Cytometer (BD Biosciences, San Jose, CA, USA).
U-2 OS treated with neocarzinostatin (NCS; 700 ng/mL; Sigma-Aldrich, St. Louis, MO, USA) for 1 h were used as a positive control for the DNA damage response. The cells were fixed 2 h after treatment with NCS. Uncoated microscopic glass coverslips 12 mm in diameter (Menzel Glaser, Monheim am Rhein, Germany) and polystyrene culture plates were used as a reference material. Two samples for each experimental group and time interval were evaluated. To confirm the results, the experiments were performed repeatedly.
3. Results and Discussion
3.1. Characterization of Carbonaceous Residues in SFs and SCs
3.1.1. Identification of Carbonaceous Species
The chromatograms obtained by DTD-GC–MS analysis of SC-500 before and after evacuation at RT (Figure S1, Supporting Information—SI) show several PAHs. Naphthalene, phenanthrene, anthracene, fluorene, fluoranthene, and pyrene were detected (Table 1). The concentrations of these PAHs were higher before evacuation due to effective sublimation in a vacuum [51]. Together with the PAHs, a complicated mixture of saturated hydrocarbons was observed by MS in the chloroform extract of sample SC-500 (Figures S2, S3, and SI). According to a comparison of the extract chromatograms with standards, the hydrocarbons can be identified as a series of C14–C32 alkanes (Figures S3 and SI). However, the retention times in their chromatograms do not exactly match the relevant peaks of the standard. This finding can be explained by the presence of branched alkanes in the mixture.
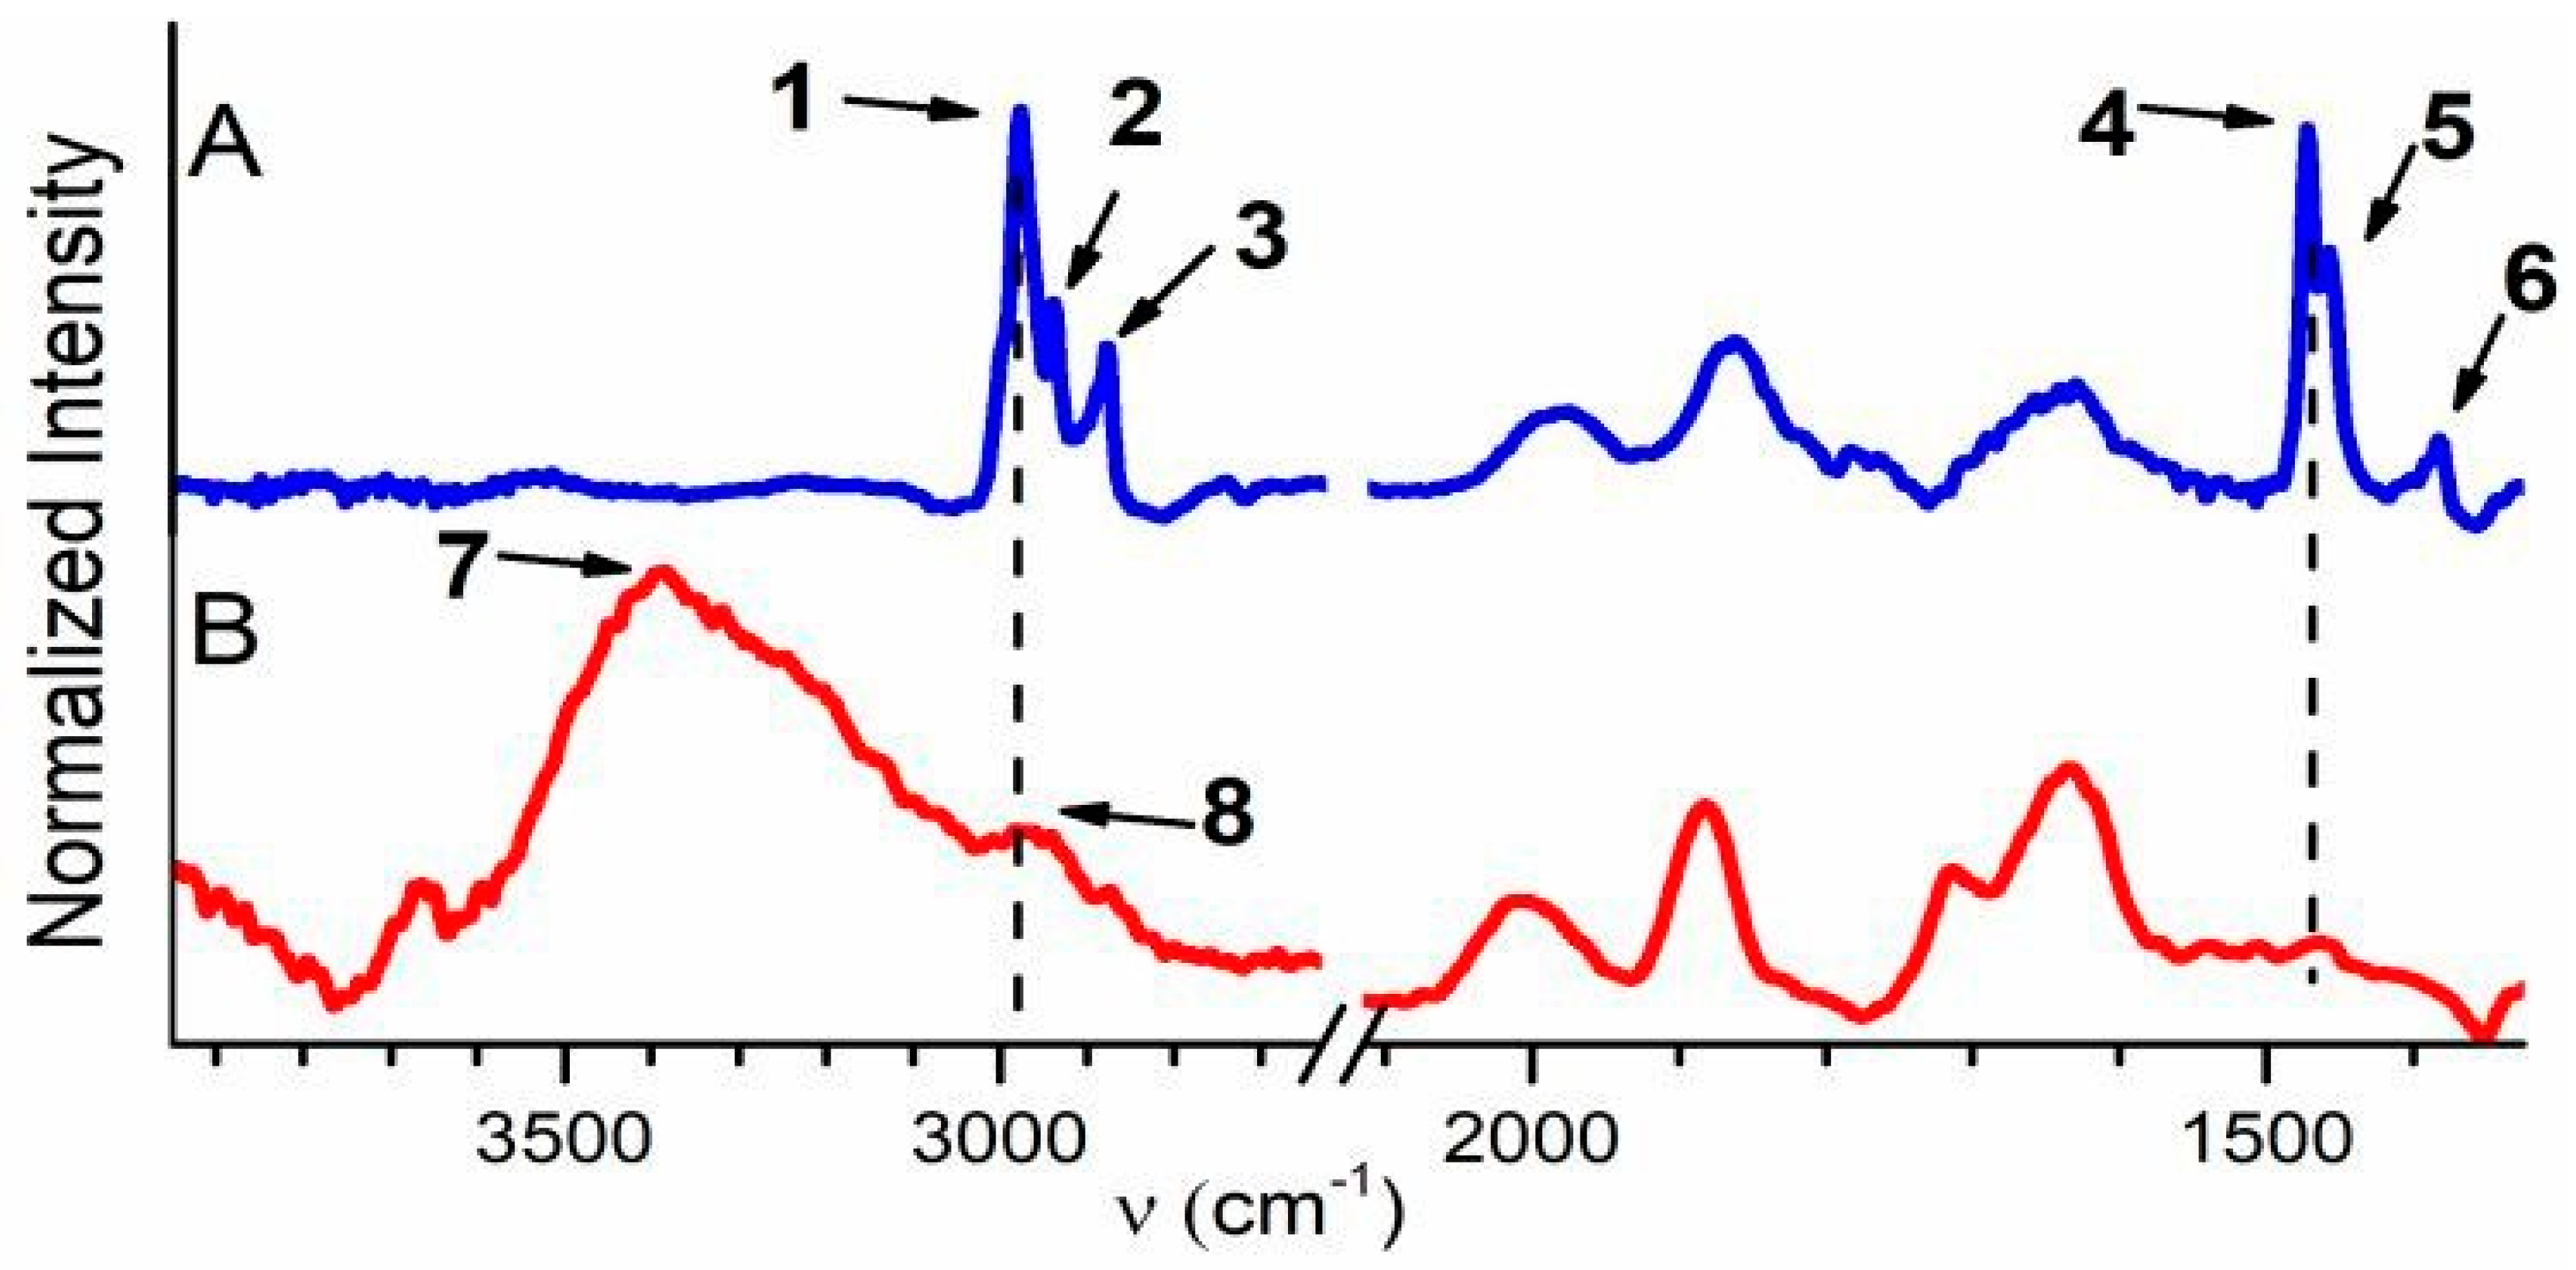
FTIR spectra of samples SF-AS, SF-500, and SC-500 between 4000 and 1500 cm−1 are depicted in Figures S4, SI. The regions between ~3900 and 2600 cm−1 and ~2100 and 1300 cm−1 of these spectra are depicted in Figure 2. Bands 1–3 at 2980 cm−1, 2943 cm−1, and 2881 cm−1, respectively, and bands 4–6 at 1473 cm−1, 1458 cm−1, and 1383 cm−1, respectively, in the spectrum of SF-AS are attributed to C–H stretching and to C–H asymmetric deformation vibrations of propyl chains of SDA, respectively (Figure 2A) [54,55,56,57,58,59]. In the spectrum of SF-500 (Figure 2B), a strong band—7—appeared at ~3394 cm−1 (physisorbed water), and bands 1–3 were replaced by a weak shoulder 8 at ~2951 cm−1, which is characteristic for carbonaceous residues [54,55]. The C–H asymmetric deformation bands of propyl chains of SDA disappeared completely after calcination. Template species were therefore extensively eliminated from SF-500, and only residual carbonaceous species remained [54,55].
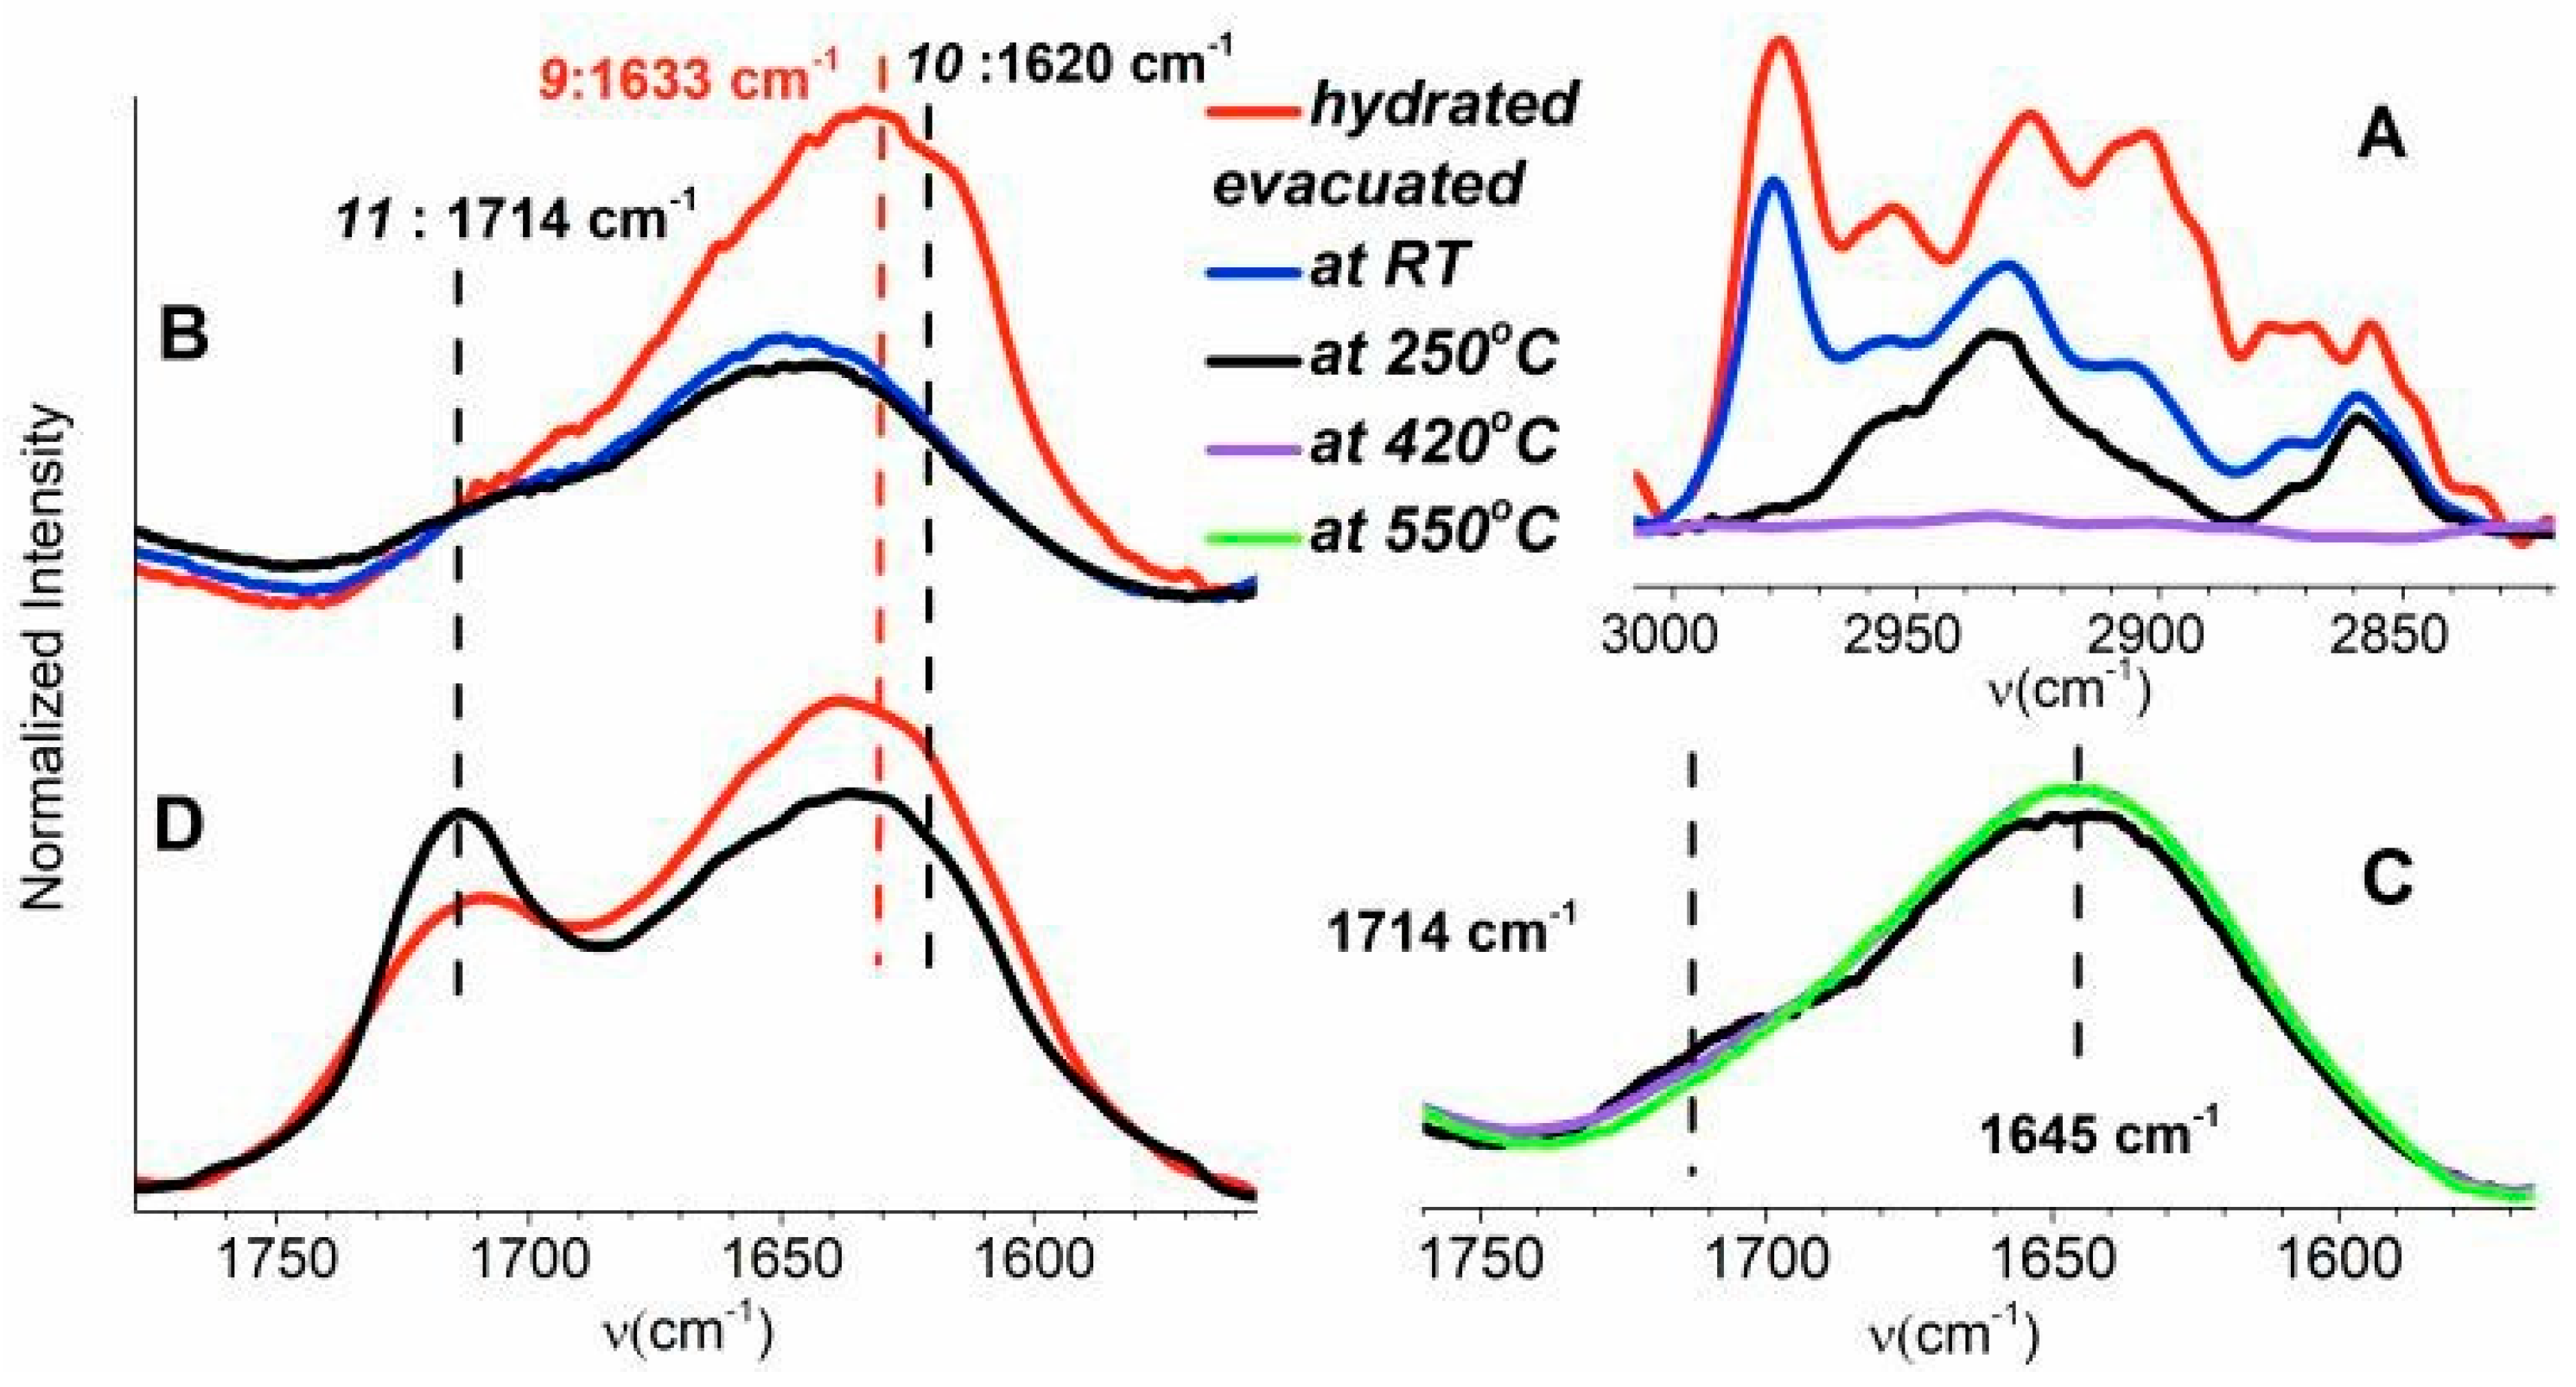
The band intensity in a region of C–H stretching vibrations (~3000–2800 cm−1) of SC-500 decreases by evacuation at RT and further at 250 °C (Figure 3A). The bands completely disappeared after evacuation at 420 °C in this region. These observations indicate the presence of a mixture of various, mostly saturated, carbonaceous species physisorbed on the outer surface of SC-500 and in its shallow subsurface region.
A comparison of the skeletal vibrations (~2120–1560 cm−1) of SF-500 and SC-500 is depicted in Figure S5, SI. Figure 3B,D compare the band of skeletal vibration of these samples in the range between ~1770 and 1550 cm−1). Band 9 of SC-500 at 1633 cm−1, which overlaps with the band of the skeletal overtone vibration at 1645 cm−1, almost disappeared due to evacuation at RT. Further evacuation of sample SC-500 did not substantially affect the intensity of band 9, and only minor effects were observed. Band 9 was assigned to C atoms coordinated by sp2 hybrid bonds [54]. Most of the unsaturated hydrocarbons therefore desorb from sample SC-500 already at RT. A decrease in band 9 was also observed for sample SF-500 (Figure 3D) at 1633 cm−1 after evacuation at 250 °C. Band 10 at 1620 cm−1 characterized the water bending mode from water adsorbed on silicalite [60]. This band (Figure 3B) is exclusively observed in the spectrum of the hydrated sample. The spectra recorded after evacuation at RT, 250, 420, and 550 °C are free from adsorbed water.
Band 11 at 1714 cm−1, observable in samples SF-500 and SC-500, characterized the C=O vibrations originating from an aromatic ring. In the literature, this band is assigned to cyclohexanone [54,55,61]. The higher intensity of band 11, observed after treatment at 250 °C, indicates the cyclization of hydrocarbon products of template degradation at a higher temperature. Further evacuation of sample SC-500 at 420 °C slightly increased the intensity of band 11 and decreased the intensity of band 10 (Figure 3C). These effects can be explained as a limited aromatization of hydrocarbons in the pores of the zeolite. Complete elimination of the band at 1714 cm−1 proceeded at 550 °C (Figure 3C). The results obtained confirm a very low presence of aromatic species in the pores of calcined silicalite-1 crystals.
Most of the carbonaceous residues of SF-500 (SC-500) are localized on the outer surface as a mixture of aliphatic and aromatic species. There is only very limited evidence of aromatization of the carbonaceous phase in the voids of silicalite-1, which is readily explainable by the presence of limited Brønsted acid sites in its framework. The limited aromatization of cyclohexanone may be related to the presence of Fe sites in the silicalite-1 framework. We assume that the conversion of aliphatic carbonaceous residues to aromatic compounds proceeds dominantly on the outer surface of SF-500.
3.1.2. Surface Analysis of Carbonaceous Species
XPS experiments were carried out under ultrahigh vacuum (UHV) conditions (10−8 Pa), where there is significant desorption of species from the outer surface. As the information depth of XPS in zeolites is ~4–11 nm [62], this method is useful for direct characterization of the shallow subsurface region of SFs. The survey spectra (0–1000 eV) indicate that the samples consist solely of silicon (Si), carbon (C), oxygen (O) (Figures S6 and SI), and the SF-AS samples also contain nitrogen (N). The N 1s spectrum of sample SF-AS observed at Eb = 402.3 eV (Table 2, Figure 4A) is typical for entrapped TPA+ species. The estimated concentration of N in this sample corresponds to the stoichiometric concentration (Table 2). No N 1s spectrum was observed in sample SF-500, i.e., complete elimination of N-containing template species proceeds in this sample by heat treatment (Figure 4A).
The surface region of sample SF-AS is enriched by a carbonaceous phase. The overall concentration of template carbonaceous species estimated by XPS (C/Si = 0.79) exceeds its stoichiometric value (C/Si = 0.50, Table 2). Only a limited decrease in carbonaceous species was observed by XPS in SF-500 (Table 2). Therefore, a part of the carbonaceous phase remained in the outer surface of SF-500. This finding is in line with our previous results [25]. A non-negligible part of the carbonaceous template species remains in the surface region of silicalite-1 even after prolonged (24 h) calcination [25].
The C 1s spectrum was simulated to identify various carbonaceous species in the surface region of the samples. A minimal number of lines with a pseudo-Voight profile were used in the simulation (three lines were used for SF-AS and four lines for SF-500, Figure 4B,C). The spectrum of SF-AS was fitted by the C 1s2 line at Eb = 284.7 eV with full width at half maximum (FWHM) equal to 2.0 eV, and was fitted by two other high-energy lines (C 1s3 at Eb = 286.5 eV (FWHM = 1.8 eV) and very low intensive C 1s4 at Eb = 288.8 eV (FWHM = 1.7 eV), Table 2). The C 1s2 line is assigned to C–C (C–H) bonding (i.e., to the C atom coordinated by sp3 hybrid bonds). The C 1s3 and C 1s4 lines belong to oxidized C species. The appearance of new low energy C 1s1 in the photoelectron spectrum was induced by calcination. The Eb and FWHM values of the remaining lines estimated by this simulation were (within experimental error of ±0.2 eV) identical as in SF-AS (Figure 4B,C and Table 2). The estimated value of Eb (284.1 eV) of the C 1s1 line indicates the presence of C=C coordination [63,64]. The C 1s spectrum of SF-500 is dominated by the C 1s2 line of C–C bonding. The XPS analysis thus indicates that sample SF-500 contains predominantly saturated carbonaceous residues (67%). However, there is also a non-negligible unsaturated carbonaceous species (23%). They can be detected in the shallow subsurface region by XPS even under UHV conditions (Table 2). Unsaturated species are summarized in Table 1 according the results: anthracene, fluorene and naphthalene, i.e., species which can accommodate silicalite-1 pores with pore mouth openings ~0.5 nm. The remaining PAH species observed by MS cannot be localized in the pores of silicalite for sterical reasons, and they desorb from the outer SF-500 surface under UHV. The C 1s3 and C 1s4 lines of SF-500 assigned to oxidized C species almost completely disappear after calcination.
Summarizing the results obtained by FTIR, XPS, and GC–MS analyses, we can conclude that most of the SDA is eliminated from SF-500 (SC-500) by calcination. The carbonaceous residues remaining in SF-500 are localized on its outer surface and in a shallow subsurface region as a mixture of aliphatic and aromatic species. PAH species (naphthalene, anthracene, pyrene, fluoranthene, and phenanthrene) with various levels of volatility were formed in micromole concentrations. Thermal aromatization is suppressed in the pores of SF-500, and proceeds mainly on the outer surface of SF-500. However, some of the PAHs remained on SF even after evacuation.
3.2. Singlet Oxygen
Irradiation of PAHs by UV radiation in solution leads to the formation of antibacterial and cytotoxic singlet oxygen O2(1Δg) with a high quantum yield ΦΔ (Table 1) [52]. These results initiated an investigation of the production of O2(1Δg) by SF with incorporated carbonaceous residues, using measurements of its characteristic luminescence in the near-infrared region (1270 nm). While chemical probes react with O2(1Δg), leading to changes in a measurable physical property (absorption, luminescence, or spin signal), this method is not complicated by parasitic chemical reactions [65,66] that have to be evaluated carefully for individual systems. The sensitivity of the luminescence method is limited, due to the small quantum yield of luminescence [67,68].
We tried to detect O2(1Δg) after pulsed irradiation of SF-500 by UV light in an air and oxygen atmosphere. The pure O2(1Δg) luminescence was calculated as the difference between the luminescence signal at 1270 nm in an air/oxygen atmosphere and in a vacuum, where O2(1Δg) cannot be formed. We were not able to separate the luminescence of O2(1Δg) from the strong background luminescence and scattering due to the low signal-to-noise ratio. Although no O2(1Δg) luminescence from SF-500 in an air/oxygen atmosphere was directly detected, it can be expected that O2(1Δg) was formed in a lower concentration with fast decay kinetics, due to the interaction between individual PAH molecules and quenching of the excited states with surface silanol groups of SF. In addition, aggregation and other parasitic photochemical processes when there is a high surface concentration of photosensitizer can significantly reduce the formation of O2(1Δg) [30,31]. Note that O2(1Δg) reacts with the PAH photosensitizer itself. Binding of O2(1Δg) to an aromatic system leads to a loss of conjugation and the formation of endoperoxides [69].
For comparison, the production of O2(1Δg) by PAH in SF, if any, was more than one order of magnitude lower than for films and materials with previously measured photosensitizers that exhibited strong antibacterial and antibiofouling properties [30,70,71]. In this respect, carbonaceous residues on SF surfaces do not appear to be suitable for efficient antibacterial treatment and for sterilization of SF when applied for coating metallic prosthetic materials. We then measured the luminescence of SF-500 immersed in solvents with a long O2(1Δg), τΔ, lifetime, which have been reported in the literature [52]. We found weak and long-lived luminescence at 1270 nm in air-saturated chloroform, which was assigned to the O2(1Δg) → O2(3Σg−) transition (Figure 5a). It disappeared after saturation by an inert gas (Figure 5e), and it can easily be separated from shorter background luminescence. The luminescence lifetime (~170 μs) corresponded with τΔ ~170 μs of photogenerated O2(1Δg) in chloroform, using standard anthracene as a photosensitizer (Figure 5d), with a high quantum yield of singlet oxygen formation in organic solvents (ΦΔ > 0.5, Table 1) [52].
The amplitude of the O2(1Δg) luminescence from SF-500 was slightly increased with time after the addition of chloroform. This observation led to experiments with pure extracts of SC-500 with a surface several times bigger than for SF. As expected, the amplitude of O2(1Δg) luminescence (Figure 5b) was a few times higher than the amplitude of O2(1Δg) luminescence for zeolite films in chloroform, and it was approximately one order of magnitude lower than the amplitude of O2(1Δg) luminescence for the standard anthracene photosensitizer (Figure 5d) with the same lifetime of singlet oxygen controlled by the solvent. The addition of methanol accelerated the decay of O2(1Δg) (Figure 5c), which corresponds with the literature data (τΔ~10 μs for methanol) [52], in comparison with τΔ~170 μs for chloroform. These results clearly show that PAHs were released into the solvents, where they can sensitize the production of O2(1Δg). The UV–Vis spectrum of the extract of SC-500 with a shoulder in the visible part (Figure 5B) indicates that the formation of O2(1Δg) can also be photosensitized effectively by daylight. In addition, it shows that carbonaceous species on the surface of SC-500 may consist of PAHs with more than three conjugated aromatic units with an extended window for irradiation up to the blue part of the visible spectrum (Table 1).
3.3. The DNA Damage Response
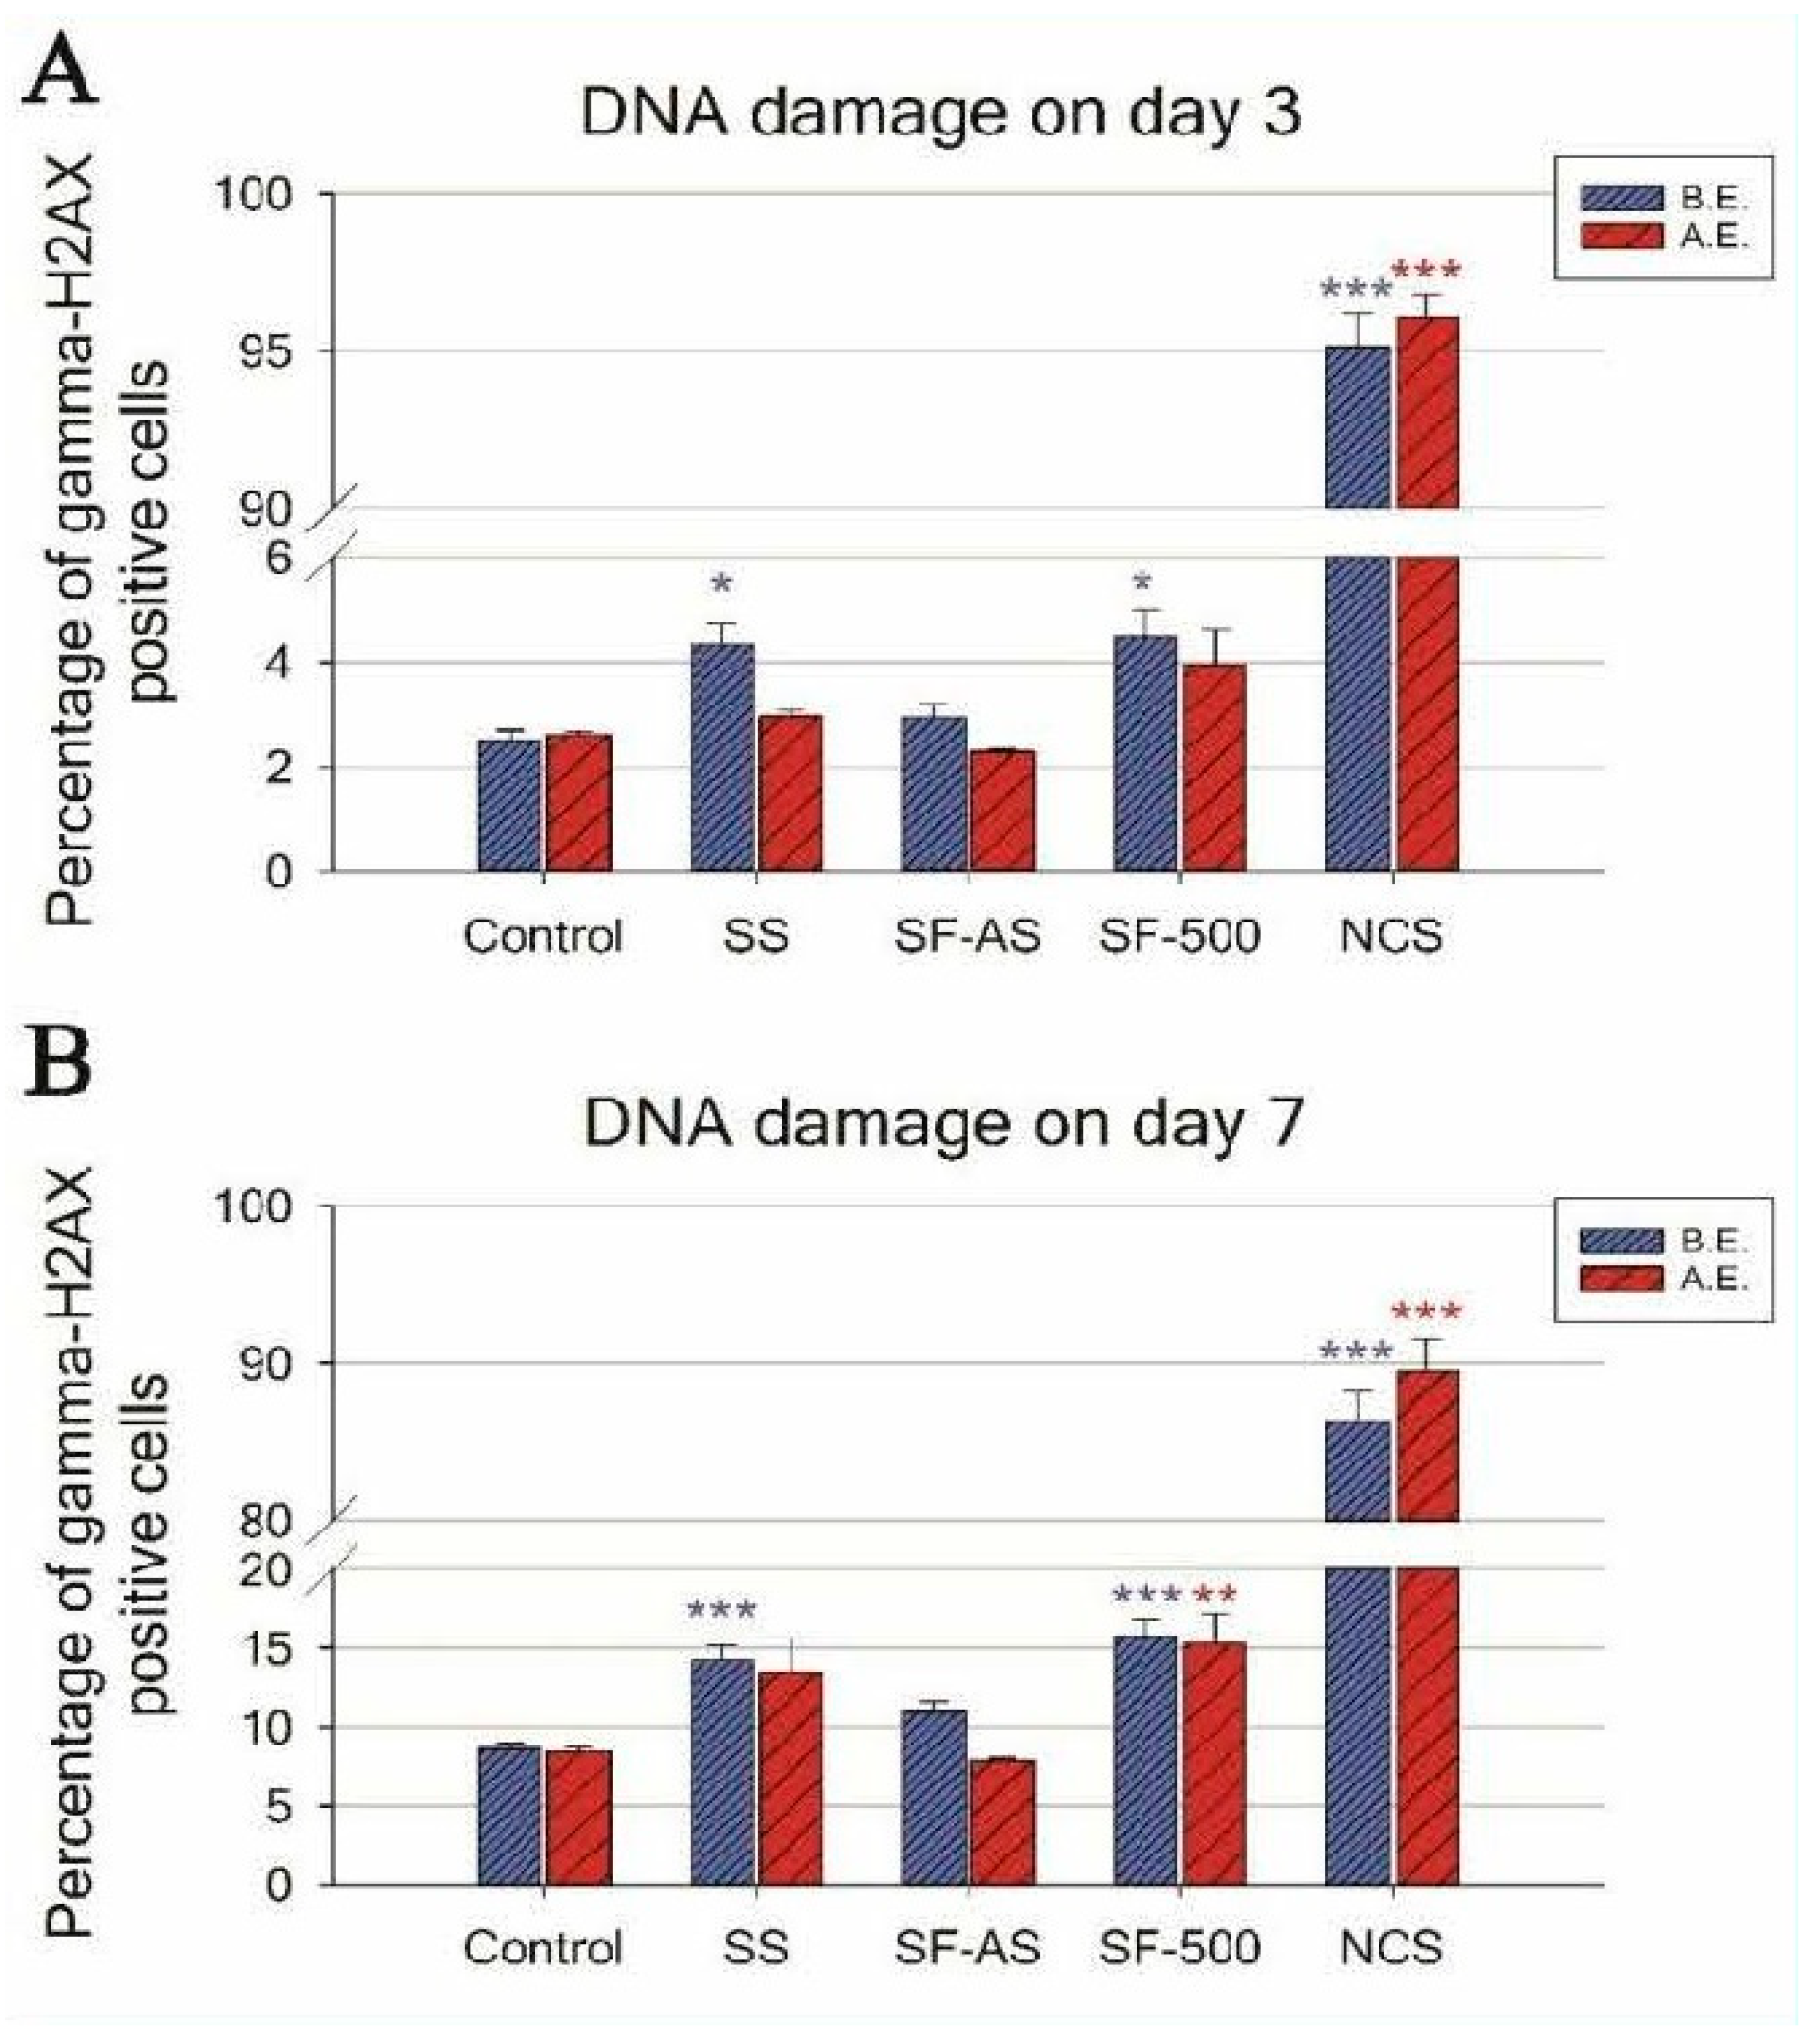
The DNA damage response (DDR) was evaluated by flow cytometry, using phosphorylated histone gamma-H2AX, a marker of DNA double-strand breaks. Predictably, during 7-day cultivation of osteoblast-like U-2 OS cells, SF-AS samples did not cause an increase in DNA damage to cells before or after evacuation (Figure 6).
An evaluation of the DDR in cells cultured on SF-500 with a higher concentration of PAH molecules present on the surface (i.e., before evacuation) revealed increased phosphorylation of histone H2AX. The level of DNA damage was almost 2 times higher than the level in cells grown on the control materials (a polystyrene culture dish or microscopic glass coverslips) for both monitored time intervals—days 3 and 7 (Figure 6, blue columns).
The evacuation of SF-500 did not fully remove the negative effects on the cells, as residual PAHs remained on the SF-500 surface (Table 1, Figure 4C). Although the increase in DDR on day 3 was not proven to be significant (SF-500 did not differ statistically from SF-AS or from the control SS and GS), the longer 7-day cultivation of cells on evacuated SF-500 promoted significantly higher phosphorylation of histone H2AX (Figure 6B, red columns). These results are in accordance with our previously published study, where SF-AS samples (as SF(RT)) supported the adhesion and growth of osteoblast-like Saos-2 cells, while cells cultured on evacuated SF-500 had lower cell densities with a poorly developed cytoskeleton [3].
Interestingly, a similar increase in DNA damage was observed in cells cultured on the reference stainless steel without silicalite-1 films (Figure 6, blue columns). Although stainless steel is one of the most widely-used alloys in orthopedic surgery, there is much discussion in the literature about the potential toxicity of this alloy. Several studies have reported an increasing release of metallic ions (e.g., nickel and chromium) from stainless steel over time [72,73,74]. A report comparing several orthopedic alloys showed the highest ion release from stainless steel. Moreover, the viability of human fibroblasts cultured in media with the released metals (obtained from SS submersion for 30 days) dropped rapidly to 4%, while DNA damage increased 7-fold [75]. However, our results did not show increased DDR in cells cultured on SS coated by SF-AS, which means that SF-AS coating improved the biocompatibility of stainless steel. An increase in DNA damage was found only in silicalite films that undergo calcination (SF-500). As has been mentioned, the process of calcination creates PAH molecules on SF.
The cytotoxicity and the genotoxicity of various PAH molecules are often discussed. Since the effect of PAH molecules described in the literature depends on the composition, concentration and exposure time of the PAH, and also on the cell type or organism that is used, contrasting results can be found. The most abundant PAH molecules found on our samples after evacuation were naphthalene, phenanthrene, and anthracene (Table 1).
Older studies performed on macrophages J774A.1 described increased hydroxyl radical production with increased lipid peroxidation, DNA fragmentation, and decreased viability of cells incubated for 24 h at concentrations of naphthalene greater than 200 μM [76,77]. Another report revealed a cell-specific effect of naphthalene on the viability of promyelocytic leukemia HL-60 cells and hepatocellular carcinoma Hep G2 cells. The IC20 values (the inhibitory concentration providing 20% of inhibition) were 150 μM of naphthalene after three hours of exposure in HL-60 cells and 1.7 mM after 48 h of exposure in Hep G2 cells [78]. However, another publication showed much lower IC20 values of naphthalene (approximately 500 μM) for Hep G2 cells after 24 hours of exposure [79]. Moreover, 10 μM of naphthalene was found to induce cell death of human T47D breast cancer cells even after a short exposure time of 1.5 h [80].
Putting these published findings together, we can see that concentrations from a few μM to thousands of μM have been reported to induce cell death in various cell types. However, the lower cell viability caused by an increased rate of cell death is the last stage of the cellular response to irreparable damage, often caused by increased oxidative stress, manifested by the generation of reactive oxygen species (ROS) and resulting in DNA damage to the cells. Therefore, the concentration of naphthalene that is able to induce reparable DNA damage could be much lower. Kapuci et al. [81] reported that a concentration of 10 μM of naphthalene or its metabolites induced increased DNA fragmentation of human lymphocytes without affecting the viability of the cells. Unfortunately, there was no investigation of the lower concentration in this study. The same concentration of other naphthalene metabolites was able to increase ROS generation and the cell death rate in human T47D breast cancer cells after 1.5 h of exposure [80]. Although the concentration of naphthalene detected on our SC-500 after evacuation was much lower (approximately 1.1 μM), the exposure time was much longer (from 3 to 7 days), so an accumulation of DNA damage can be expected over time. Moreover, a recent study confirmed a cell-specific effect of naphthalene, phenanthrene and anthracene, where even very low concentrations (0.31 μM, 0.034 μM and 0.056 μM, respectively) induced a proapoptotic signal (measured by the protein level of Bax and caspase-3) in BeWo placental cells, but not in JEG3 placental cells [82]. This very high concentration range of PAHs that are able to induce DNA damage could explain our result, which indicated a similar level of DNA damage in cells on a calcined film before and after evacuation, i.e., on samples differing in PAH concentration by several times or by an order of magnitude.
Other PAH molecules found on SC-500 after evacuation were 0.3 μM of phenanthrene and anthracene. These concentrations are almost 10 times higher than the concentrations reported in Drwal’s study mentioned above [82]. Again, different concentrations for various cell types have been reported to induce cytotoxicity. Jacob et al. described the maximum tolerated concentration in the V79 cell line with 30 μM of phenanthrene [79,83]. However, a study evaluating the cytotoxicity of phenanthrene metabolites in placental PEG-3 cells showed that concentrations above 0.1 µM were able to reduce cell viability [80,84]. Cytotoxic and genotoxic effects of phenanthrene and anthracene have been widely investigated in non-mammalian aquatic animals, where concentrations of approximately 0.56 μM cause oxidative stress, lipid peroxidation, nuclear abnormalities, and decreased viability in hemocytes of mussels [81,82,85,86]. A recent publication showed that even a concentration as low as 0.25 nM of phenanthrene was able to induce DNA breaks and lipid peroxidation in erythrocytes of sea bass after 14 days of exposure [87].
In summary, the DNA damage results demonstrate genotoxicity of SF-500 but not of SF-AS. The genotoxicity of high-temperature calcined-SF can therefore be explained by the presence of toxic PAH molecules. However, due to the low formation and the rapid decay of singlet oxygen created by UV irradiation, it is not probable that singlet oxygen participated in the DNA damage observed in our study. In addition, the samples used for DNA damage analysis were not irradiated by UV, and the whole process of cell cultivation was conducted in the dark and without the light exposure that is needed for singlet oxygen generation. In addition, the formation of intracellular ROS, estimated with the use of a DCFDA kit (2′,7′ –dichlorofluorescin diacetate; Abcam, Cambridge, UK), was not higher in the cells on silicalite-1 films containing PAHs than on the control microscopic glass coverslips (data not shown), and therefore cannot be responsible for the observed DNA damage. Therefore, the DNA damage observed in our study could be attributed to direct binding of PAH molecules or their metabolites to DNA and the creation of double-strand breaks in DNA, as is suggested by the presence of phosphorylated histone gamma-H2AX. However, further investigations are needed in order to prove the exact mechanism leading to DNA breaks.
4. Conclusions
High temperature (500 °C) calcination of silicalite-1 films liberated its microporous structure, which is potentially prospective in its applicability as an anticorrosive coating of implant metallic material. Simultaneously carbonaceous residues in silicalite-1 films after calcination to 500 °C localized on their outer surface and in a shallow subsurface region as a mixture of aliphatic and aromatic species were detected. Polyaromatic hydrocarbons (naphthalene, anthracene, pyrene, fluoranthene, and phenanthrene) were created in micromole concentrations. Some polyaromatic hydrocarbons (phenanthrene, anthracene, and naphthalene) were entrapped in the micropores of silicalite-1 and thus remained in a shallow subsurface region of the film even after evacuation under high vacuum conditions. Others, including particularly pyrene, fluoranthene, and fluorene, adsorbed on the outer surface of silicalite film, were found to be sufficiently volatile to be released into the environment, where they can sensitize the production of O2(1Δg) after they have been irradiated by light. However, the estimated concentration of volatile PAHs is too low to be applicable for sterilization purposes. The production of O2(1Δg) directly on the surfaces, if any, is hindered by interactions between individual PAH molecules, and/or by quenching of O2(1Δg) by silanol groups. The evaluation of potential DNA damage by silicalite-1 films revealed increased induction of double-strand breaks in osteoblast-like cells cultured on SF-500, but not on SF-AS. The evacuation did not fully diminish the genotoxic effect of SF-500 on cells, due to the presence of residual PAHs species on the surface of the sample. Further investigation of calcined nontoxic anticorrosive SF coatings of metallic implant materials is required prior their potential use in preclinical trials, consisting in the implantation of SF-coated prosthetic materials into bones of laboratory animals.
Supplementary Materials
The following are available online at https://www.mdpi.com/1996-1944/12/4/567/s1, Figure S1: Chromatograms obtained by DTD-GC-MS analysis of SC-500: naphthalene (A), phenanthrene and anthracene (B), fluorene (C), fluoranthene and pyrene (D). The top in every panel: sample before evacuation, middle: sample evacuated at RT, bottom: standard (Supelco), Figure S2: Mass spectrum of hydrocarbon fractions of the chloroform extract of SC-500, Figure S3: Chromatogram of hydrocarbon fractions of the chloroform extract of sample SC-500 (panel A) compared with the standard mixture of n-alkanes (panel B), Figure S4: FTIR spectra of the sample SC-500 (A) and SF-AS, SF-500 (B), Figure S5: Overtone region of infrared absorption spectra of SC-500 (top) and SF-500 (bottom). The spectra of hydrated and evacuated samples at RT and 250 °C are distinguished, Figure S6: Survey photoelectron spectrum of the sample SF-500 composed solely from Si, O, C and in the case of non-calcinated sample also from N.
Author Contributions
I.J., I.K., P.K., and L.B. conceived and designed the experiments; I.J., I.K., P.K., E.T., M.B., and P.S. performed the experiments; I.J., I.K., P.K., and E.T. analyzed the data; I.J. and I.K. wrote the paper.
Funding
This work was supported by the Czech Science Foundation (grant No. GA16-02681S). Measurements of FTIR spectra in reflection mode were supported by Pro-NanoEnviCz (Project No. CZ.02.1.01/0.0/0.0/16_013/0001821) and funded by the Ministry of Education, Youth and Sports of the Czech Republic.
Acknowledgments
The authors thank Robin Healy (Czech Technical University, Prague) for his language revision of the manuscript.
Conflicts of Interest
The authors declare no conflicts of interest.
Abbreviations
SF, silicalite-1 films; SF-AS, SF as synthesized; SF-500, SF heated to 500 °C; SC, silicalite-1 crystals; SC-500, SC heated to 500 °C; PAH, polycyclic aromatic hydrocarbons; SDA, structure directing agent; FWHM, full widths at half maximum; ROS, reactive oxygen species.
References
- Raphel, J.; Holodniy, M.; Goodman, S.B.; Heilshorn, S.C. Multifunctional coatings to simultaneously promote osseointegration and prevent infection of orthopaedic implants. Biomaterials 2016, 84, 301–314. [Google Scholar] [CrossRef] [PubMed] [Green Version]
- Costerton, J.W.; Stewart, P.S.; Greenberg, E.P. Bacterial Biofilms: A Common Cause of Persistent Infections. Science 1999, 284, 1318–1322. [Google Scholar] [CrossRef] [PubMed]
- Jirka, I.; Vandrovcová, M.; Plšek, J.; Bouša, M.; Brabec, L.; Dragounová, H.; Bačáková, L. Interaction of human osteoblast-like Saos-2 cells with stainless steel coated by silicalite−1 films. Mater. Sci. Eng. C 2017, 76, 775–781. [Google Scholar] [CrossRef] [PubMed]
- Bacakova, L.; Vandrovcova, M.; Kopova, I.; Jirka, I. Applications of zeolites in biotechnology and medicine—A review. Biomater. Sci. 2018, 6, 974–989. [Google Scholar] [CrossRef] [PubMed]
- Bačáková, L.; Starý, V.; Kofroňová, O.; Lisá, V. Polishing and coating carbon fiber-reinforced carbon composites with a carbon-titanium layer enhances adhesion and growth of osteoblast-like MG63 cells and vascular smooth muscle cells in vitro. J. Biomed. Mater. Res. 2001, 54, 567–578. [Google Scholar] [CrossRef]
- Jirka, I.; Vandrovcová, M.; Frank, O.; Tolde, Z.; Plšek, J.; Luxbacher, T.; Bačáková, L.; Starý, V. On the role of Nb-related sites of an oxidized β-TiNb alloy surface in its interaction with osteoblast-like MG-63 cells. Mater. Sci. Eng. C 2013, 33, 1636–1645. [Google Scholar] [CrossRef] [PubMed]
- Havlikova, J.; Strasky, J.; Vandrovcova, M.; Harcuba, P.; Mhaede, M.; Janecek, M.; Bačáková, L. Innovative surface modification of Ti–6Al–4V alloy with a positive effect on osteoblast proliferation and fatigue performance. Mater. Sci. Eng. C 2014, 39, 371–379. [Google Scholar] [CrossRef] [PubMed]
- Vandrovcová, M.; Jirka, I.; Novotna, K.; Lisa, V.; Frank, O.; Kolska, Z.; Stary, V.; Bačáková, L. Interaction of Human Osteoblast-Like Saos-2 and MG-63 Cells with Thermally Oxidized Surfaces of a Titanium-Niobium Alloy. PLOS ONE 2014, 9, e100475. [Google Scholar] [CrossRef]
- Rihova, Z.; Stary, V.; Bačáková, L. A study of the structure and surface properties of nanostructured biocompatible coatings on Ti alloys. Vacuum 2012, 86, 630–633. [Google Scholar] [CrossRef]
- Chow, G.; Bedi, R.S.; Yan, Y.; Wang, J. Zeolite as a wear-resistant coating. Micropor. Mesopor. Mater. 2012, 151, 346–351. [Google Scholar] [CrossRef]
- Bedi, R.S.; Zanello, L.P.; Yan, Y. Osteoconductive and Osteoinductive Properties of Zeolite MFI Coatings on Titanium Alloys. Adv. Funct. Mater. 2009, 19, 3856–3861. [Google Scholar] [CrossRef]
- Bedi, R.S.; Beving, D.E.; Zanello, L.P.; Yan, Y. Biocompatibility of corrosion- resistant zeolite coatings for titanium alloy biomedical implants. Acta Biomater. 2009, 5, 3265–3271. [Google Scholar] [CrossRef] [PubMed]
- Jirka, I.; Vandrovcová, M.; Plšek, J.; Bouša, M.; Bačáková, L. Interaction of silicalite- 1 film with human osteoblast-like Saos-2 cells: The role of micro-morphology. Mater. Lett. 2017, 190, 229–231. [Google Scholar] [CrossRef]
- Li, Y.; Jiao, Y.; Li, X.; Guo, Z. Improving the osteointegration of Ti6Al4V by zeolite MFI coating. Biochem. Biophys. Res. Commun. 2015, 460, 151–156. [Google Scholar] [CrossRef] [PubMed]
- Guo, Y.P.; Long, T.; Song, Z.F.; Zhu, Z.A. Hydrothermal fabrication of ZSM-5 zeolites: Biocompatibility, drug delivery property, and bactericidal property. J. Biomed. Mater. Res. B Appl. Biomater. 2014, 102, 583–591. [Google Scholar] [CrossRef] [PubMed]
- Flanigen, E.M.; Bennett, J.M.; Grose, R.W.; Cohen, J.P.; Patton, R.L.; Kirchner, R.M.; Smith, J.V. Silicalite, a new hydrophobic crystalline silica molecular sieve. Nature 1978, 271, 512–516. [Google Scholar] [CrossRef]
- Caro, J.; Noack, M. Zeolite membranes—Recent developments and progress. Micropor. Mesopor. Mater. 2008, 115, 215–233. [Google Scholar] [CrossRef]
- Wang, Z.; Yan, Y. Controlling Crystal Orientation in Zeolite MFI Thin Films by Direct In Situ Crystallization. Chem. Mater. 2001, 13, 1101–1107. [Google Scholar] [CrossRef]
- Wang, Z.; Yan, Y. Oriented zeolite MFI monolayer films on metal substrates by in situ crystallization. Micropor. Mesopor. Mater. 2001, 48, 229–238. [Google Scholar] [CrossRef]
- Cheng, X.; Wang, Z.; Yan, Y. Corrosion-Resistant Zeolite Coatings by In Situ Crystallization. Electrochem. Solid-State Lett. 2001, 4, B23–B26. [Google Scholar] [CrossRef]
- Valtchev, V.; Majano, G.; Mintova, S.; Perez-Ramirez, J. Tailored crystalline microporous materials by post-synthesis modification. Chem. Soc. Rev. 2013, 42, 263–290. [Google Scholar] [CrossRef] [PubMed]
- Soulard, M.; Bilger, S.; Kessler, H.; Guth, J.L. Thermoanalytical characterization of MFI-type zeolites prepared either in the presence of OH− or of F− ions. Zeolites 1987, 7, 463–470. [Google Scholar] [CrossRef]
- Soulard, M.; Bilger, S.; Kessler, H.; Guth, J.L. DTA-GC-MS coupling for the characterization of the volatile products resulting from the decomposition of organic templates occluded in zeolites. Thermochim. Acta 1992, 204, 167–178. [Google Scholar] [CrossRef]
- Karwacki, L.; Weckhuysen, B.M. New insight in the template decomposition process of large zeolite ZSM-5 crystals: An in situ UV-Vis/fluorescence micro-spectroscopy study. Phys. Chem. Chem. Phys. 2011, 13, 3681–3685. [Google Scholar] [CrossRef] [PubMed]
- Jirka, I.; Sazama, P.; Zikanova, A.; Hrabanek, P.; Kocirik, M. Low-temperature thermal removal of template from high silica ZSM-5 Catalytic effect of zeolitic framework. Microporous Mesoporous Mater. 2011, 137, 8–17. [Google Scholar] [CrossRef]
- Mores, D.; Stavitski, E.; Kox, M.H.F.; Kornatowski, J.; Olsbye, U.; Weckhuysen, B.M. Space- and Time-Resolved In-situ Spectroscopy on the Coke Formation in Molecular Sieves: Methanol-to-Olefin Conversion over H-ZSM-5 and H-SAPO-34. Chem. Eur. J. 2008, 14, 11320–11327. [Google Scholar] [CrossRef] [PubMed] [Green Version]
- Parker, L.M.; Bibby, D.M.; Patterson, J.E. Thermal decomposition of ZSM—5 and silicalite precursors. Zeolites 1984, 4, 168–174. [Google Scholar] [CrossRef]
- Maisch, T.; Baier, J.; Franz, B.; Maier, M.; Landthaler, M.; Szeimies, R.M.; Baumler, W. The role of singlet oxygen and oxygen concentration in photodynamic inactivation of bacteria. Proc. Natl. Acad. Sci. USA 2007, 104, 7223–7228. [Google Scholar] [CrossRef] [PubMed] [Green Version]
- Hamblin, M.R. Antimicrobial photodynamic inactivation: A bright new technique to kill resistant microbes. Curr. Opin. Microbiol. 2016, 33, 67–73. [Google Scholar] [CrossRef]
- Mosinger, J.; Lang, K.; Kubát, P. Photoactivatable Nanostructured Surfaces for Biomedical Applications. Top. Curr. Chem. 2016, 370, 135–168. [Google Scholar]
- DeRosa, M.C.; Crutchley, R.J. Photosensitized singlet oxygen and its applications. Coord. Chem. Rev. 2002, 233–234, 351–371. [Google Scholar] [CrossRef]
- Ogilby, P.R. Singlet oxygen: There is indeed something new under the sun. Chem. Soc. Rev. 2010, 39, 3181–3209. [Google Scholar] [CrossRef] [PubMed]
- Guo, Y.; Wu, K.; Huo, X.; Xu, X. Sources, distribution, and toxicity of polycyclic aromatic hydrocarbons. J. Environ. Health 2011, 73, 22–25. [Google Scholar] [PubMed]
- Guengerich, F.P. Metabolism of chemical carcinogens. Carcinogenesis 2000, 21, 345–351. [Google Scholar] [CrossRef] [Green Version]
- Quinn, A.M.; Harvey, R.G.; Penning, T.M. Oxidation of PAH trans-dihydrodiols by human aldo-keto reductase AKR1B10. Chem. Res. Toxicol. 2008, 21, 2207–2215. [Google Scholar] [CrossRef]
- Ludewig, G.; Dogra, S.; Glatt, H. Genotoxicity of 1,4-benzoquinone and 1,4- naphthoquinone in relation to effects on glutathione and NAD(P)H levels in V79 cells. Environ. Health Perspect. 1989, 82, 223–228. [Google Scholar] [CrossRef] [PubMed]
- Wilson, A.S.; Davis, C.D.; Williams, D.P.; Buckpitt, A.R.; Pirmohamed, M.; Park, B.K. Characterisation of the toxic metabolite(s) of naphthalene. Toxicology 1996, 114, 233–242. [Google Scholar] [CrossRef]
- Di Monte, D.; Bellomo, G.; Thor, H.; Nicotera, P.; Orrenius, S. Menadione-induced cytotoxicity is associated with protein thiol oxidation and alteration in intracellular Ca2+ homeostasis. Arch. Biochem. Biophys. 1984, 235, 343–350. [Google Scholar] [CrossRef]
- Saeed, M.; Higginbotham, S.; Rogan, E.; Cavalieri, E. Formation of depurinating N3adenine and N7guanine adducts after reaction of 1,2-naphthoquinone or enzyme-activated 1,2-dihydroxynaphthalene with DNA: Implications for the mechanism of tumor initiation by naphthalene. Chem. Biol. Interact. 2007, 165, 175–188. [Google Scholar] [CrossRef]
- Saeed, M.; Higginbotham, S.; Gaikwad, N.; Chakravarti, D.; Rogan, E.; Cavalieri, E. Depurinating naphthalene–DNA adducts in mouse skin related to cancer initiation. Free Radic. Biol. Med. 2009, 47, 1075–1081. [Google Scholar] [CrossRef] [Green Version]
- McCoull, K.D.; Rindgen, D.; Blair, I.A.; Penning, T.M. Synthesis and characterization of polycyclic aromatic hydrocarbon o-quinone depurinating N7-guanine adducts. Chem. Res. Toxicol. 1999, 12, 237–246. [Google Scholar] [CrossRef] [PubMed]
- Hsu, G.W.; Huang, X.W.; Luneva, N.P.; Geacintov, N.E.; Beese, L.S. Structure of a high fidelity DNA polymerase bound to a benzo [a] pyrene adduct that blocks replication. J. Biol. Chem. 2005, 280, 3764–3770. [Google Scholar] [CrossRef] [PubMed]
- Zhou, G.D.; Richardson, M.; Fazili, I.S.; Wang, J.; Donnelly, K.C.; Wang, F.; Amendt, B.; Moorthy, B. Role of retinoic acid in the modulation of benzo(a)pyrene-DNA adducts in human hepatoma cells: Implications for cancer prevention. Toxicol. Appl. Pharmacol. 2010, 249, 224–230. [Google Scholar] [CrossRef] [PubMed] [Green Version]
- Mordukhovich, I.; Rossner, P., Jr.; Terry, M.B.; Santella, R.; Zhang, Y.J.; Hibshoosh, H.; Memeo, L.; Mansukhani, M.; Long, C.M.; Garbowski, G.; et al. Associations between polycyclic aromatic hydrocarbon-related exposures and p53 mutations in breast tumors. Environ. Health Perspect. 2010, 118, 511–518. [Google Scholar] [CrossRef] [PubMed]
- Yoon, J.H.; Lee, C.S.; Pfeifer, G.P. Simulated sunlight and benzo[a]pyrene diol epoxide induced mutagenesis in the human p53 gene evaluated by the yeast functional assay: Lack of correspondence to tumor mutation spectra. Carcinogenesis 2003, 24, 113–119. [Google Scholar] [CrossRef] [PubMed]
- Bartsch, H.; Tomatis, L. Comparison between carcinogenicity and mutagenicity based on chemicals evaluated in the IARC monographs. Environ. Health Perspect. 1983, 47, 305–317. [Google Scholar] [CrossRef] [Green Version]
- Scofield, J.H. Hartree-Slater subshell photoionization cross-sections at 1254 and 1487 eV. J. Electron. Spectrosc. Relat. Phenom. 1976, 8, 129–137. [Google Scholar] [CrossRef]
- Kwok, R.W.M. XPSPeak, Version 4.1. Hong Kong, 1999. Available online: http://www.phy.cuhk.edu.hk/surface/XPSPeak (accessed on 11 February 2019).
- NIST X-ray Photoelectron Spectroscopy (XPS) Database Version 4.1. Available online: http://srdata.nist.gov/xps/Default.aspx (accessed on 11 February 2019).
- Mosinger, J.; Lang, K.; Plístil, L.; Jesenská, S.; Hostomský, J.; Zelinger, Z.; Kubát, P. Fluorescent polyurethane nanofabrics: A source of singlet oxygen and oxygen sensing. Langmuir 2010, 26, 10050–10056. [Google Scholar] [CrossRef]
- Goldfarb, J.L.; Suuberg, E.M. Vapor Pressures and Enthalpies of Sublimation of Ten Polycyclic Aromatic Hydrocarbons Determined via the Knudsen Effusion Method. J. Chem. Eng. Data 2008, 53, 670–676. [Google Scholar] [CrossRef]
- Wilkinson, F.; Helman, W.P.; Ross, A.B. Quantum yields for the photosensitized formation of the lowest electronically excited singlet-state of molecular oxygen in solution. J. Phys. Chem. Ref. Data 1993, 22, 113–262. [Google Scholar] [CrossRef]
- Tanaka, F.; Furuta, T.; Okamoto, M.; Hirayama, S. Inverse correlation between efficiency of singlet oxygen production and rate constant for oxygen quenching in the S1 state of anthracene derivatives. Phys. Chem. Chem. Phys. 2004, 6, 1219–1226. [Google Scholar] [CrossRef]
- Davydov, A. Molecular Spectroscopy of Oxide Catalyst Surfaces; John Wiley & Sons: Hoboken, NJ, USA, 2003. [Google Scholar]
- Bernauer, M.; Tabor, E.; Pashkova, V.; Kaucký, D.; Sobalík, Z.; Wichterlová, B.; Dedecek, J. Proton proximity–New key parameter controlling adsorption, desorption and activity in propene oligomerization over H-ZSM-5 zeolites. J. Catal. 2016, 344, 157–172. [Google Scholar] [CrossRef]
- Spoto, S.; Bordiga, S.; Ricchiardi, G.; Scarano, D.; Zecchina, A.; Borello, E. IR study of ethene and propene oligomerization on H-ZSM-5: Hydrogen-bonded precursor formation, initiation and propagation mechanisms and structure of the entrapped oligomers. J. Chem. Soc. Faraday Trans. 1994, 90, 2827–2835. [Google Scholar] [CrossRef]
- Geobaldo, F.; Spoto, G.; Bordiga, S.; Lamberti, C.; Zecchina, A. Propene oligomerization on H-mordenite: Hydrogen-bondinginteraction, chain initiation, propagation and hydrogen transferstudied by temperature-programmed FTIR and UV–VIS spectroscopies. J. Chem. Soc. Faraday Trans. 1997, 93, 1243–1249. [Google Scholar] [CrossRef]
- Bandiera, J.; Taarit, Y.B. Elementary reactions and thermodynamic effects in the conversion of propene over an acidic A1MFI. Appl. Catal. A 1995, 132, 157–167. [Google Scholar] [CrossRef]
- Borges, P.; Pinto, R.R.; Lemos, M.A.N.D.A.; Lemos, F.; Vedrine, J.C.; Derouane, E.G.; Ribeiro, F.R. Light olefin transformation over ZSM-5 zeolites: A kinetic model for olefin consumption. Appl. Catal. A 2007, 324, 20–29. [Google Scholar] [CrossRef]
- Farzaneh, A.; DeJaco, R.F.; Ohlin, L.; Holmgren, A.; Ilja Siepmann, J.; Grahn, M. Comparative study of the effect of defects on selective adsorption of butanol from butanol/Water Binary Vapor Mixtures in Silicalite−1 Films. Langmuir 2017, 33, 8420–8427. [Google Scholar] [CrossRef] [PubMed]
- Dijkmans, J.; Dusselier, M.; Janssens, W.; Trekels, M.; Vantomme, A.; Breynaert, E.; Kirschhock, C.; Sels, B.F. An Inner-/Outer-Sphere Stabilized Sn Active Site in β-Zeolite: Spectroscopic Evidence and Kinetic Consequences. ACS Catal. 2016, 6, 31–46. [Google Scholar] [CrossRef]
- Bare, S.R.; Knop-Gericke, A.; Teschner, D.; Hävacker, M.; Blume, R.; Rocha, T.; Schlögl, R.; Chan, A.S.Y.; Blackwell, N.; Charochak, M.E.; et al. Surface analysis of zeolites: An XPS, variable kinetic energy XPS, and low energy ion scattering study. Surface Sci. 2016, 648, 376–382. [Google Scholar] [CrossRef]
- Díaz, J.; Paolicelli, G.; Ferrer, S.; Comin, F. Separation of the sp3 and sp2 components in the C1s photoemission spectra of amorphous carbon films. Phys. Rev. B 1996, 54, 8064–8069. [Google Scholar] [CrossRef]
- Haerle, R.; Riedo, E.; Pasquarello, A.; Baldereschi, A. sp2/sp3 hybridization ratio in amorphous carbon from C1s core-level shifts: X-ray photoelectron spectroscopy and first- principles calculation. Phys. Rev. B 2001, 65, 045101. [Google Scholar] [CrossRef]
- Nardi, G.; Manet, I.; Monti, S.; Miranda, S.A.; Lhiaubet-Vallet, V. Scope and limitations of the TEMPO/EPR method for singlet oxygen detection: The misleading role of electron transfer. Free Radic. Biol. Med. 2014, 77, 64–70. [Google Scholar] [CrossRef]
- Ragas, X.; Jimenez-Banzo, A.; Sanchez-Garcia, D.; Batllori, X.; Nonell, S. Singlet oxygen photosensitisation by the fluorescent probe Singlet Oxygen Sensor Green. Chem. Commun. 2009, 2920–2922. [Google Scholar] [CrossRef] [PubMed]
- Horiuchi, N. Sensing: Singlet oxygen detection. Nat. Photon. 2013, 7, 343. [Google Scholar] [CrossRef]
- Bregnhøj, M.; Westberg, M.; Minaev, B.F.; Ogilby, P.R. Singlet Oxygen Photophysics in Liquid Solvents: Converging on a Unified Picture. Acc. Chem. Res. 2017, 50, 1920–1927. [Google Scholar] [CrossRef] [PubMed]
- Filatov, M.A.; Senge, M.O. Molecular devices based on reversible singlet oxygen binding optical and photomedical applications. Mol. Syst. Des. Eng. 2016, 1, 258–272. [Google Scholar] [CrossRef]
- Kovacova, M.; Markovic, Z.M.; Humpolicek, P.; Micusik, M.; Švajdlenkova, H.; Kleinova, A.; Danko, M.; Kubát, P.; Vajdak, J.; Capakova, Z.; et al. Carbon Quantum Dots Modified Polyurethane Nanocomposites as Effective Photocatalytic and Antibacterial Agents. ACS Biomater. Sci. Eng. 2018, 4, 3983–3993. [Google Scholar] [CrossRef]
- Hynek, J.; Zelenka, J.; Rathousky, J.; Kubát, P.; Ruml, T.; Demel, J.; Lang, K. Designing porphyrinic covalent organic frameworks for the photodynamic inactivation of bacteria. ACS Appl. Mater. Interfaces 2018, 10, 8527–8535. [Google Scholar] [CrossRef]
- Oh, K.T.; Kim, K.N. Ion release and cytotoxicity of stainless steel wires. Eur. J. Orthod. 2005, 27, 533–540. [Google Scholar] [CrossRef] [Green Version]
- Hwang, C.J.; Shin, J.S.; Cha, J.Y. Metal release from simulated fixed orthodontic appliances. Am. J. Orthod. Dentofacial Orthop. 2001, 120, 383–391. [Google Scholar] [CrossRef]
- Matos de Souza, R.; Macedo de Menezes, L. Nickel, chromium and iron levels in the saliva of patients with simulated fixed orthodontic appliances. Angle Orthod. 2008, 78, 345–350. [Google Scholar] [CrossRef]
- Ortiz, A.J.; Fernandez, E.; Vicente, A.; Calvo, J.L.; Ortiz, C. Metallic ions released from stainless steel, nickel-free, and titanium orthodontic alloys: Toxicity and DNA damage. Am. J. Orthod. Dentofacial Orthop. 2011, 140, e115–e122. [Google Scholar] [CrossRef] [PubMed]
- Bagchi, M.; Bagchi, D.; Balmoori, J.; Ye, X.; Stohs, S.J. Naphthalene-induced oxidative stress and DNA damage in cultured macrophage J774A.1 cells. Free Radic. Biol. Med. 1998, 25, 137–143. [Google Scholar] [CrossRef]
- Bagchi, M.; Balmoori, J.; Ye, X.; Bagchi, D.; Ray, S.D.; Stohs, S.J. Protective effect of melatonin on naphthalene-induced oxidative stress and DNA damage in cultured macrophage J774A.1 cells. Mol. Cell. Biochem. 2001, 221, 49–55. [Google Scholar] [CrossRef] [PubMed]
- Kim, Y.J.; Song, M.; Song, M.K.; Youk, D.Y.; Choi, H.S.; Sarma, S.N.; Ryu, J.C. Differential Gene Expression Induced by Naphthalene in Two Human Cell Line, HepG2 and HL-60. Mol. Cell. Toxicol. 2009, 5, 99–107. [Google Scholar] [CrossRef] [PubMed]
- Peng, C.; Muthusamy, S.; Xia, Q.; Lal, V.; Denison, M.S.; Ng, J.C. Micronucleus formation by single and mixed heavy metals/loids and PAH compounds in HepG2 cells. Mutagenesis 2015, 30, 593–602. [Google Scholar] [CrossRef] [PubMed] [Green Version]
- Lin, P.H.; Pan, W.C.; Kang, Y.W.; Chen, Y.L.; Lin, C.H.; Lee, M.C.; Chou, Y.H.; Nakamura, J. Effects of naphthalene quinonoids on the induction of oxidative DNA damage and cytotoxicity in calf thymus DNA and in human cultured cells. Chem. Res. Toxicol. 2005, 18, 1262–1270. [Google Scholar] [CrossRef]
- Kapuci, M.; Ulker, Z.; Gurkan, S.; Alpsoy, L. Determination of cytotoxic and genotoxic effects of naphthalene, 1-naphthol and 2-naphthol on human lymphocyte culture. Toxicol. Ind. Health 2014, 30, 82–89. [Google Scholar] [CrossRef]
- Drwal, E.; Rak, A.; Grochowalski, A.; Milewicz, T.; Gregoraszczuk, E.L. Cell-specific and dose-dependent effects of PAHs on proliferation, cell cycle, and apoptosis protein expression and hormone secretion by placental cell lines. Toxicol. Lett. 2017, 280, 10–19. [Google Scholar] [CrossRef]
- Jacob, J.; Raab, G.; Soballa, V.; Schmalix, W.A.; Grimmer, G.; Greim, H.; Doehmer, J.; Seidel, A. Cytochrome P450-mediated activation of phenanthrene in genetically engineered V79 Chinese hamster cells. Environ. Toxicol. Pharmacol. 1996, 1, 1–11. [Google Scholar] [CrossRef]
- Peters, Z.J.; Nykamp, J.A.; Passaperuma, K.; Carlson, J.C.; DeWitte-Orr, S.J.; Greenberg, B.M.; Bols, N.C. Effect of copper on the cytotoxicity of phenanthrene and 9,10- phenanthrenequinone to the human placental cell line, JEG-3. Reprod. Toxicol. 2007, 23, 513–520. [Google Scholar] [CrossRef] [PubMed]
- Grintzalis, K.; Georgiou, C.D.; Dailianis, S. Total thiol redox status as a potent biomarker of PAH-mediated effects on mussels. Mar. Environ. Res. 2012, 81, 26–34. [Google Scholar] [CrossRef] [PubMed]
- Gianapas, M.; Karnis, L.; Dailianis, S. Generation of free radicals in haemocytes of mussels after exposure to low molecular weight PAH components: Immune activation, oxidative and genotoxic effects. Comp. Biochem. Physiol. C-Toxicol. Pharmacol. 2012, 155, 182–189. [Google Scholar] [CrossRef] [PubMed]
- Martins, M.; Ferreira, A.M.; Costa, M.H.; Costa, P.M. Comparing the Genotoxicity of a Potentially Carcinogenic and a Noncarcinogenic PAH, Singly, and in Binary Combination, on Peripheral Blood Cells of the European Sea Bass. Environ. Toxicol. 2016, 31, 1307–1318. [Google Scholar] [CrossRef] [PubMed]
Figure 1.
SEM images of SF-500 (A) and SC-500 (B). The surface of the film is covered by crystals with dimensions a = 1.0 ± 0.1 μm, b = 0.5 ± 0.0 μm, and c = 1.4 ± 0.1 μm (panel A).
Figure 1.
SEM images of SF-500 (A) and SC-500 (B). The surface of the film is covered by crystals with dimensions a = 1.0 ± 0.1 μm, b = 0.5 ± 0.0 μm, and c = 1.4 ± 0.1 μm (panel A).

Figure 2.
FTIR spectra of sample SF-AS (A) and SF-500 (B).

Figure 3.
FTIR spectra of the samples with different treatments: C–H stretching vibrations of aliphatic hydrocarbons of SC-500 (panel A); the skeletal overtone region of SC-500 (panel B) and SF-500 (panel D); and expansion of lines 9 and 11 of SC-500 (panel C).
Figure 3.
FTIR spectra of the samples with different treatments: C–H stretching vibrations of aliphatic hydrocarbons of SC-500 (panel A); the skeletal overtone region of SC-500 (panel B) and SF-500 (panel D); and expansion of lines 9 and 11 of SC-500 (panel C).

Figure 4.
N 1s spectrum of the sample SF-AS (panel A). Comparison of the line shape of simulated C 1s spectra of the sample SF-AS (panel B) and SF-500 (panel C).
Figure 4.
N 1s spectrum of the sample SF-AS (panel A). Comparison of the line shape of simulated C 1s spectra of the sample SF-AS (panel B) and SF-500 (panel C).

Figure 5.
Panel A: Kinetics of O2(1Δg) luminescence after excitation by laser pulse (wavelength 308 nm and pulse width ~28 ns): SF on steel immersed in air-saturated chloroform (a); extract from SC-500 in air-saturated chloroform before (b) and after addition of methanol (c); standard anthracene in air-saturated chloroform (d); and extract from SC-500 in argon-saturated chloroform (e, no generation of singlet oxygen) for comparison. Red lines are single exponential fits into experimental data. Individual traces are offset. Panel B: UV–Vis spectrum of the extract from SC-500 in chloroform, arrow designates excitation wavelength.

Figure 6.
Flow cytometry of the marker of DNA double-strand breaks: gamma-H2AX in human osteoblast-like U-2 OS cells cultured on SF-AS and SF-500 before and after evacuation. The graphs show the percentage of gamma-H2AX positive cells after 3 (A) and 7 (B) days of cultivation. SS—stainless steel; NCS—positive control to phosphorylation of histone H2AX (gamma-H2AX) induced by 1 h incubation of U-2 OS in neocarzinostatin (NCS; 700 ng M). The blue columns illustrate the samples before the evacuation (B.E.), while the red columns depict the samples after the evacuation (A.E.). The asterisk represents a significant difference to control with p ≤ 0.05 (*), p ≤ 0.01 (**), and p ≤ 0.001 (***).


Table 1.
Concentrations of aromatic species found in SC-500 extract and literature values of quantum yields of singlet oxygen formation (ΦΔ).
Table 1.
Concentrations of aromatic species found in SC-500 extract and literature values of quantum yields of singlet oxygen formation (ΦΔ).
| Compound | Formula | Concentration (μM) | ΦΔ | λexc | |
|---|---|---|---|---|---|
| Before Evacuation after Evacuation | |||||
| naphtalene |  | 2.3 | 1.1 | - | <290 |
| fluorene |  | 0.6 | >0.0 | 1.00 a | <310 |
| phenathrene |  | 2.7 | 0.3 | 0.44 a | <370 |
| anthracene |  | 3.5 | 0.3 | 0.69 b | <390 |
| fluoranthene |  | 1.6 | >0.0 | 0.50 c | <420 |
| pyrene |  | 3.8 | >0.0 | 0.79 c | <420 |
Table 2.
Concentrations of c(N) and c(C), binding energies Eb, and full widths at half maximum (FWHM, in brackets) of photoelectron lines (eV) obtained by simulation of photoelectron spectra.
Table 2.
Concentrations of c(N) and c(C), binding energies Eb, and full widths at half maximum (FWHM, in brackets) of photoelectron lines (eV) obtained by simulation of photoelectron spectra.
| SF-AS | SF-500 | Stoichiometry/Assignment | |
|---|---|---|---|
| c(N) | 0.04 | 0 | 0.04 |
| c(C) | 0.79 | 0.50 | 0.50 |
| c(C 1s)1 | 0 | 20 | |
| c(C 1s)2 | 72 | 67 | |
| c(C 1s)3 | 25 | 9 | |
| c(C 1s)4 | 3 | 4 | |
| Eb (N 1s) | 402.3 | - | SDA |
| Eb (C 1s)1 | 284.1 (1.5) | Hydrocarbons with sp2 hybridization | |
| Eb (C 1s)2 | 284.7 (2.0) | 284.9 (2.0) | Hydrocarbons with sp3 hybridization |
| Eb (C 1s)3 | 286.5 (1.8) | 287.0 (1.6) | C-O |
| Eb (C 1s)4 | 288.8 (1.7) | 289.2 (1.6) | C=O |
© 2019 by the authors. Licensee MDPI, Basel, Switzerland. This article is an open access article distributed under the terms and conditions of the Creative Commons Attribution (CC BY) license (http://creativecommons.org/licenses/by/4.0/).
Share and Cite
MDPI and ACS Style
Jirka, I.; Kopová, I.; Kubát, P.; Tabor, E.; Bačáková, L.; Bouša, M.; Sajdl, P. The Photodynamic Properties and the Genotoxicity of Heat-Treated Silicalite-1 Films. Materials 2019, 12, 567. https://doi.org/10.3390/ma12040567
AMA Style
Jirka I, Kopová I, Kubát P, Tabor E, Bačáková L, Bouša M, Sajdl P. The Photodynamic Properties and the Genotoxicity of Heat-Treated Silicalite-1 Films. Materials. 2019; 12(4):567. https://doi.org/10.3390/ma12040567
Chicago/Turabian StyleJirka, Ivan, Ivana Kopová, Pavel Kubát, Edyta Tabor, Lucie Bačáková, Milan Bouša, and Petr Sajdl. 2019. "The Photodynamic Properties and the Genotoxicity of Heat-Treated Silicalite-1 Films" Materials 12, no. 4: 567. https://doi.org/10.3390/ma12040567
Note that from the first issue of 2016, this journal uses article numbers instead of page numbers. See further details here.