Anodic Polarization Behavior of X80 Steel in Na2SO4 Solution under High Potential and Current Density Conditions


Institute for Advanced Materials and Technology, University of Science and Technology Beijing, Beijing 100083, China
*
Author to whom correspondence should be addressed.
Materials 2019, 12(3), 394; https://doi.org/10.3390/ma12030394
Submission received: 31 December 2018
/
Revised: 18 January 2019
/
Accepted: 23 January 2019
/
Published: 27 January 2019
(This article belongs to the Section Corrosion)
Abstract
:X80 steel has great risk of corrosion in high voltage direct current (HVDC) interference cases. In this study, the anodic polarization behavior of X80 steel under high potential and current density in Na2SO4 solution was investigated. The I × R drop was eliminated using current interrupt technique during the potentiodynamic measurement. Therefore, the real polarization curve was obtained. The corrosion behavior was investigated by galvanostatic polarization, scanning electron microscopy, and X-ray photoelectron spectroscopy. The results show a new form of passivation route. The steel dissolved actively below −0.388 VSCE, then became partly passivated from −0.388 to 1.448 VSCE, and fully passivated above 1.448 VSCE. The passive film was formed containing Fe2O3 and FeOOH, and resistant to SO42− ions. It not only blocked the direct dissolution of steel, but also facilitated oxygen evolution. The corrosion rates of steel samples decreased after the passivation.
1. Introduction
X80 carbon steel is used in pipelines worldwide. However, it may suffer various interferences and has the risk of corrosion. Recently, high voltage direct current (HVDC) systems have been developed rapidly around the world. Under fault and maintenance conditions, the system works in monopolar configuration and injects large amount of direct current (DC) into the soil, thus introducing DC interference to nearby buried pipelines. Therefore, the pipelines may have significant pipe-to-soil potential deviation and large leakage current density at coating holidays [1]. The HVDC interference is more severe than common DC interference. In some cases [2], the pipe-to-soil potential is as high as 304 V, and the leakage current density of the coupon is reported to be 0.049 A·cm−2. The HVDC cases have become a concern. However, the corrosion of pipeline steel under such high potential and current density conditions has been rarely studied. How to evaluate the corrosion risk has become an urgent issue in the industry.
To study the corrosion behavior, the anodic polarization curve is an important tool. The kinetics of corrosion can be obtained from the polarization results. Under low potential and current density conditions, the polarization behavior of carbon steel in soil simulation solutions has been extensively studied. Since SO42− ions are extensively and massively distributed in soil, the Na2SO4 solution is often used as a typical simulation solution in the laboratory. Some scholars [3,4,5,6] studied the polarization characteristics of carbon steel in Na2SO4 solution. The steel dissolved actively under the test condition (lower than 0.4 VSCE, or 0.010 A·cm−2). Although two theories on the dissolution of steel have been reported [7,8], it is well recognized that the whole steps could be summarized as the formation of Fe2+ ions [9]. Some studies have considered the effect of SO42− ions. Some researchers [10,11,12,13] tested the anodic polarization behavior of carbon steel in solutions with different concentration of SO42− ions. The results indicate that SO42− ions can facilitate the dissolution of steel. Thus, SO42− ions are proved to be the most aggressive anions. However, prior experiments were carried out in narrow potential/current density ranges and thus did not satisfy the HVDC interference cases. The polarization characteristics of pipe steel in Na2SO4 solution should be studied further.
Moreover, the IR drop is a difficult issue in potential measurement. The directly measured apparent potential Eon contains IR drop, the voltage drop of electrolyte between the working electrode and reference electrode [14]. In HVDC interference cases, with the great increase in current density, the IR drop becomes a significant error. Although some theoretical calculations and optimization have been carried out [15], the IR drop still cannot be completely eliminated in experiments. Besides, the IR drop compensation of the commercial electrochemical workstation does not work well under high voltage/current density conditions. To obtain the precise polarization potential, the current step method was proposed, and the potential-time response and substance concentration were analyzed [16]. On this basis, some researchers [17,18,19,20] tested the IR drop in various environments using the current interrupt method and subtracted it from the apparent potential. Therefore, the feasibility and effectiveness of IR drop elimination under high potential and current density conditions deserve more attention.
In this study, the polarization behavior of X80 steel under high potential and current density in Na2SO4 solution was studied by potentiodynamic polarization. The current interrupt method was used to test and eliminate the IR drop. Combined with galvanostatic polarization and product characterization, the corrosion process and corrosion rate were analyzed, and a mechanism model in the test range was proposed. This study provides a reference to better understand the corrosion and protection of pipe steel in large DC interference cases.
2. Materials and Methods
2.1. Materials and Solution
The test material was API X80 steel; it was cut from an in-service pipeline system. The chemical constitution in weight percentage (wt%) was: 0.07 C, 0.21 Si, 1.61 Mn, 0.12 Ni, 0.14 Cu, 0.041 Nb, 0.012 Ti, 0.0025 S, 0.0081 P, 0.13 Mo, and Fe balance. The specimen was embedded in paraffin wax, exposing the working area of 1 cm2. Before each experiment, the working electrode surface was abraded with 360, 600, 800, and 1000 grit silicon carbide emery papers and ultrasonically cleaned with acetone, ethyl alcohol, and deionized water and then dried under cold dry air.
The test solution was 4 g·L−1 Na2SO4; this was made from analytical-grade reagents and deionized water.
All tests were carried out at room temperature of 25 ± 2 °C and relative humidity of 30 ± 2%.
2.2. Potentiodynamic Polarization Measurement and IR Drop Elimination
A three-electrode system was used for the experiments, as shown in Figure 1. X80 steel coupons, a Pt electrode, and a saturated calomel electrode (SCE) were used as the working electrode (WE), counter electrode (CE), and reference electrode (RE), respectively. In our experiments, all electrochemical potentials were expressed with respect to SCE. An electrochemical workstation (Gamry Reference 3000, Gamry, Warminster, UK) was used for electrochemical measurements. When the open-circuit potential of WE was stable, the potentiodynamic curve was measured at a potential scanning rate of 1 mV·s−1 from open circuit potential (OCP) to +7 V. This test range could fully cover the highest leakage current density in HVDC cases [2].
During the potentiodynamic measurement, the current interrupt method was used for IR drop evaluation and elimination. An interrupter was installed in the CE branch to interrupt the external current periodically. A 1000-Hz data logger (DL-1, Tinker & Rasor, San Bernardino, CA, USA) was used to record the potential of WE during the interruption. Then, the IR drop was calculated from the potential–time transient.
2.3. Corrosion Rate and Product Characterization
Galvanostatic polarization measurements were carried out to determine the corrosion rate and characterize the products. The samples were polarized under a constant current of 0.001, 0.010, 0.020, 0.030, 0.040, 0.050, 0.080, 0.100, and 0.150 A·cm−2 for 1 h. After the galvanostatic polarization, the surfaces of the specimens were rinsed with deionized water and dried with cold dry air.
Based on the polarization results, samples with currents of 0.010, 0.030, and 0.080 A·cm−2 were selected for product characterization. The surface morphologies of corrosion scales were observed by scanning electron microscopy (SEM, LEO-1450, Zeiss, Jena, Gernamy), and their composition was investigated by X-ray photoelectron spectroscopy (XPS, AXIS ULTRADLD, Kratos, Manchester, UK).
For all samples, according to the ISO 8407: 2010 standard [21], the rust was eliminated by successive cleaning in hydrochloric acid aqueous solution (500 mL deionized water + 500 mL concentrated hydrochloric acid + 5 g hexamethylenetetramine). The coupons were washed with acetone and dried by air blast. Then, the corrosion rate was calculated.
3. Results
3.1. IR Drop Elimination
In the polarization measurement, the apparent potential Eon contains a certain amount of IR drop. Their relationship can be described as follows:
where Ep is the real polarization potential, I is the external current flowing through WE, and Ru is the uncompensated resistance of electrolyte between the working electrode and reference electrode [14]. In this paper, the word “real” is used to describe the potential corrected by IR drop elimination. The real potential was more precise than the apparent potential, as discussed below.
Eon = Ep + IRu
Generally, when the current is interrupted, the measured potential E(t) exponentially decays with time [20]:
where E0 is the eventual potential after infinite time and τ is the time constant. Theoretically, Ep can be described as E(0), which can be measured at the exact moment of the current interruption. Some scholars [18,19] used oscilloscopes to find E(0). However, in practical operations, it is difficult to obtain the accurate E(0) because of the limit of fast interruption and datalogger.
During the potentiodynamic measurement in our experiment, the current was interrupted periodically. At each interruption, the potential was recorded using a high-speed datalogger. Taking one interruption process as an example, the transient potential–time curve is shown in Figure 2. The interrupter started to work at time A, but the complete interruption of circuit occurred at time B. To obtain the accurate Ep at time A, the potential values were fitted and extended reversely, as shown in the red curve. The cross-point of the fitted curve and time A was Ep, which was regarded as the real polarization potential. Accordingly, the IR drop was obtained by subtracting Ep from Eon.
Based on this method, the polarization potential Ep was calculated, as shown in Figure 3, together with the apparent potential Eon and the IR drop. Clearly, Eon linearly increased as programmed. The IR drop increased with Eon. However, a sudden drop occurred at ~3500 s. Correspondingly, a sudden rise occurred in the Ep curve. At other times, Ep slightly increased with time.
Figure 3 shows that the apparent potential Eon contains a large amount of IR drop, and the real polarization information was covered by this error. For example, when Eon was 7.002 V, Ep was only 1.577 V. The IR drop was 5.425 V, and the error was 77.5%. In fact, the ordinary potential control was not reliable under high potential/current density conditions because of the IR drop. Some traditional test methods such as potentiostatic polarization and cyclic voltammetry are no longer available.
3.2. Potentiodynamic Polarization Results
Figure 4 presents the anodic potentiodynamic polarization curves of X80 steel in 4 g·L−1 Na2SO4 solution. The Eon curve was drawn as the black line. The Ep curve, which corresponded to all the Ep values, was drawn as the blue line, and the characteristic points were marked from A to D. Both the curves can be separated into three stages. The macro-morphologies of the sample surface in different stages are shown in Figure 5.
Stage 1: A–B. Point A was the open-circuit potential of X80 sample, −0.598 V. When the current density was lower than 0.001 A·cm−2, both Eon and Ep had a linear relationship with the logarithm of current density, described as Tafel behavior. The Tafel slope was 75.9 mV·dec−1 for Eon curve, and 43.2 mV·dec−1 for Ep curve. After 0.001 A·cm−2, Eon increased more quickly than the logarithm of current density. Clearly, the reason was the growth of IR drop, as displayed in Figure 3. However, the Ep curve still followed the Tafel behavior. In this stage of experiment, the specimen gradually lost its gloss, and a layer of corrosion products appeared on its surface. First, the products were gray. Then, their color turned to black and became darker, as shown in Figure 5a. The solution became straw yellow, probably indicating the diffusion of Fe3+ ions.
Stage 2: B–C. When the current density reached 0.073 A·cm−2 at Point B, Ep was −0.388 V. Point B was a turning point of the curve. After Point B, Ep sharply increased, while the current density decreased. It indicated some new electrochemical reactions. This was also the reason for the decline of IR drop shown in Figure 3. At some positions, the black rust began to fall off from the steel, exposing the bare metal, as shown in Figure 5b. Moreover, massive bubbles gushed from such positions. With the progress in experiment, more and more rust dropped.
Stage 3: C–D. Point C was another turning point of the curve, where the current density decreased to 0.038 A·cm−2, and Ep was −1.448 V. Both Eon and Ep continuously increased beyond Point C; the current density started to increase again until the limit of the electrochemical workstation. For the Ep curve, a new Tafel relationship with the current density was obtained. The new Tafel slope was 74.6 mV·dec−1. In this stage, the black rust was completely shed, exposing the metal surface. There was a layer of certain film on the sample surface, as shown in Figure 5c. The film will be further discussed below.
As shown in Figure 4, the apparent polarization curve deviates from the Tafel behavior with increasing current density. This was due to IR drop instead of the limit of mass transfer of reactant/product [16]. For the real polarization curve, two turning points indicate new electrochemical processes, as discussed below.
3.3. Corrosion Product Characterization
To study the reaction process of X80 steel in 4 g·L−1 Na2SO4 solution in different periods, galvanostatic polarization measurements were applied to the samples. The values of constant current density are shown as the red points in Figure 4. For each galvanostatic polarization, the potential–time curves are misleading because of the large IR drop. Therefore, only the product characterization and corrosion rate analysis are used here.
In the experiments, when the current density was below 0.080 A·cm−2, corrosion occurred, and rust was formed. When the current density was higher than 0.080 A·cm−2, some gas bubbles were produced on the sample surface, as shown in Figure 6. The gas was collected and detected to be O2, because of combustion-supporting characteristic. Moreover, no obvious corrosion rust was observed on the sample surface in this situation.
The micro-morphologies of samples after the galvanostatic polarization of 0.010, 0.030, and 0.080 A·cm−2 are shown in Figure 7. With low current densities (0.010 and 0.030 A·cm−2), the corrosion products were bar-shaped crystals. The crystals accumulated to a flat layer, but the layer was loose and porous. With a high current density of 0.080 A·cm−2, the product layer was neat and even, indicating that the corrosion product was tiny and densely crystallized.
The corrosion products were characterized by XPS. The results were free of S. The high-resolution spectra and decomposition of Fe 2p and O 1s curves are shown in Figure 8 and Figure 9.
For the products obtained after the galvanostatic polarization test of 0.010 A·cm−2, three major peaks were observed at 707.1, 711.2, and 713.6 eV in the Fe 2p curve. They were assigned to Fe matrix, FeOOH, and the satellite of Fe3+, respectively [22,23,24]. The O 1s curve can be decomposed to two major peaks at 530.1 eV and 531.8 eV. This was attributed to metal oxides and hydroxides [25,26,27]. The peaks in the O 1s and Fe 2p curves in the case of 0.030 A·cm−2 were similar, indicating the same type of corrosion products.
In the case of 0.080 A·cm−2, three major peaks appeared at 706.5 eV, 709.7 eV, and 711.5 eV in the Fe 2p curve, corresponding to the Fe matrix, Fe2O3, and FeOOH, respectively. The peaks at 529.7 eV and 531.1 eV in O 1s curve were assigned to metal oxides and hydroxides. The peak of Fe matrix was high, indicating that the product was as thin as several nanometers.
3.4. Corrosion Rates
The corrosion rates of the samples were measured after different galvanostatic polarization tests. For each current density, the experiments were repeated at least three times. The measured corrosion rates are shown as black hollow dots in Figure 10. Besides, the corrosion rates were calculated using Faraday’s law and the well-accepted corrosion reaction:
Fe = Fe2+ + 2e
The calculated results are shown as red dots. The real corrosion rates linearly increased and fit the calculated values well before 0.080 A·cm−2. The highest corrosion rate was measured to be 66.1 μm·h−1 at 0.050 A·cm−2. However, the corrosion rates had a huge drop at 0.080 A·cm−2 and then decreased with the current density. The results indicate that some new reactions occurred, inhibiting the corrosion of steel.
4. Discussion
According to the polarization curves, product characterization, and corrosion rate results, the polarization of X80 steel was separated into three regions, namely dissolution, transition, and transpassivation:
(1) Dissolution
The range of dissolution region was Stage 1, from −0.598 to −0.513 V. In this region, Ep and the current density fit the Tafel relationship, and the measured corrosion rates satisfied the calculated values based on Equation (3). Carbon steel actively dissolved in various electrolytes, only in a narrow range of potential/current density [2,4,5,6,7,11,12,13]. In this experiment, the range was extended to 0.073 A·cm−2. The active dissolution mechanism of carbon steel in Na2SO4 solution has been fully studied [7]. The first step of corrosion was well recognized as the formation of Fe2+ ions, as shown in Equation (3).
Then, the Fe2+ ions participated in the formation of rust, as shown in Equation (4). Based on the SEM morphology analyses reported in the literature, this type of rust looked more like cigar-shaped γ-FeOOH (akaganeite) [28] than spherical 𝛼-FeOOH (goethite) [29,30] or flowery 𝛾-FeOOH (lepidocrocite) [28,31]. This rust layer was porous and unable to block further dissolution.
4Fe2+ + 4H2O + 2O2 = 4FeOOH + 8H+
(2) Transpassivation
The polarization curve of Stage 3, as shown in Figure 4, satisfied the new Tafel relationship, and the real polarized potential was almost 2 V higher. In this region, the SEM and XPS showed a thin and dense film on the sample surface. Moreover, a large amount of oxygen bubbled, and the corrosion rate decreased. These phenomena indicated that the steel was in a passivation state, and the main composition of the passive film was Fe2O3 and FeOOH. Some researchers believed that the passive film of carbon steel usually had a double-layer structure [32]. The outer layer was FeOOH [33,34,35], and the inner layer was Fe2O3, most probably γ-Fe2O3 (maghemite) [36]. Under different test conditions, the passive film in our experiments was consistent with the literature. The formation of the film can be described as follows:
2Fe2+ + 3H2O = Fe2O3 + 6H+ + 2e
Fe2+ + 2H2O = FeOOH + 3H+ + e
This passive film was protective. It inhibited the further dissolution of steel and hindered the formation and development of rust. Therefore, the corrosion rates remained at a low level. At the same time, with the increase in current density, the oxygen evolution reaction (OER) became more and more violent, consuming a large amount of current density (Equation (7)). Therefore, the corrosion rates were lower in high current density conditions.
2H2O = O2↑ + 4H+ + 4e
(3) Transition
In Figure 4, Stage 2 was in the transition region. The polarized potential showed a sudden rise at Point B, indicating the start of passivation reactions. However, the process was fast in this region. It was difficult to maintain the samples at this region in galvanostatic polarization.
In the transition region, notably, the passivation did not occur evenly in the entire working area. Instead, it started from some local positions with the drop of rust, as shown in Figure 5b. It can be inferred that the rust and film were mutually exclusive. The film was not transformed by the rust but directly formed between the steel substance and rust. At that time, it should be noted that the measured potential was a mixed potential, which was still below the potential of OER. However, at some places, the local potential exceeded the potential of OER, therefore OER took place. The gas bubbles filled the interface and broke the structure of the rust, pushing the rust down. As the potentiodynamic measurement progressed, the area of passive film increased, and the rust continued to fall. Finally, the rust fell off completely, and the steel reached the transpassivation region.
The passivation in this experiment was quite different from ordinary passivation. Figure 11 shows a comparison of the two curves. In the traditional potentiodynamic process, the passivation reaction evenly occurs on the sample surface with a large decrease in current density (usually in the level of 10−6 A·cm−2 [32]). However, in our experiments, the passivation reaction started locally and developed to the transpassivation state. Thus, the current density was higher than the traditional cases. Besides, no such decline of current density was observed. The transition state was more like a mixture of dissolution and transpassivation. This passive mode has been rarely reported before.
Based on the results and analysis mentioned above, the dissolution–transition–transpassivation model of X80 steel in Na2SO4 solution is proposed, as shown in Figure 12. In the dissolution region, the steel dissolved, and rust formed on the sample surface. In the transition region, passivation reaction started locally, and rust started to fall. In the transpassivation region, the passive film covered the sample surface, and OER took place strongly.
It is well accepted that the SO42− ions can facilitate dissolution. In some cases, the addition of a slight amount of SO42− ions could break the passive film and increase the corrosion rate [37,38,39,40,41,42]. However, our experiments proved that this passive film of X80 steel was resistant to SO42− ions. Moreover, the corrosion rates decreased because of the passive film. These results may provide useful information for corrosion evaluation and protection in high voltage/large current density interference cases.
5. Conclusions
During the anodic polarization measurement of X80 steel in the Na2SO4 solution, the current interrupt method was used. The IR drop was calculated by fitting the potential–time transient of interruption. The IR drop increased with current density, and it was the main error in the potential measurement under high potential/large current density conditions.
The real polarization curve was obtained by IR drop elimination. A new form of passivation was observed. In the test range, the anodic process showed three types of characteristics: dissolution, transition, and transpassivation. The active dissolution region was below −0.388 V, where the samples dissolved, and the rust of FeOOH was formed. The transition region was from −0.388 V to 1.448 V. The passivation reaction occurred locally on the sample surface, and the rust started to fell off because of OER. When the polarized potential was above 1.448 V, the steel reached the transpassivation region. The passive film consisted of Fe2O3 and FeOOH and showed resistance to the SO42− ions. Strong OER occurred on the film surface. Based on the experimental results and analysis, a mechanism model of the anodic polarization process of X80 steel in Na2SO4 solution was proposed.
In the activation region, the corrosion rates of X80 steel were directly proportional to the anodic current density. However, in the transition and transpassivation regions, the passive film hindered the direct dissolution of steel. Besides, a large amount of current density was consumed in OER. Therefore, the corrosion rates of X80 steel significantly decreased.
Author Contributions
Conceptualization, Y.D. and R.Q.; methodology, R.Q. and Z.X.; writing—original draft preparation, R.Q.; writing—review and editing, Y.D. and R.Q.; and funding acquisition, M.L.
Funding
This research was funded by China Scholarship Council (grant No. 201606465052) and National Key R&D Program of China (grant No. 2016YFC0802101).
Conflicts of Interest
The authors declare no conflict of interest.
References
- Gong, Y.; Xue, C.; Yuan, Z.; Li, Y.; Dawalibi, F.P. Advanced analysis of HVDC electrodes interference on neighboring pipelines. J. Power Energy Eng. 2015, 3, 332–341. [Google Scholar] [CrossRef]
- Qin, R.Z.; Du, Y.X.; Peng, G.Z.; Lu, M.X.; Jiang, Z.T. High Voltage Direct Current Interference on Buried Pipelines: Case Study and Mitigation Design. In Proceedings of the Corrosion Conference 2017, New Orleans, LA, USA, 28–31 March 2017. [Google Scholar]
- Jiang, Z.T.; Du, Y.X.; Lu, M.X.; Zhang, Y.; Tang, D.; Dong, L. New findings on the factors accelerating AC corrosion of buried pipeline. Corros. Sci. 2014, 81, 1–10. [Google Scholar] [CrossRef]
- Smith, P.; Roy, S.; Swailes, D.; Maxwell, S.; Page, D.; Lawson, J. A model for the corrosion of steel subjected to synthetic produced water containing sulfate, chloride and hydrogen sulfide. Chem. Eng. Sci. 2011, 66, 5775–5790. [Google Scholar] [CrossRef]
- Goidanich, S.; Lazzari, L.; Ormellese, M. AC corrosion—Part 1: Effects on overpotentials of anodic and cathodic processes. Corros. Sci. 2010, 52, 491–497. [Google Scholar] [CrossRef]
- Gil, P.M.; Julien, B.; Palomar-Pardavé, M.; de Oca-Yemha, M.G.M.; Ramírez-Silva, M.T.; Romero-Romo, M. Electrochemical behaviour of API 5L X52 steel samples immersed in sulphate aqueous solutions with different pH. Int. J. Electrochem. Sci. 2018, 13, 3297–3308. [Google Scholar]
- Bockris, J.O.M.; Drazic, D.; Despic, A.R. The electrode kinetics of the deposition and dissolution of iron. Electrochim. Acta 1961, 4, 325–361. [Google Scholar] [CrossRef]
- Lorentz, W.J.; Heusler, K.E. Corrosion Mechanisms; Marcel Dekker: New York, NY, USA, 1987. [Google Scholar]
- Gonçalves, R.S.; Mello, L.D. Electrochemical investigation of ascorbic acid adsorption on low-carbon steel in 0.50 M Na2SO4 solutions. Corros. Sci. 2001, 43, 457–470. [Google Scholar] [CrossRef]
- Barbalat, M.; Lanarde, L.; Caron, D.; Meyer, M.; Vittonato, J.; Castillon, F.; Fontaine, S.; Refait, P. Electrochemical study of the corrosion rate of carbon steel in soil: Evolution with time and determination of residual corrosion rates under cathodic protection. Corros. Sci. 2012, 55, 246–253. [Google Scholar] [CrossRef]
- Shi, Z.; Zhang, X.; Wang, Y.; Liu, M.; Tang, K.; Si, S.; Li, H. Effects of SO42− on pitting corrosion behavior of X100 pipeline steel in alkaline solution. J. Chin. Univ. Pet. Nat. Sci. Ed. 2016, 40, 128. [Google Scholar]
- Zhang, X.; Shi, Z.; Wang, Y.; Liu, M.; Yang, S. Corrosion behavior of X100 pipeline steel in simulated solution of alkaline soil. J. Chin. Soc. Corros. Prot. 2015, 35, 33–37. [Google Scholar]
- Xie, F.; Wu, M.; Chen, X.; Wang, D.; Hu, Z.; Liu, Y. Effects of SO42− on corrosion behavior of X80 pipeline steel in simulated Ku’erle soil solution. J. Cent. South Univ. 2013, 44, 424–430. [Google Scholar]
- Myland, J.C.; Oldham, K.B. Uncompensated Resistance. 1. The Effect of Cell Geometry. Anal. Chem. 2000, 72, 3972–3980. [Google Scholar] [CrossRef] [PubMed]
- Oelßner, W.; Berthold, F.; Guth, U. The iR drop-well-known but often underestimated in electrochemical polarization measurements and corrosion testing. Mater. Corros. 2006, 57, 455–466. [Google Scholar] [CrossRef]
- Bard, A.J.; Faulkner, L.R. Electrochemical Methods: Fundamentals and Applications; Wiley: New York, NY, USA, 2001. [Google Scholar]
- Hiveš, J.; Roušar, I. Measurement of anode potentials at high current densities in NaNO3 and NaClO3 media by the current interruption method for metals used in aviation technology. J. Appl. Electrochem. 1994, 24, 798–802. [Google Scholar] [CrossRef]
- Mao, K.W. Anodic Polarization Study of Mild Steel in NaCl Solution During Electrochemical Machining. J. Electrochem. Soc. 1973, 120, 1056–1060. [Google Scholar] [CrossRef]
- Britz, D.; Brocke, W.A.J. Elimination of iR-drop in electrochemical cells by the use of a current-interruption potentiostat. Electroanal. Chem. Interfacial Electrochem. 1975, 58, 301. [Google Scholar] [CrossRef]
- Elsener, B. Corrosion rate of steel in concrete—Measurements beyond the Tafel law. Corros. Sci. 2005, 47, 3019–3033. [Google Scholar] [CrossRef]
- ISO 8407:2009. Corrosion of Metals and Alloys—Removal of Corrosion Products from Corrosion Test Specimens; International Organization for Standardizatino: Geneva, Switzerland, 2009. [Google Scholar]
- Ghods, P.; Isgor, O.B.; Brown, J.R.; Bensebaa, F.; Kingston, D. XPS depth profiling study on the passive oxide film of carbon steel in saturated calcium hydroxide solution and the effect of chloride on the film properties. Appl. Surf. Sci. 2011, 257, 4669–4677. [Google Scholar] [CrossRef]
- Ejaz, A.; Lu, Z.; Chen, J.; Xiao, Q.; Ru, X.; Han, G.; Shoji, T. The effects of hydrogen on anodic dissolution and passivation of iron in alkaline solutions. Corros. Sci. 2015, 101, 165–181. [Google Scholar] [CrossRef]
- Mourya, P.; Singh, P.; Tewari, A.K.; Rastogi, R.B.; Singh, M.M. Relationship between structure and inhibition behaviour of quinolinium salts for mild steel corrosion: Experimental and theoretical approach. Corros. Sci. 2015, 95, 71–87. [Google Scholar] [CrossRef]
- Xu, W.; Daub, K.; Zhang, X.; Noel, J.J.; Shoesmith, D.W.; Wren, J.C. Oxide formation and conversion on carbon steel in mildly basic solutions. Electrochim. Acta 2009, 54, 5727–5738. [Google Scholar] [CrossRef]
- Rahman, Z.U.; Deen, K.M.; Cano, L.; Haider, W. The effects of parametric changes in electropolishing process on surface properties of 316L stainless steel. Appl. Surf. Sci. 2017, 410, 432–444. [Google Scholar] [CrossRef]
- López, D.A.; Schreiner, W.H.; de Sánchez, S.R.; Simison, S.N. The influence of carbon steel microstructure on corrosion layers. Appl. Surf. Sci. 2003, 207, 69–85. [Google Scholar] [CrossRef]
- Ma, Y.; Li, Y.; Wang, F. The effect of β-FeOOH on the corrosion behavior of low carbon steel exposed in tropic marine environment. Mater. Chem. Phys. 2008, 112, 844–852. [Google Scholar] [CrossRef]
- Cornell, R.M.; Schwertmann, U. The Iron Oxides: Structure, Properties, Reactions, Occurrences and Uses; Wiley: New York, NY, USA, 2003. [Google Scholar]
- de La Fuente, D.; Díaz, I.; Simancas, J.; Chico, B.; Morcillo, M. Long-term atmospheric corrosion of mild steel. Corros. Sci. 2011, 53, 604–617. [Google Scholar] [CrossRef] [Green Version]
- Castaño, J.G.; Botero, C.A.; Restrepo, A.H.; Agudelo, E.A.; Correa, E.; Echeverría, F. Atmospheric corrosion of carbon steel in Colombia. Corros. Sci. 2010, 52, 216–223. [Google Scholar] [CrossRef]
- Marcus, P. Corrosion Mechanisms in Theory and Practice; Marcel Dekker: New York, NY, USA, 2002. [Google Scholar]
- Freire, L.; Nóvoa, X.R.; Montemor, M.F.; Carmezim, M.J. Study of passive films formed on mild steel in alkaline media by the application of anodic potentials. Mater. Chem. Phys. 2009, 114, 962–972. [Google Scholar] [CrossRef]
- Larramona, G.; Gutiérrez, C. The Passive Film on Iron at pH 1–14 A Potential-Modulated Reflectance Study. J. Electrochem. Soc. 1989, 136, 2171–2178. [Google Scholar] [CrossRef]
- Meisel, W. Corrosion processes and their inhibition as studied by Mössbauer conversion and other electron spectroscopies. Hyperfine Interact. 1989, 45, 73–90. [Google Scholar] [CrossRef]
- Gui, J.; Devine, T.M. The influence of sulfate ions on the surface enhanced raman spectra of passive films formed on iron. Corros. Sci. 1994, 36, 441–462. [Google Scholar] [CrossRef]
- Liu, Z.; Dong, C.; Jia, Z.; Li, X. Pitting Corrosion of X70 Pipeline Steel in the Simulated Wet Storage Environment. Acta Metall. Sin. 2011, 47, 1009–1016. [Google Scholar]
- El-Naggar, M.M. Effects of Cl−, NO3− and SO42− anions on the anodic behavior of carbon steel in deaerated 0.50M NaHCO3 solutions. Appl. Surf. Sci. 2006, 252, 6179–6194. [Google Scholar] [CrossRef]
- Yang, J.; Dong, J.; Ke, W. Effects of SO42− and Cl− on active/passive corrosion behaviors of low carbon steel in deaerated bicarbonate solution. Acta Metall. Sin. 2011, 47, 1321–1326. [Google Scholar]
- Simard, S.; Odziemkowski, M.; Irish, D.E.; Brossard, L.; Menard, H. In situ micro-Raman spectroscopy to investigate pitting corrosion product of 1024 mild steel in phosphate and bicarbonate solutions containing chloride and sulfate ions. J. Appl. Electrochem. 2001, 31, 913–920. [Google Scholar] [CrossRef]
- Gadala, I.M.; Alfantazi, A. Electrochemical behavior of API-X100 pipeline steel in NS4, near-neutral, and mildly alkaline pH simulated soil solutions. Corros. Sci. 2014, 82, 45–57. [Google Scholar] [CrossRef]
- Liu, G.; Zhang, Y.; Ni, Z.; Huang, R. Corrosion behavior of steel submitted to chloride and sulphate ions in simulated concrete pore solution. Const. Build. Mater. 2016, 115, 1–5. [Google Scholar] [CrossRef]
Figure 1.
Schematic diagram of the electrochemical test circuit combined with the current interrupt method.
Figure 1.
Schematic diagram of the electrochemical test circuit combined with the current interrupt method.

Figure 2.
Transient potential–time curve during one interruption of polarization of X80 steel in 4 g·L−1 Na2SO4 solution.
Figure 2.
Transient potential–time curve during one interruption of polarization of X80 steel in 4 g·L−1 Na2SO4 solution.
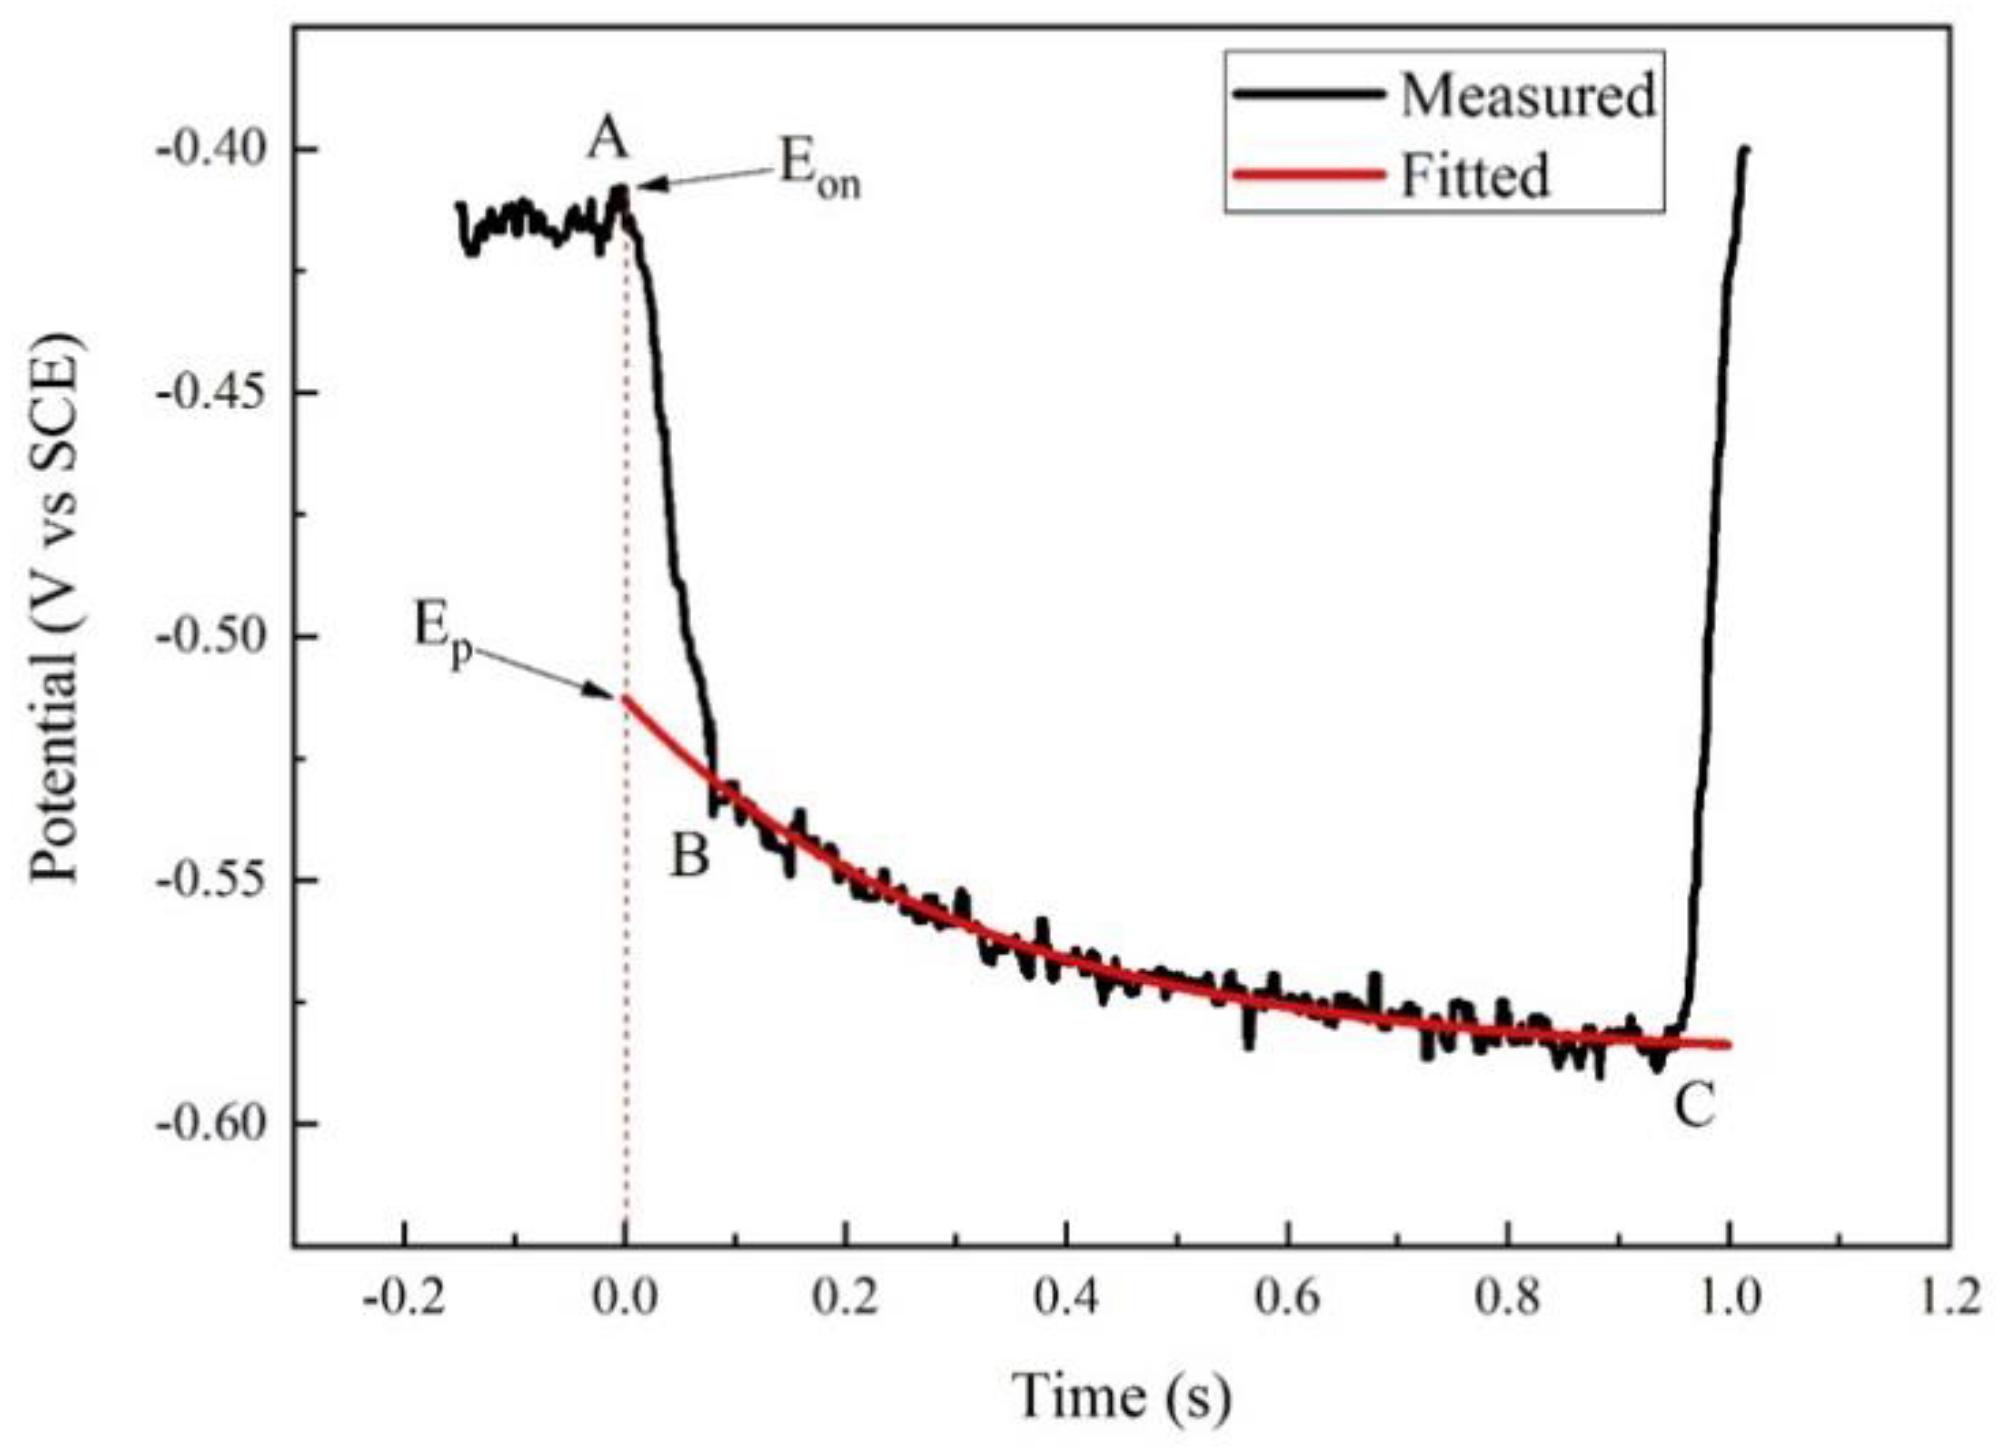
Figure 3.
Comparison of Eon, Ep, and IR drop in polarization measurement of X80 steel in 4 g·L−1 Na2SO4 solution.
Figure 3.
Comparison of Eon, Ep, and IR drop in polarization measurement of X80 steel in 4 g·L−1 Na2SO4 solution.
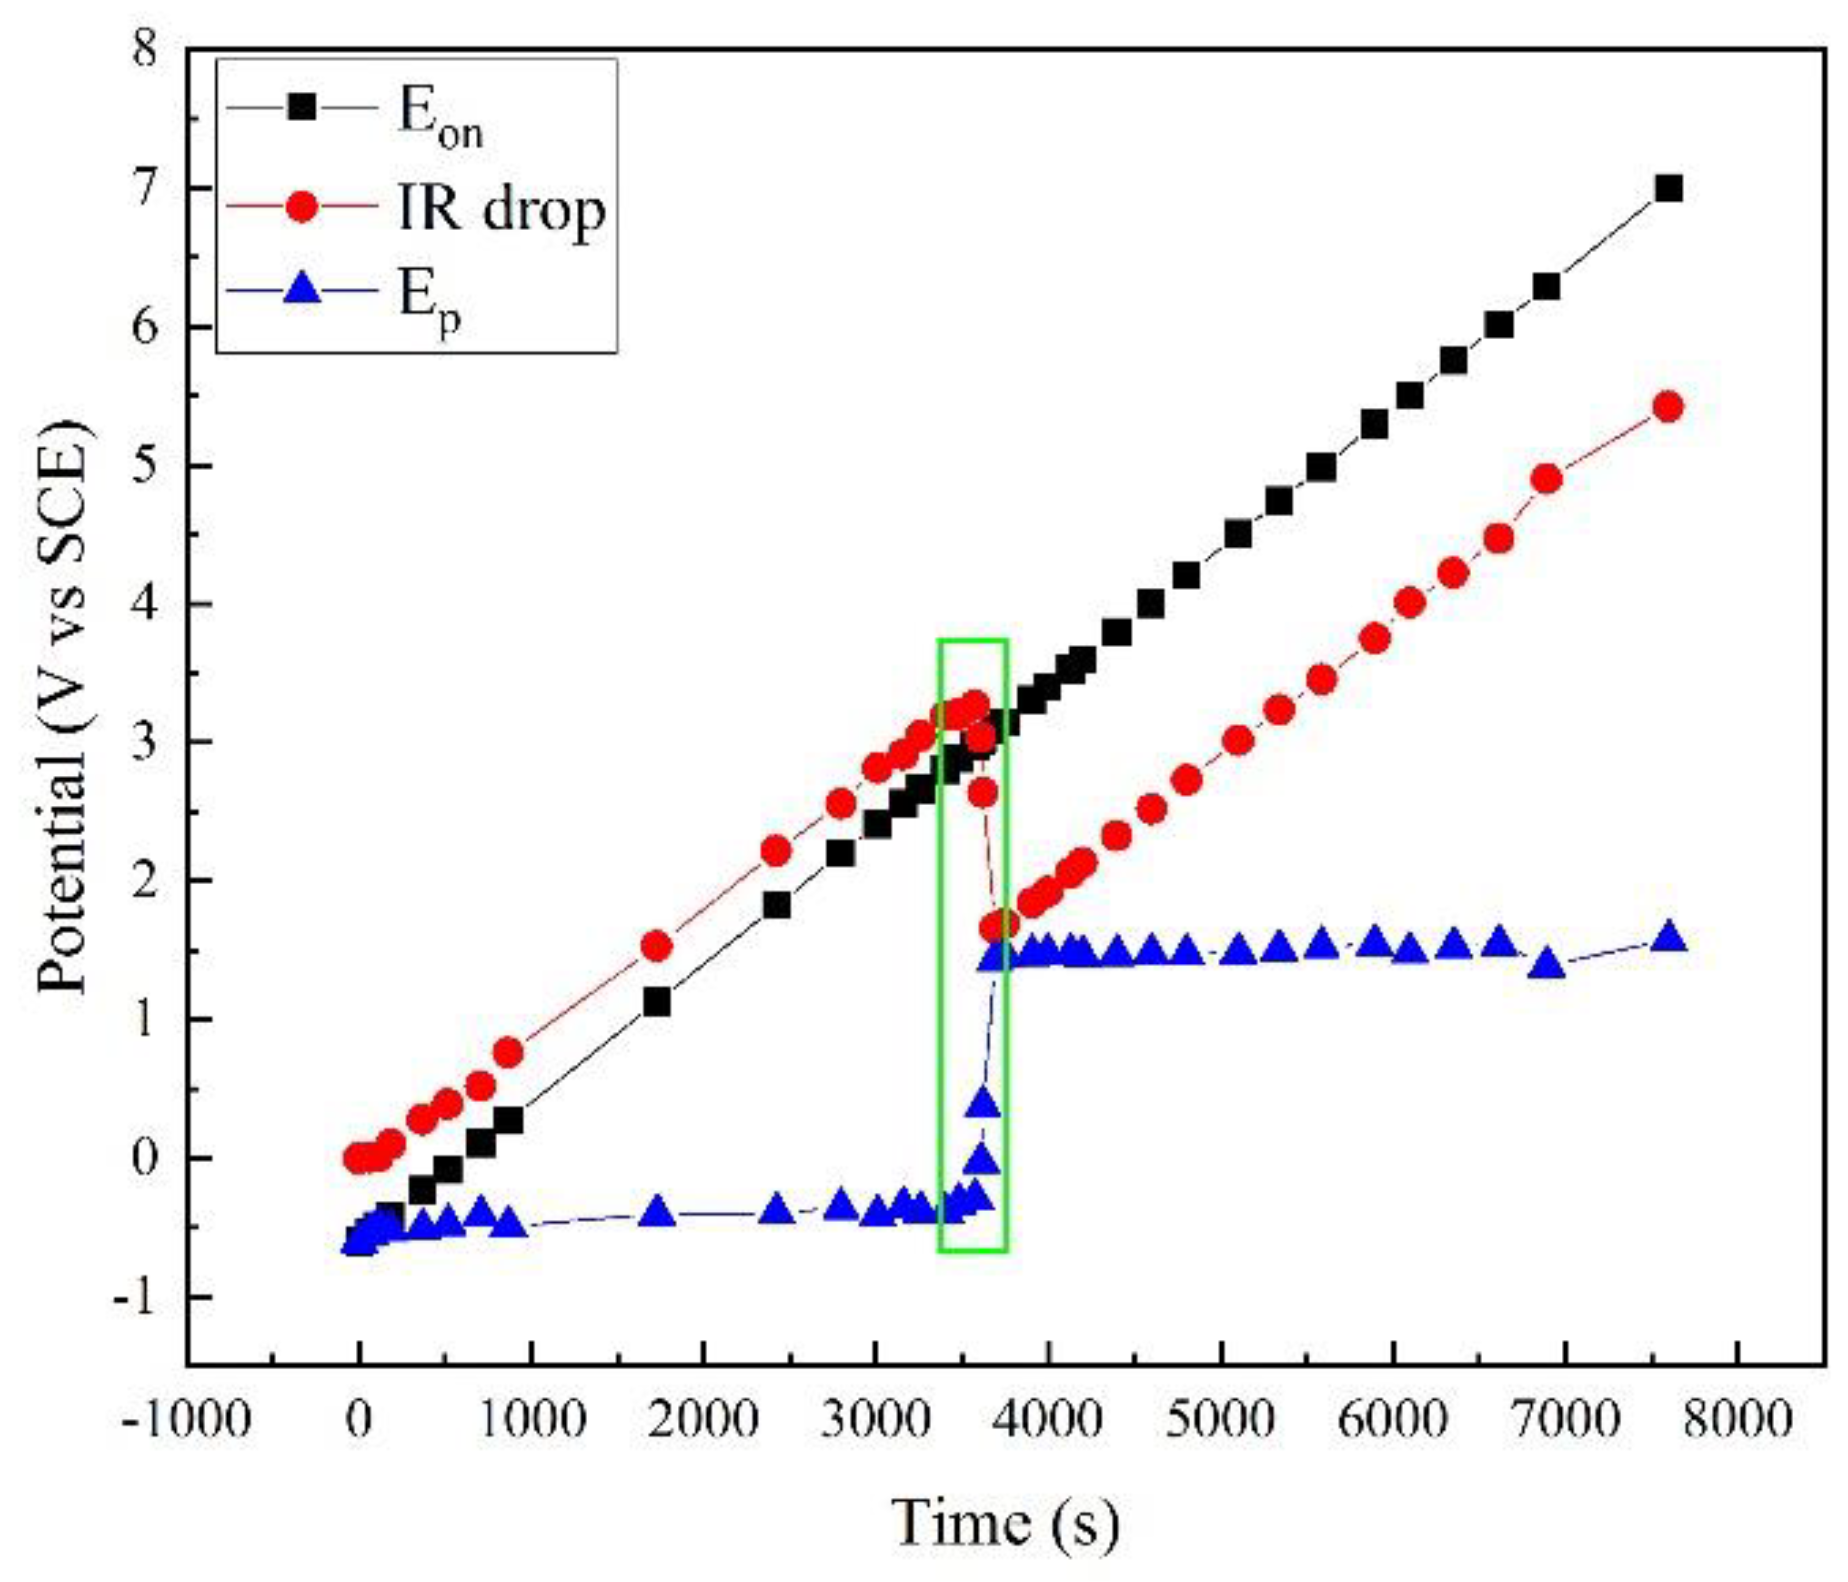
Figure 4.
Comparison of apparent and real polarization curves for X80 steel in 4 g·L−1 Na2SO4 solution.
Figure 4.
Comparison of apparent and real polarization curves for X80 steel in 4 g·L−1 Na2SO4 solution.

Figure 5.
Macro-morphologies of sample surfaces in: Stage 1 (A–B of Figure 4) (a); Stage 2 (B–C of Figure 4) (b); and Stage 3 (C–D of Figure 4) (c).

Figure 6.
Oxygen evolution on the sample surface during the galvanostatic polarization test with a current density of 0.100 A·cm−2.
Figure 6.
Oxygen evolution on the sample surface during the galvanostatic polarization test with a current density of 0.100 A·cm−2.
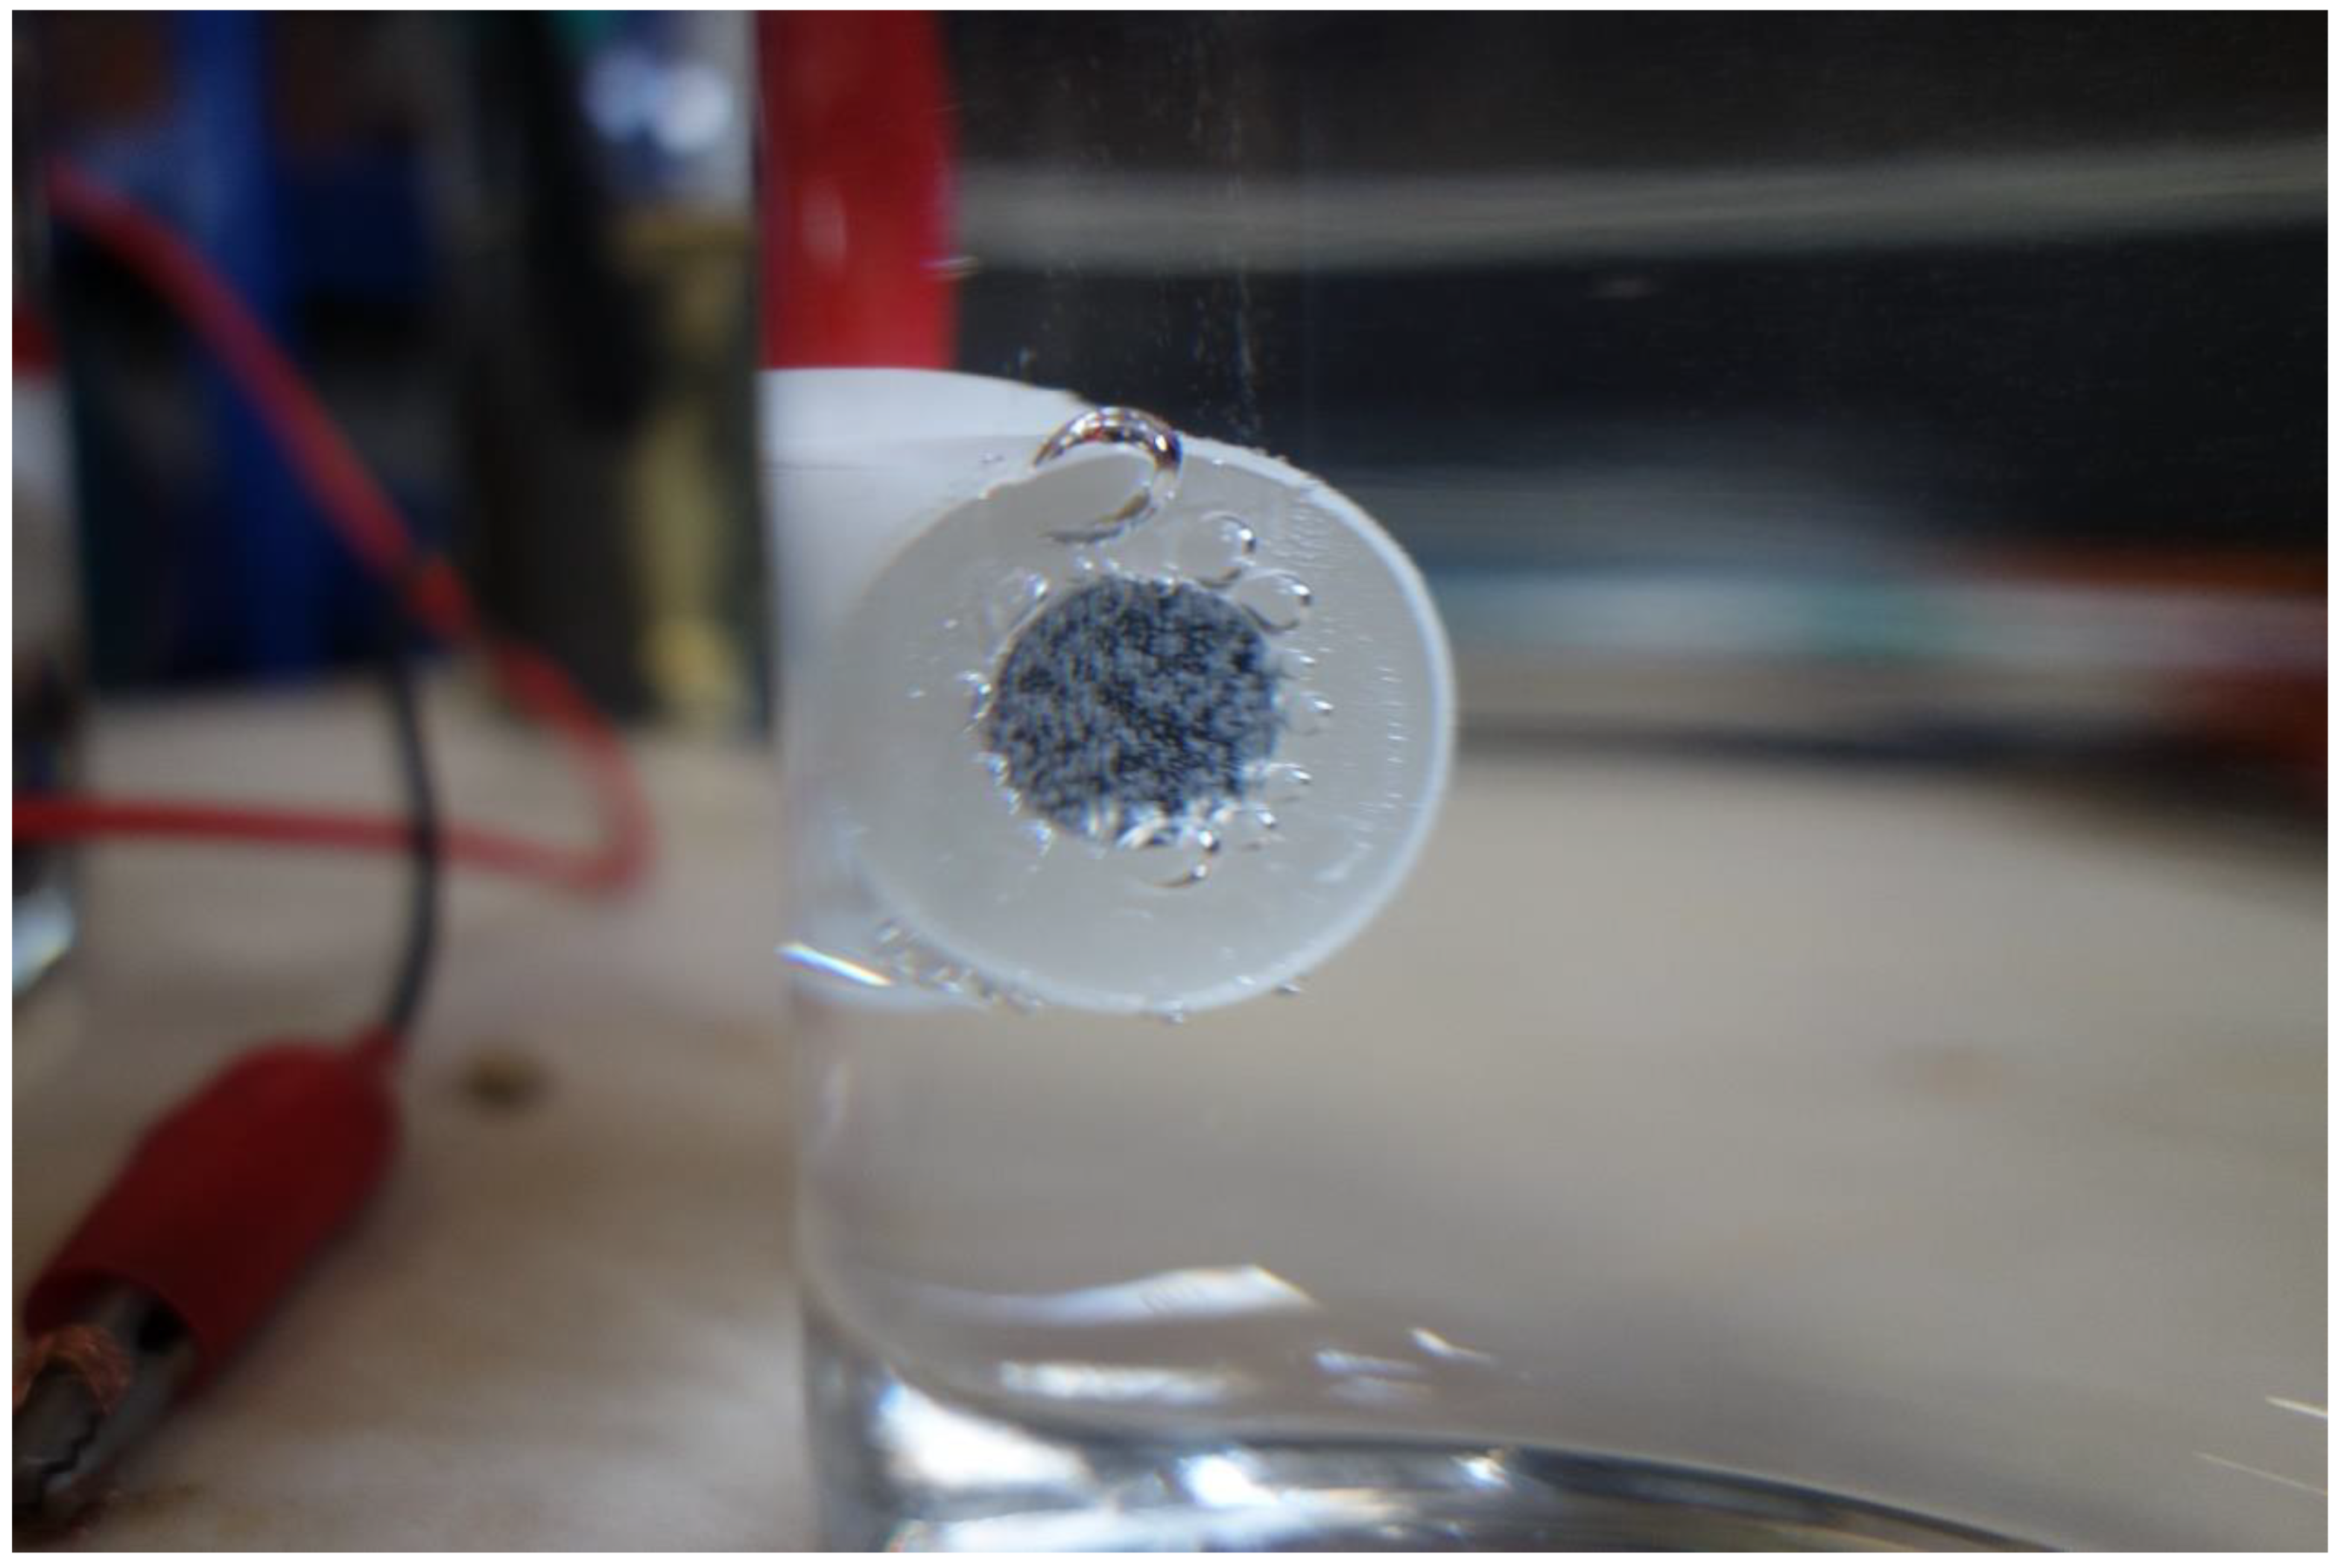
Figure 7.
Micro-morphologies of sample surfaces after the galvanostatic polarization test of: 0.010 A·cm−2 (a); 0.030 A·cm−2 (b); and 0.080 A·cm−2 (c).
Figure 7.
Micro-morphologies of sample surfaces after the galvanostatic polarization test of: 0.010 A·cm−2 (a); 0.030 A·cm−2 (b); and 0.080 A·cm−2 (c).

Figure 8.
Detailed XPS spectra of Fe2p of corrosion products on samples after galvanostatic polarization of: 0.010 A·cm−2 (a); 0.030 A·cm−2 (b); and 0.080 A·cm−2 (c).
Figure 8.
Detailed XPS spectra of Fe2p of corrosion products on samples after galvanostatic polarization of: 0.010 A·cm−2 (a); 0.030 A·cm−2 (b); and 0.080 A·cm−2 (c).
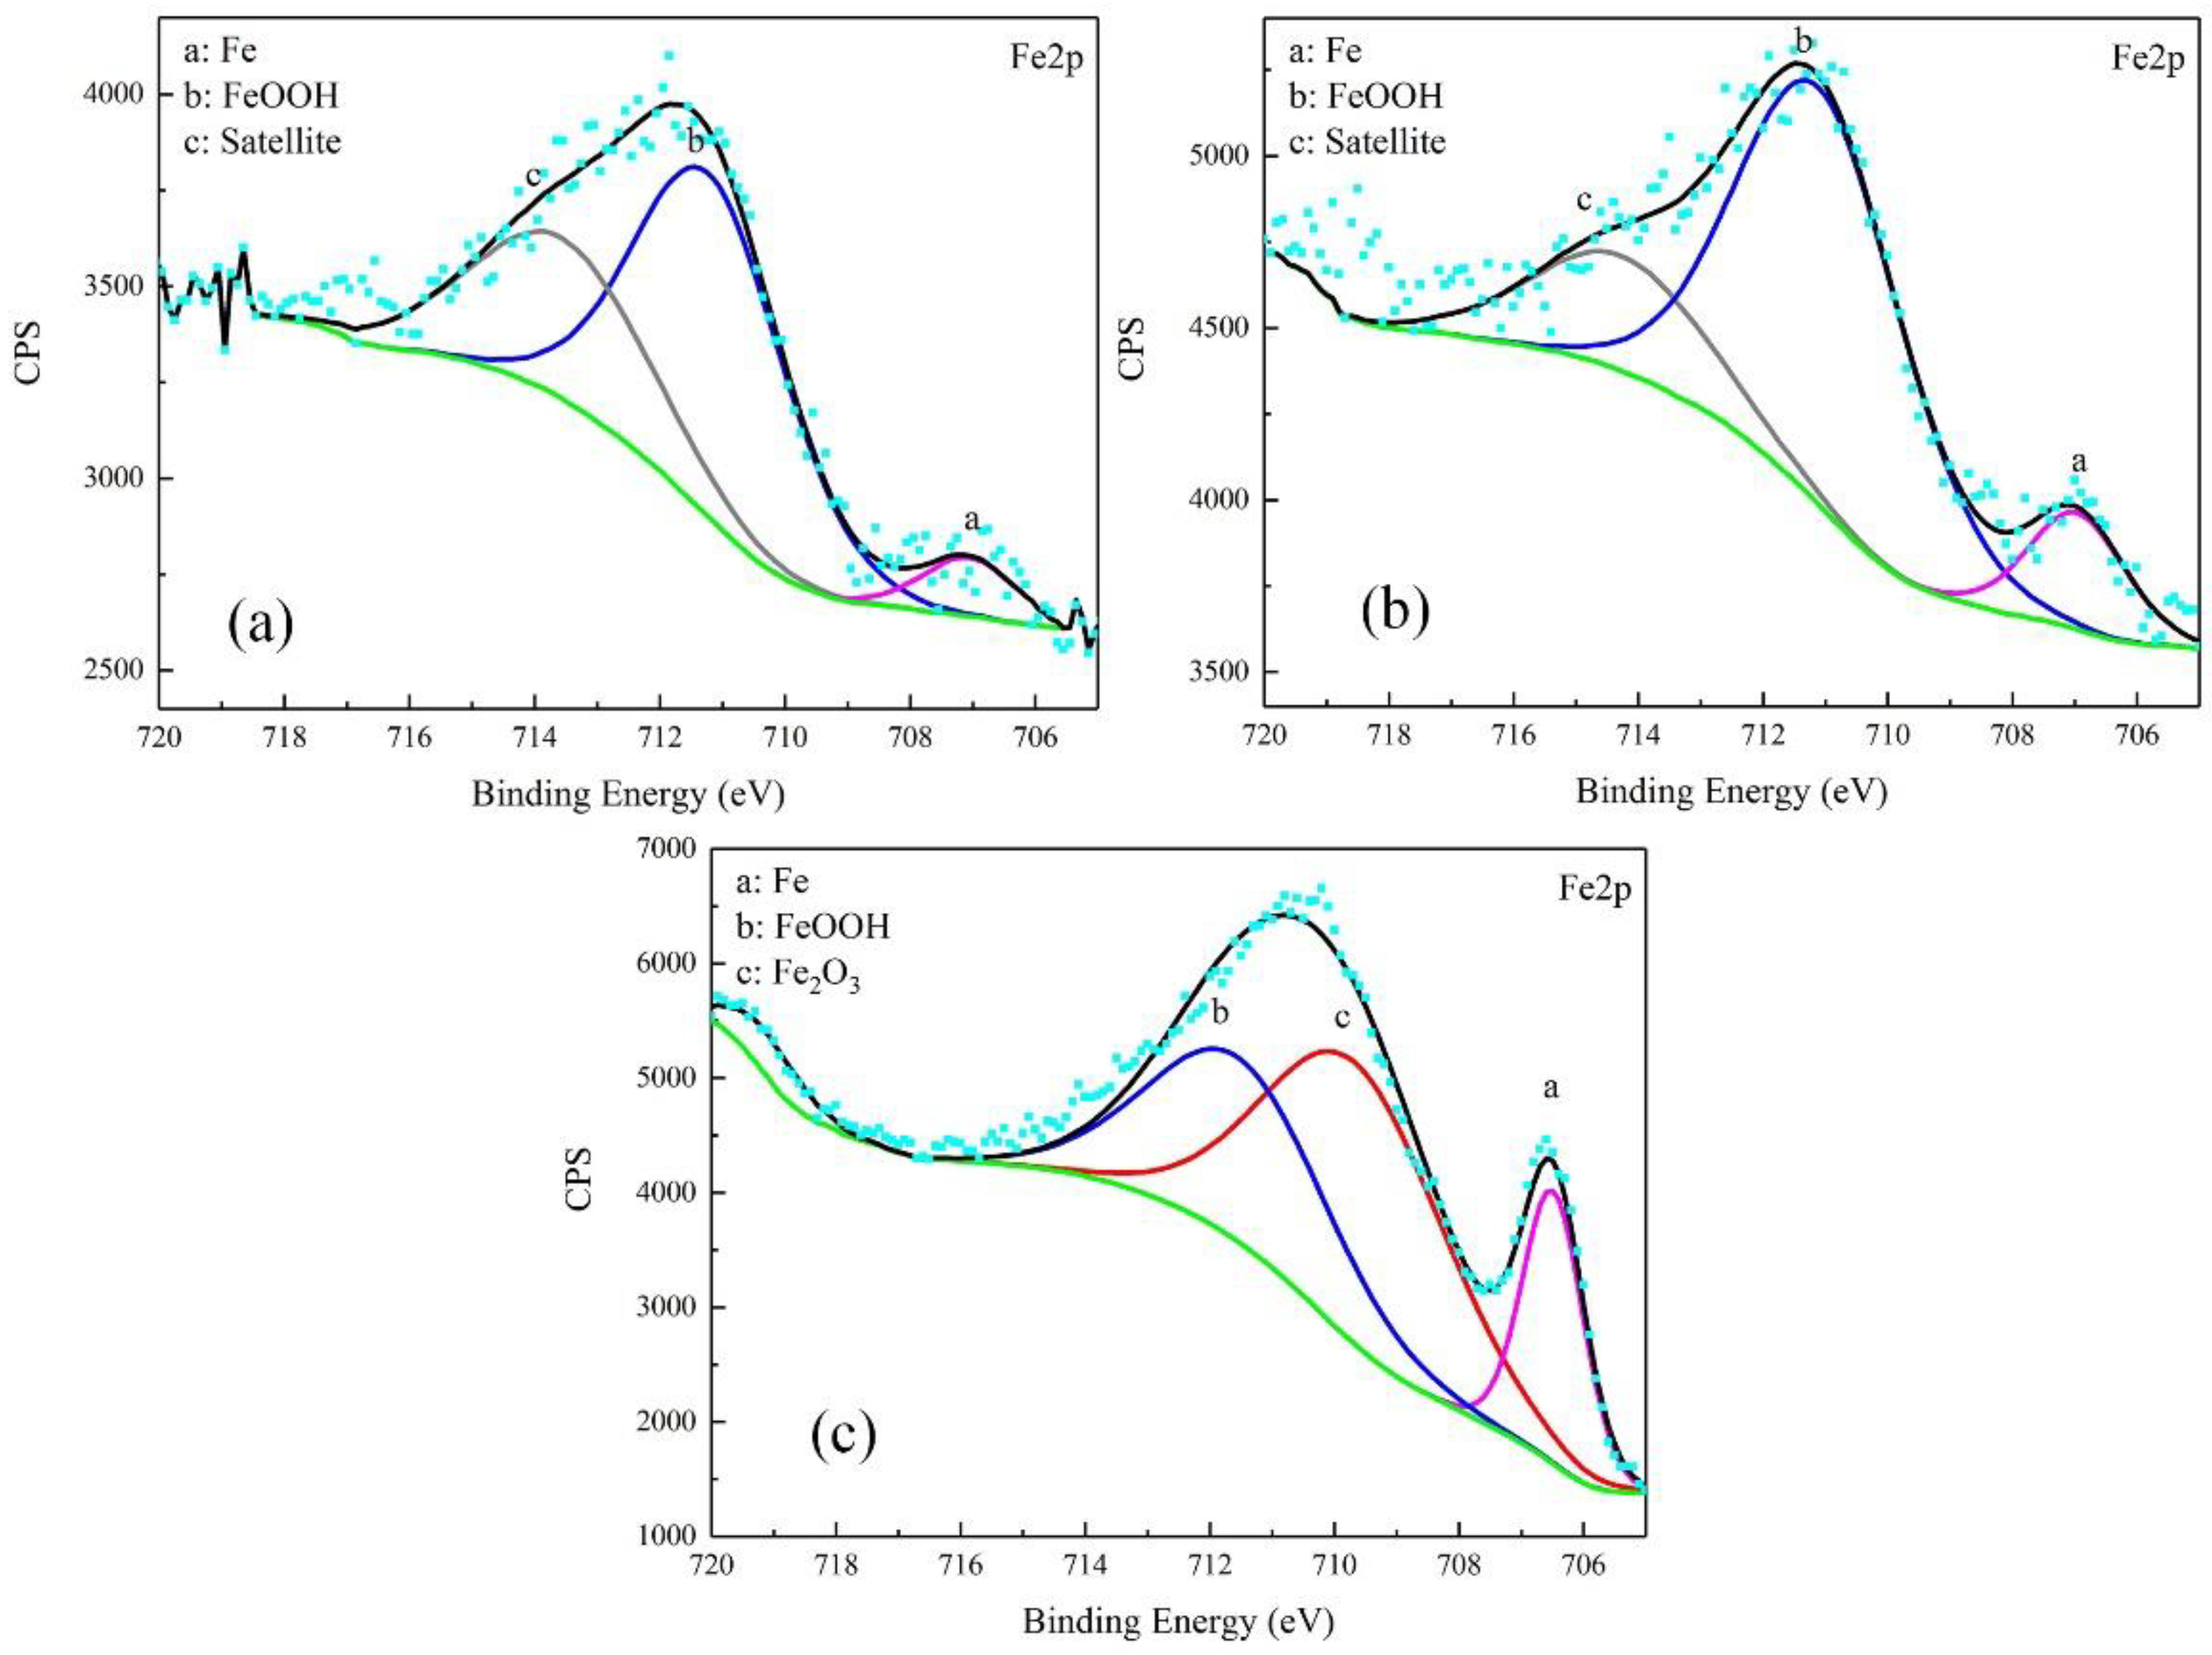
Figure 9.
Detailed XPS spectra of O1s of corrosion products on the samples after galvanostatic polarization of: 0.010 A·cm−2 (a); 0.030 A·cm−2 (b); and 0.080 (c).
Figure 9.
Detailed XPS spectra of O1s of corrosion products on the samples after galvanostatic polarization of: 0.010 A·cm−2 (a); 0.030 A·cm−2 (b); and 0.080 (c).
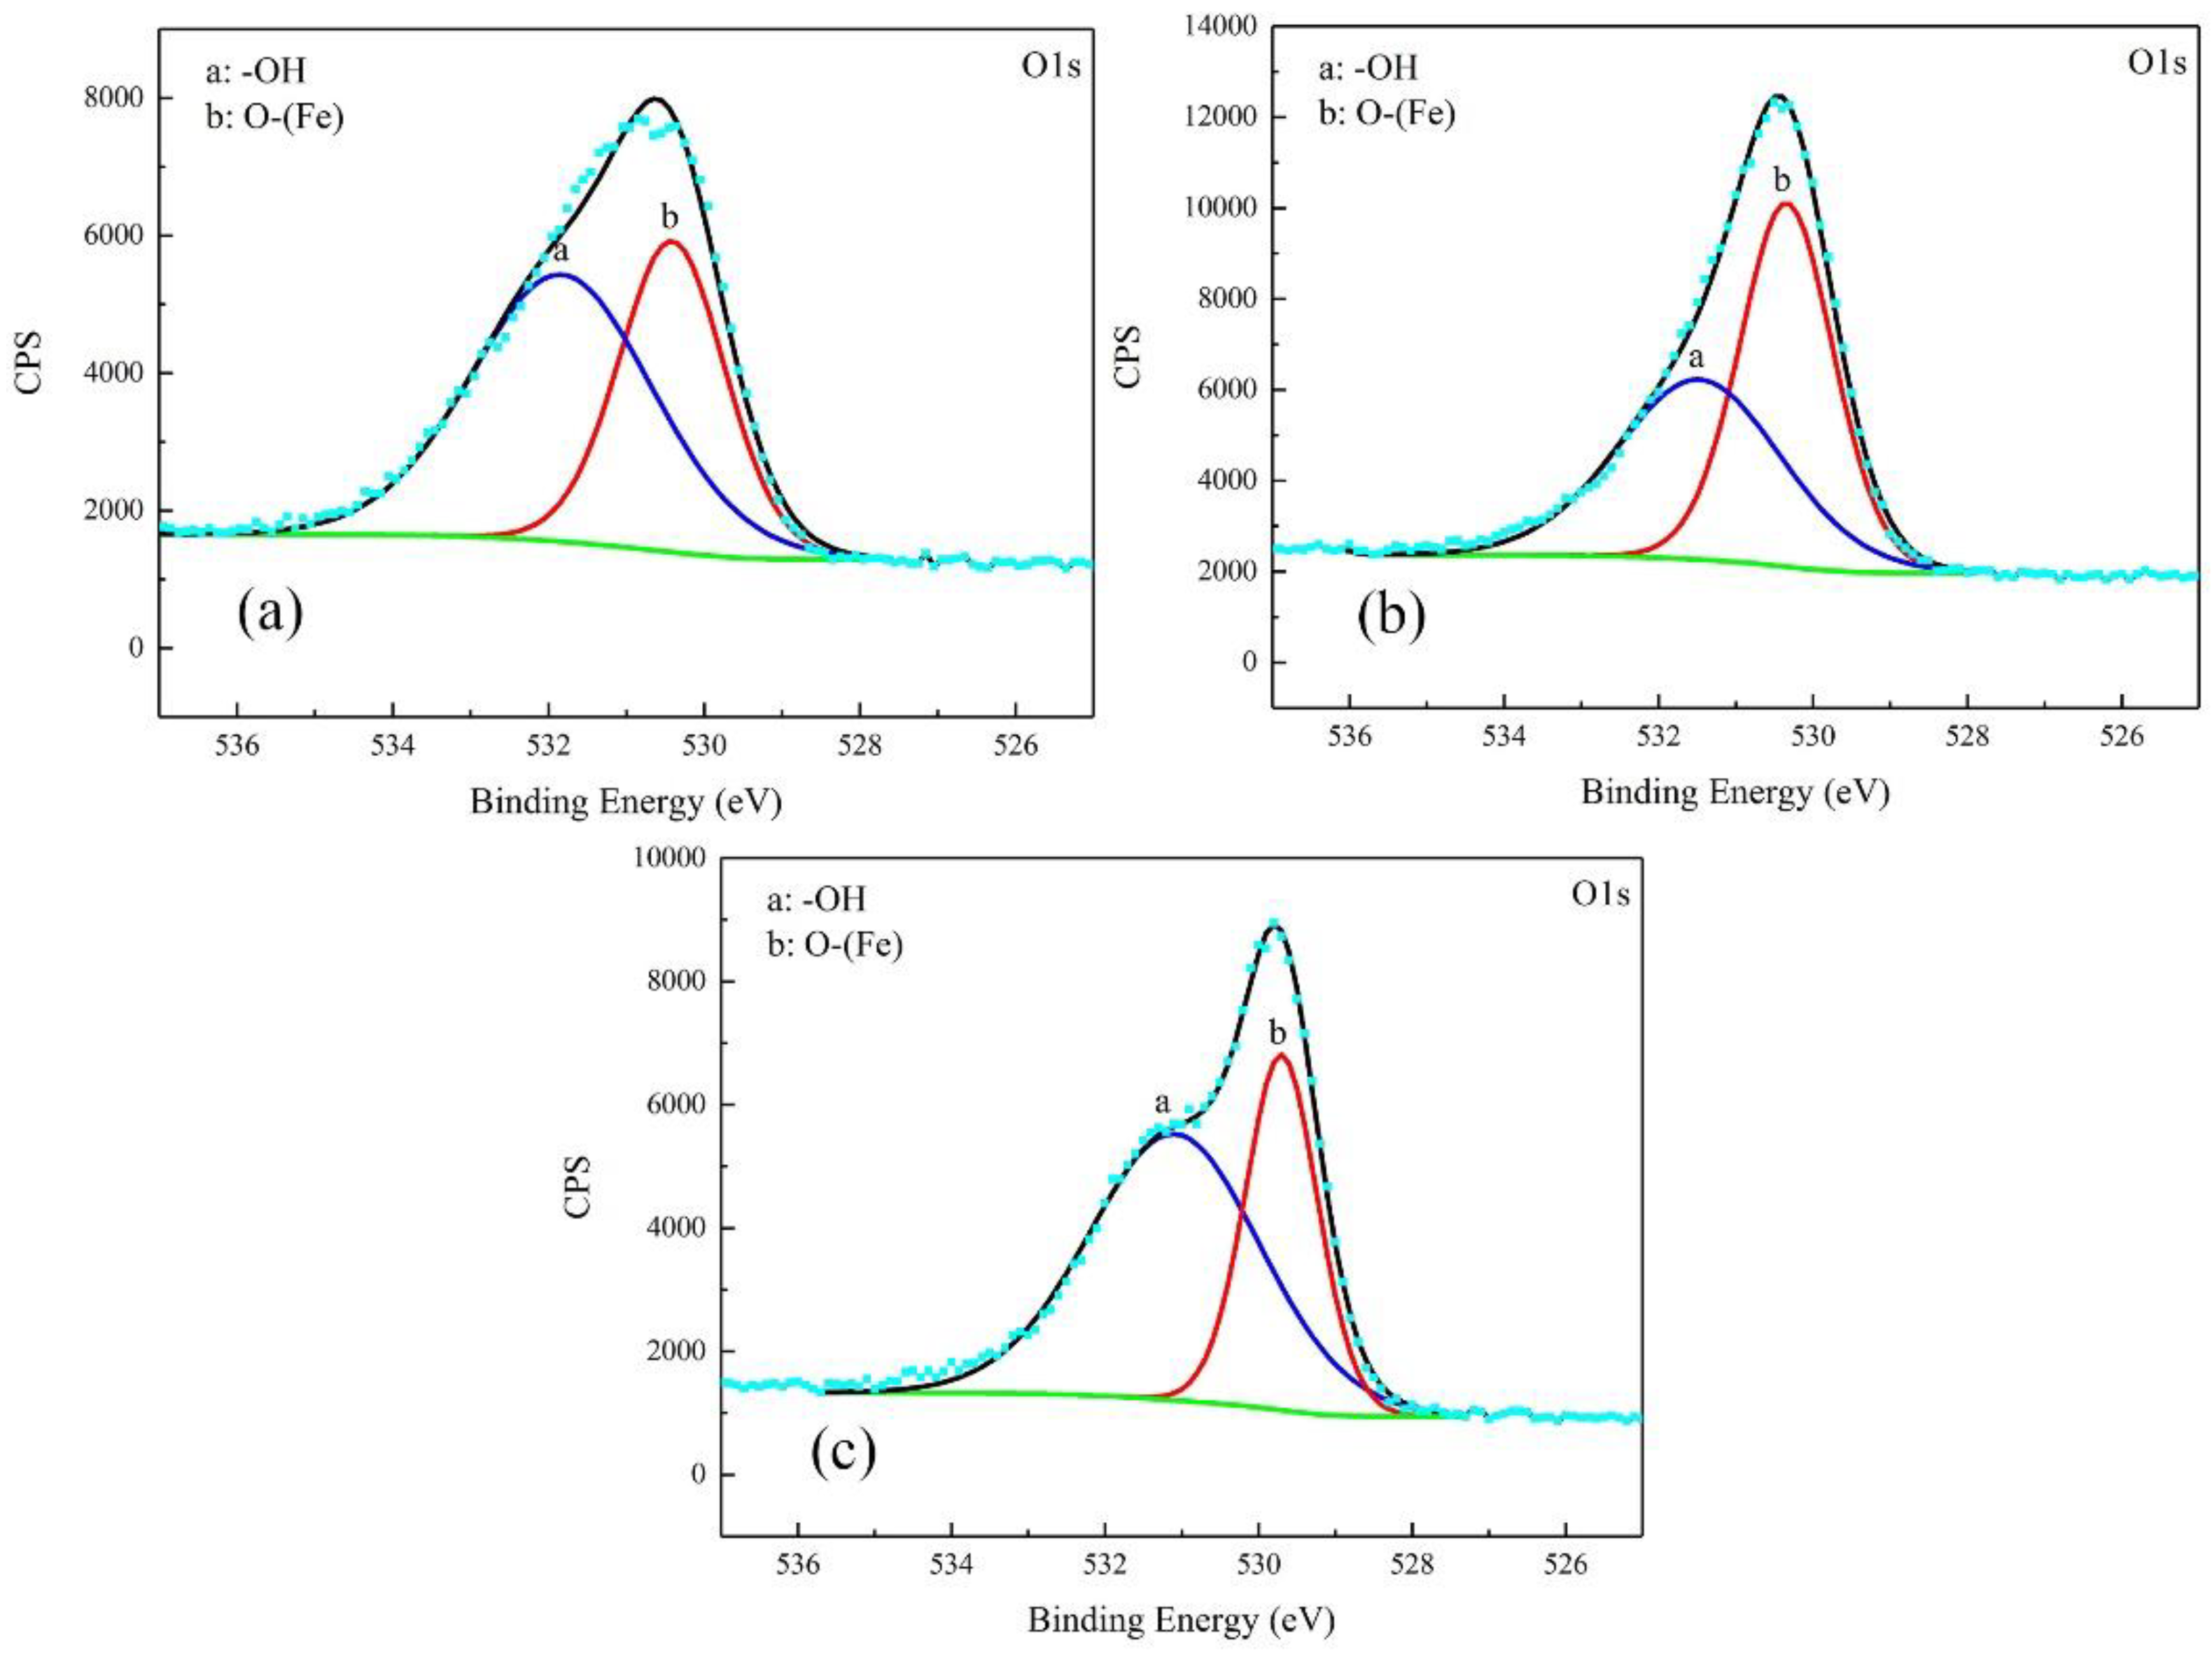
Figure 10.
Comparison of measured and calculated corrosion rates for X80 steel after different galvanostatic polarization tests in 4 g·L−1 Na2SO4 solution.
Figure 10.
Comparison of measured and calculated corrosion rates for X80 steel after different galvanostatic polarization tests in 4 g·L−1 Na2SO4 solution.
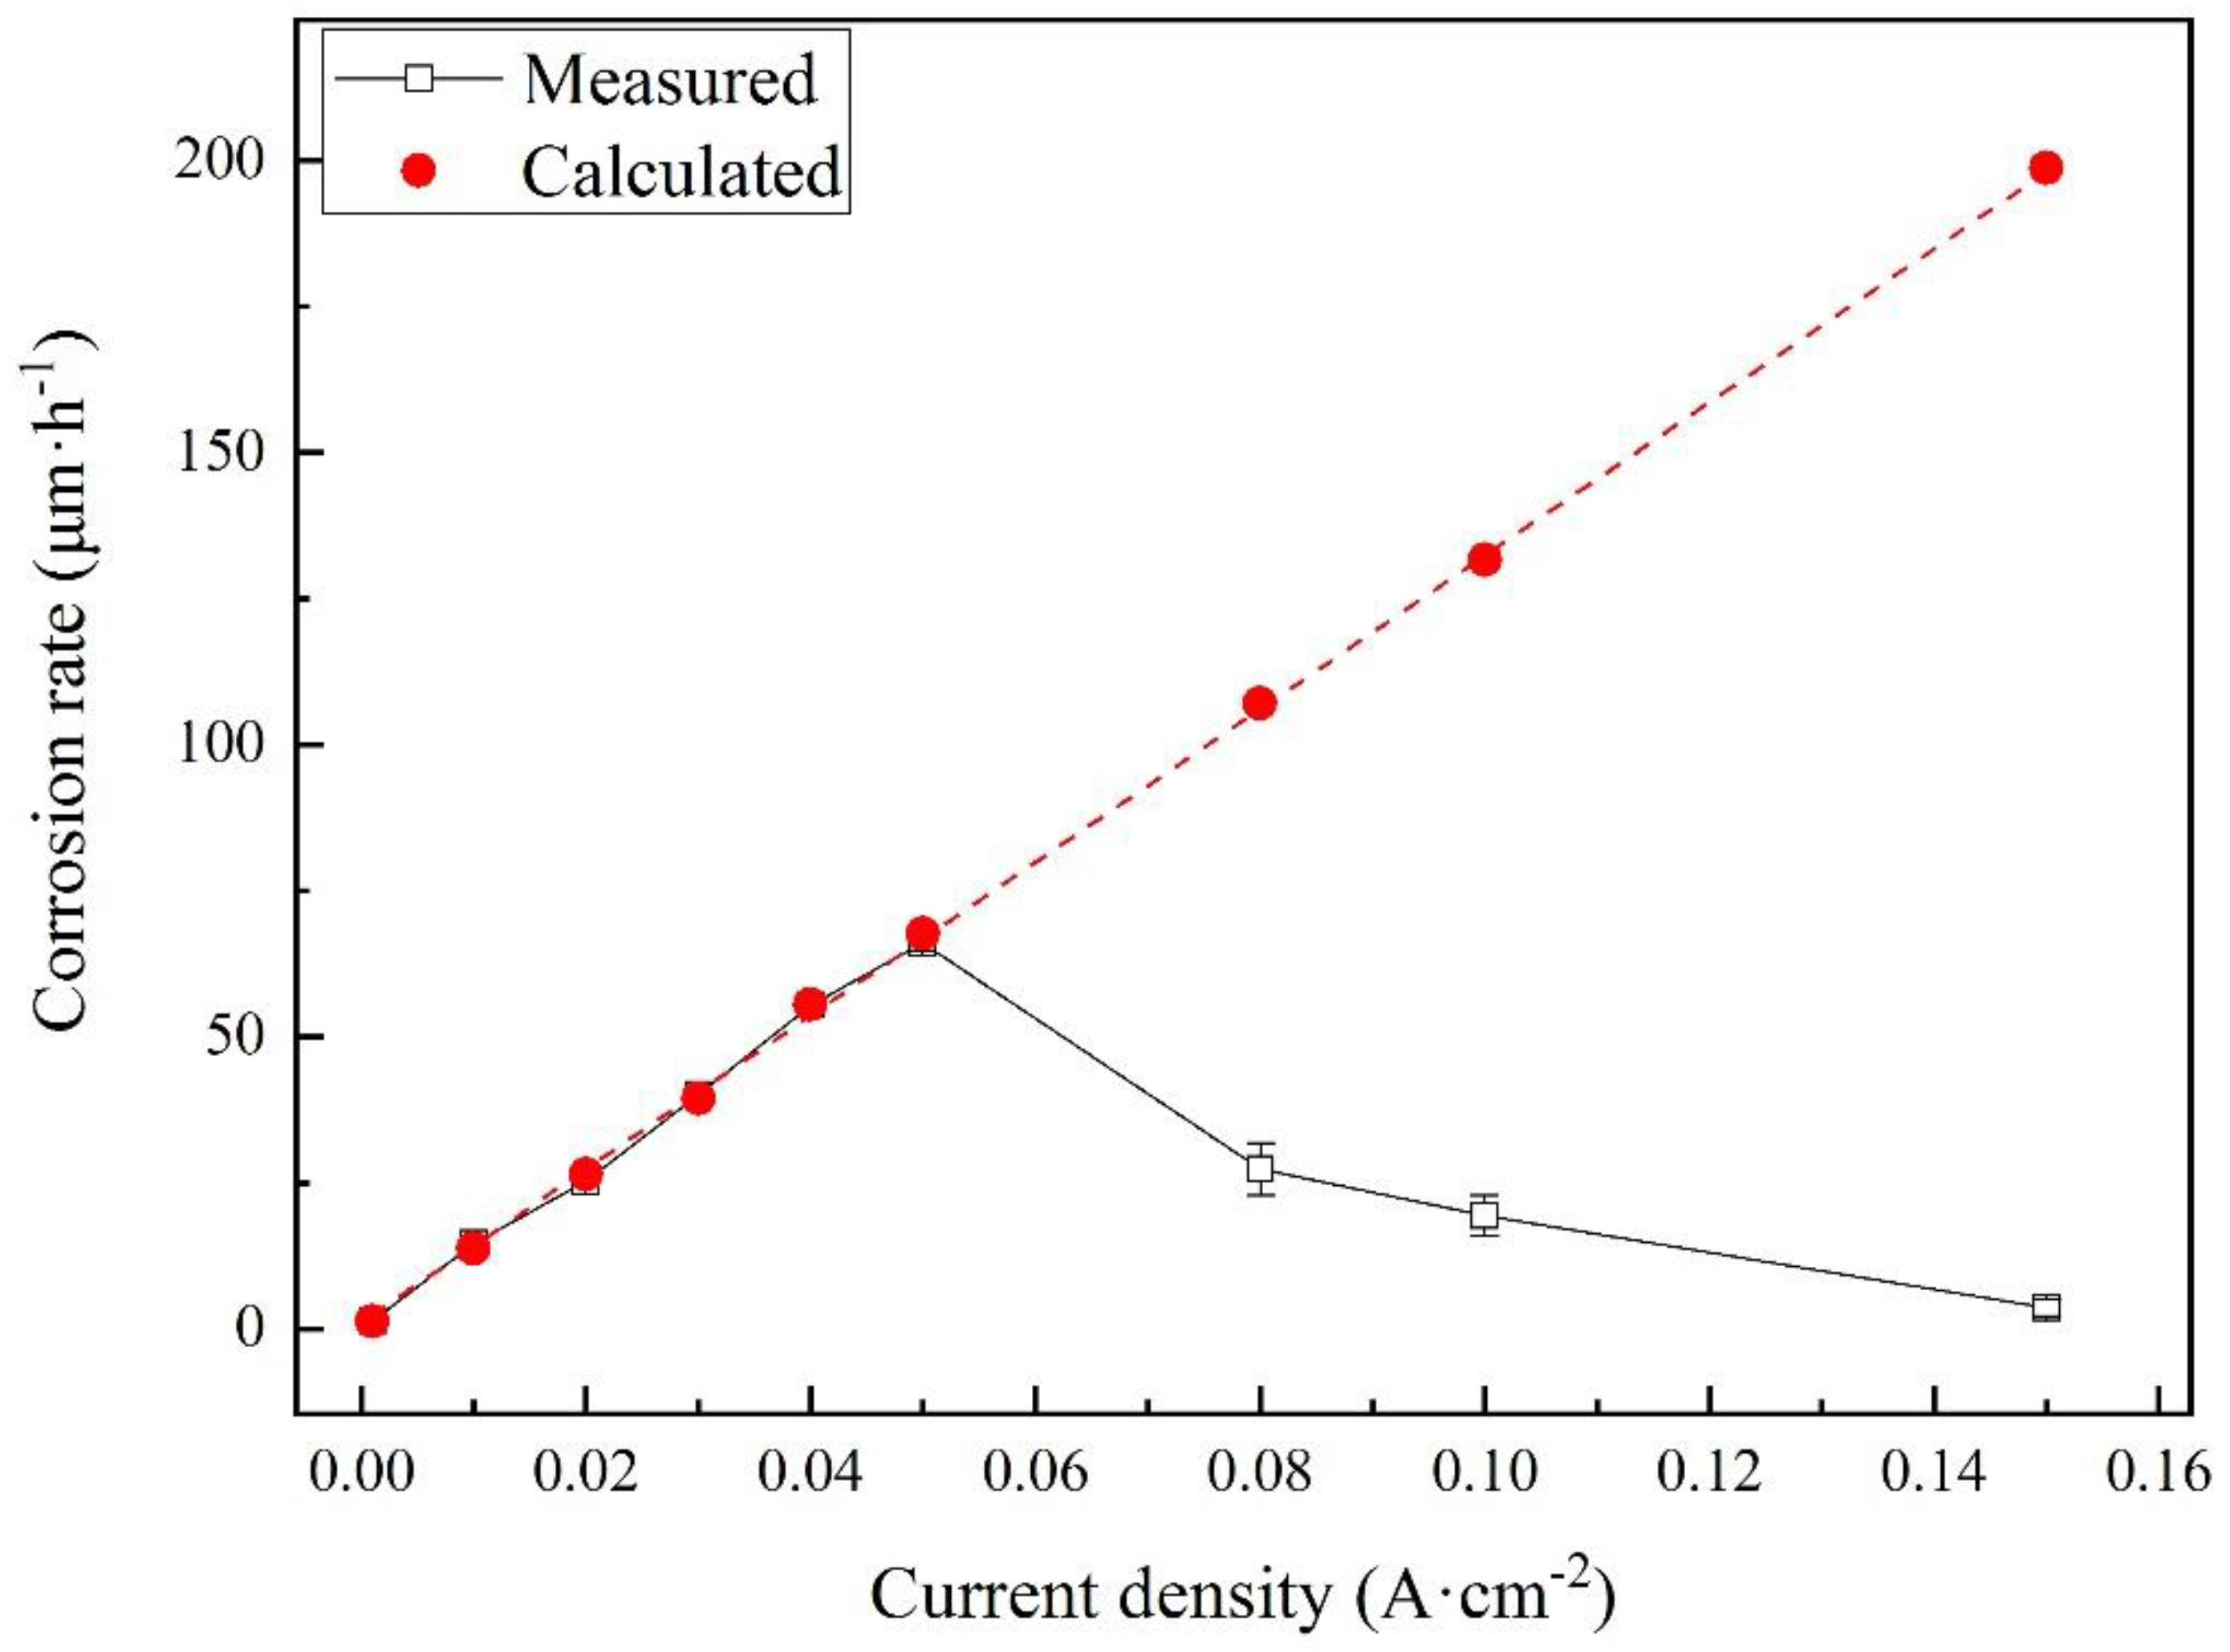
Figure 11.
Schematic diagram of the traditional polarization curve and our experiment result.
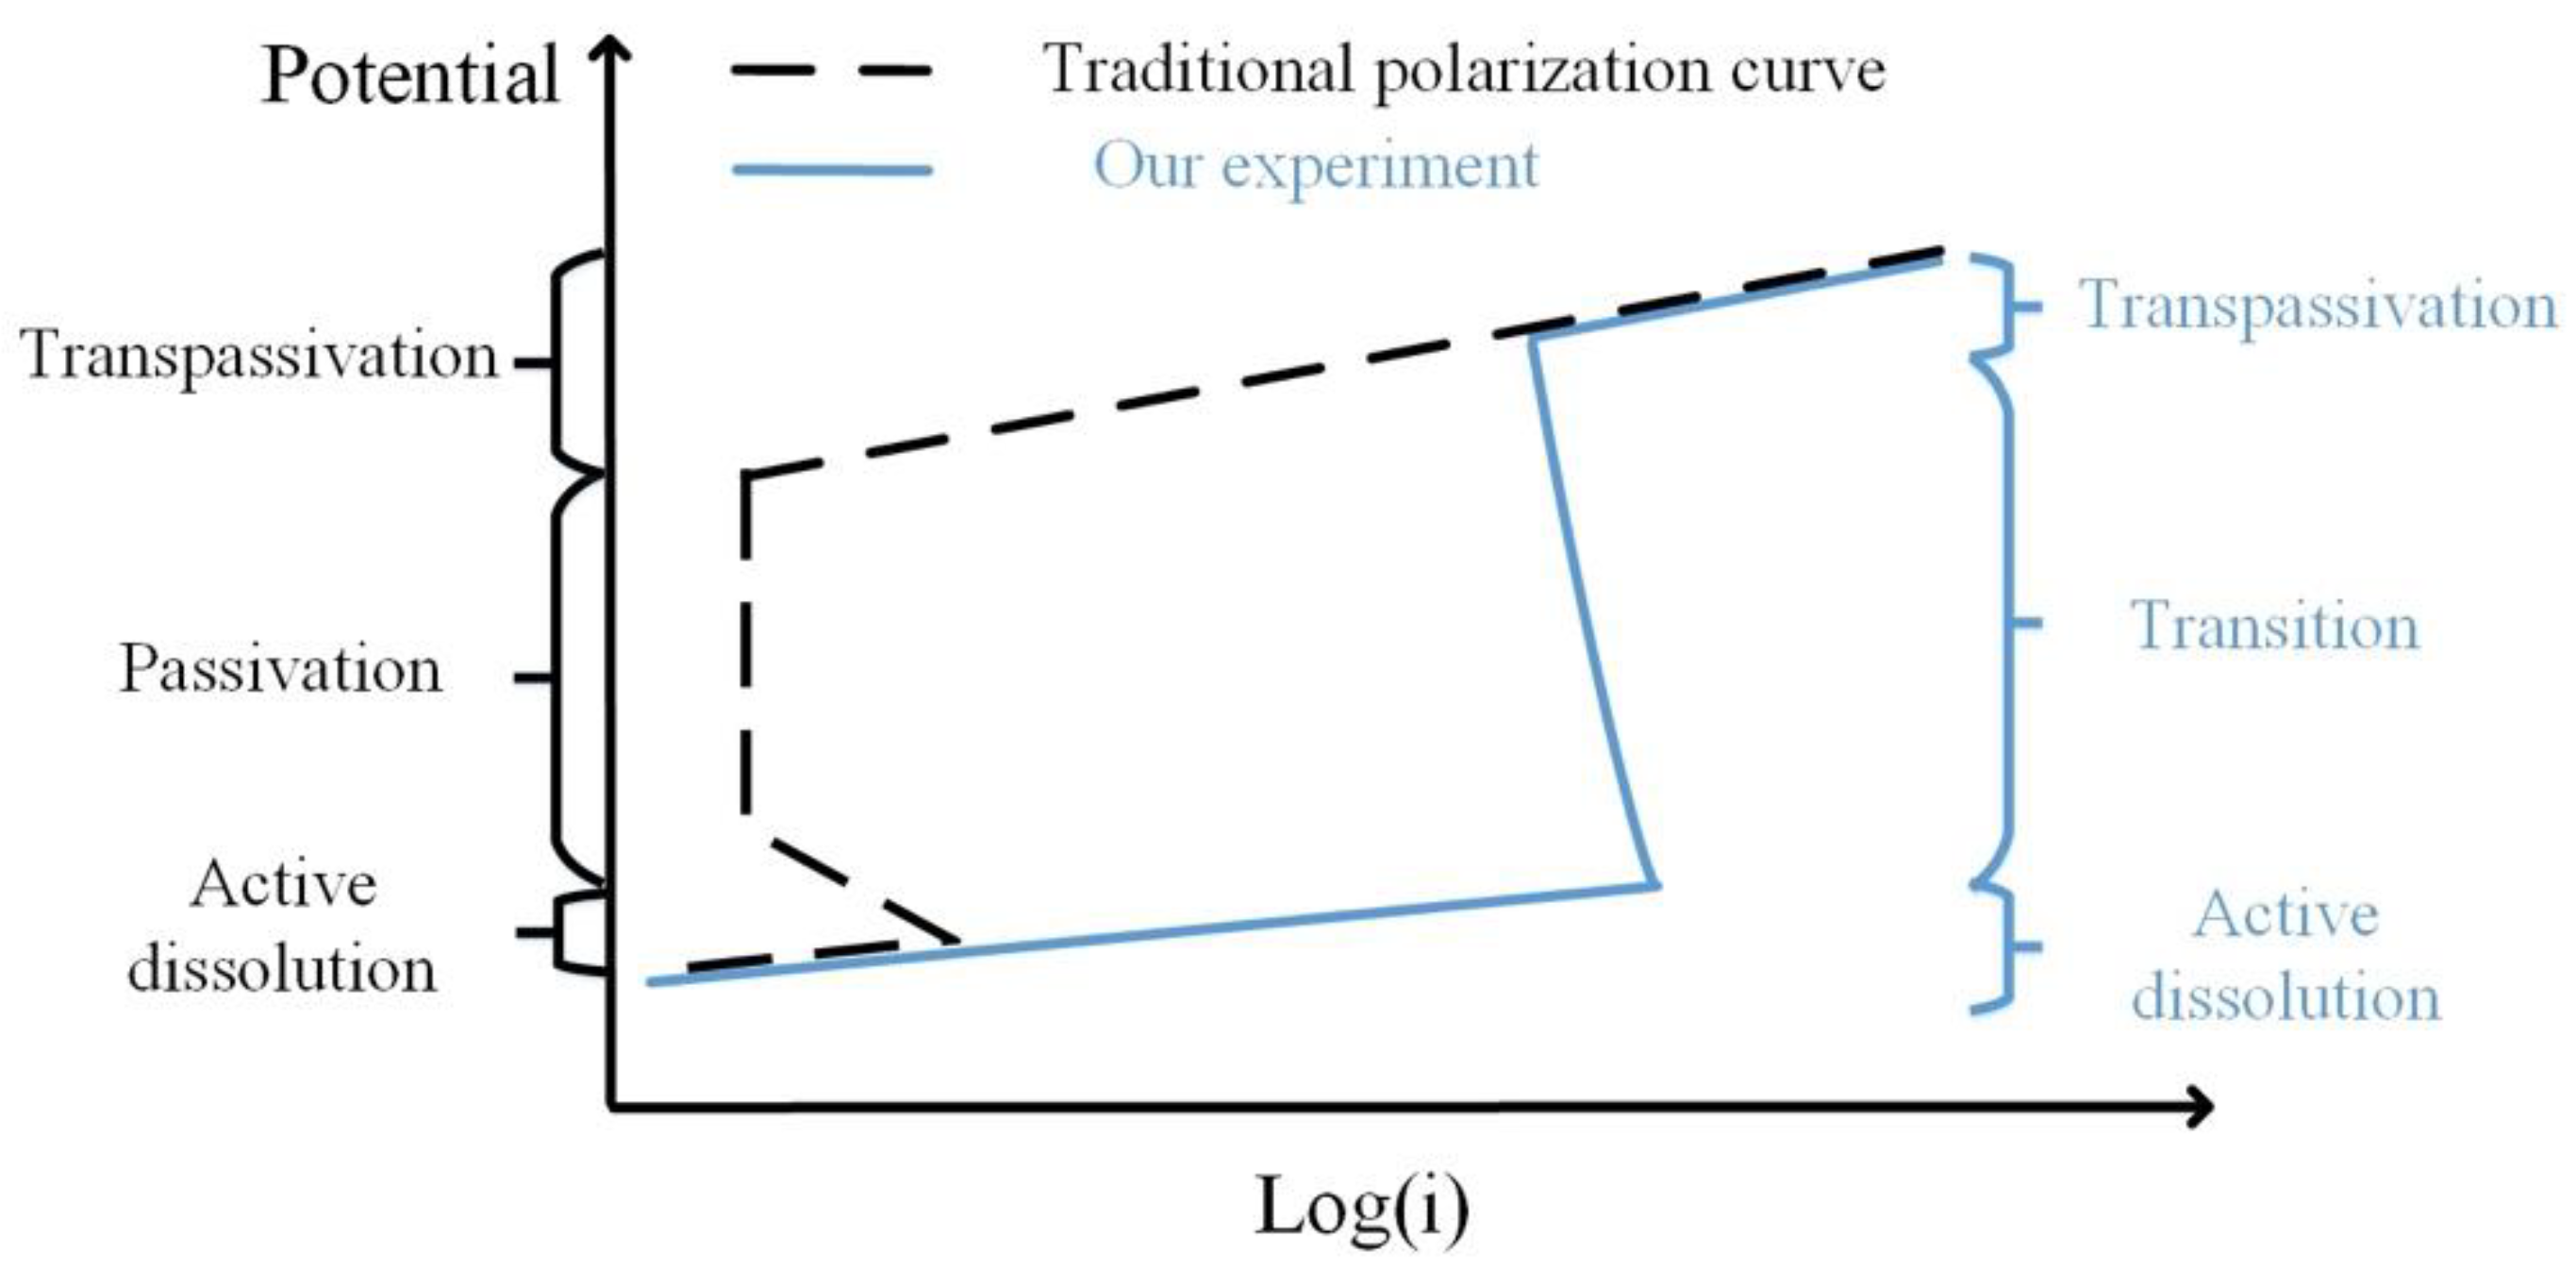
Figure 12.
Reaction model of anodic polarization behavior of X80 steel in 4 g·L−1 Na2SO4 solution.

© 2019 by the authors. Licensee MDPI, Basel, Switzerland. This article is an open access article distributed under the terms and conditions of the Creative Commons Attribution (CC BY) license (http://creativecommons.org/licenses/by/4.0/).
Share and Cite
MDPI and ACS Style
Qin, R.; Du, Y.; Xu, Z.; Lu, M. Anodic Polarization Behavior of X80 Steel in Na2SO4 Solution under High Potential and Current Density Conditions. Materials 2019, 12, 394. https://doi.org/10.3390/ma12030394
AMA Style
Qin R, Du Y, Xu Z, Lu M. Anodic Polarization Behavior of X80 Steel in Na2SO4 Solution under High Potential and Current Density Conditions. Materials. 2019; 12(3):394. https://doi.org/10.3390/ma12030394
Chicago/Turabian StyleQin, Runzhi, Yanxia Du, Zhenchang Xu, and Minxu Lu. 2019. "Anodic Polarization Behavior of X80 Steel in Na2SO4 Solution under High Potential and Current Density Conditions" Materials 12, no. 3: 394. https://doi.org/10.3390/ma12030394
Note that from the first issue of 2016, this journal uses article numbers instead of page numbers. See further details here.