3.1. Influence of Lithium Salts on the Performance of the Fe(II)-NHC DSCs
As discussed above, lithium ions, typically introduced as the salt LiI, are commonly used as an additive in electrolytes in DSCs because they enhance electron injection into the semiconductor [
31,
53]. The I
− counterion may also modify the potential of the I
−/I
3− redox shuttle. When a current is flowing, the iodide and triiodide concentrations deviate from equilibrium, resulting in a potential shift, according to the Nernst equation [
60]. We, therefore, decided to investigate the effects of incorporating LiI or LiPF
6 additives and have screened a number of electrolytes, the compositions of which are given in
Table 1.
Our starting point was an electrolyte composition consisting of LiI (0.1 M), I
2 (0.05 M), and one of the ionic liquids (0.6 M) 1-propyl-3-methylimidazolium iodide (PMII) or 1-butyl-3-methylimidazolium iodide (BMII). Electrolytes PMIIa and PMIIb, as well as electrolytes BMIIa and BMIIb, differ only in the Li
+ salt (LiI or LiPF
6, respectively,
Table 1). Interestingly, the trend in the
JSC values is different for PMII and BMII ILs (
Table 2 and
Table S2). In the case of PMII, we observe an increase in
JSC from 2.34 to 2.71 mA cm
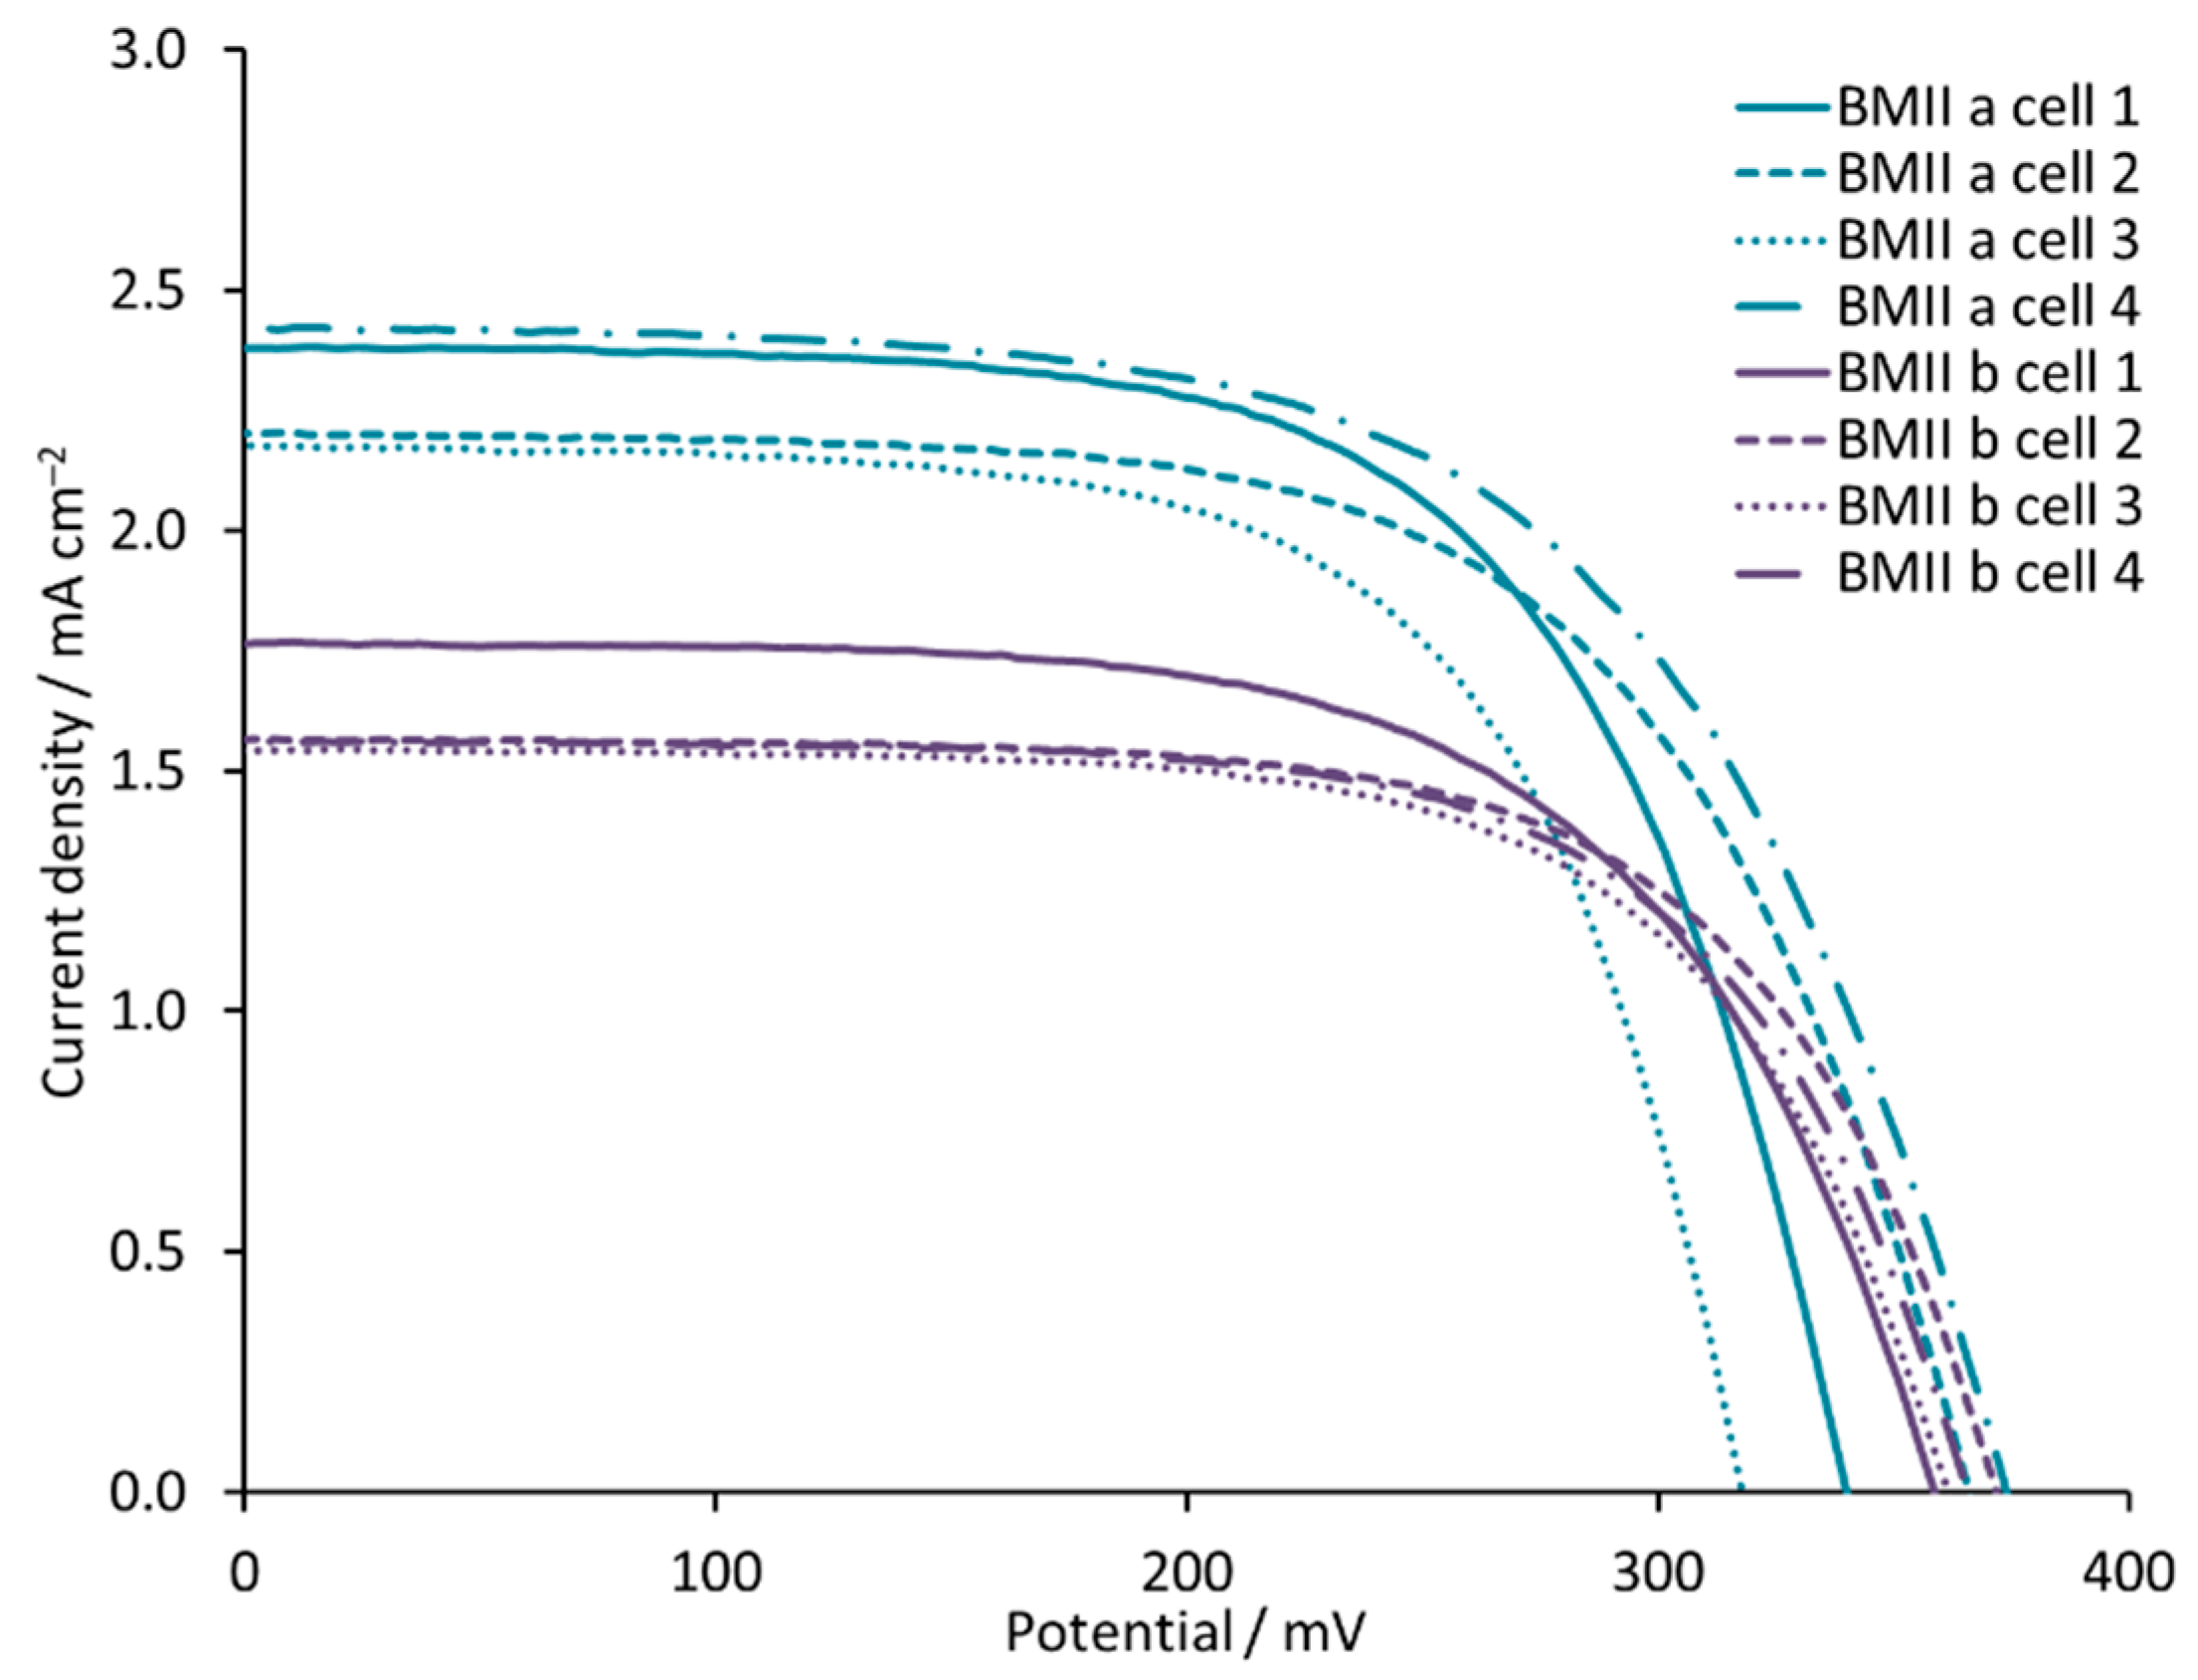
−2 on going from PMIIa to PMIIb, but, for BMII, the
JSC values decrease from 2.42 mA cm
−2 for BMIIa to 1.77 mA cm
−2 for BMIIb. This trend is confirmed with multiple cells (
Figure 3). For both ILs, the change from LiI to LiPF
6 results in lower
VOC,
ff, and overall PCE. An increase in the concentrations of LiI and LiPF
6 changes the performance for DSCs with both PMII and BMII ILs. A 0.18 M concentration of Li
+ ions leads to an increase in
JSC and PCE compared to a 0.1 M concentration (
Figure 4). Electrolytes PMIIc and PMIId both contain 0.18 M Li
+ but differ in the counterion (
Table 1). An enhanced
VOC of 315 mV and a lower
JSC of 3.01 mA cm
−2 for DSCs with PMIIc compared to 281 mV of
VOC and 3.91 mA cm
−2 of
JSC for PMIId result in similar PCE values of 0.59% (10.5% relative to 100% set for N719) for DSCs containing both these electrolytes. We use a relative efficiency because this allows comparisons of data, for example when recorded on different solar simulators or within different laboratories [
61]. However, a different trend is observed for BMIIc and BMIId, both of which contain 0.18 M Li
+ but a different counterion (
Table 2). DSCs with BMIIc perform slightly better with PCE of 0.61%, than those with BMIId with PCE of 0.58%. A further increase of LiI concentration from 0.18 M to 0.26 M for DSCs with the BMII based electrolyte is followed by a loss in
JSC from 3.40 to 3.02 mA cm
−2 but no change in
VOC (
Table 2,
Figure 4, and
Figure S2 in Supporting Information). This leads to a value of PCE = 0.56% for the DSC with a BMIIe electrolyte. The change to 0.34 M LiI for BMIIf results in an increase in PCE to 0.64% with
JSC of 3.45 mA cm
−2 and
VOC of 307 mV. The trends in the
J–V curves for DSCs with electrolytes BMIIc-f are significant because, typically, it is observed that an improvement in either
JSC or
VOC is offset by a decrease in
VOC or
JSC, respectively.
It is important to note that, in the case of ILs with an iodide counterion, both this and LiI contribute I
− to the redox couple. In an investigation that focuses on the influence of Li
+ ions, it is critical that the concentration of I
− is constant. The initial electrolyte BMIIa contains LiI (0.1 M) and BMII (0.6 M) with a total iodide concentration of 0.7 M. With an increase of LiI in the electrolyte, the total I
− concentration increases as well. To keep it constant, we decreased the amount of IL present in the electrolyte. On going from electrolyte BMIIa (LiI 0.1 M, BMII 0.6 M) to BMIIg (LiI 0.18 M, BMII 0.52 M), BMIIh (LiI 0.26 M, BMII 0.44 M) and BMIIi (LiI 0.34 M, BMII 0.36 M),
JSC values are enhanced in the range of 2.42–3.61 mA cm
−2. This rise leads to a better PCE up to 0.63%, despite the loss in
VOC from 374 to 301 mV for BMIIh. A further increase in LiI and decrease in BMII IL concentration leads to the loss of PCE due to the low
VOC values of 264 mV. A similar trend is observed for PMIIa and PMIIe electrolytes. The improved
JSC of 2.80 mA cm
−2 for PMIIe compared to 2.34 mA cm
−2 for PMIIa leads to a higher PCE of 0.64%. For the electrolytes with 1-propyl-2,3-dimethylimidazolium iodide IL, a higher concentration of LiI is beneficial. The change from PDMIIa to PDMIIb results in a small decrease of
JSC from 3.27 to 3.21 mA cm
−2, of
VOC from 348 to 337 mV and of PCE from 0.66% to 0.62%, respectively (
Figure 5 and
Figure S3 in Supporting Information). It is significant to note that a PCE of 0.66% corresponds to a relative efficiency of 11.8% with respect to N719 set at 100% [
61], which is the highest yet observed value for an iron(II)-NHC dye.
DSCs with electrolytes from PMIIa to BMIId listed in
Table 2 all exhibit broad external quantum efficiency (EQE) spectra in the range of 430–570 nm (
Figures S4 and S5) consistent with previous reports [
45,
54]. The value of EQE
max does not change on going from PMIIa to PMIIb and is ≈17–20% at λ
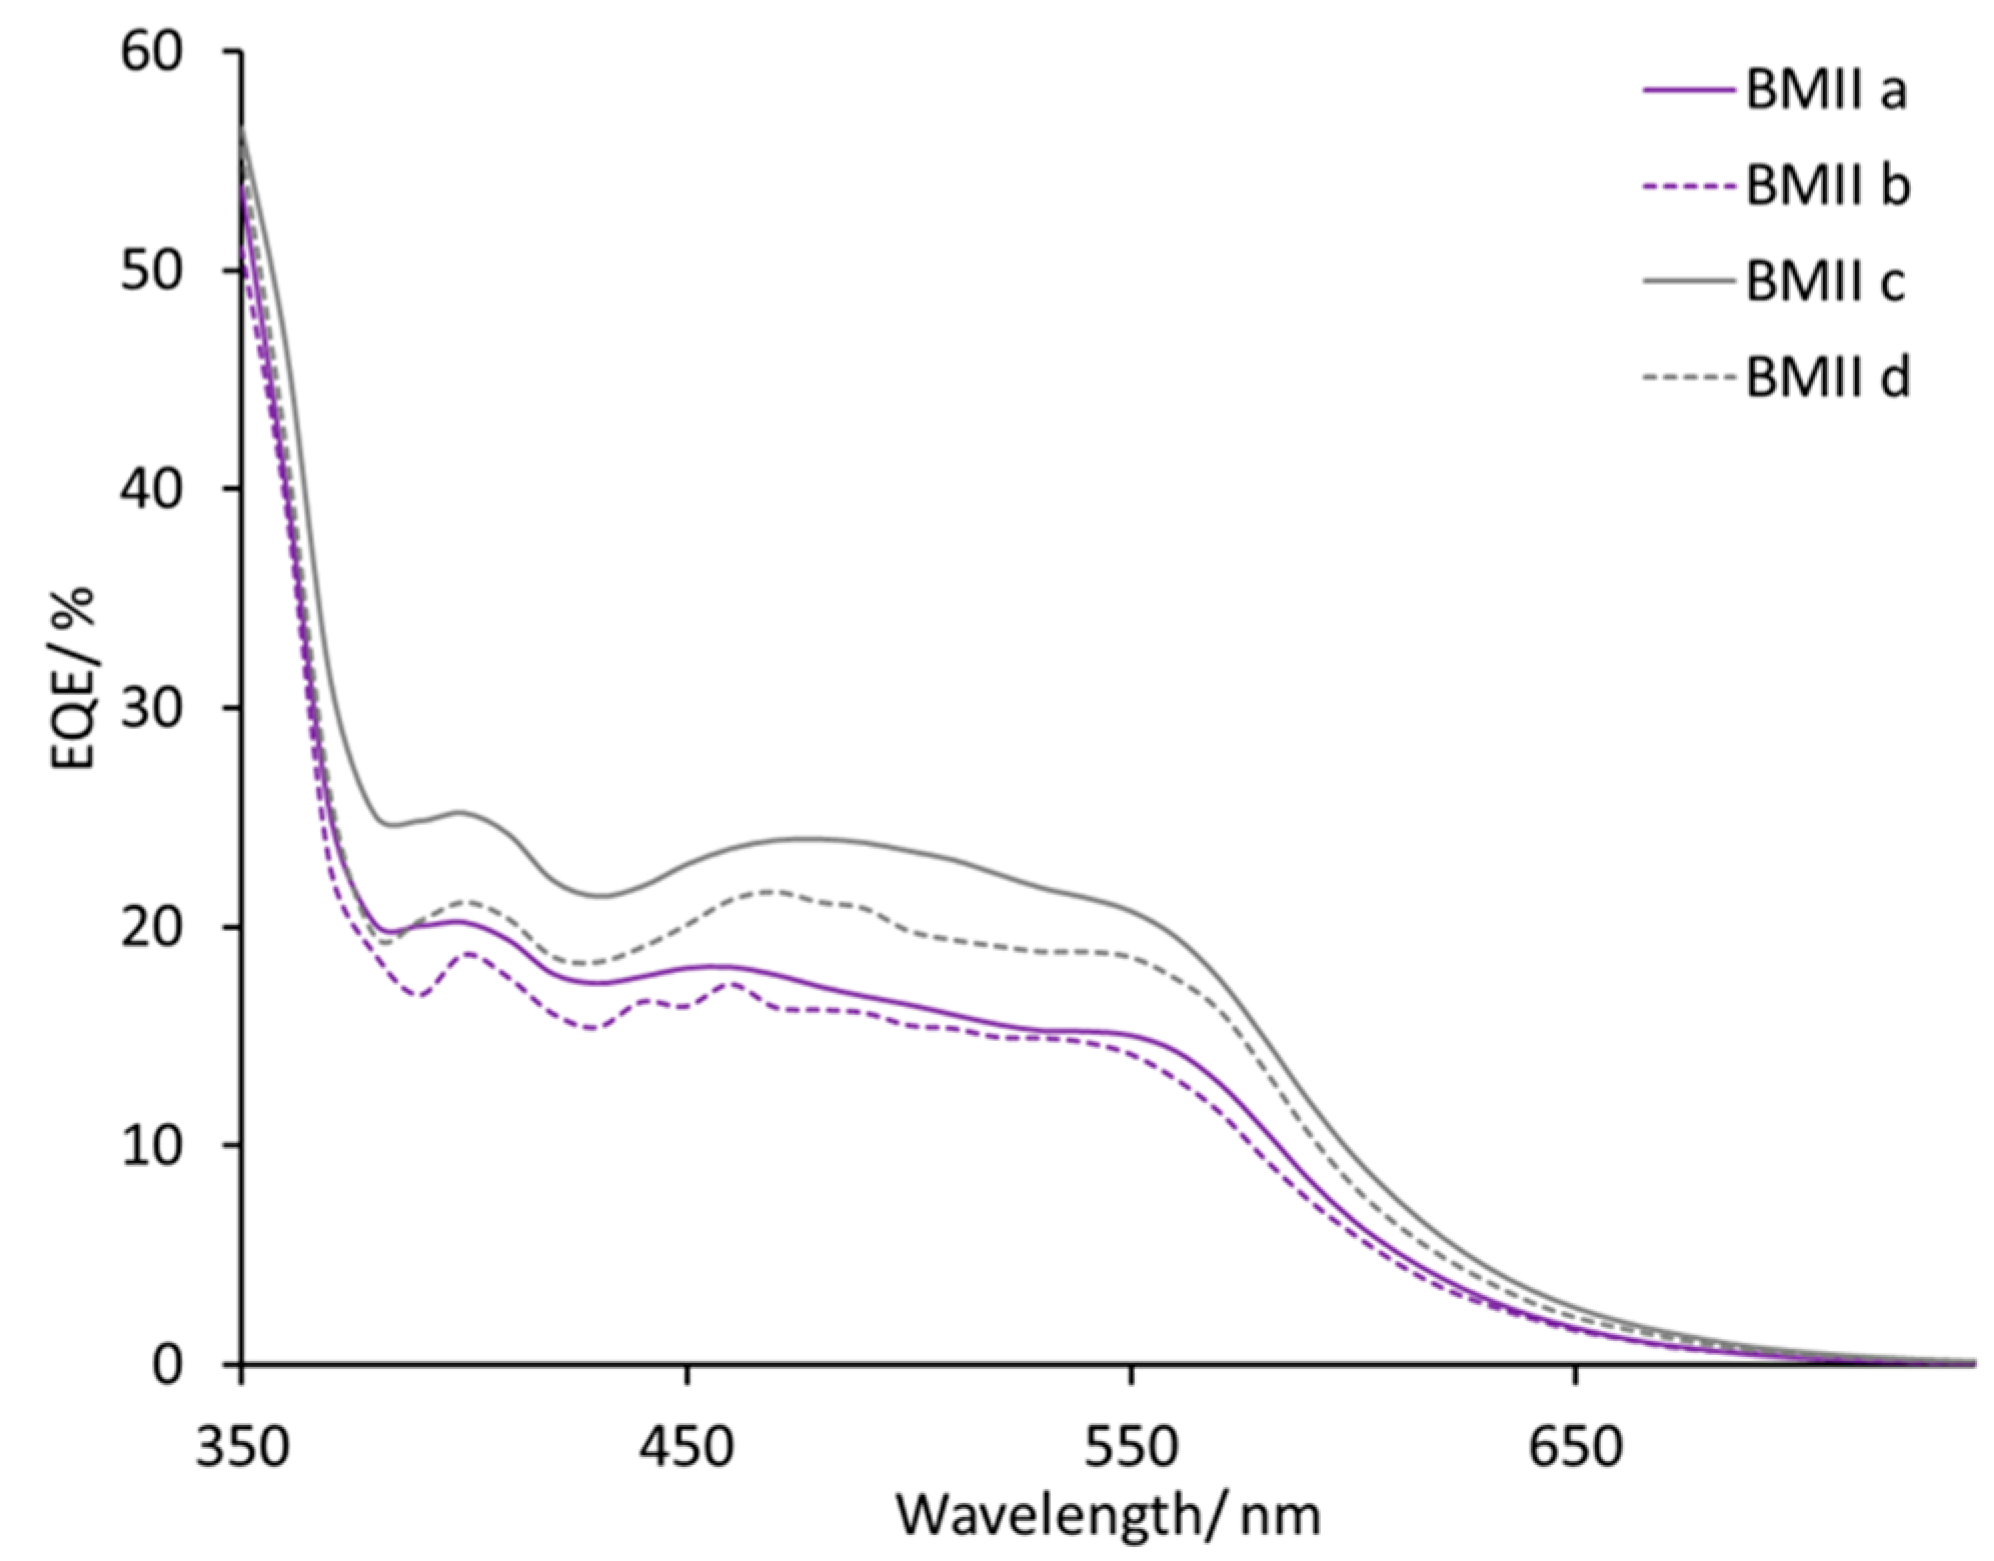
max 470–500 nm for a set of four DSCs for each electrolyte. DSCs with electrolytes BMIIa and BMIIb have similar EQE spectra with values of EQE
max in the range 12–18% (
Figure 6). With an increased concentration of Li
+ salts, the EQE
max increased to 21–23% at λ
max = 470 nm for PMII c and up to 20%–27% at λ
max = 550 nm for PMIId. For BMII-based electrolytes, higher Li
+ concentrations also result in higher EQE
max values of approximately 24% for BMIIc and of approximately 20% for BMIId at λ
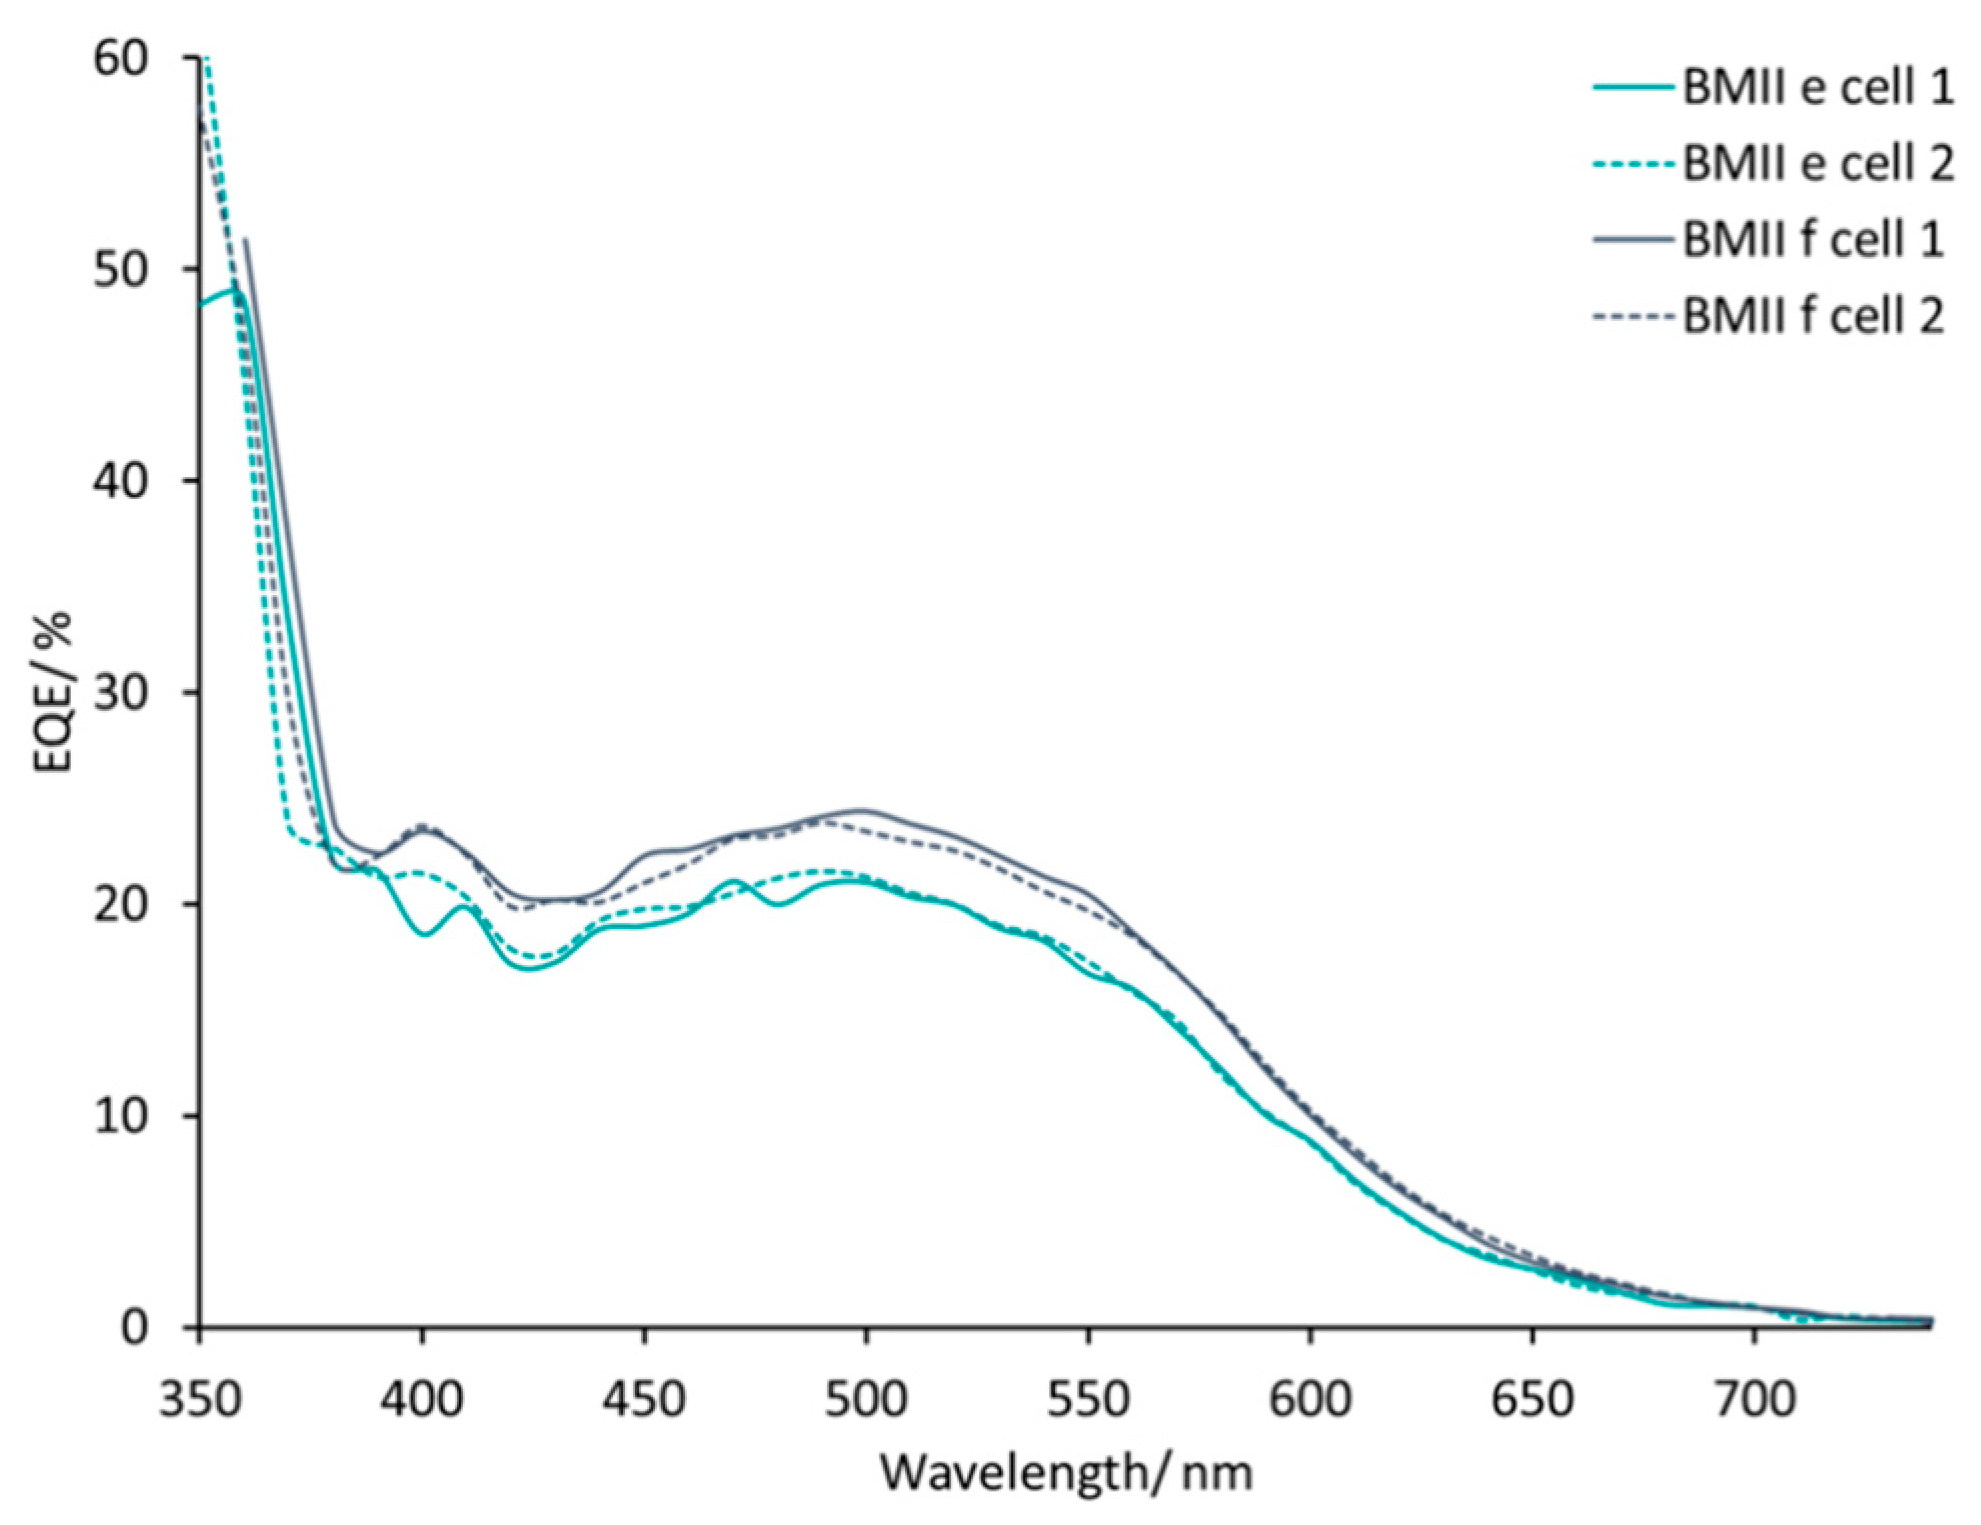
max = 470 nm. The increase of LiI concentration from 0.26 to 0.34 M in the electrolytes positively affects the EQE
max. The EQE
max for BMIIe is about 22% and for BMIIf is about 24–25% at λ
max 490–510 nm (
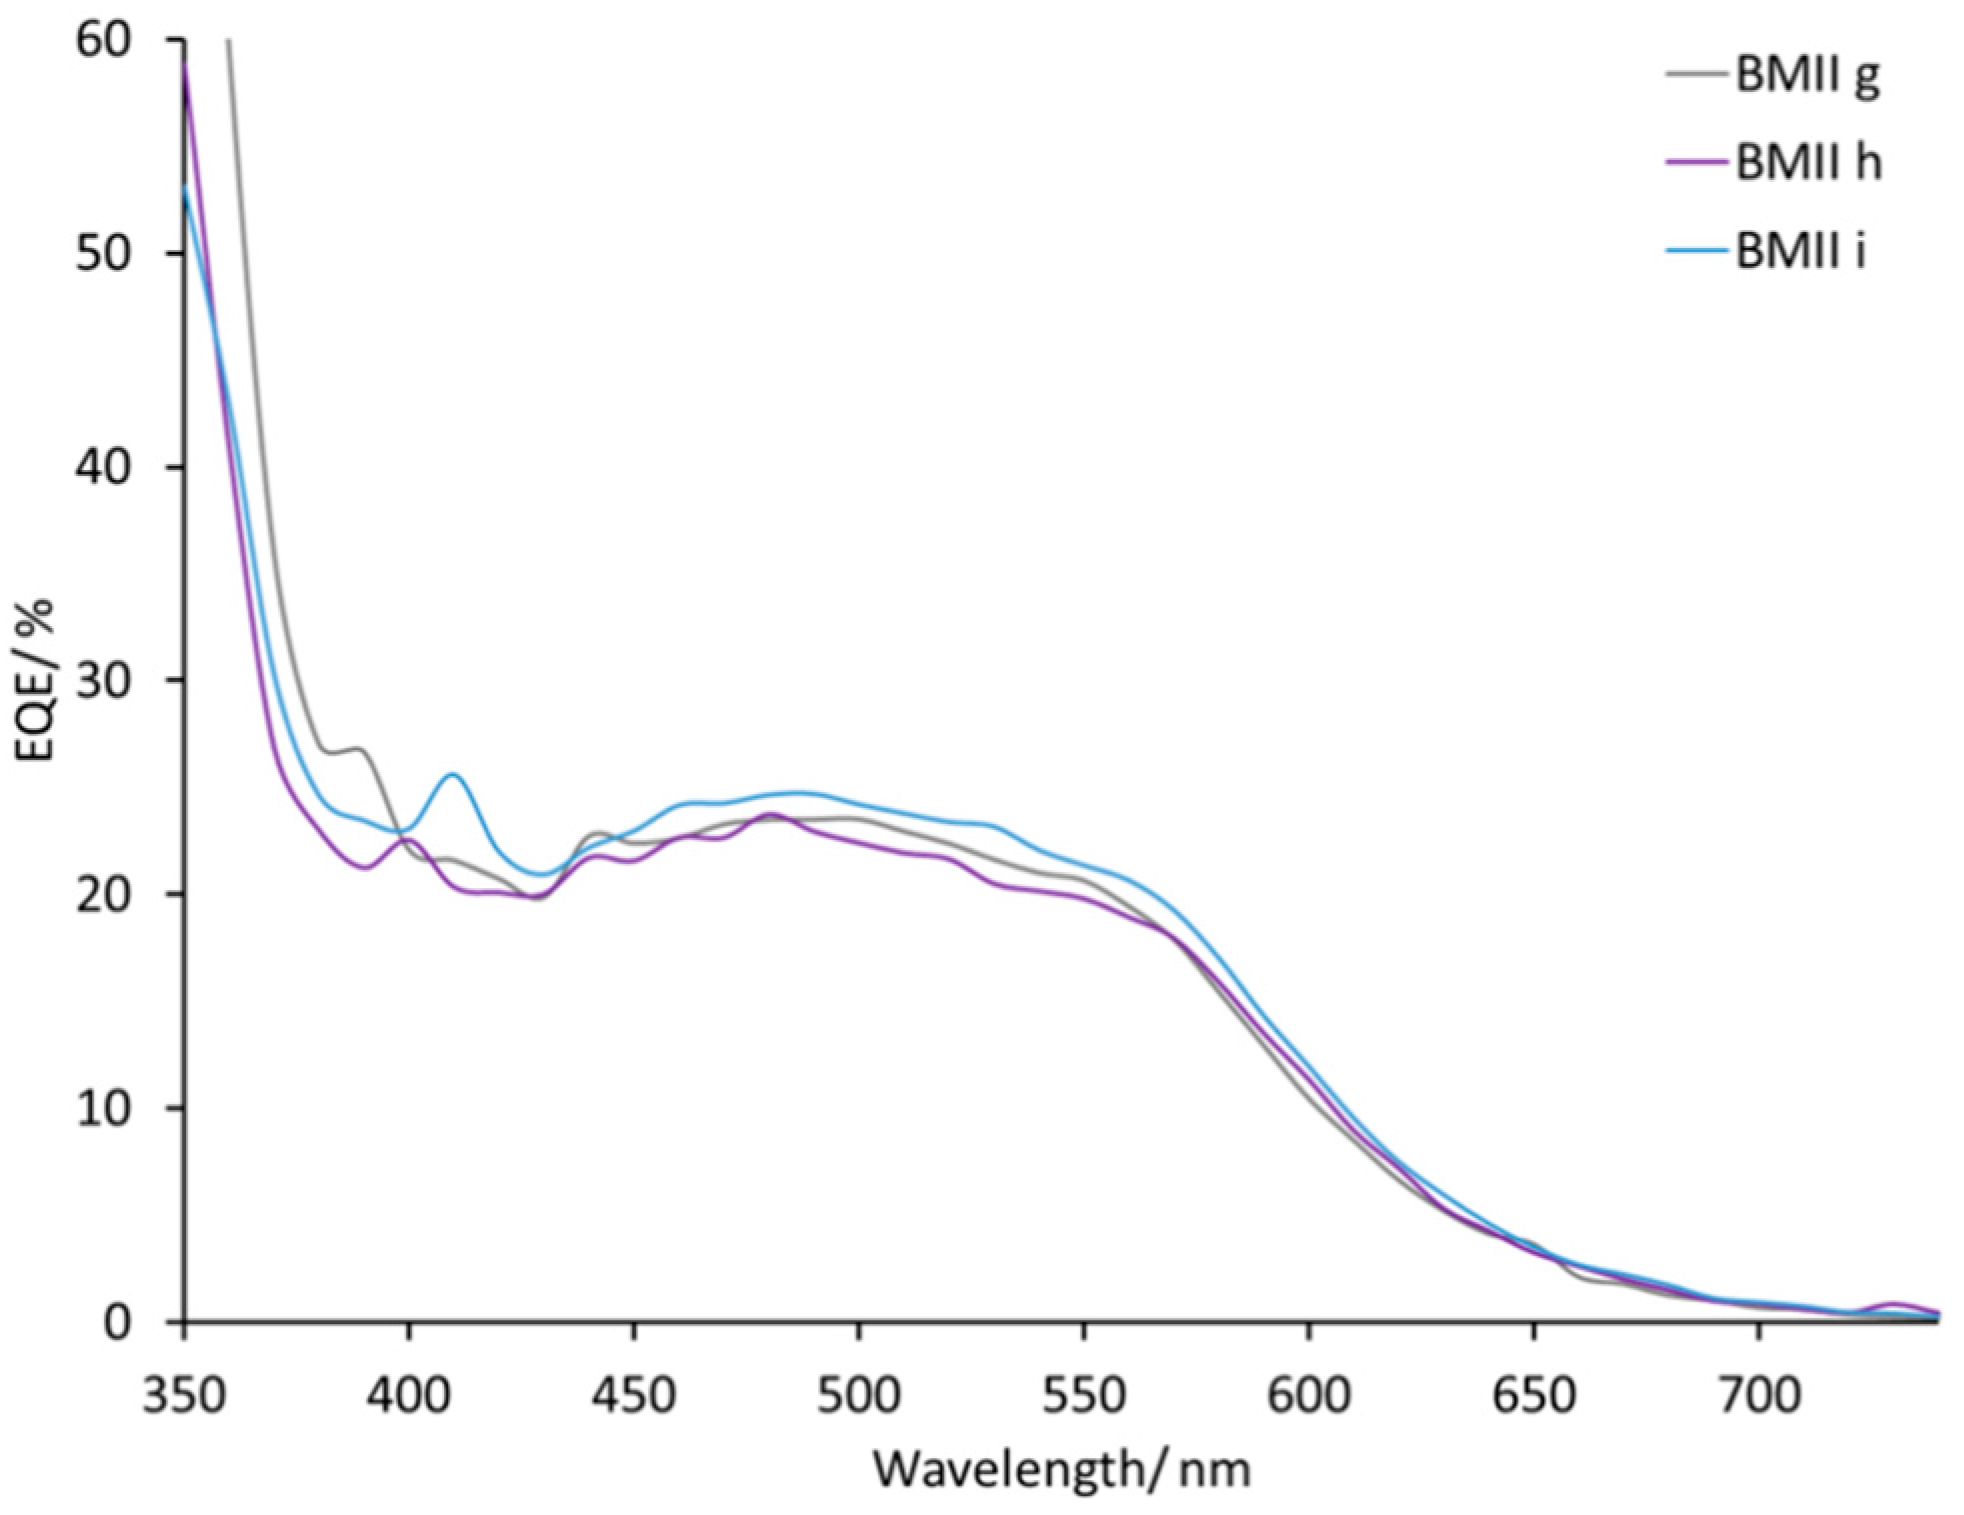
Figure 7). The EQE spectra of electrolytes BMIIg, BMIIh, and BMIIi can illustrate the influence of Li
+ ions from 0.18 M to 0.34 M due to the constant concentration of I
−. On going from BMIIg to BMIIi, the EQE
max increases from about 23% to about 25% at λ
max 480–500 nm (
Figure 8 and
Figure S6).
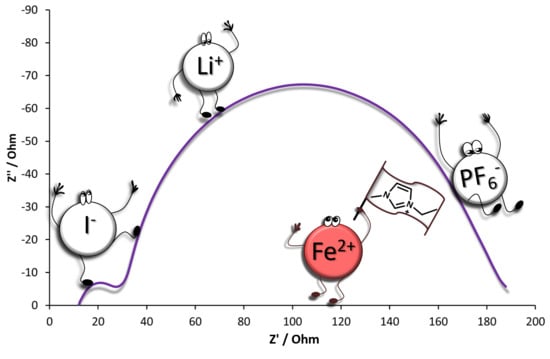
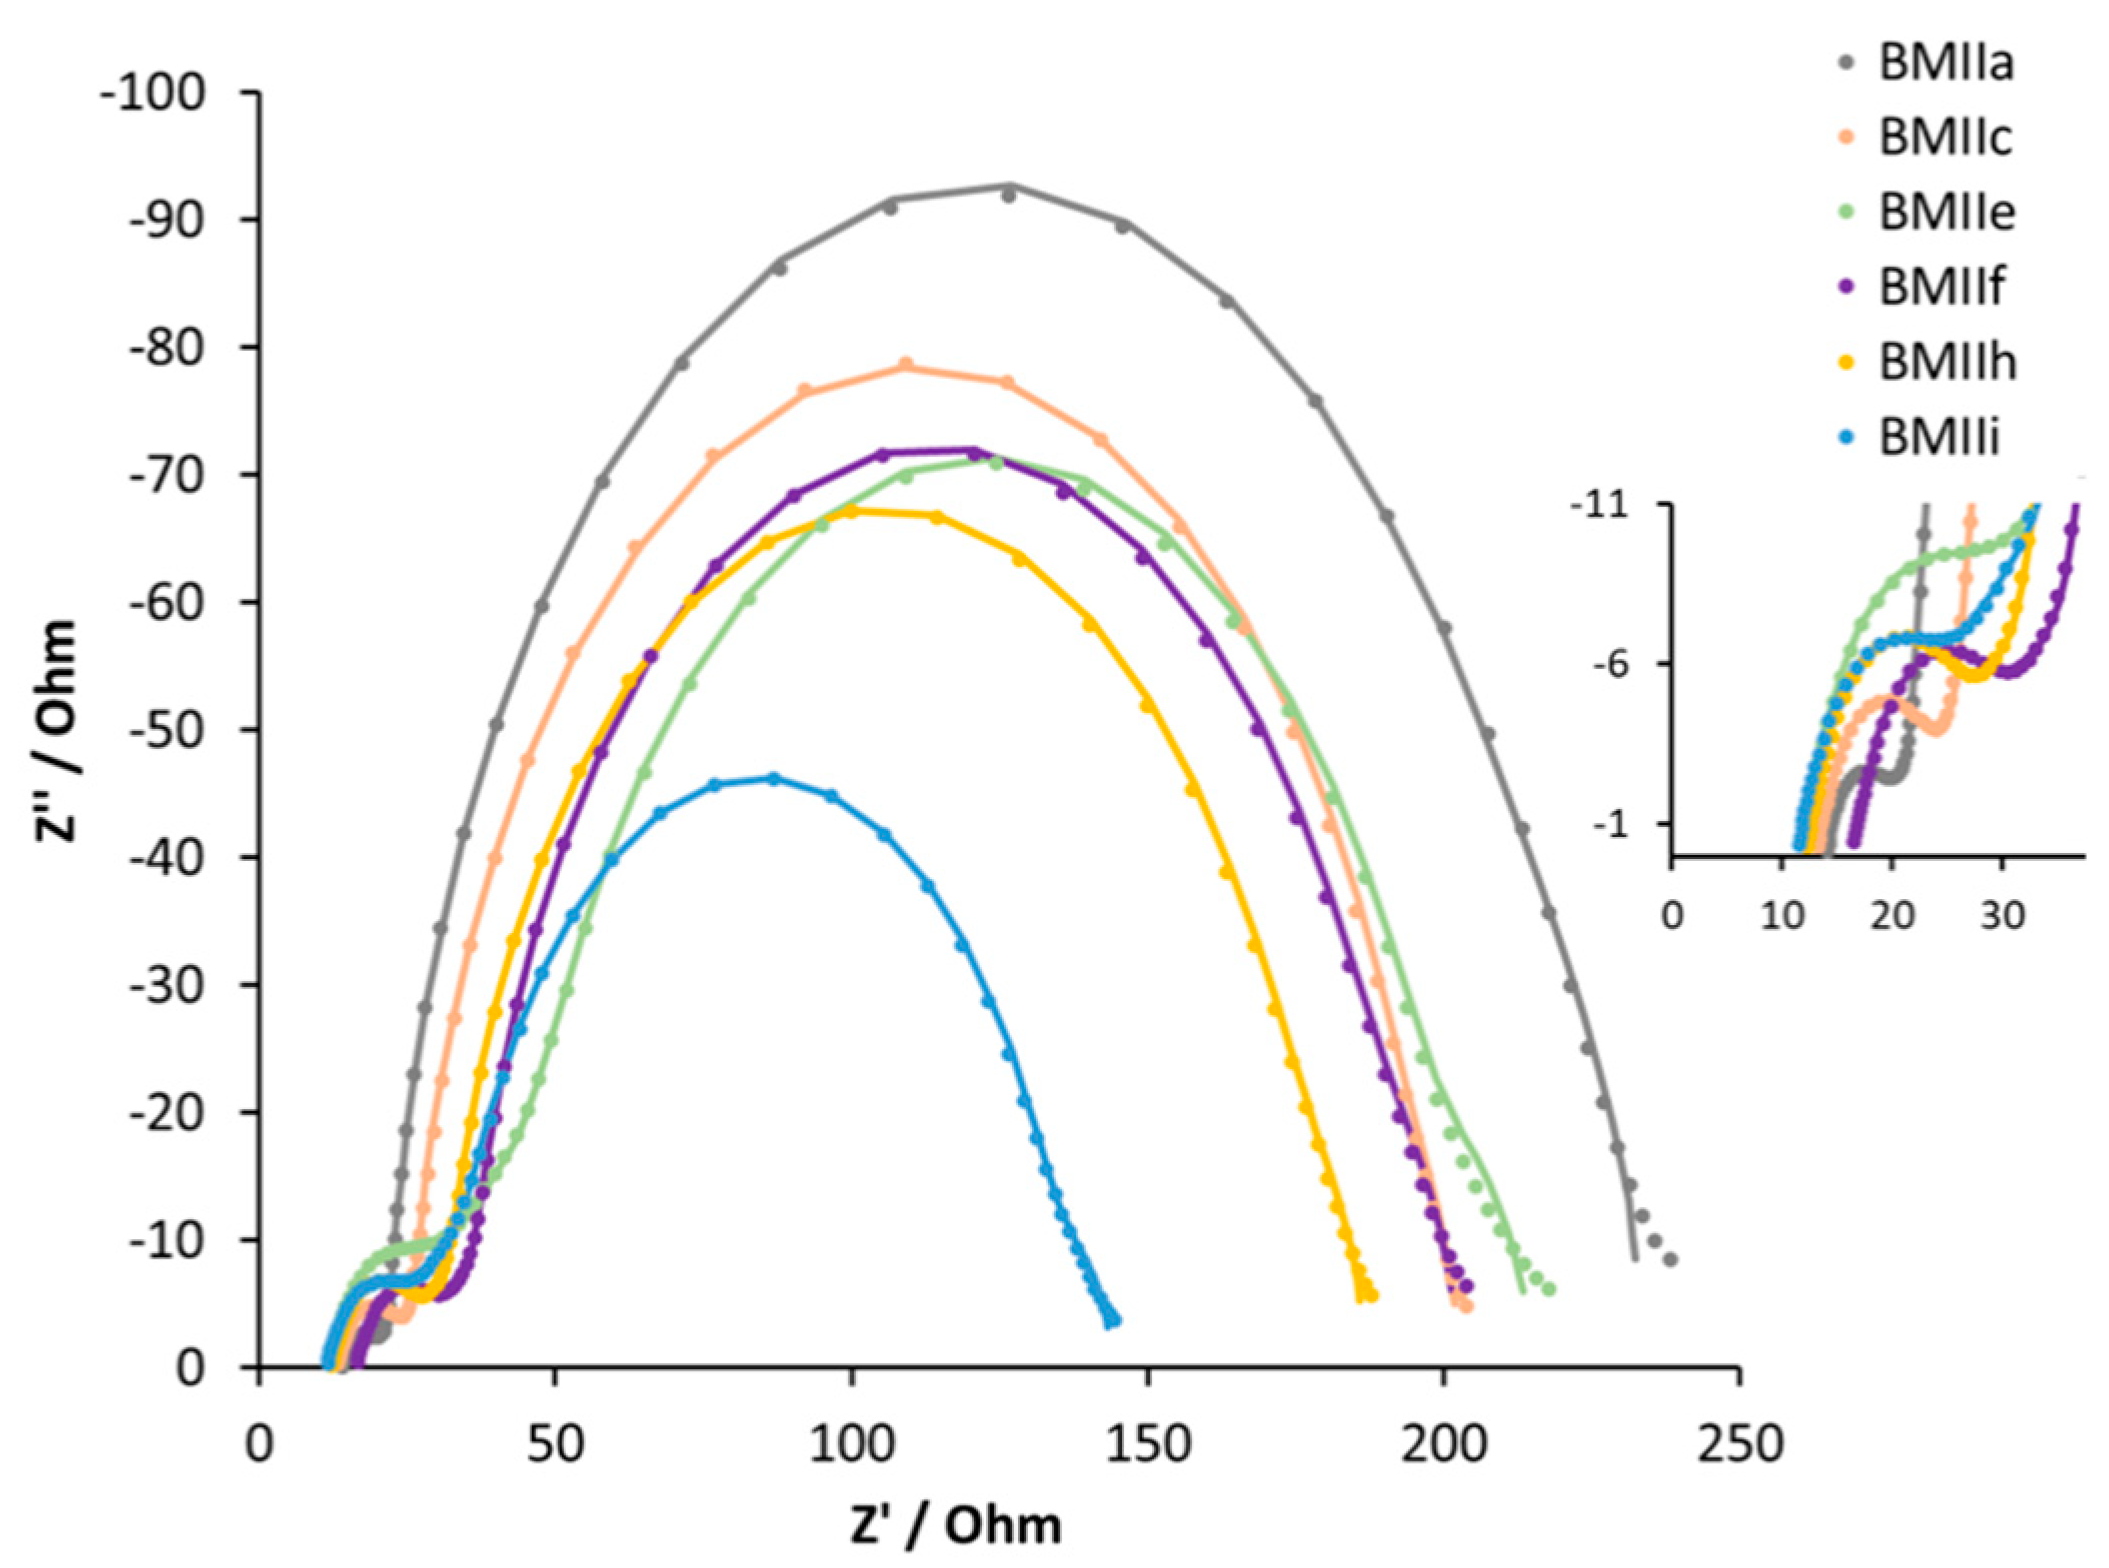
For a deeper understanding of the influence of LiI on the Fe-NHC-sensitized DSC systems, EIS measurements were performed (
Table 3,
Figure 9 and
Figure S12). The series resistance (
Rs), and the resistance (
RPt) and capacitance (
CPt) of the counter electrodes stay constant for all the DSCs. The recombination resistance (
Rrec) and the chemical capacitance (
Cμ) decrease with an increase of the Li
+ ion concentration in the electrolyte up to 0.26 M. For 0.34 M LiI in electrolyte BMIIf, the values of
Rrec and
Cμ increase again. The transport resistance (
Rtr) has a corresponding trend with an increase from 9 to 69 Ω from 0.1 M LiI to 0.26 M LiI, but then a decrease in
Rtr to 26 Ω for 0.34 M LiI.
The diffusion length (
Ld), transport time (
τt), and electron lifetime (
τ) play an important role in the DSC system. For the effective electron collection throughout the semiconductor,
Ld has to be around three times longer than the thickness of TiO
2 [
62], while
τt has to be lower than
τ. According to reported EIS measurements, high Li
+ concentrations in the electrolyte can significantly increase
Ld in the case of DSCs with the ruthenium(II)-based Z907 dye [
53]. However, for the iron(II)-NHC dye
2, we observed the opposite trend. In the series 0.1 M to 0.18 M to 0.26 M LiI in the presence of 0.6 M of BMII (electrolytes BMIIa, BMIIc, BMIIe, respectively, see
Table 1 and
Figures S7–S9),
Ld values decrease from 56 to 18 μm. At the same time, with the reduction of
Ld,
τ decreases from 74 to 39 ms, while
τt increases from 3 to 18 ms for electrolytes BMIIa, BMIIc, and BMIIe. The Bode plot shows the same trend in
τ values, since the charge lifetime is inversely correlated to the maximum frequency
fmax (
Figure S13) [
63]. Electrolyte BMIIf is an exception from this trend (
Table 3,
Figure S10) with the increase in LiI concentration from 0.26 to 0.34 M leading to higher values of
Ld and
τ, and to a reduction of
τt.
In the case of DSCs containing electrolytes, BMIIh and BMIIi with a constant 0.7 M iodide ion concentration, the EIS data are consistent with
JSC and
VOC trends. Comparing DSCs with electrolytes BMIIe and BMIIh (see
Table 1), the decrease in the concentration of the IL from 0.60 to 0.44 M leads to a higher
JSC, which is manifested in lower
Rrec and
Rtr. The further increase in the concentration of LiI to 0.34 M and a corresponding decrease of the BMII concentration to 0.36 M (to maintain a constant [I
−]) in the BMIIi electrolyte leads to lower
Rrec and
Cμ values, but higher
Rtr compared to values observed when the electrolyte is BMIIh (
Table 3).
The above results demonstrate that an increase in the concentration of Li+ ions positively affects the PCE for all ILs. The J–V and EIS data for DSCs containing electrolytes BMIIc and BMIIf are very similar with a slightly higher PCE when BMIIf is used. Based on these results, we were motivated to extend the investigations using 0.18 M LiI as the optimal additive.
3.2. Influence of the Structure of the Ionic Liquid
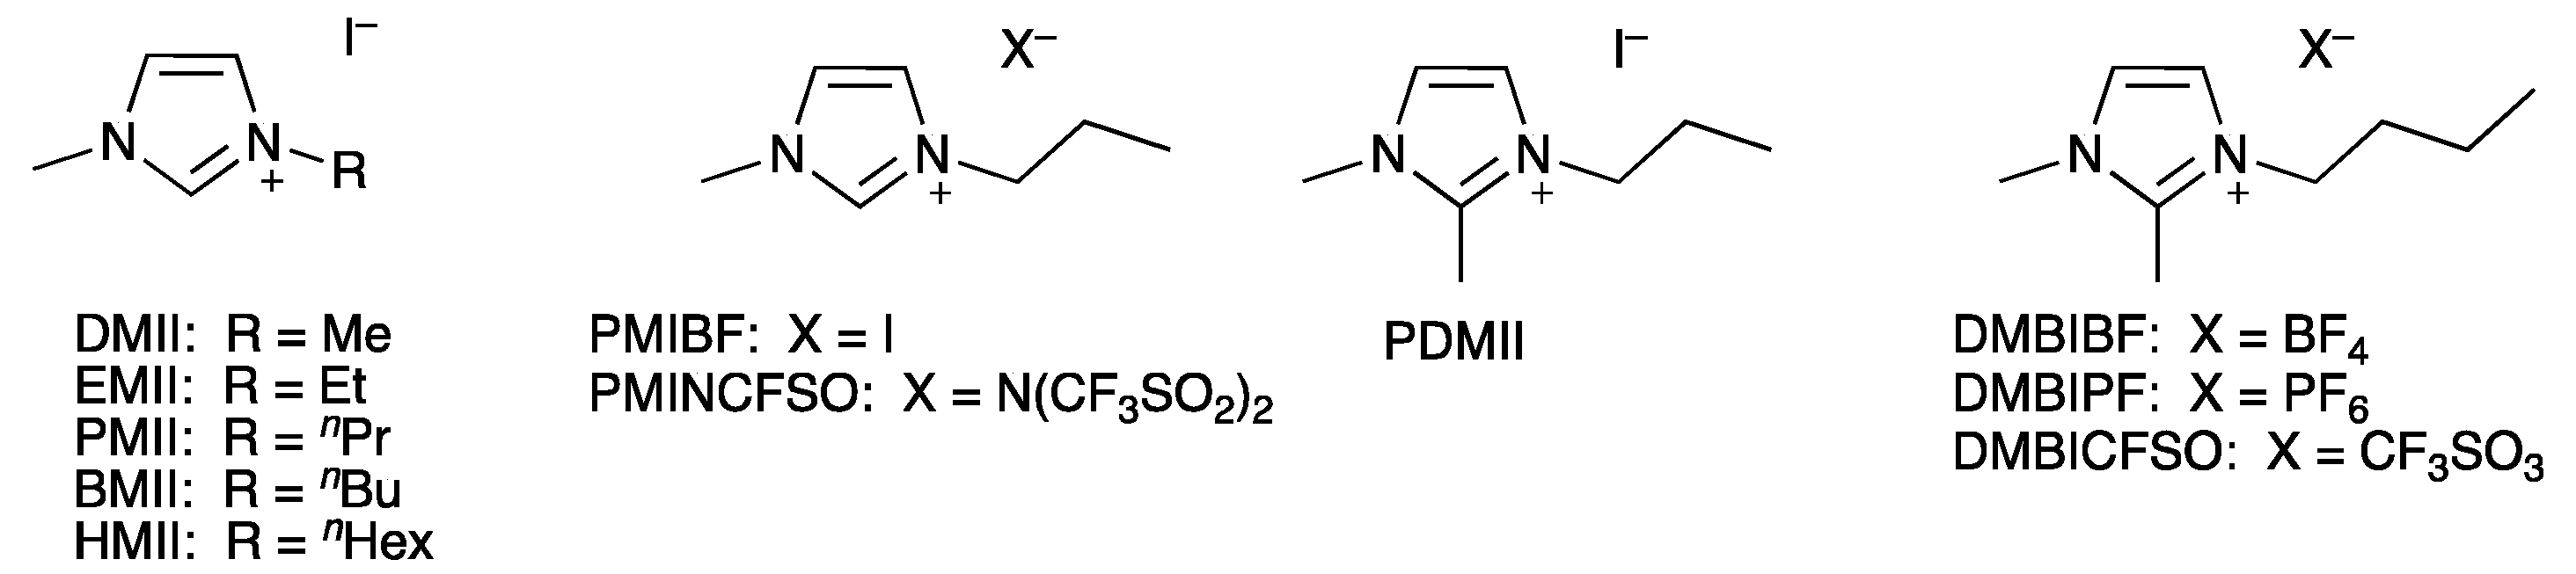
The structure of the IL in the electrolyte can be crucial in terms of DSC performance. The change in an alkyl chain length of 1-alkyl-3-methylimidazolium iodide family results in different viscosity, conductivity, and diffusion properties [
64]. We chose five ILs based on methylimidazolium iodide with different alkyl chain lengths 1,3-dimethylimidazolium iodide, 1-ethyl-3-methylimidazolium iodide, 1-propyl-3-methylimidazolium iodide, 1-butyl-3-methylimidazolium iodide, and 1-hexyl-3-methylimidazolium iodide (
Figure 2).
Table 4 and
Table S2 (see
Supporting Information) give the measured parameters for DSCs containing electrolytes incorporating the different ILs. In each case, the electrolyte composition was LiI (0.18 M), I
2 (0.05 M), and IL (0.6 M) in MPN. We observed an increase in PCE as the alkyl chain lengthened. From DMII to BMIIc, an increase in
JSC from 2.31 to 3.40 mA cm
−2 is observed, but this is countered by a loss in
VOC from 362 to 301 mV (
Table 4 and
Figure 10). The higher
JSC values result in a PCE of 0.61% (which represents a noteworthy value of 10.9% relative to 100% set for N719 [
61]) for BMIIc despite the reduction in
VOC compared to DMII. DSCs with electrolyte HMII appear out of line with the trend observed for the shorter alkyl chains (
Table 4 and
Figure 9). A decrease in
JSC to 3.14 mA cm
−2 is compensated by a slightly higher
VOC of 316 mV and leads to a similar overall performance (PCE = 0.60%) as for BMIIc.
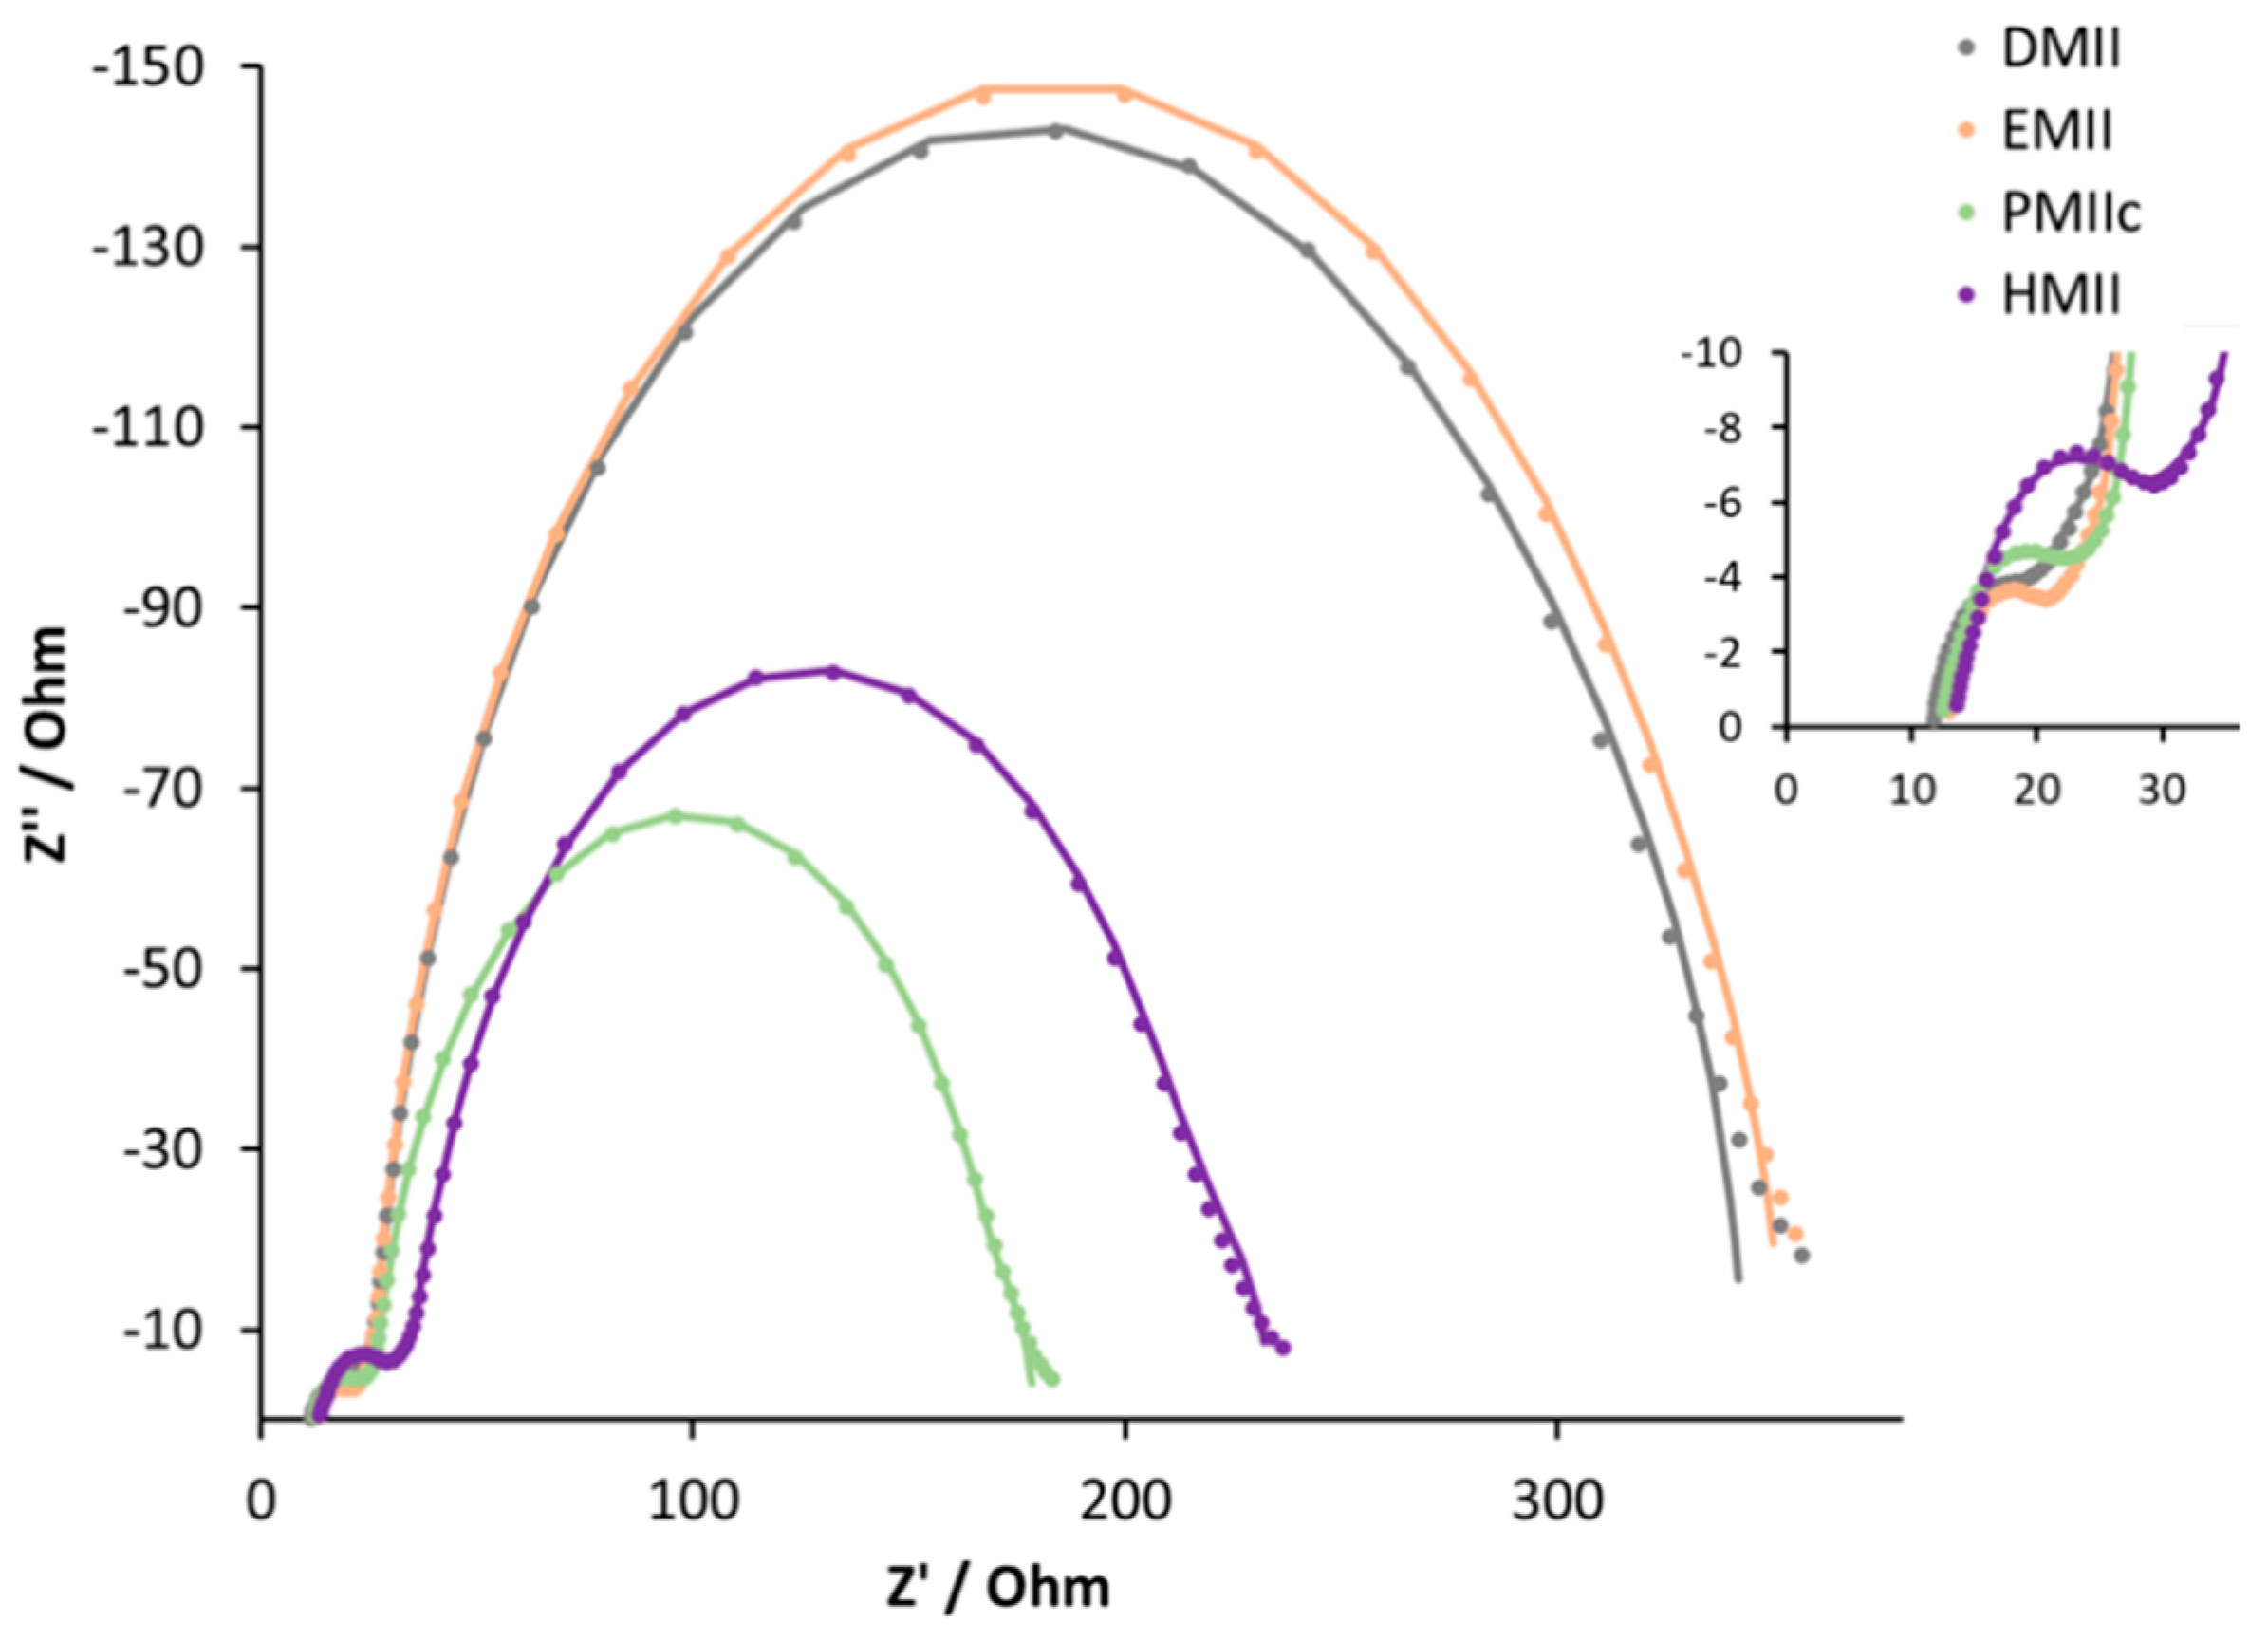
The results of EIS experiments (
Table 5,
Figure 11, and
Figures S15–S18) are consistent with the observed trends in DSC performances. On going from the methyl to n-propyl substituent, we observe a decrease in both the recombination resistance and the chemical capacitance. On going from the electrolyte with DMII to EMII, there is a slightly higher Cμ combined with a smaller transport resistance. This explains the small difference in VOC and JSC values for these DSC sets and results in a similar overall performance. The Cμ values for PMIIc and BMIIc are comparable, but higher Rrec in combination with smaller Rtr for BMIIc lead to a more favourable electron injection in the semiconductor. This effect results in a higher JSC value and, as a consequence, in a better DSC efficiency in the case of the BMII electrolyte. The change from n-butyl to n-hexyl chain does not lead to any significant difference in Rrec and Cμ, and, therefore, results in similar PCE values. The values of Ld, τt, and τ, in the case of the DSCs in
Table 4, are consistent with each other. The trend in τ is confirmed with the Bode plot (
Figure S19). Low values of τt and Rtr for DSCs with the BMII electrolyte represent a small electron loss in the TiO2 semiconductor. Together, these parameters result in well-performing DSCs.
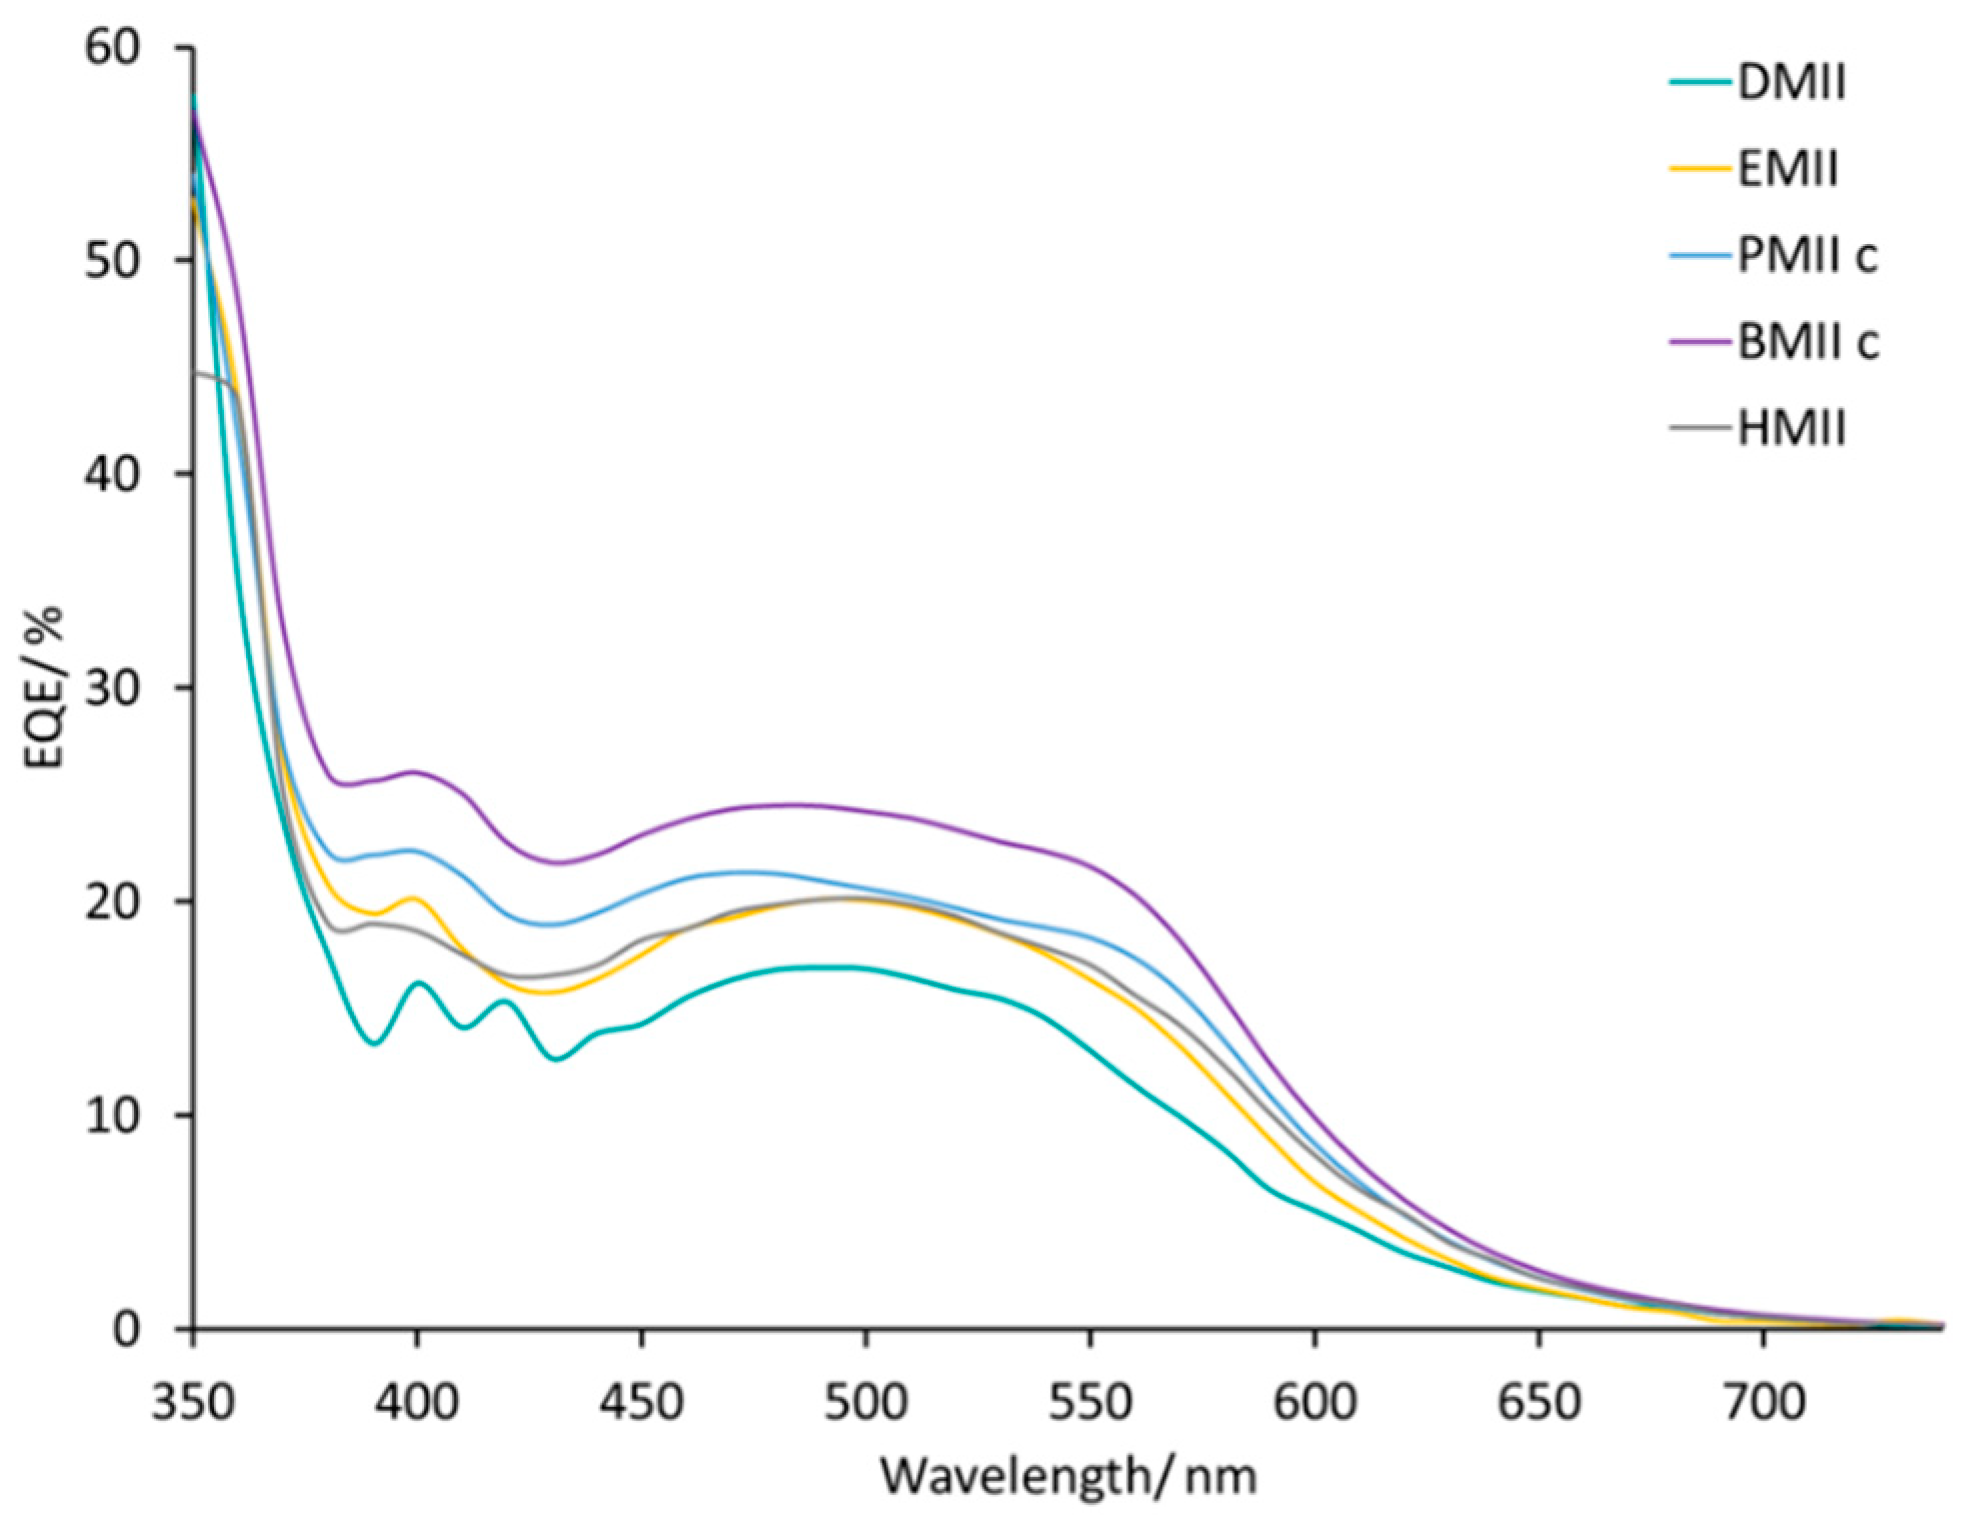
The EQE spectra of the DSCs listed in
Table 4 cover a broad range of wavelengths (
Figure S20). The change from methyl to
n-butyl chain enhances the EQE
max up to 24% (λ
max = 430 to 570 nm) and this is consistent with the trend in
JSC. The use of the HMII-based electrolyte leads to the same EQE
max value (≈20%) as observed for DSCs with EMII (
Figure 12). Thus, we conclude that, of the imidazolium iodides screened, incorporation of an
n-butyl side-chain contributes to the best efficiency DSCs with optimal values of
VOC,
JSC, EQE
max, and EIS parameters.
3.3. Influence of Ionic Liquid Counterions
The iodide counterion contributes to a faster dye regeneration due to the increased concentration of I
− in the system [
65]. On the other hand, too high a concentration of imidazolium iodide leads to a loss of the potential photocurrent [
65]. This drawback motivated us to investigate the effect of different counterions in the ILs in the electrolytes. We have focused on 1-butyl-2,3-dimethylimidazolium salts with tetrafluoridoborate, hexafluoridophosphate, and trifluoromethanesulfonate counterions and 1-propyl-3-methylimidazolium salts with tetrafluoridoborate, bis(trifluoromethylsulfonyl)imide, and iodide counterions (
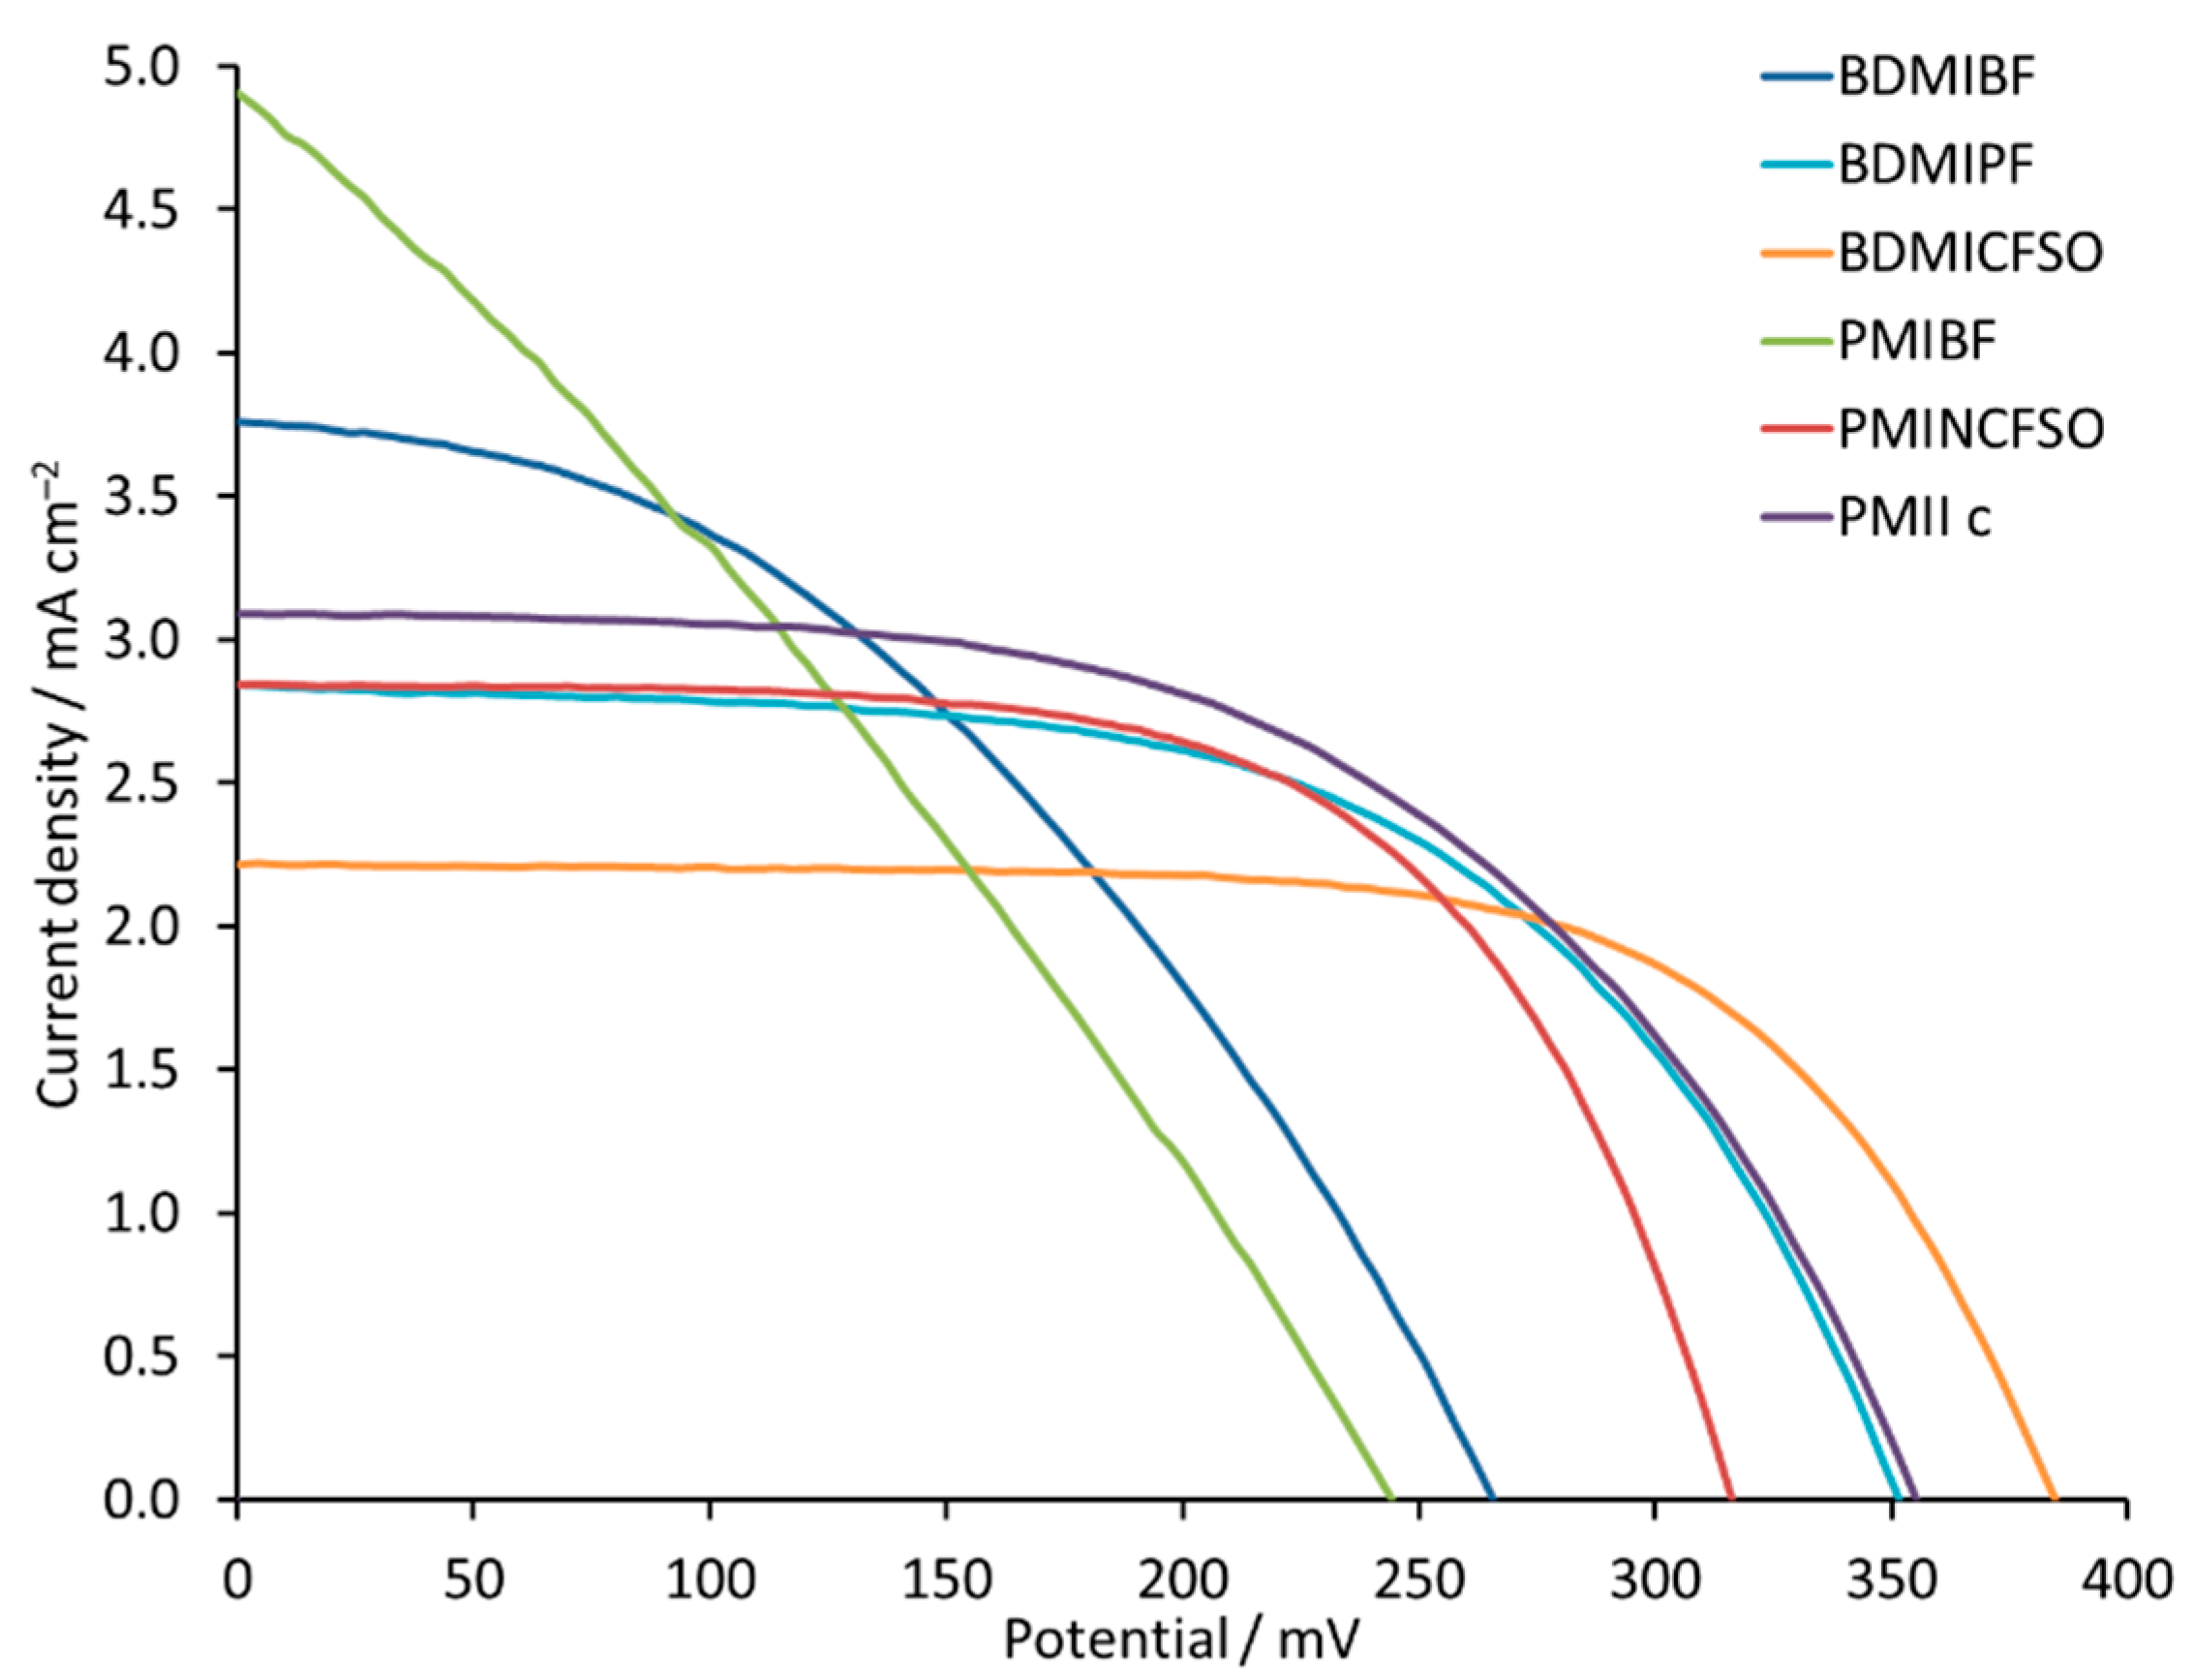
Figure 2). The performances of DSCs containing the different electrolytes are summarized in
Figure 13 and
Table 6, and in
Table S5 and
Figure S21 in the Supporting Information. In the sequence of [BDMI]
+ salts, values of
JSC fall from 3.80 to 2.22 mA cm
−2, while
VOC increases from 266 to 385 mV. In the [PMI]
+ series, the same trend is observed. For PMIBF, PMINCFSO, and PMIIc, the decrease in
JSC values is compensated by an increase in
VOC, which results in a PCE for the DSCs in the range of 0.35% to 0.59%. A PCE of 0.59% translates to a relative efficiency of 10.5% with respect to N719 set at 100%, which is rather high for an iron-based sensitizer. The change from [PF
6]
− to [CF
3SO
3]
− for [BDMI]
+ has little effect on the overall DSC performances (0.57% and 0.56%), while on going from [N(CF
3SO
2)
2]
− to I
− for [PMI]
+ (i.e., PMINCFSO to PMIIc,
Table 6) there is a moderate gain in performance from 10.0% to 10.5% relative to N719 [
61], as a consequence of values of
JSC = 3.01 mA cm
−2 and
VOC = 315 mA. In the case of the [BF
4]
− counterion for both BDMIBF and PMIBF, the low
ff values of 41% and 30% in combination with low
VOC values of 266 and 264 mV result in PCE values of 0.41% and 0.35%, respectively (
Table 6). This suggests that use of [BF
4]
− containing ILs is not beneficial. When the counterion is changed to [PF
6]
−, the
ff increases and the overall performance of the cells improves.


