Piezoelectric Characteristics of 0.55Pb(Ni1/3Nb2/3)O3-0.45Pb(Zr,Ti)O3 Ceramics with Different MnO2 Concentrations for Ultrasound Transducer Applications


1
Department of Mechatronics Engineering and LANL-JBNU Engineering Institute Korea, Jeonbuk National University, 567 Baekje-daero, Deokjin-gu, Jeonju-si, Jeollabuk-do 54896, Korea
2
Department of Flexible and Printable Electronics, Department of Mechatronics Engineering, and LANL-JBNU Engineering Institute Korea, Jeonbuk National University, 567 Baekje-daero, Deokjin-gu, Jeonju-si, Jeollabuk-do 54896, Korea
*
Author to whom correspondence should be addressed.
Materials 2019, 12(24), 4115; https://doi.org/10.3390/ma12244115
Submission received: 31 October 2019
/
Revised: 4 December 2019
/
Accepted: 6 December 2019
/
Published: 9 December 2019
(This article belongs to the Special Issue Material Systems and Structures in Mechanical and Aerospace Engineering)
Abstract
:In this study, we investigate the piezoelectric characteristics of 0.55Pb(Ni1/3Nb2/3)O3-0.45Pb(Zr,Ti)O3 (PNN-PZT) with MnO2 additive (0, 0.25, 0.5, 1, 2, and 3 mol%). We focus on the fabrication of a piezoelectric ceramic for use as both actuator and sensor for ultrasound transducers. The actuator and sensor properties of a piezoelectric ceramic depend on the piezoelectric strain coefficient d and piezoelectric voltage coefficient g, related as g = d/εT. To increase g, the dielectric constant εT must be decreased. PNN-PZT with MnO2 doping is synthesized using the conventional solid-state reaction method. The electrical properties are determined based on the resonant frequencies and vibration modes measured by using an impedance analyzer. The MnO2 addition initially improves the tetragonality of the PNN-PZT ceramic, which then saturates at a MnO2 content of 1 mol%. Therefore, the dielectric constant and piezoelectric coefficient d33 steadily decrease, while the mechanical properties (Qm, Young’s modulus), tanδ, electromechanical coupling coefficient k, and piezoelectric voltage coefficient g were improved at 0.5–1 mol% MnO2 content.
1. Introduction
Piezoelectric materials have attracted considerable interest for various applications such as multi-layer ceramic actuator, transducer, sensor and actuator applications, and for analyses on fundamental science. Lead-based piezoelectric ceramics such as Pb(Zr,Ti)O3 (PZT) have been extensively used in electrical devices because of their excellent piezoelectric properties [1]. Recently, the policies suggesting lead elimination have triggered studies on alternative compounds such as (K 0.44Na0.52Li0.04)-(Nb0.86Ta0.10Sb0.04)O3 (KNL-NTS) [2]. However, the lead-based compositions have exhibited higher piezoelectric performances than those of the lead-free compositions such as KNL-NTS.
Recently, many piezoelectric ceramic compositions of the ternary system have been reported as the ternary system has a larger morphotropic phase boundary (MPB) area than that of a secondary system such as PZT. Lead-based relaxor ferroelectrics have a general formula of Pb(B’ B”)O3 (where B’ is Mg2+, Ni2+, Zn2+, Fe3+, Sc3+, In3+, Mn4+, and Sn4+ and B” is Nb5+, Ta5+, Sb5+, and W6+) [3,4]. In this ternary system, 0.55Pb(Ni1/3Nb2/3)O3-0.45Pb(Zr,Ti)O3 (PNN-PZT) has attracted increasing attention owing to its excellent piezoelectric properties. Modifications of lead-based relaxor ferroelectrics have been extensively investigated to improve the piezoelectric properties. In 1974, Luff et al. [5] investigated a 0.5Pb(Ni1/3Nb2/3)O3-0.35PbTiO3-0.15PbZrO3 solid solution in the PNN-PZT ternary system and observed excellent piezoelectric properties. Vittayakorn et al. [6] reported the phase diagram between PNN and PZT ((1–x)Pb(Ni1/3Nb2/3)O3-xPb(Zr1/2Ti1/2)O3 (x = 0.4–0.9)), where the Zr/Ti composition was fixed close to the MPB of PZT, and new MPB within this system. Cao et al. [7] investigated 0.3Pb(Ni1/3Nb2/3)O3-xPbTiO3-(0.7−x)PbZrO3 (x = 0.33–0.43) as a function of the content of PbTiO3. Nam et al. [8] reported the 0.35Pb(Ni1/3Nb2/3)O3-0.65Pb(Zr1−xTix)O3 (x = 0.56–0.63) ceramic composition sintered at 1200 °C with good electrical properties including d33 = 605 pC/N, Kp = 0.61, and εr = 3600. Du et al. [3] have reported the 0.55Pb(Ni1/3Nb2/3)O3-0.135PbZrO3-0.315PbTiO3 ceramic with good electrical properties including d33 = 1070 pC/N, Kp = 0.69, εr = 8710, and tanδ = 26 × 10−3. Figure 1 shows the reported compositions of the PNN-PZT ceramics.
The doping of proper elements is an effective approach to enhance their properties for targeted applications. Yu et al. [9] investigated the effects of MnO2 additive on the 0.12Pb(Ni1/3Sb2/3)-0.48PbTiO3-0.40PbZrO3 ceramic. A 0.15 wt% MnO2-doped sample exhibited enhanced piezoelectric properties, including Kp = 0.68, εr = 3069, Qm = 181, and tanδ = 5.4 × 10⁻³. Bamiere et al. [10] reported that a Sr-doped 0.674Pb,Nd(Zr,Ti)O3-Pb(Ni1/3Nb2/3)O3 exhibited good ferroelectric properties at low sintering temperatures. Du et al. [11] investigated the effects of small additions of xFe2O3 (x = 0~1.6 mol%) on the microstructures and electrical properties of 0.55Pb(Ni1/3Nb2/3)O3-0.45Pb(Zr0.3Ti0.7)O3 ceramics sintered at 1200 °C for 2 h and reported high piezoelectric performances at 1.2 mol% of Fe2O3 (ρ = 7.97 g/cm3, d33 = 956 pC/N, Kp = 0.74, εr = 6095, and tanδ = 26 × 10−3). Yoo et al. [12] reported high values of piezoelectric properties (ρ = 7.816 g/cm3, d33 = 356 pC/N, kp = 0.597, εr = 920, Qm = 1186) for the 0.2 wt% MnO2 0.02Pb(Mn1/3Nb2/3)O3-0.12Pb(Ni1/3Nb2/3)O3-0.86Pb(Zr0.5Ti0.5)O3 ceramic. Liao et al. [13] reported that Fe doping largely reduced tanδ and d33, but improved Qm and tetragonality of the 0.35BiScO3-0.6PbTiO3-0.05Pb(Zn1/3Nb2/3)O3 ceramic. Liu et al. [4] investigated 0.55Pb(Ni1/3Nb2/3)O3-0.45Pb(Zr0.3Ti0.7)O3 (PNN-PZT) with varying MnO2 additive content and reported high performance (d33 = 710 pC/N, kp = 0.595, εr = 3092.25, tanδ = 14.9 × 10⁻³, Qm = 176) at a MnO2 content of 1 mol%. Table 1 shows piezoelectric ceramic and properties according to doping from references.
Most lead-based relaxor ferroelectrics such as PNN-PZT have high dielectric constants and d33 values, but low g33 values and poor mechanical properties (Qm, Young’s modulus) for applications as sensors [13]. Modifications of the properties of the ternary complex systems have not been extensively investigated. The doping of materials such as FeO3 and MnO2 can be used to easily change the properties of ternary complex systems. To improve the g33 values and mechanical properties of the PNN-PZT systems, Mn can be added to selectively improve sensor characteristics. The MnO2 doping can improve the sinterabilities of lead-based relaxor ceramics owing to the increase in number of oxygen vacancies, generated by the substitutions of the high-valence Ti4+ and Zr4+ in the perovskite lattice by the low-valence Mn2+ and/or Mn3+ [4]. The oxygen vacancies in the perovskite lattice can promote lattice diffusion, thus assisting the sintering and grain growth [12], as the grain boundary movement is dragged by these defects. The pores in the lead-based relaxor ceramics easily diffuse through the movement of oxygen vacancies and are eliminated at the grain boundaries. Therefore, the densification of the ceramic originated from the introduction of MnO2 improving the piezoelectric properties [13]. It is possible to adjust the properties of the PNN-PZT ceramic according to the MnO2 content.
The aim of this study was to better understand the effects of doping on PZT-based complex ceramics and improve the sensing performances and mechanical properties by using MnO2 as an additive in the 0.55Pb(Ni1/3Nb2/3)O3-0.135PbZrO3-0.315PbTiO3 ternary ceramic. The effects of the MnO2 content on the piezoelectric, dielectric, and mechanical properties of the ceramic were investigated.
2. Synthesis of the MnO2-Doped PNN-PZT
The ceramics of PNN-PZT + MnO2 (0, 0.25, 0.5, 1, 2, and 3 mol%) were synthesized by using the conventional solid-state method. Raw material powders (PbO, NiO, Nb2O5, ZrO2, and TiO2) (Sigma Aldrich, 99.99%, Gillingham, UK) and MnO2 additive (Sigma Aldrich, 99.99%, Gillingham, UK) were weighted in chemically stoichiometric proportions and ball-milled with distilled water for 24 h. After the ball milling, the slurry was dried at 80 °C, and then calcined at 900 °C (heating rate: 100 °C/h) for 2 h. The calcined powders were ball-milled again for 24 h with a 5 wt% polyvinyl alcohol (PVA) (Sigma Aldrich, 99+%, Gillingham, UK, Mw = 89000–98000) solution as a binder for ceramic formation. The mixture was dried and crushed by a high-energy ball mill. The powder was sieved to control the particle size below 5 μm. The sieved powder was pressed into a mold (Φ = 30 mm) under a pressure of 100 MPa. The PVA in the ceramic disk was burnt out at 600 °C (heating rate: 100 °C/h) for 2 h. Subsequently, the ceramic disk was sintered at 1200 °C (heating rate: 100 °C/h) for 2 h with a spacer powder in an alumina crucible [14]. The sintered PNN-PZT ceramic disk was polished and coated with silver paste to obtain electrodes on both surfaces. The samples were polarized by applying a direct-current (DC) electric field of 2.5 kV/mm for 30 min at 50 °C in silicon oil.
The crystal structures of the sintered samples were characterized by X-ray diffraction (XRD) (X’pert Pro Powder, PANalytical, Netherlands). The surface microstructures of the as-sintered ceramics were observed by using field-emission scanning electron microscopy (SEM) (JSM-5900, JEOL, Akishima City, Japan). Three PNN-PZT specimens were fabricated for each composition. Their properties were measured, and then the average values were calculated. The piezoelectric coefficients (d33) of the piezoelectric ceramics were measured by using a quasi-static piezoelectric d33 meter (HY2730, Yangzhou, China). The planar electromechanical coupling coefficients (kp, k31), piezoelectric coefficient (d31), mechanical factor (Qm), dielectric constant (εr = εT33/ε0, ε0 = 8.854 × 10⁻¹² F/m), piezoelectric voltage coefficients (g33, g31), and Young’s modulus (YE11) were determined according to the method of resonance and antiresonance frequencies by using an impedance analyzer (HP 4194A, Agilent, Santa Clara, CA, USA) based on the Institute of Electrical and Electronics Engineers (IEEE) standards. Length-mode specimens (22 by 4 by 0.8 mm3) were used to calculate YE11, k31, d31, and g31.
3. Results and Discussion
3.1. Phase and Microstructure
Figure 2 shows XRD patterns of the 0.55PNN-0.45PZT ceramics doped with different MnO2 contents (0, 0.25, 0.5, 1, 2, and 3 mol%). All samples exhibited typical ABO3 perovskite structures without the pyrochlore phase. Rhombohedral and tetragonal phases were found to coexist in the PNN-PZT ceramics.
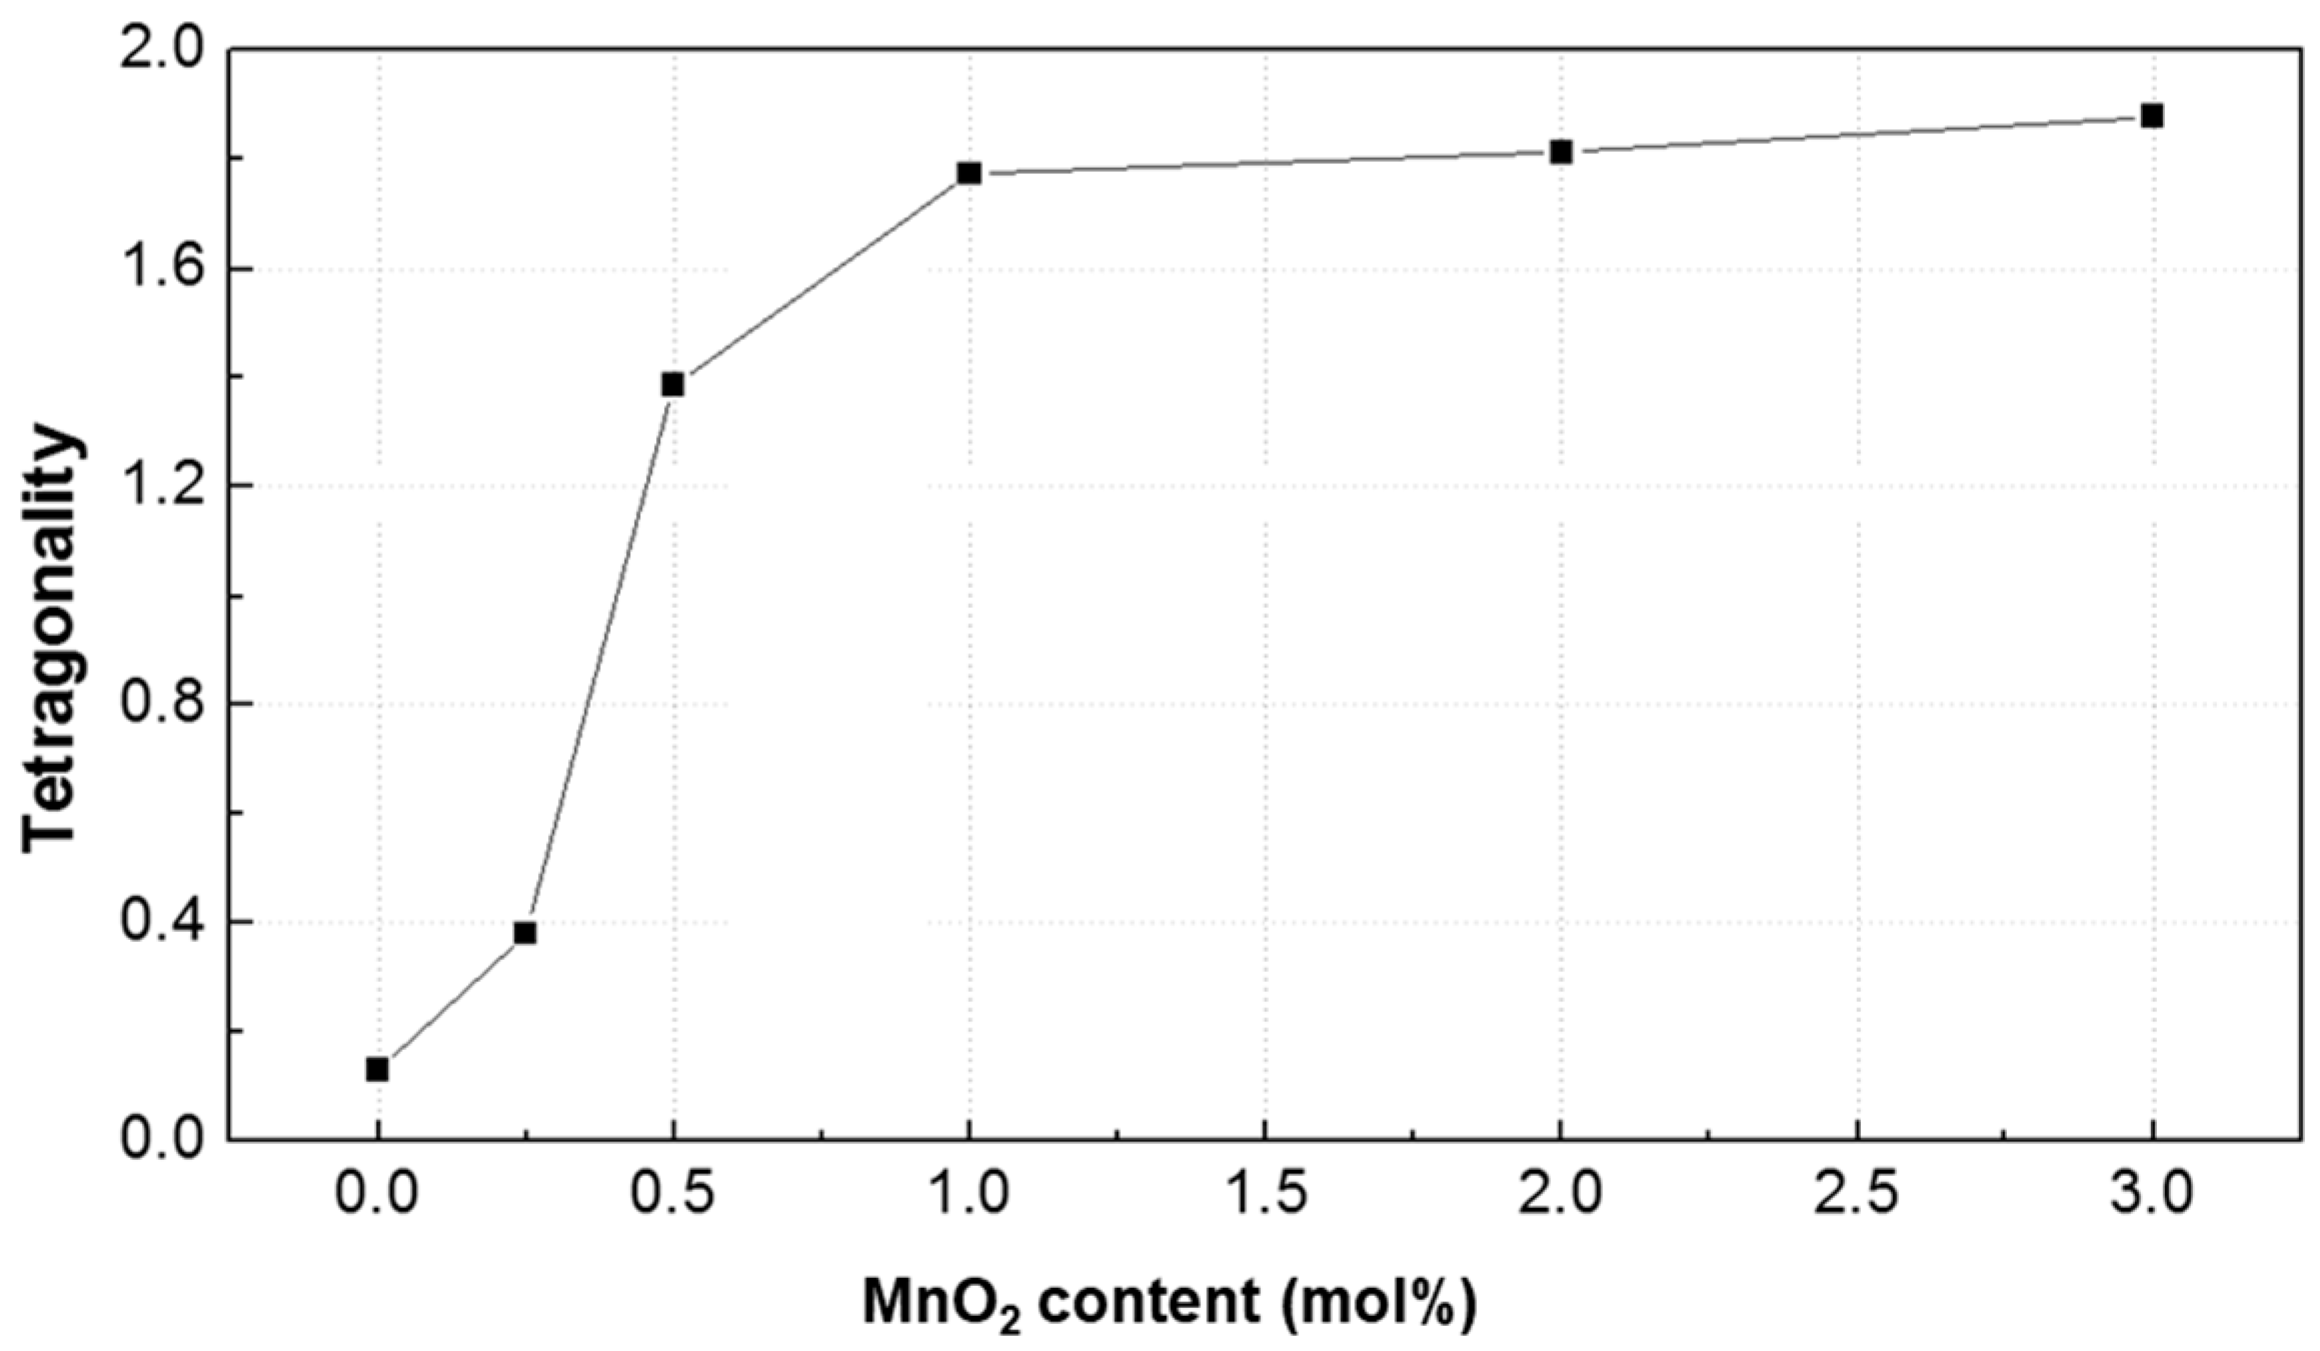
As shown in Figure 3, the XRD patterns were fitted by Gaussian functions in the 2θ range of 44.5–45.5°. The (200) peak consisted of three peaks, tetragonal (200) and (002) diffractions peaks presented in green and blue, respectively, and rhombohedral (200) diffraction peak presented in magenta. The red peak represents the overlap intensities of T(200), T(002), and R(200). Figure 2 shows the apparent changes in diffraction peaks, which indicate a gradual rhombohedral-to-tetragonal phase transition. Tetragonality is a crucial structural parameter of the perovskite lattice because it may affect the material properties. The tetragonality was calculated as IT(200)/IR(200), where IT(200) is the T(200) intensity and IR(200) is the R(200) intensity of the XRD pattern in Figure 3. As shown in Figure 4, with the increase in MnO2 content, the tetragonality of the PNN-PZT ceramic initially largely increases, and then saturates at MnO2 contents higher than 1 mol% [13].
Figure 5 shows SEM images of the PNN-PZT ceramics with MnO2 contents of 0–3 mol%. The pure PNN-PZT ceramic exhibited small grain sizes (microstructures) of almost 1.5 μm. When a small amount of MnO2 was added, the grain size of the microstructure was increased. The maximum average grain size of 2.8 μm was observed in PNN-PZT with the MnO2 content of 3 mol%.
3.2. Dielectric Properties
Figure 6 shows the dielectric constants εr and dielectric losses tanδ (%) of the PNN-PZT ceramics with different MnO2 concentrations measured at 1 kHz at room temperature. The dielectric loss largely decreased with the MnO2 content of 1 mol%, and then steadily increased in the MnO2 range of 1 to 3 mol%. The dielectric loss reached the maximum (5.6%) for the undoped PNN-PZT ceramic and minimum (1.6%) for the 1 mol% MnO2 sample. Therefore, the dielectric loss decreased by almost five times upon slight MnO2 doping. This is consistent with the change rate of the tetragonality. The dielectric loss rapidly decreased with the increase in tetragonality from 0 to 1 mol%. The dielectric loss was improved at MnO2 content above 1 mol%, because the tetragonality was saturated at 1 mol%. Figure 6 shows the negative and positive effects on the dielectric constant εr and dielectric loss tanδ (%). A negative effect, decrease in dielectric constant, was observed with the increase in tetragonality with the MnO2 content. In terms of the dielectric loss, the minimum value could be explained by the competition between the positive effect (increase in tetragonality) and negative effect of the Mn ions on the motion of the wall domains.
With the increase in MnO2 content, the dielectric constant decreased because the hardener Mn ions affected the domain movement. The decrease in dielectric constant was caused by the oxygen vacancies generated by the substitutions of the high-valence Ti4+ and Zr4+ in the perovskite lattice by the low-valence Mn2+ and/or Mn3+. The dielectric constant rapidly decreased up to the MnO2 content of 1 mol%. However, the decrease rate of the dielectric constant was smaller at MnO2 contents of 1 to 3 mol%.
3.3. Mechanical Properties
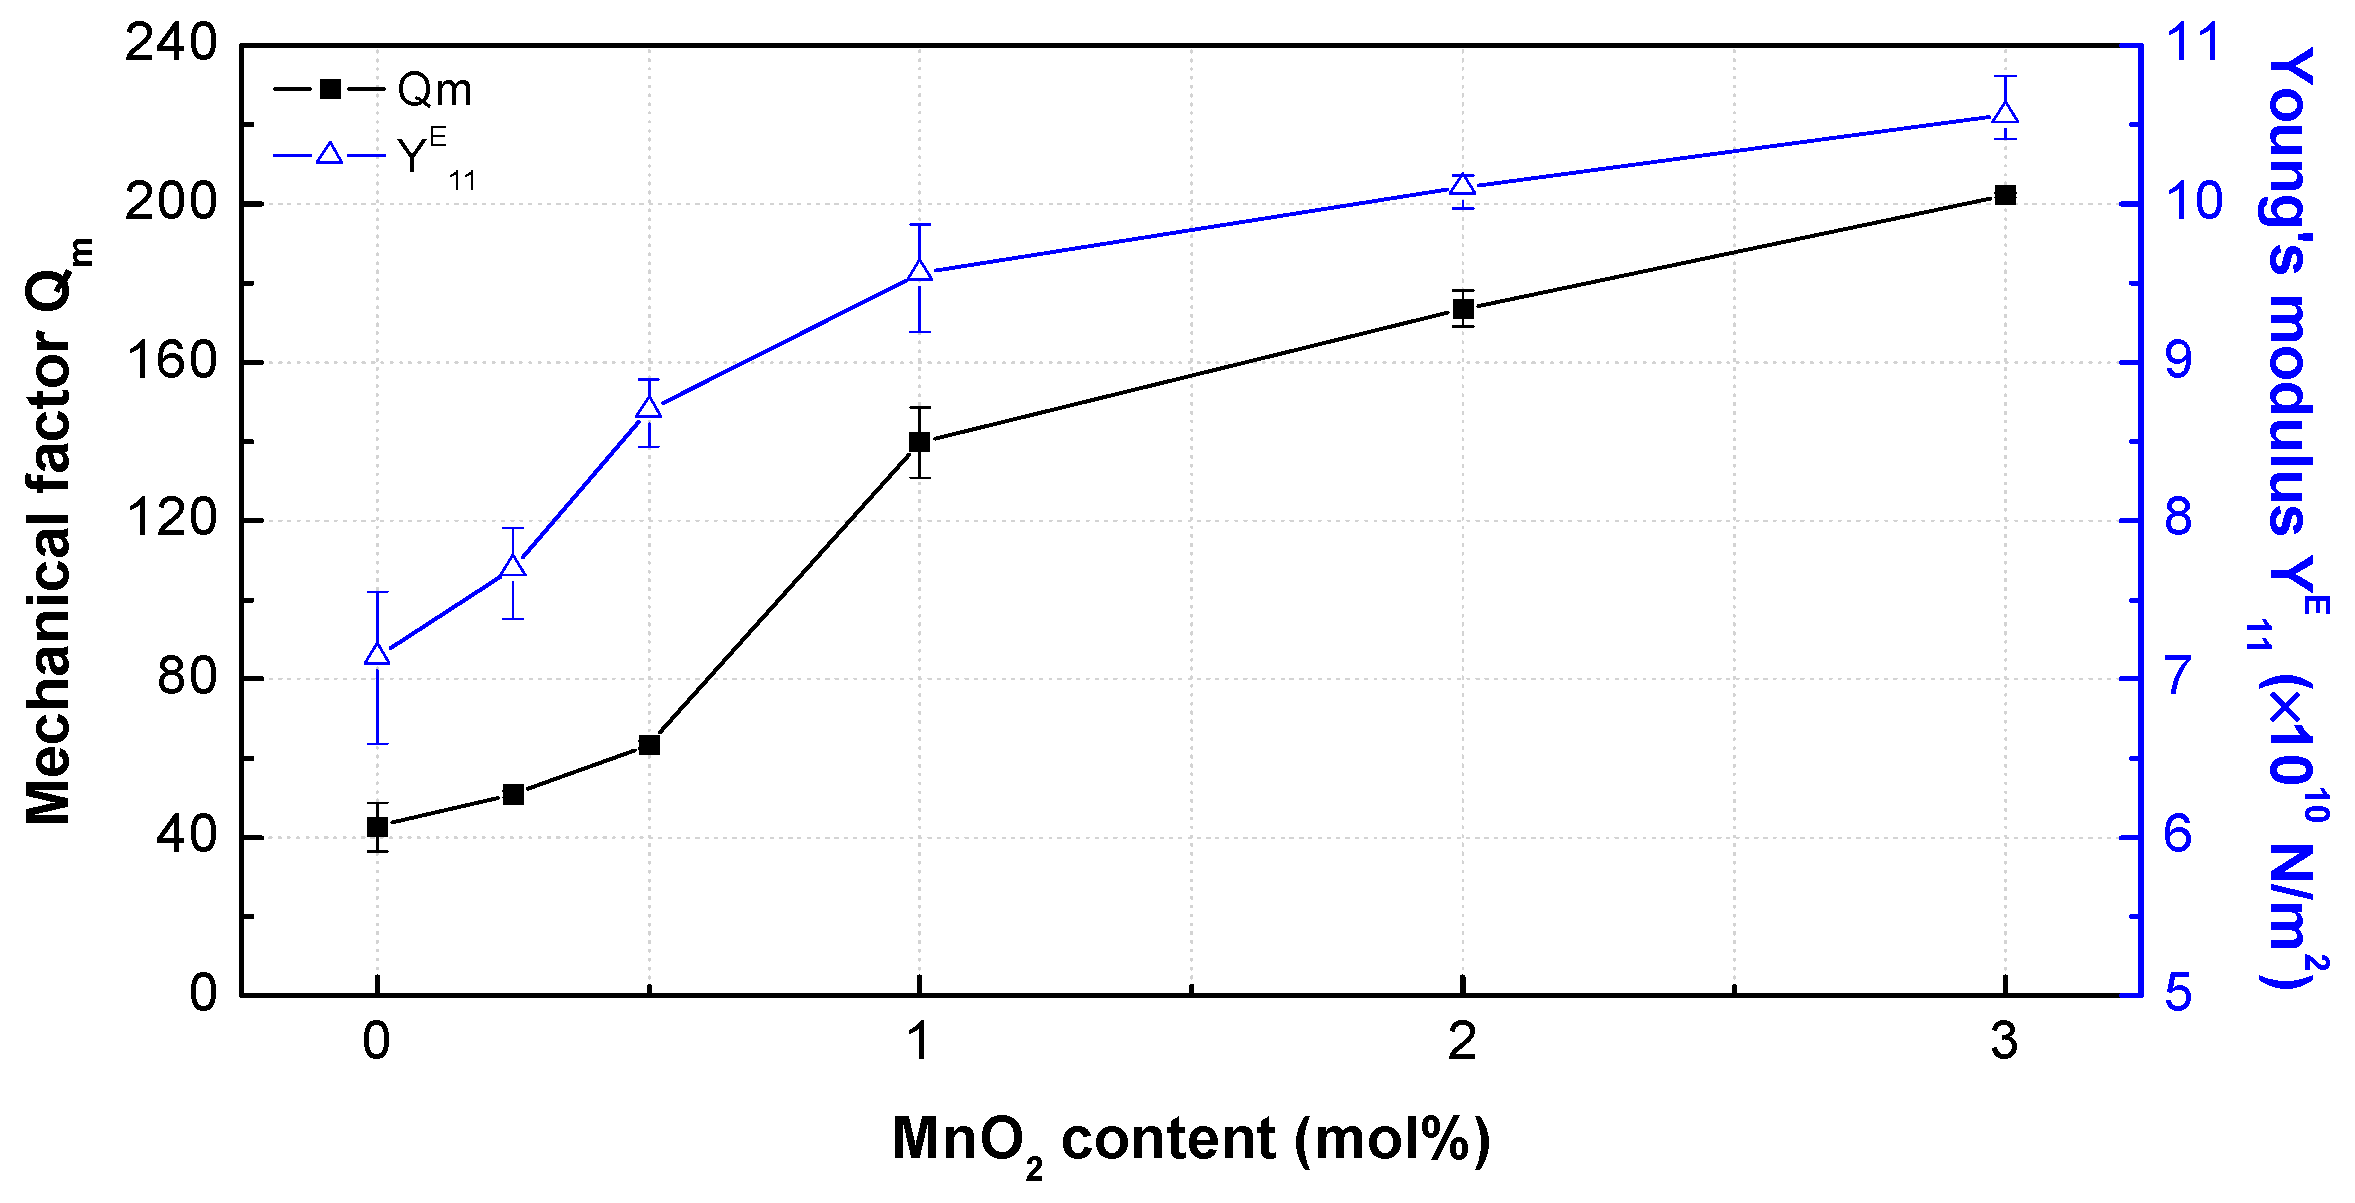
Figure 7 shows the mechanical properties of the PNN-PZT ceramics with varying MnO2 content (0–3 mol%). The mechanical quality factor Qm reflects the steepness of the resonance of the mechanical vibration around the resonance frequency. Therefore, Qm has been considered the main parameter of an ultrasonic actuator. Qm was improved by approximately five times (from 42.70 to 202.26) with the increase in MnO2 content. In addition, the Young’s modulus YE11 was improved from 7.14 to 10.56 with the increase in MnO2 content (a similar curve shape was observed). The changes in mechanical properties with the MnO2 content can be attributed to the oxygen vacancies generated by the accepter doping effect. Therefore, the densifications of the ceramics resulted from the introduction of MnO2, which improved the piezoelectric properties [13]. The density was improved from 7771.09 to 7938.41 kg/m3 with the increase in MnO2 content (Table 2). The oxygen vacancies improved the mechanical properties.
3.4. Piezoelectric Properties
The electromechanical coupling coefficient (kp, −k31) is a constant representing the piezoelectric efficiency of a piezoelectric ceramic, i.e., it represents the efficiency of conversion of electrical energy into mechanical energy. As shown in Figure 8, kp decreased with the increase in MnO2 content to 0.25 mol%. However, it was largely increased at MnO2 contents of 0.25 and 1 mol%, where it reached the maximum of 0.41. Above this concentration, it steadily decreased in the MnO2 content range of 1 to 3 mol%.
The curve shape of −k31 was different. It had the maximum value for the undoped PNN-PZT ceramic, and then steadily decreased with the increase in MnO2 content. The −k31 values at 0.25–1 mol% were similar. At MnO2 concentrations less than 1 mol%, the changes may be attributed to the relatively large increase in tetragonality. Above this concentration, kp and −k31 decreased owing to the hardener doping effect (acceptor substitution inducing point defects) [12,13]. The piezoelectric coefficients (−d31, d33) reflect the distortion originating from the application of an electric field having a uniform strength without stress. Therefore, the piezoelectric coefficients (−d31, d33) have been considered the primary parameters of actuators. The piezoelectric coefficient was calculated by using −k31, YE11, and εT33:
Figure 9 shows the piezoelectric coefficients (−d31, d33) of the PNN-PZT ceramics with varying MnO2 content (0–3 mol%). −d31 and d33 exhibited similar curve shapes; they decreased with the increase in MnO2 content because the decrease rate of εT33 was considerably higher than the increase rates of k31 and YE11. The piezoelectric coefficient exhibited the minimum decrease rate between 0.5 and 1 mol% MnO2, because of the relatively significant increase in tetragonality at 0.5–1 mol%.
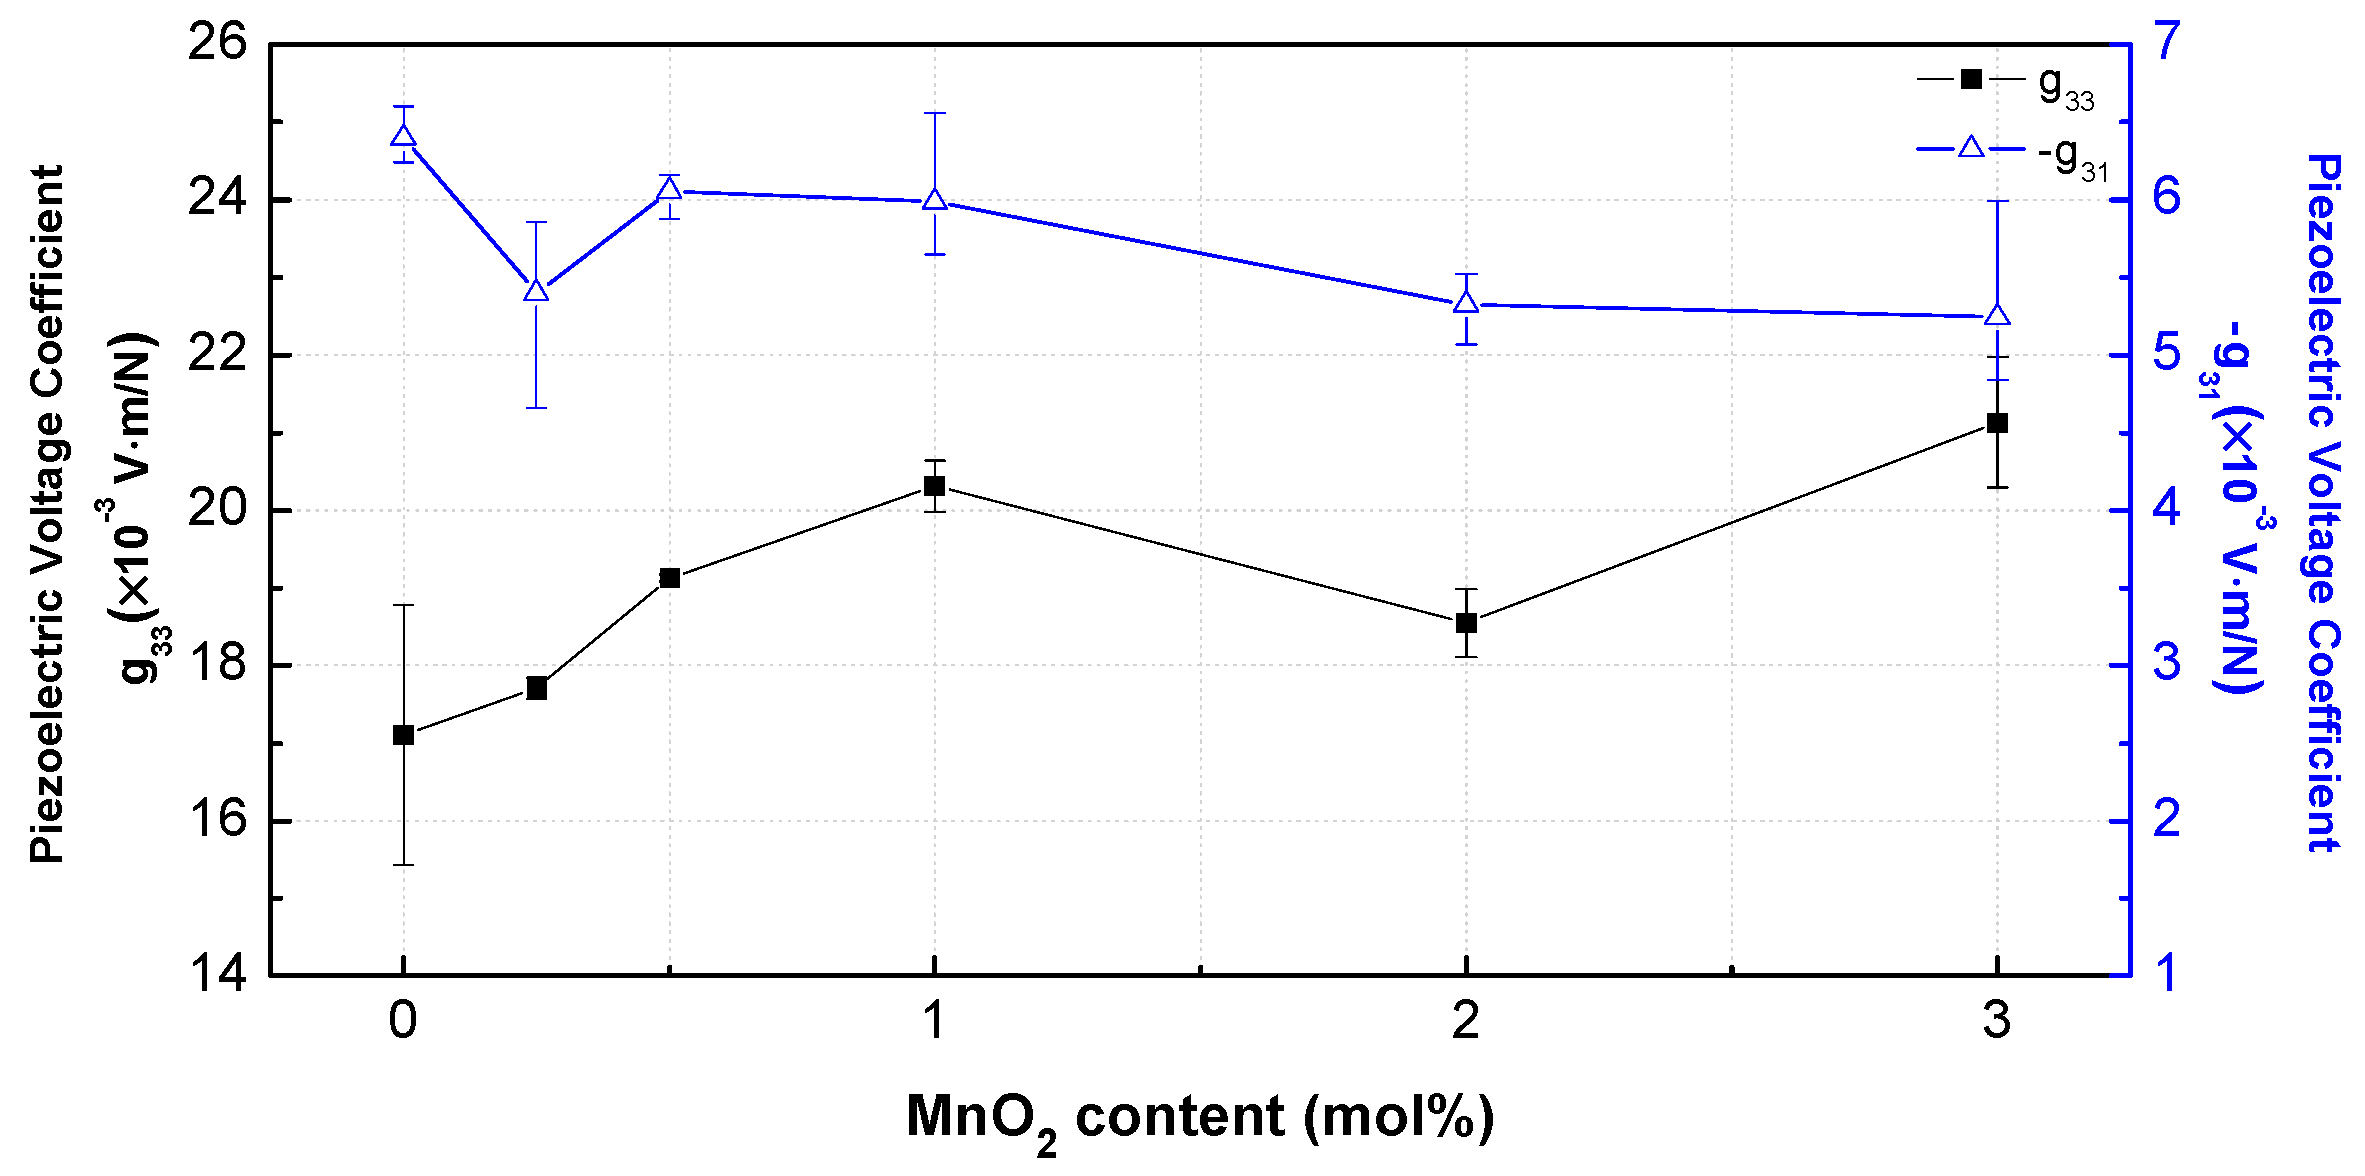
The piezoelectric voltage coefficients (−g31, g33) reflect the field strength, originating from a uniform applied stress without electrical displacement, and thus they represent the sensor properties. The values of −g31 and g33 were calculated by using the relationship between the piezoelectric coefficient d and dielectric constant, g = d/εT. −g31 exhibited a similar tendency to that of k31 (Figure 10). g33 steadily increased to a high value of 20.31 × 10⁻³ Vm/N at 1 mol%. However, it was decreased at 2 mol%, and then largely increased to the maximum of 21.13 × 10⁻³ Vm/N at 3 mol%, as the decrease rate of d33 was smaller than the rate of decrease in εT33. Table 2 shows the densities and dielectric, mechanical, and piezoelectric properties of the PNN-PZT samples with different MnO2 contents (0, 0.25, 0.5, 1, 2, and 3 mol%).
The MnO2 doping can affect the PNN-PZT ceramic properties owing to the increase in number of oxygen vacancies generated by the substitutions of the high-valence Ti4+ and Zr4+ in the perovskite lattice by the low-valence Mn2+ and/or Mn3+, as mentioned above [4]. The oxygen vacancies improved the mechanical properties (Young’s modulus, Qm). The Young’s modulus and Qm exhibited similar curve shapes. Initially, they were rapidly improved, but their increase rates were reduced at MnO2 contents above 1 mol%. The phase of PNN-PZT transformed from rhombohedral to tetragonal with the increase in MnO2 content. The phase transition is attributed to the enhancements in electrical properties, which led to the piezoelectric property changes. Therefore, the dielectric constant, Young’s modulus, electromechanical coupling coefficients (kp,−k31), and piezoelectric properties (−d31, d33, −g31, and g33) of PNN-PZT changed with the density of MnO2 [4].
4. Conclusions
In this study, we investigated the piezoelectric characteristics of 0.55Pb(Ni1/3Nb2/3)O3-0.45Pb(Zr,Ti)O3 according to the MnO2 additive content (0, 0.25, 0.5, 1, 2, and 3 mol%). We measured εr, tanδ, Qm, YE11, d31, d33, g31, and g33 as functions of the MnO2 concentration. The MnO2 addition initially improved the tetragonality of the PNN-PZT ceramic, which then saturated at a MnO2 content of 1 mol%.
Qm and Young’s modulus (YE11) also increased with the MnO2 content owing to the oxygen vacancies generated by the MnO2 doping. The dielectric properties and electromechanical coupling coefficient k were optimal at MnO2 contents of 0.5–1 mol%, where tanδ and kp had the maximum values. The changes in electrical properties were attributed to the increased tetragonality. PNN-PZT is a soft piezoelectric material more suitable for actuator applications. The addition of MnO2 to PNN-PZT showed its potentials for use in sensory actuators. In following studies, we aim to investigate vibration control and nondestructive testing applications based on the enhanced PNN-PZT ceramics.
Author Contributions
Conceptualization, M.K., and L.-H.K.; methodology, M.K., and L.-H.K.; formal analysis, M.K.; resources, M.K., and L.-H.K.; writing—original draft preparation, M.K.; writing—review and editing, L.-H.K.; supervision, L.-H.K.; project administration, L.-H.K.; funding acquisition, L.-H.K.
Funding
This study was supported by the Ministry of Trade, Industry, and Energy, Korea, under the Sensor Industry Enhancement Program (20003125, Development of an Ultraprecision Measurement Sensor Based on the Fiber Composite for Flaw Detection of the Composite Structure).
Conflicts of Interest
The authors declare no conflict of interest.
References
- Mahajan, S.; Thakur, O.P.; Prakash, C. Effect of Sintering Temperature on Structural and Piezoelectric Properties of PNN-PZT Ceramics. Def. Sci. J. 2007, 57, 23–28. [Google Scholar] [CrossRef] [Green Version]
- Gouadec, G.; Colomban, P.; Slodczyk, A.; Pham-Thi, M. Stress and temperature driven phase transitions in single crystalline KNbO3 and textured KNL-NTS ceramics: A Raman andthermal expansion study. In Proceedings of the 2014 Joint IEEE International Symposium on the Applications of Ferroelectric, International Workshop on Acoustic Transduction Materials and Devices & Workshop on Piezoresponse Force Microscopy, State College, PA, USA, 12–16 May 2014; pp. 1–4. [Google Scholar]
- Du, J.; Qiu, J.; Zhu, K.; Ji, H. Enhanced piezoelectric properties of 0.55Pb(Ni1/3Nb2/3)O3-0.135PbZrO3-0.315PbTiO3 ternary ceramics by optimizing sintering temperature. J. Electroceramics 2014, 32, 234–239. [Google Scholar] [CrossRef]
- Liu, H.; Nie, R.; Yue, Y.; Zhang, Q.; Chen, Q.; Zhu, J.; Yu, P.; Xiao, D.; Wang, C.; Wang, X. Effect of MnO2 doping on piezoelectric, dielectric and ferroelectric properties of PNN–PZT ceramics. Ceram. Int. 2015, 41, 11359–11364. [Google Scholar] [CrossRef]
- Luff, D.; Lane, R.; Brown, K.R.; Marshallsay, H.J. Piezoelectric properties of 0.5Pb(Ni1/3Nb2/3)O3-0.35PbTiO3-0.15PbZrO3 ceramics. Trans. J. Br. Ceram. Soc. 1974, 73, 251. [Google Scholar]
- Vittayakorn, N.; Rujijanagul, G.; Tan, X.; Marquardt, M.A.; Cann, D.P. The morphotropic phase boundary and dielectric properties of the xPb(Zr1/2Ti1/2)O3-(1 − x)Pb(Ni1/3Nb2/3)O3 perovskite solid solution. J. Appl. Phys. 2004, 96, 5103–5109. [Google Scholar] [CrossRef]
- Cao, R.; Li, G.; Zeng, J.; Zhao, S.; Zheng, L.; Yin, Q. The piezoelectric and dielectric properties of 0.3Pb (Ni1/3Nb2/3)O3-xPbTiO3-(0.7 − x)PbZrO3 ferroelectric ceramics near the morphotropic phase boundary. J. Am. Ceram. Soc. 2010, 93, 737–741. [Google Scholar] [CrossRef]
- Nam, C.H.; Park, H.Y.; Seo, I.T.; Choi, J.H.; Joung, M.R.; Nahm, S.; Lee, H.J.; Kim, Y.H.; Sung, T.H. Low-Temperature Sintering and Piezoelectric Properties of 0.65Pb(Zr1 − xTix)O3-0.35Pb(Ni0.33Nb0.67)O3 Ceramics. J. Am. Ceram. Soc. 2011, 94, 3442–3448. [Google Scholar] [CrossRef]
- Yu, C.S.; Hsieh, H.L. Piezoelectric properties of Pb(Ni1/3,Sb2/3)O3-PbTiO3-PbZrO3 ceramics modified with MnO2 additive. J. Eur. Ceram. Soc. 2005, 25, 2425–2427. [Google Scholar] [CrossRef]
- Bamière, F.; Benkert, K.; Radanielina, M.; Schuh, C.; Hoffmann, M.J. Low temperature sintering and high piezoelectric properties of strontium doped PNZT–PNN ceramics processed via the columbite route. J. Eur. Ceram. Soc. 2007, 27, 3613–3617. [Google Scholar] [CrossRef]
- Du, J.; Qiu, J.; Zhu, K.; Ji, H.; Pang, X.; Luo, J. Effects of Fe2O3 doping on the microstructure and piezoelectric properties of 0.55Pb(Ni1/3Nb2/3)O3-0.45Pb(Zr0.3Ti0.7)O3 ceramics. Mater. Lett. 2012, 66, 153–155. [Google Scholar] [CrossRef]
- Yoo, J.; Lee, S. Piezoelectric properties of MnO2 doped low temperature sintering Pb(Mn1/3Nb2/3)O3-Pb(Ni1/3Nb2/3)O3-Pb(Zr0.50Ti0.50)O3 ceramics. J. Electroceramics 2009, 23, 432. [Google Scholar] [CrossRef]
- Liao, Q.; Chen, X.; Chu, X.; Zeng, F.; Guo, D. Effect of Fe doping on the structure and electric properties of relaxor type BSPT-PZN piezoelectric ceramics near the morphotropic phase boundary. Sens. Actuators A Phys. 2013, 201, 222–229. [Google Scholar] [CrossRef] [Green Version]
- Kang, S.H.; Kang, M.; Kang, L.H. Piezoelectric smart composite blades for collision monitoring: Measurement of mechanical properties and impact sensitivity. Composit. Struct. 2018, 202, 1295–1307. [Google Scholar]
Figure 1.
Schematic phase diagram of Pb(Ni1/3Nb2/3)O3-PbTiO3-PbZrO3 ceramics.
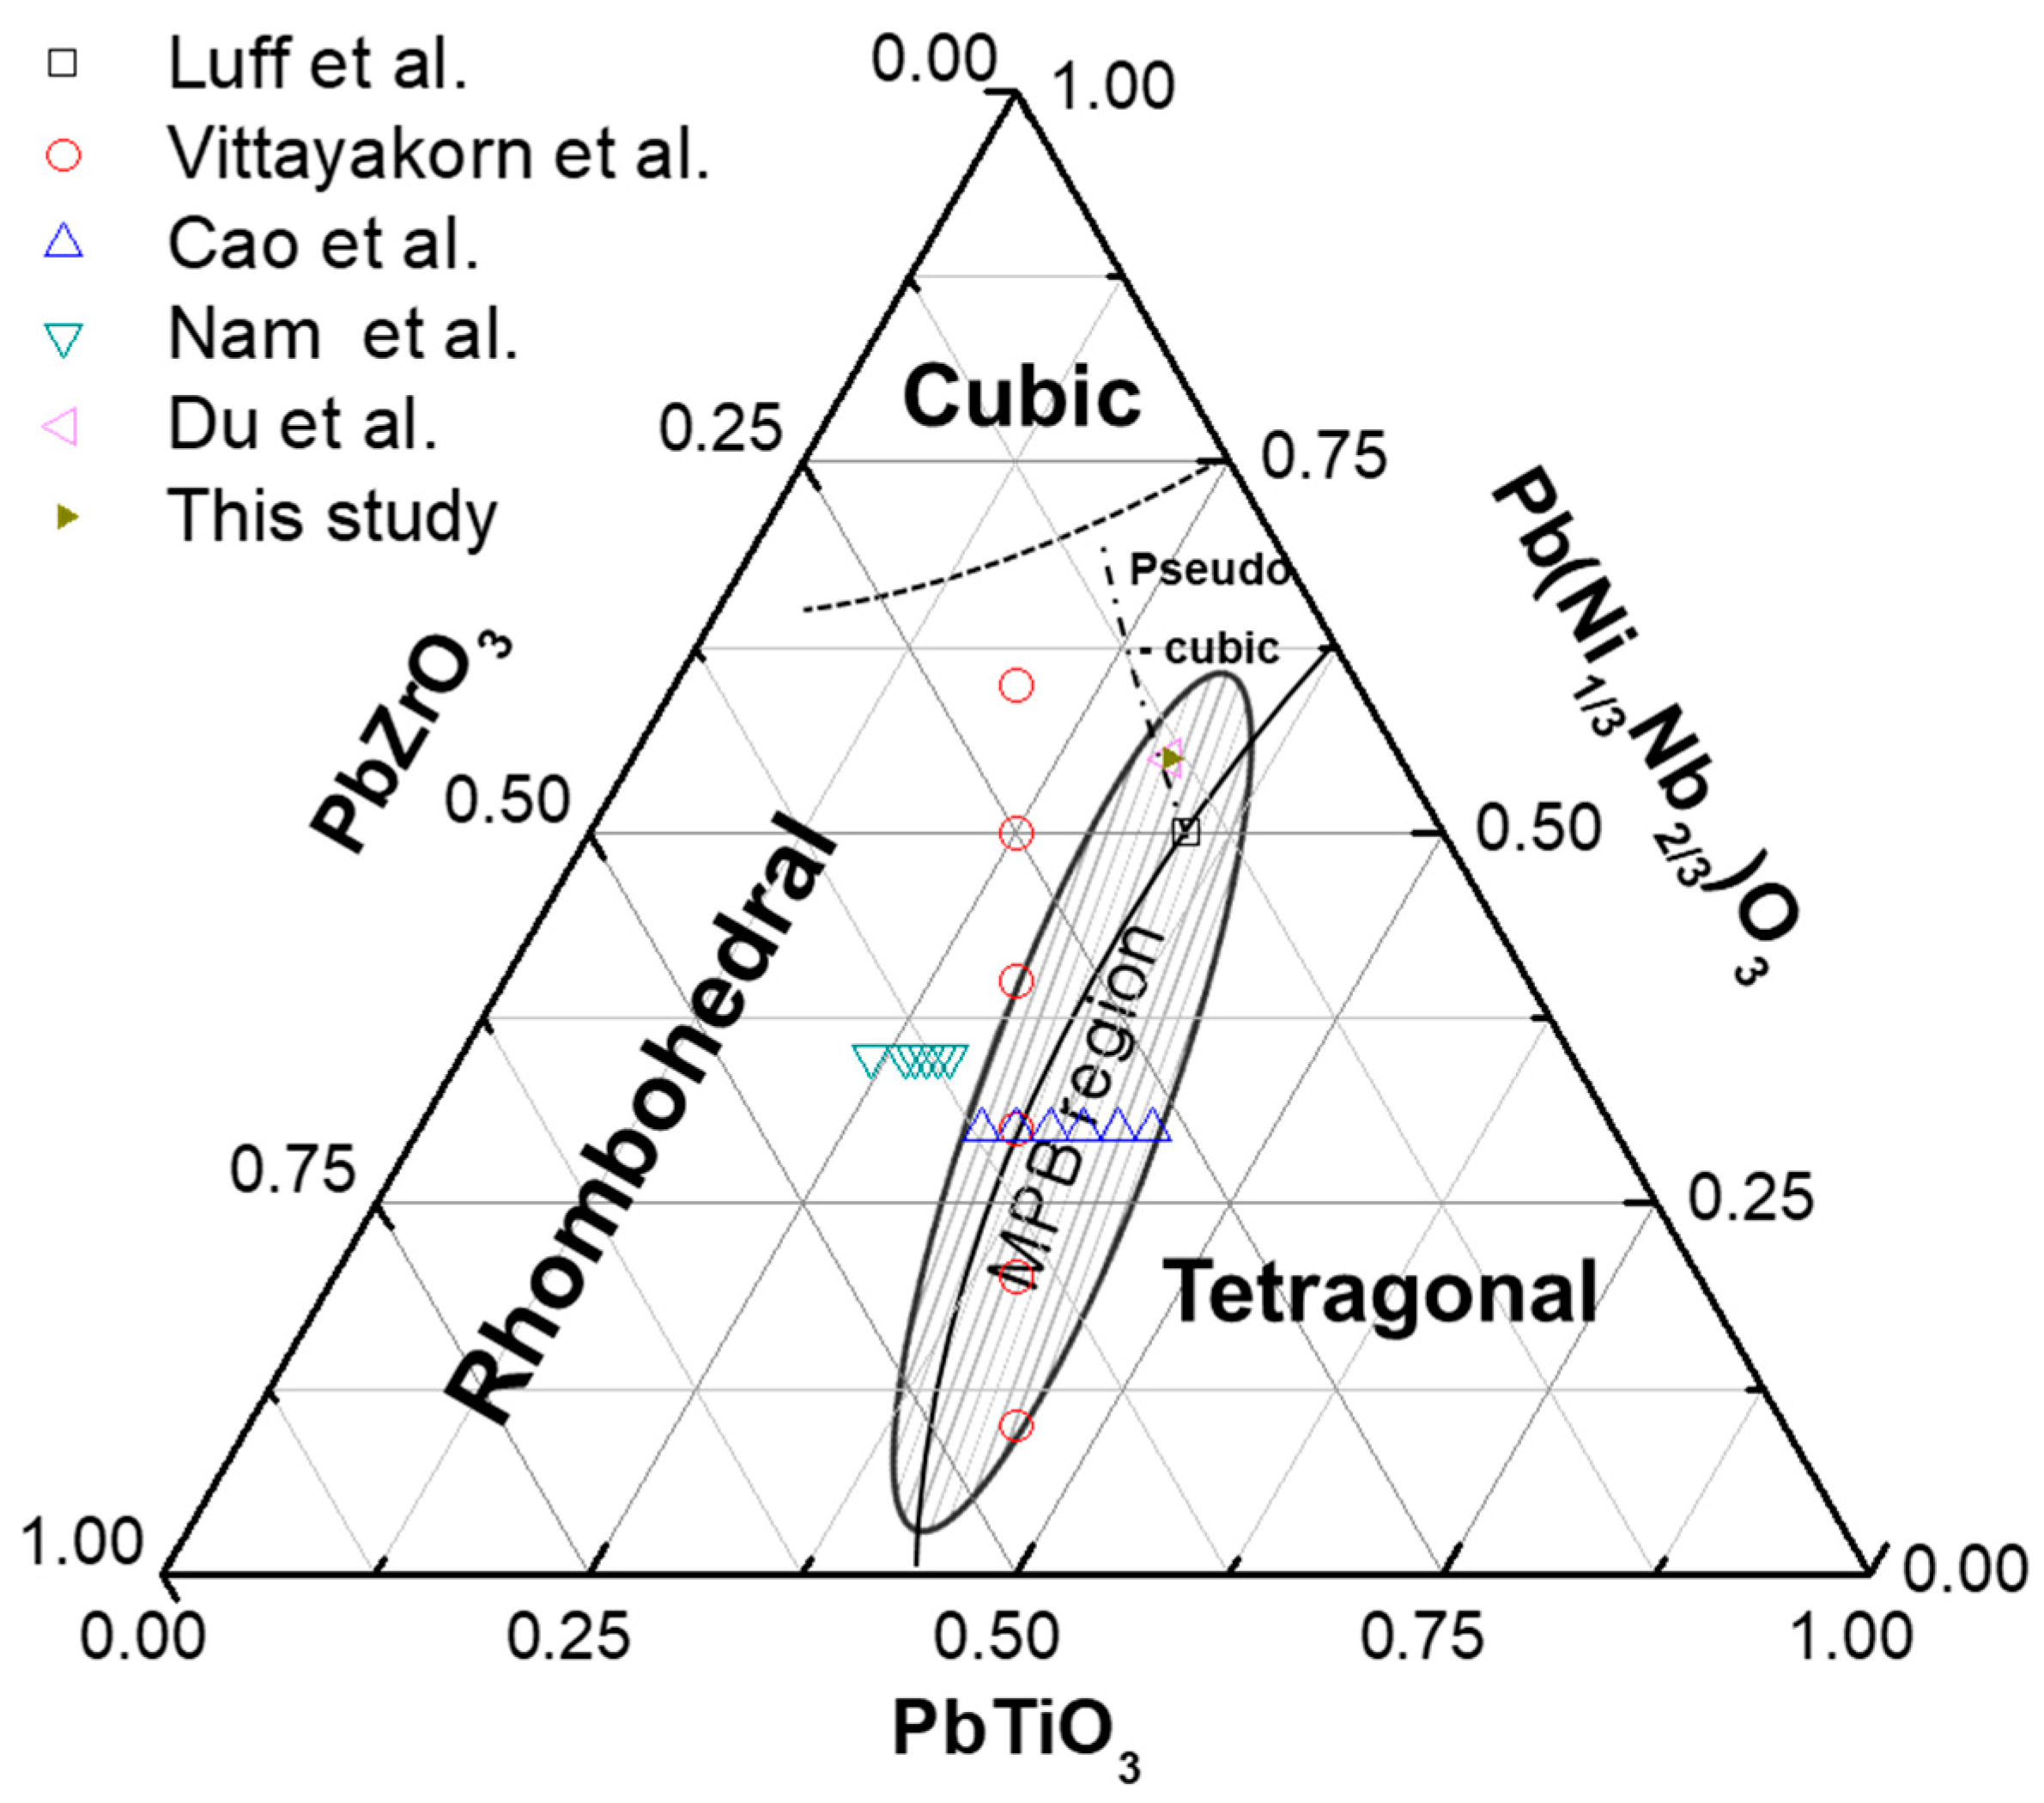
Figure 2.
XRD patterns of the 0.55PNN-0.45PZT ceramics with varying MnO2 content in the 2θ range of 10–90°.
Figure 2.
XRD patterns of the 0.55PNN-0.45PZT ceramics with varying MnO2 content in the 2θ range of 10–90°.

Figure 3.
XRD patterns of the 0.55PNN-0.45PZT ceramics with different MnO2 contents in the 2θ range of 44.5–45.5°. T represents the tetragonal phase, while R represents the rhombohedral phase.
Figure 3.
XRD patterns of the 0.55PNN-0.45PZT ceramics with different MnO2 contents in the 2θ range of 44.5–45.5°. T represents the tetragonal phase, while R represents the rhombohedral phase.
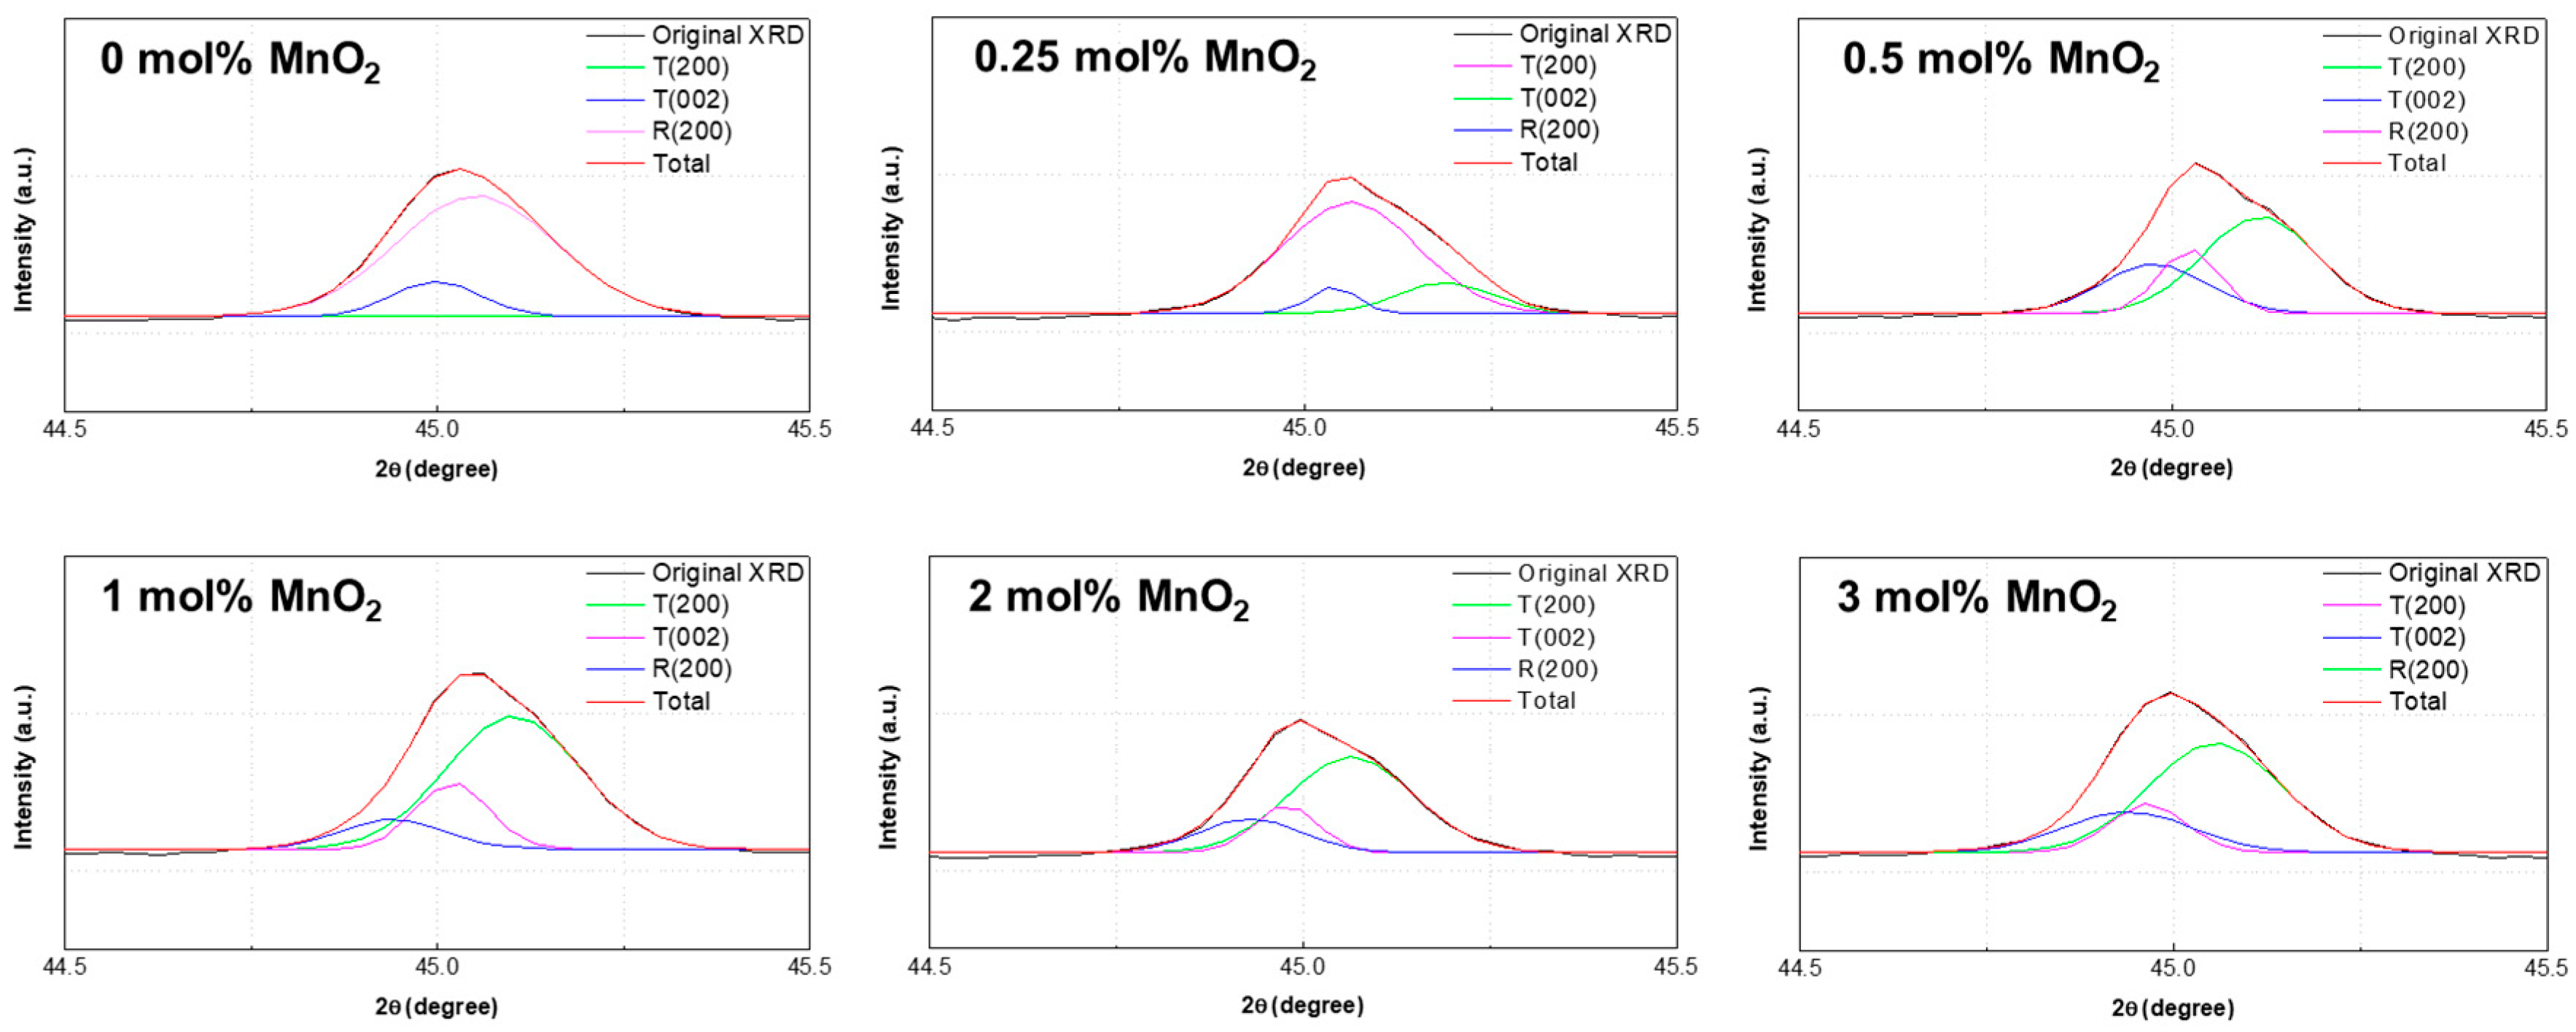
Figure 4.
Tetragonality of the 0.55Pb(Ni1/3Nb2/3)O3-0.45Pb(Zr,Ti)O3 (PNN-PZT) ceramic as a function of the MnO2 content in the range of 0–3 mol%.
Figure 4.
Tetragonality of the 0.55Pb(Ni1/3Nb2/3)O3-0.45Pb(Zr,Ti)O3 (PNN-PZT) ceramic as a function of the MnO2 content in the range of 0–3 mol%.

Figure 5.
SEM images of the PNN-PZT ceramics with 0–3 mol% MnO2 content.

Figure 6.
Dielectric constants εr and dielectric losses tanδ (%) of the PNN-PZT ceramics with different MnO2 concentrations measured at 1 kHz at room temperature.
Figure 6.
Dielectric constants εr and dielectric losses tanδ (%) of the PNN-PZT ceramics with different MnO2 concentrations measured at 1 kHz at room temperature.

Figure 7.
Mechanical factors Qm and Young’s moduli YE11 of the PNN-PZT ceramics with 0–3 mol% MnO2 concentrations at 1 kHz.
Figure 7.
Mechanical factors Qm and Young’s moduli YE11 of the PNN-PZT ceramics with 0–3 mol% MnO2 concentrations at 1 kHz.

Figure 8.
Electromechanical coupling coefficients kp and k31 of the PNN-PZT ceramics with different MnO2 concentrations in the range of 0–3 mol%.
Figure 8.
Electromechanical coupling coefficients kp and k31 of the PNN-PZT ceramics with different MnO2 concentrations in the range of 0–3 mol%.
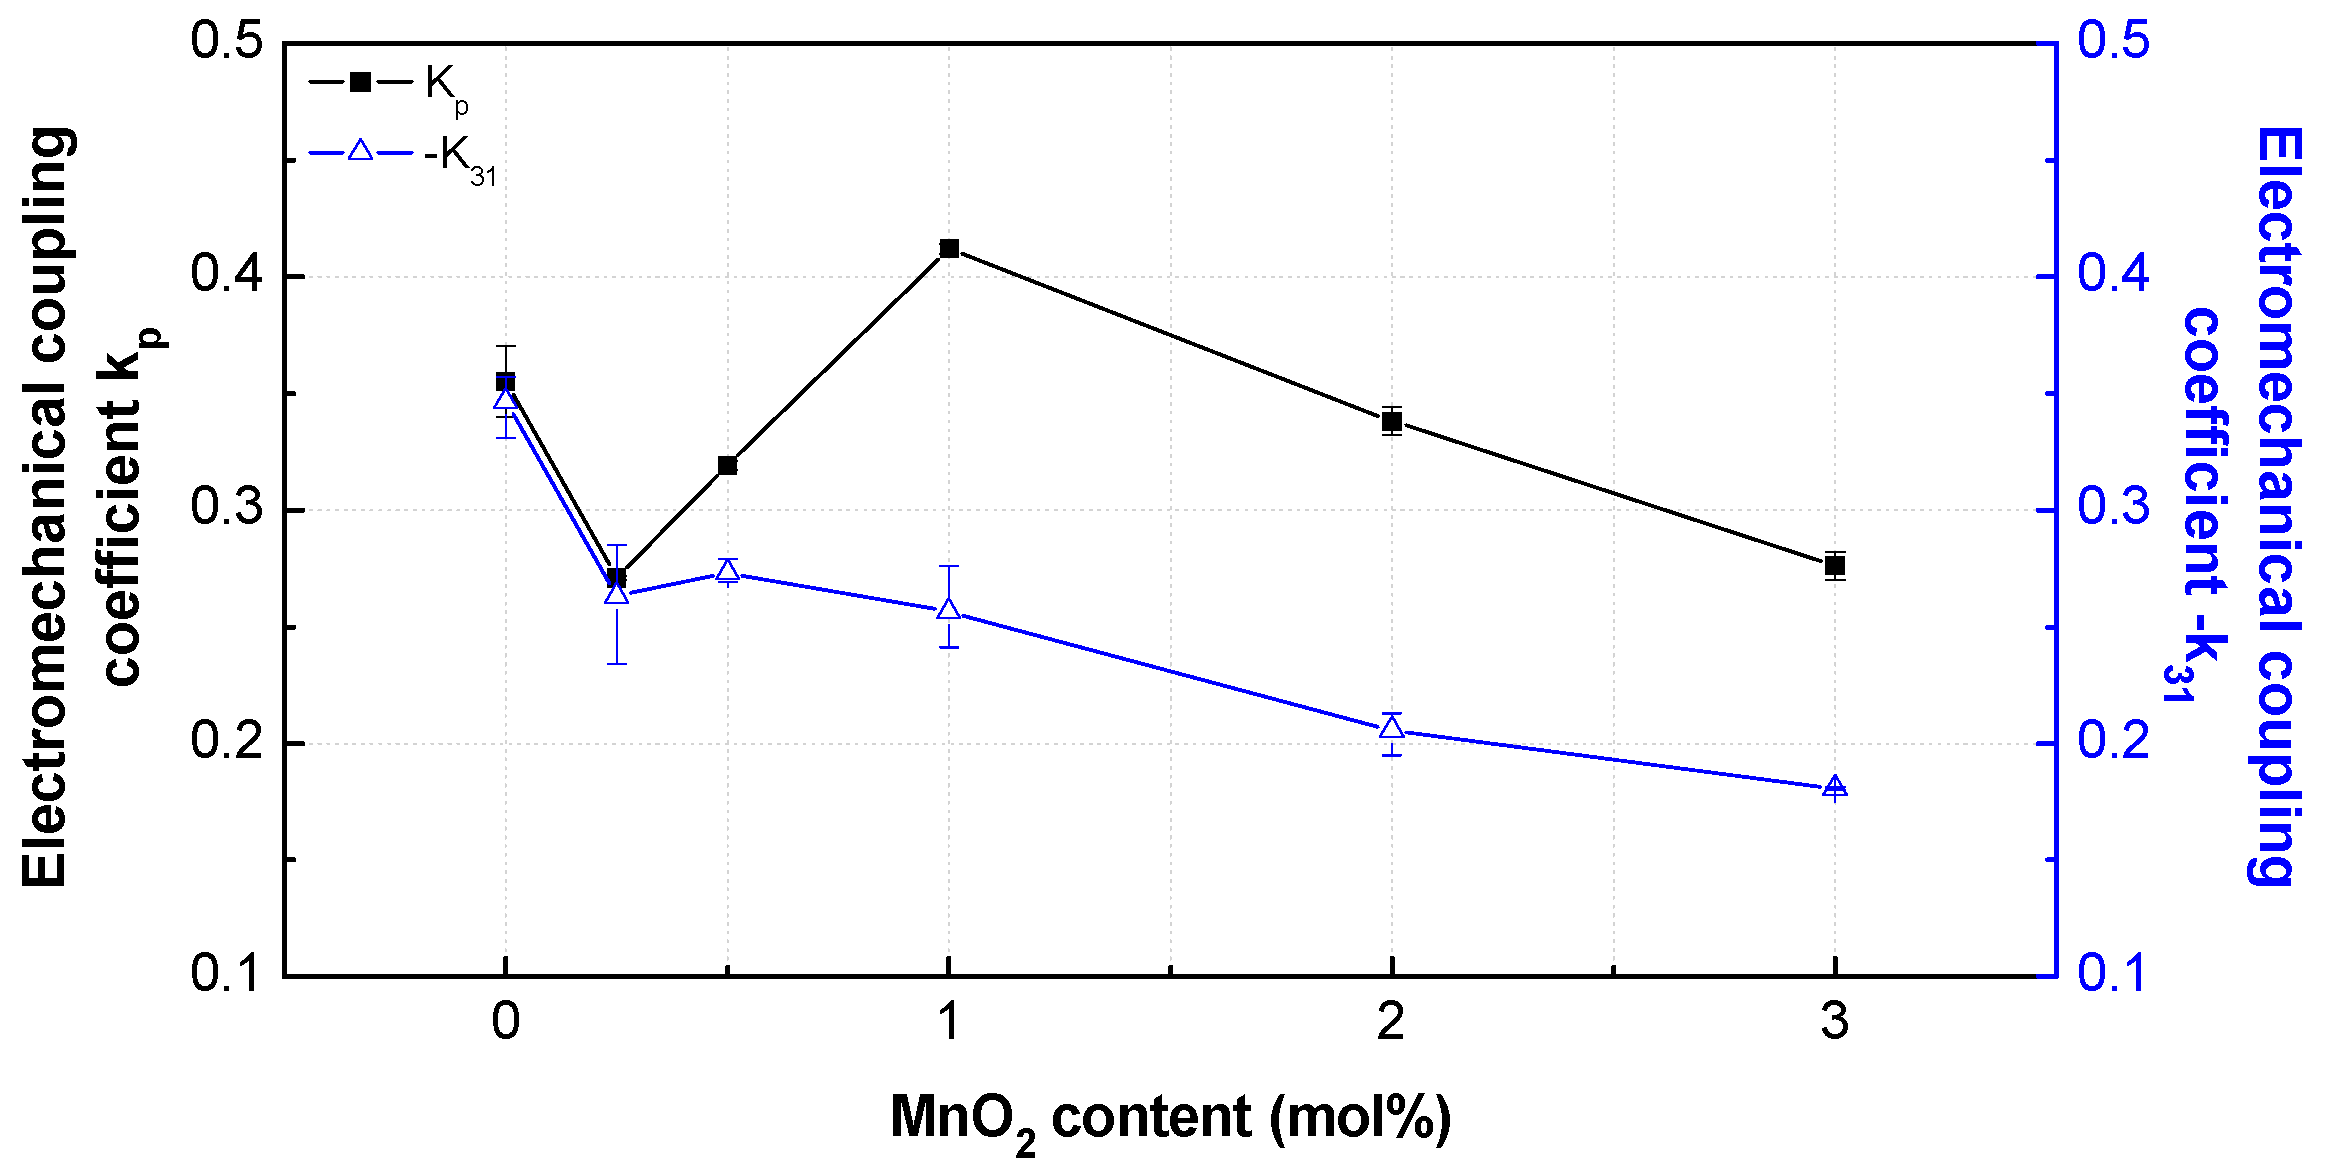
Figure 9.
Piezoelectric coefficients d33 and −d31 of the PNN-PZT ceramics with different MnO2 concentrations in the range of 0–3 mol%.
Figure 9.
Piezoelectric coefficients d33 and −d31 of the PNN-PZT ceramics with different MnO2 concentrations in the range of 0–3 mol%.

Figure 10.
Piezoelectric voltage coefficients g33 and −g31 of the PNN-PZT ceramics with different MnO2 concentrations in the range of 0–3 mol%.
Figure 10.
Piezoelectric voltage coefficients g33 and −g31 of the PNN-PZT ceramics with different MnO2 concentrations in the range of 0–3 mol%.

Table 1.
Literature table of piezoelectric ceramic and properties according to doping materials.
| Authors | Piezoelectric Ceramic | Doping | Properties |
|---|---|---|---|
| Yu et al. [9] | 0.12Pb(Ni1/3Sb2/3)-0.48PbTiO3-0.40PbZrO3 | 0.15 wt% MnO2 | Kp = 0.68, εr = 3069, Qm = 181, tanδ = 5.4 × 10⁻³ |
| Bamiere et al. [10] | 0.674Pb,Nd(Zr, Ti)O3-Pb(Ni1/3Nb2/3)O3 | SrCO3 (0~4 mol%) | Lower the sintering temperature |
| Du et al. [11] | 0.55Pb(Ni1/3Nb2/3)O3-0.45Pb(Zr0.3Ti0.7)O3 | Fe2O3 (0~1.6 mol%) | ρ = 7.97 g/cm3, d33 = 956 pC/N, Kp = 0.74, εr = 6095, tanδ = 26 × 10−3 |
| Yoo et al. [12] | 0.02Pb(Mn1/3Nb2/3)O3-0.12Pb(Ni1/3Nb2/3)O3-0.86Pb(Zr0.5Ti0.5)O3 | 0.2 wt% MnO2 | ρ = 7.816 g/cm3, d33 = 356 pC/N, kp = 0.597, εr = 920, Qm = 1186 |
| Liao et al. [13] | 0.35BiScO3-0.6PbTiO3-0.05Pb(Zn1/3Nb2/3)O3 | Fe2O3 (0~1.6 mol%) | Largely reduced tanδ and d33, but improved Qm |
| Liu et al. [4] | 0.55Pb(Ni1/3Nb2/3)O3-0.45Pb(Zr0.3Ti0.7)O3 | 1 mol% MnO2 | d33 = 710 pC/N, kp = 0.595, εr = 3092.25, tanδ = 14.9 × 10⁻³, Qm = 176 |
Table 2.
Piezoelectric coefficients d33 and −d31 of the PNN-PZT ceramics with different MnO2 concentrations in the range of 0–3 mol%.
Table 2.
Piezoelectric coefficients d33 and −d31 of the PNN-PZT ceramics with different MnO2 concentrations in the range of 0–3 mol%.
| MnO2 Content | Density (kg/m3) | εr at 1 kHz | tanδ (%) at 1 kHz | Qm | YE11 (× 1010 N/m2) | K31 | kp | −d31 (pC/N) | d33 (pC/N) | −g31 (× 10−3 V∙m/N) | g33 (× 10−3 V∙m/N) |
|---|---|---|---|---|---|---|---|---|---|---|---|
| 0 mol% | 7771.09 | 4925.51 | 5.6 | 42.70 | 7.14 | 0.35 | 0.36 | 243.40 | 746 | 6.40 | 17.10 |
| 0.25 mol% | 7782.96 | 3772.38 | 2.85 | 50.99 | 7.70 | 0.26 | 0.27 | 167.07 | 592 | 5.40 | 17.71 |
| 0.5 mol% | 7864.18 | 3177.74 | 1.6 | 63.49 | 8.70 | 0.27 | 0.32 | 140.40 | 538 | 6.06 | 19.13 |
| 1 mol% | 7936.33 | 2965.10 | 1.6 | 139.70 | 9.56 | 0.26 | 0.41 | 115.01 | 533 | 5.99 | 20.31 |
| 2 mol% | 7938.13 | 2408.93 | 2.4 | 173.50 | 10.11 | 0.21 | 0.34 | 78.51 | 396 | 5.33 | 18.55 |
| 3 mol% | 7938.41 | 1826.92 | 4.5 | 202.26 | 10.56 | 0.18 | 0.28 | 68.98 | 342 | 5.24 | 21.13 |
© 2019 by the authors. Licensee MDPI, Basel, Switzerland. This article is an open access article distributed under the terms and conditions of the Creative Commons Attribution (CC BY) license (http://creativecommons.org/licenses/by/4.0/).
Share and Cite
MDPI and ACS Style
Kang, M.; Kang, L.-H. Piezoelectric Characteristics of 0.55Pb(Ni1/3Nb2/3)O3-0.45Pb(Zr,Ti)O3 Ceramics with Different MnO2 Concentrations for Ultrasound Transducer Applications. Materials 2019, 12, 4115. https://doi.org/10.3390/ma12244115
AMA Style
Kang M, Kang L-H. Piezoelectric Characteristics of 0.55Pb(Ni1/3Nb2/3)O3-0.45Pb(Zr,Ti)O3 Ceramics with Different MnO2 Concentrations for Ultrasound Transducer Applications. Materials. 2019; 12(24):4115. https://doi.org/10.3390/ma12244115
Chicago/Turabian StyleKang, Myeongcheol, and Lae-Hyong Kang. 2019. "Piezoelectric Characteristics of 0.55Pb(Ni1/3Nb2/3)O3-0.45Pb(Zr,Ti)O3 Ceramics with Different MnO2 Concentrations for Ultrasound Transducer Applications" Materials 12, no. 24: 4115. https://doi.org/10.3390/ma12244115
Note that from the first issue of 2016, this journal uses article numbers instead of page numbers. See further details here.