Optimized Dental Implant Fixture Design for the Desirable Stress Distribution in the Surrounding Bone Region: A Biomechanical Analysis
 ,
,  , , and
Abstract
:1. Introduction
2. Materials and Methods
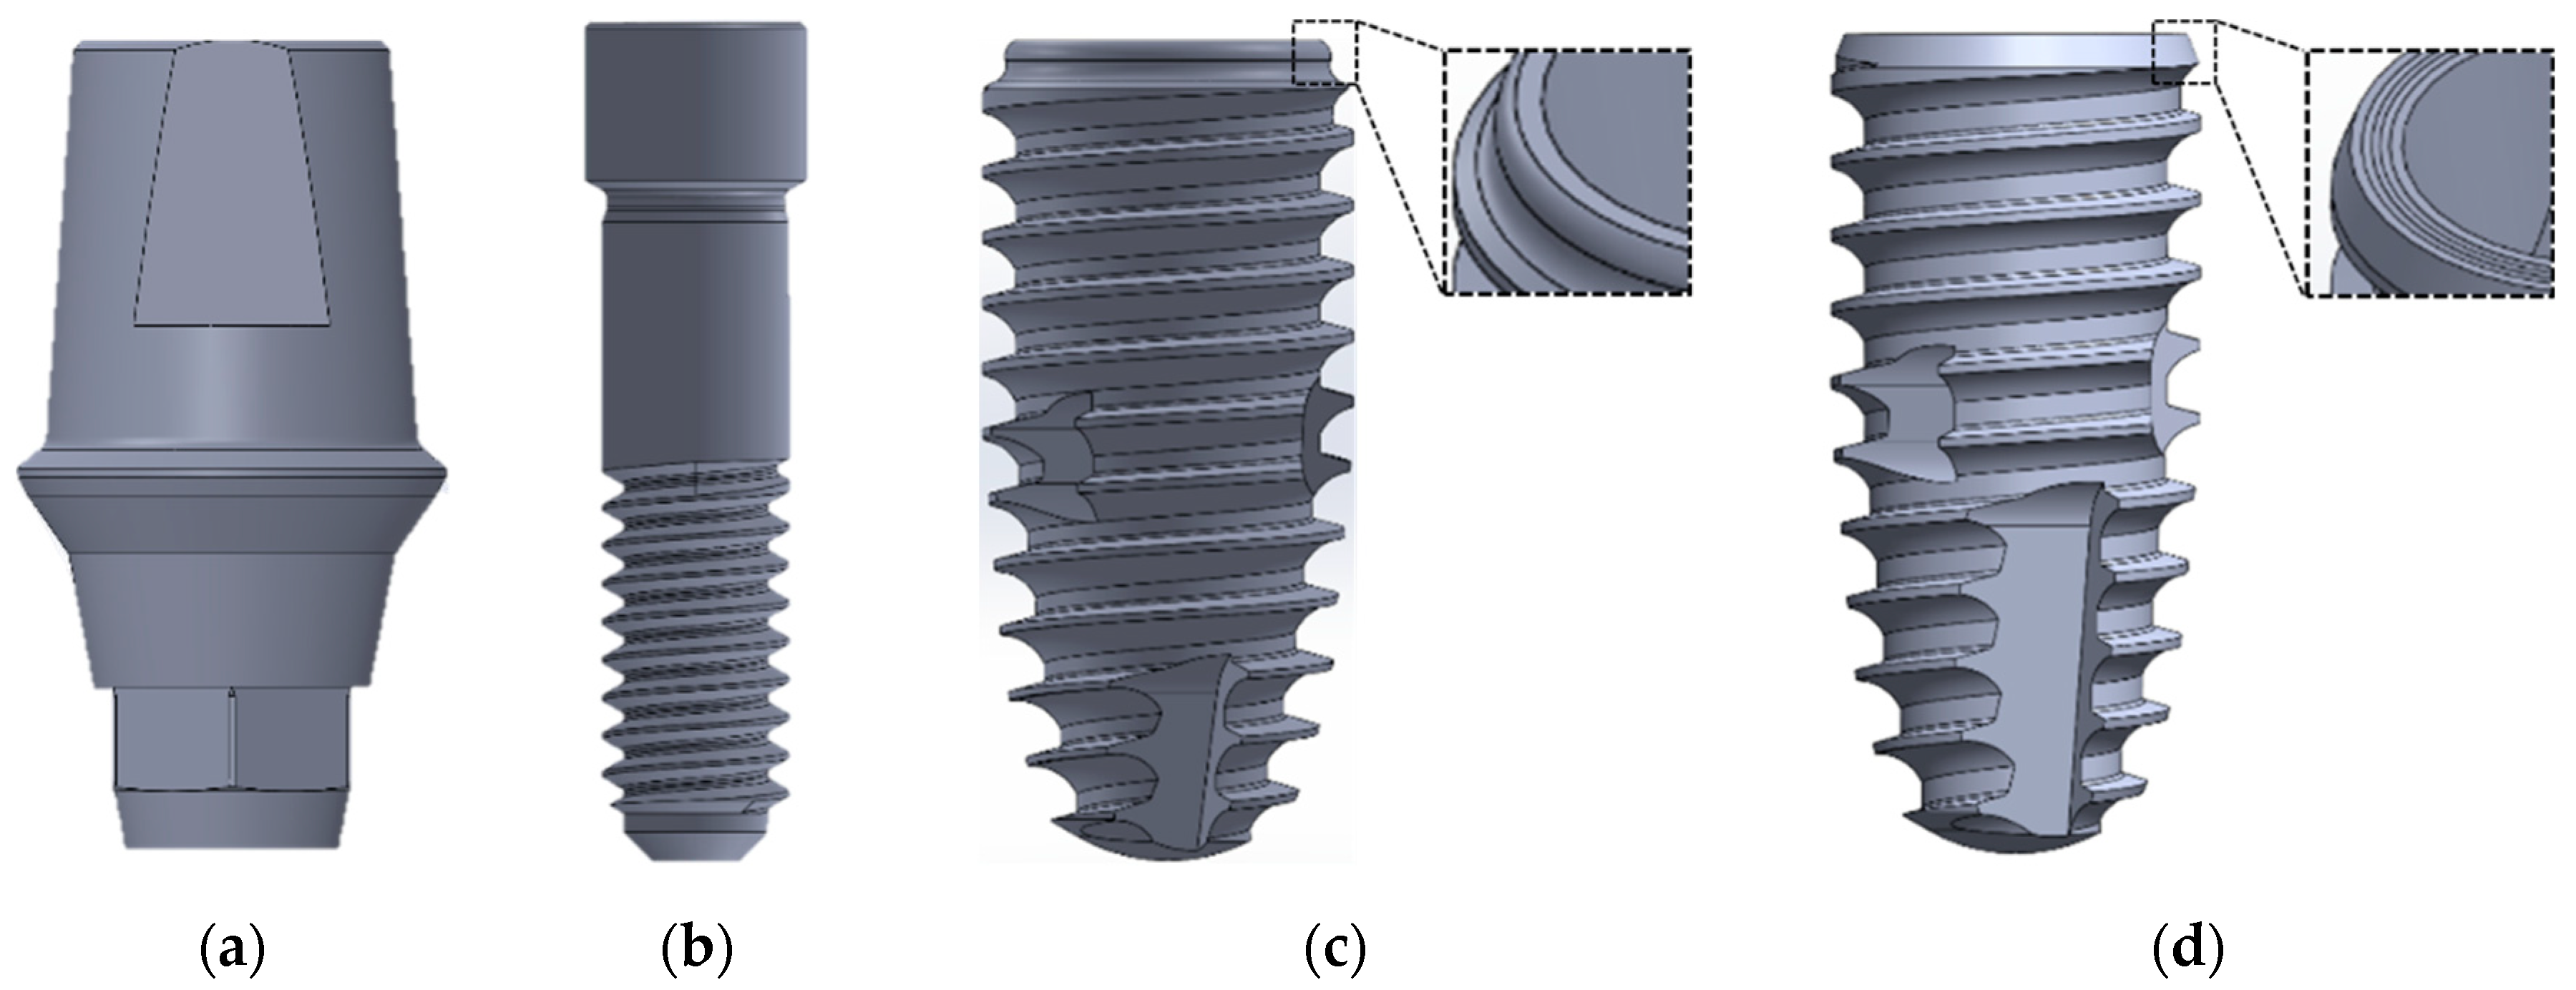
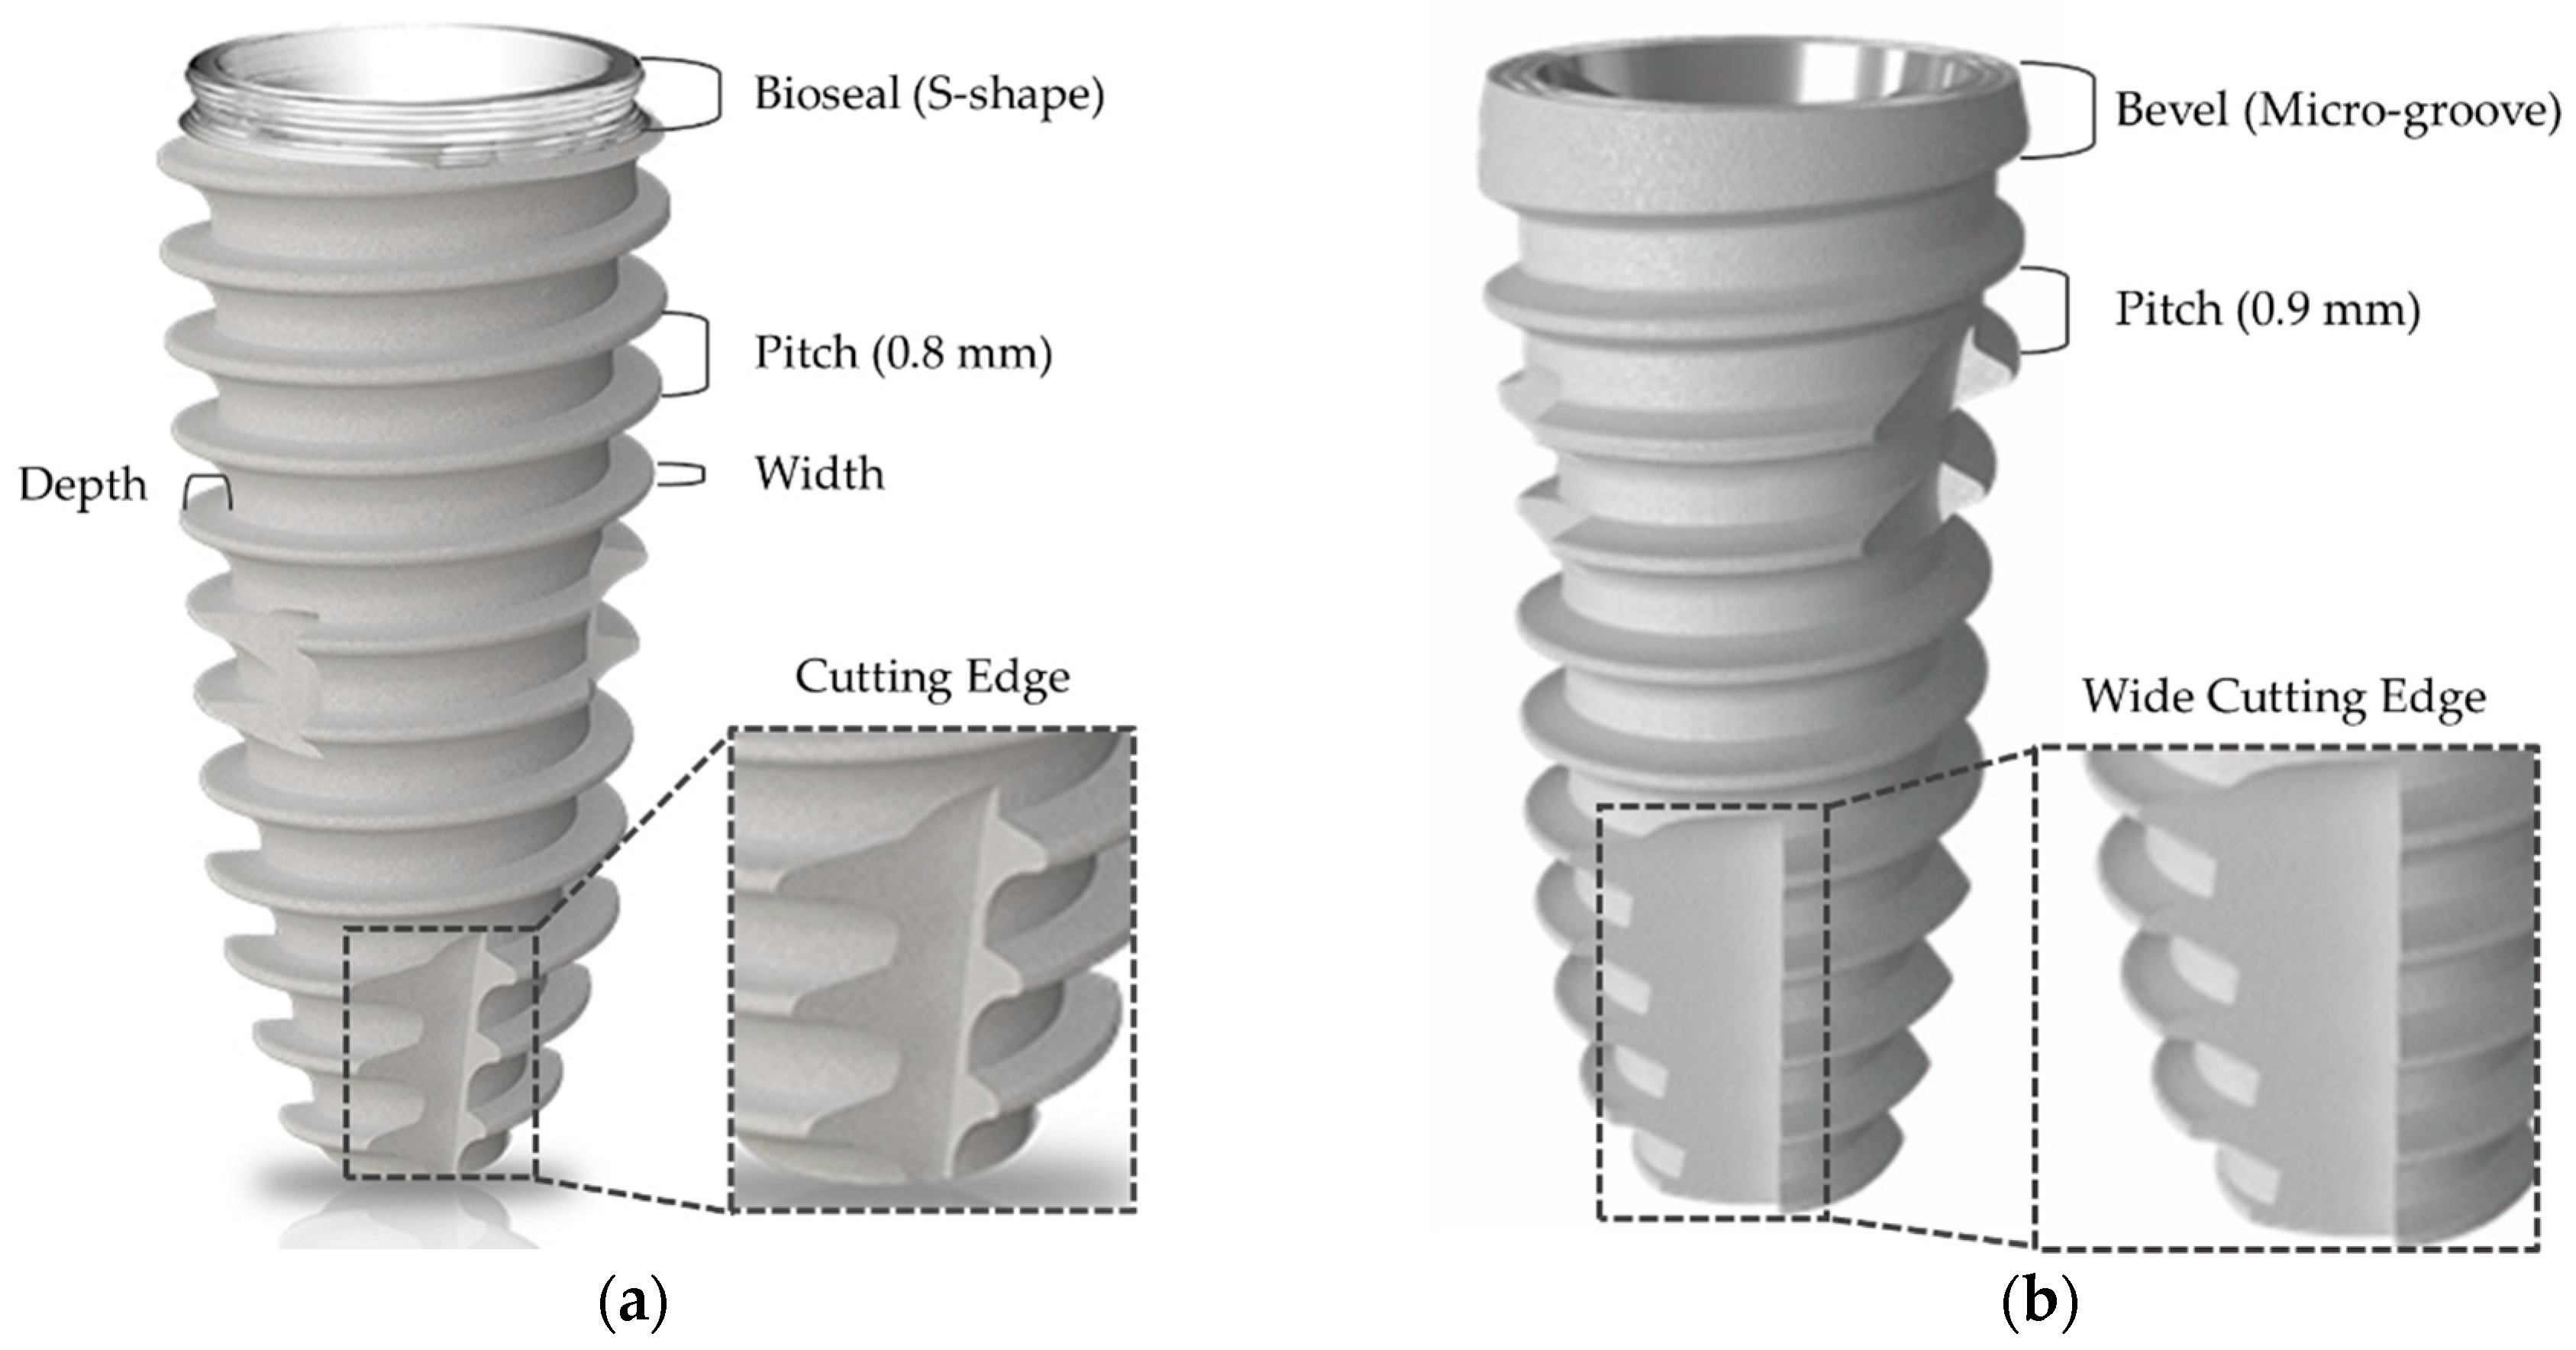
2.1. The Design of the Implant System and Specimen Preparation
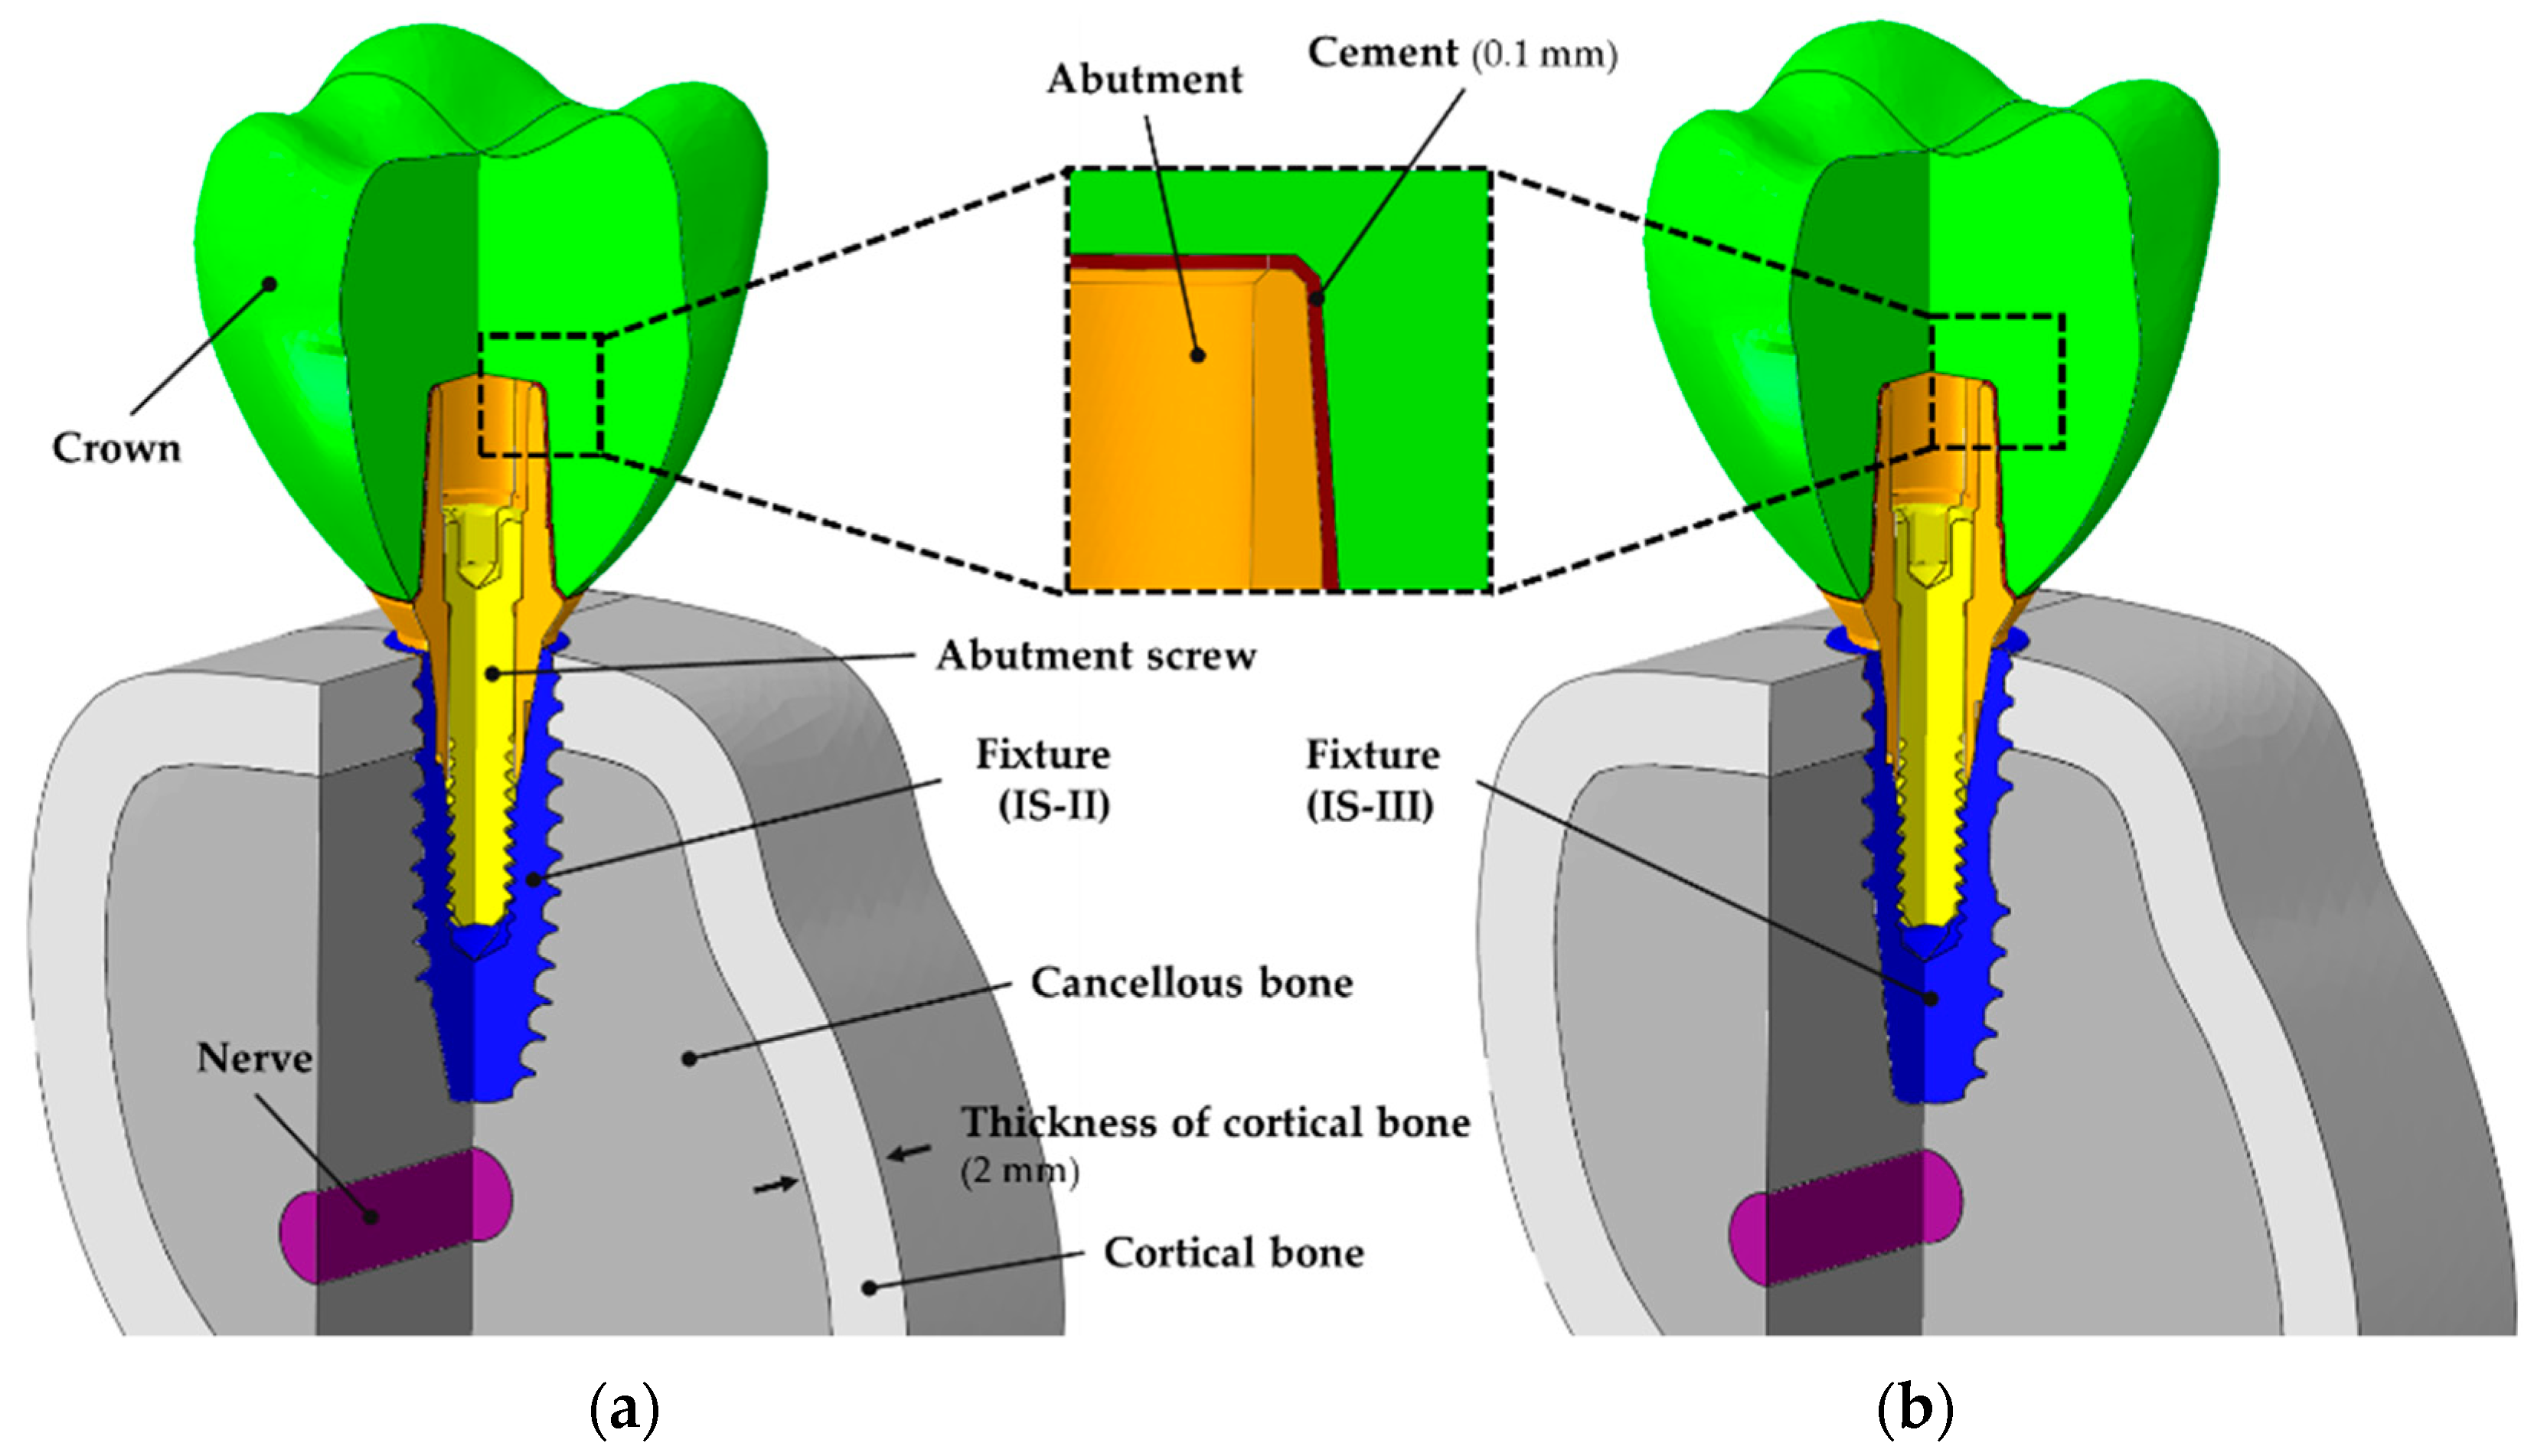
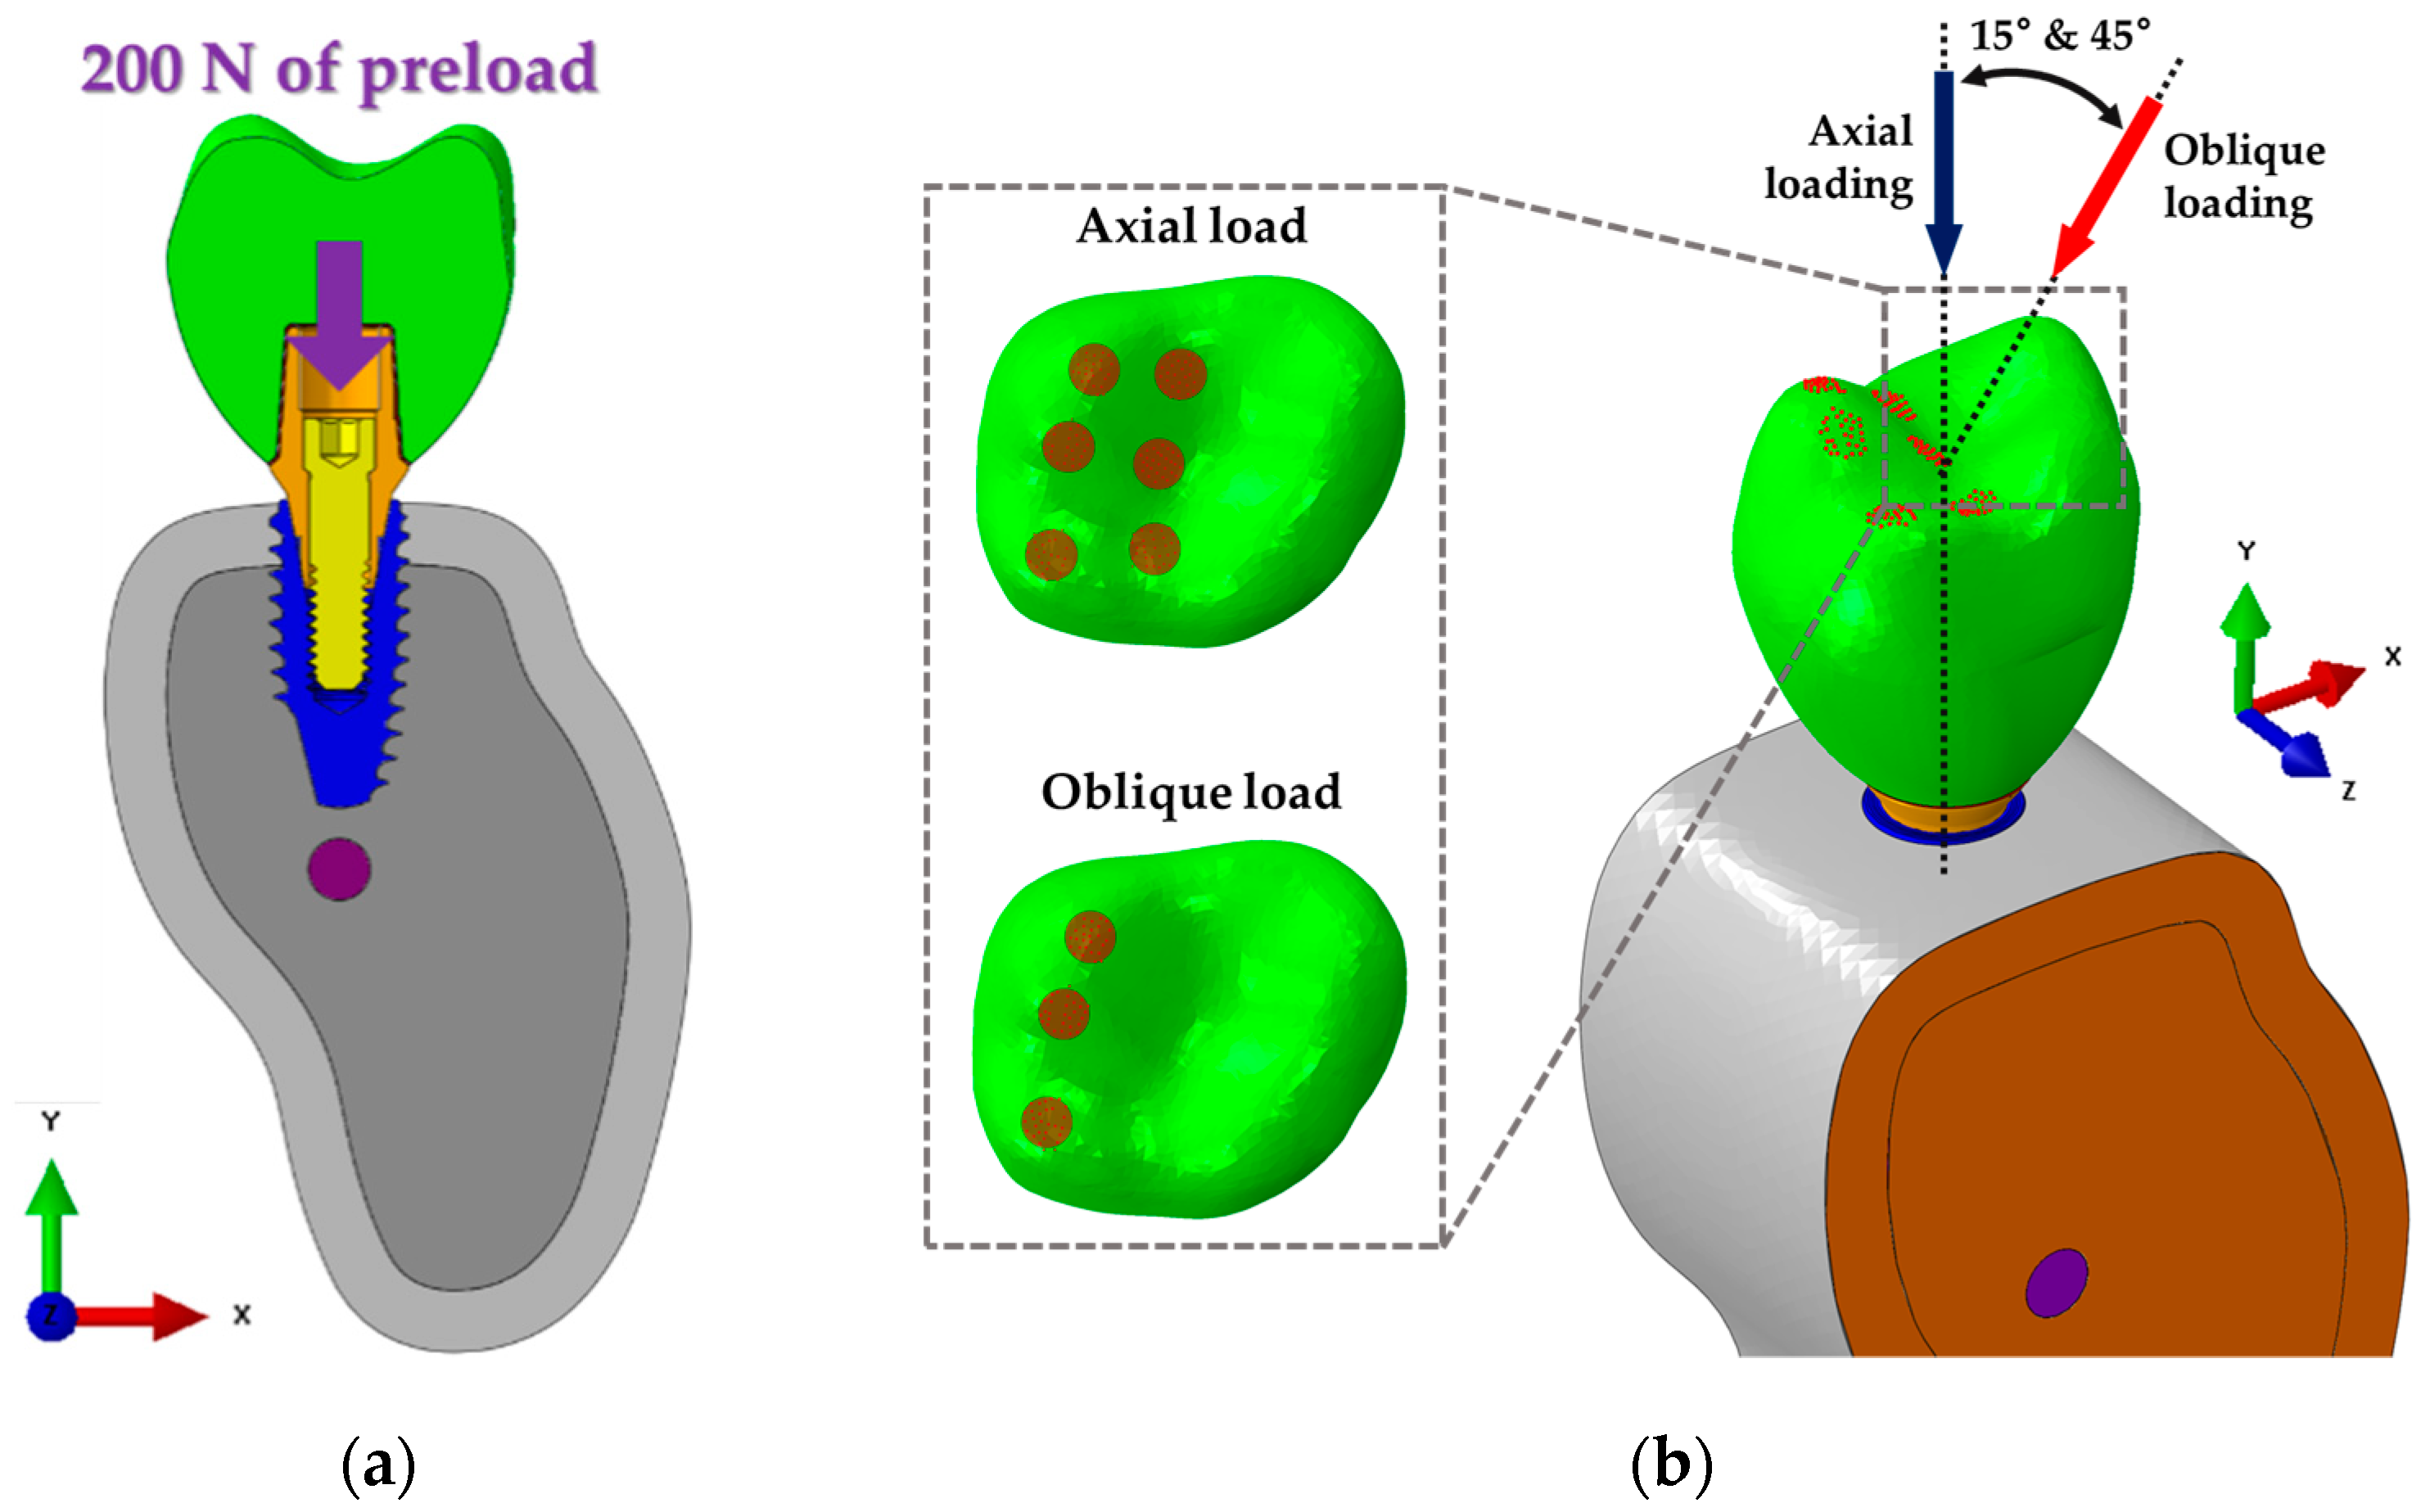
2.2. Finite Element Analysis (FEA)
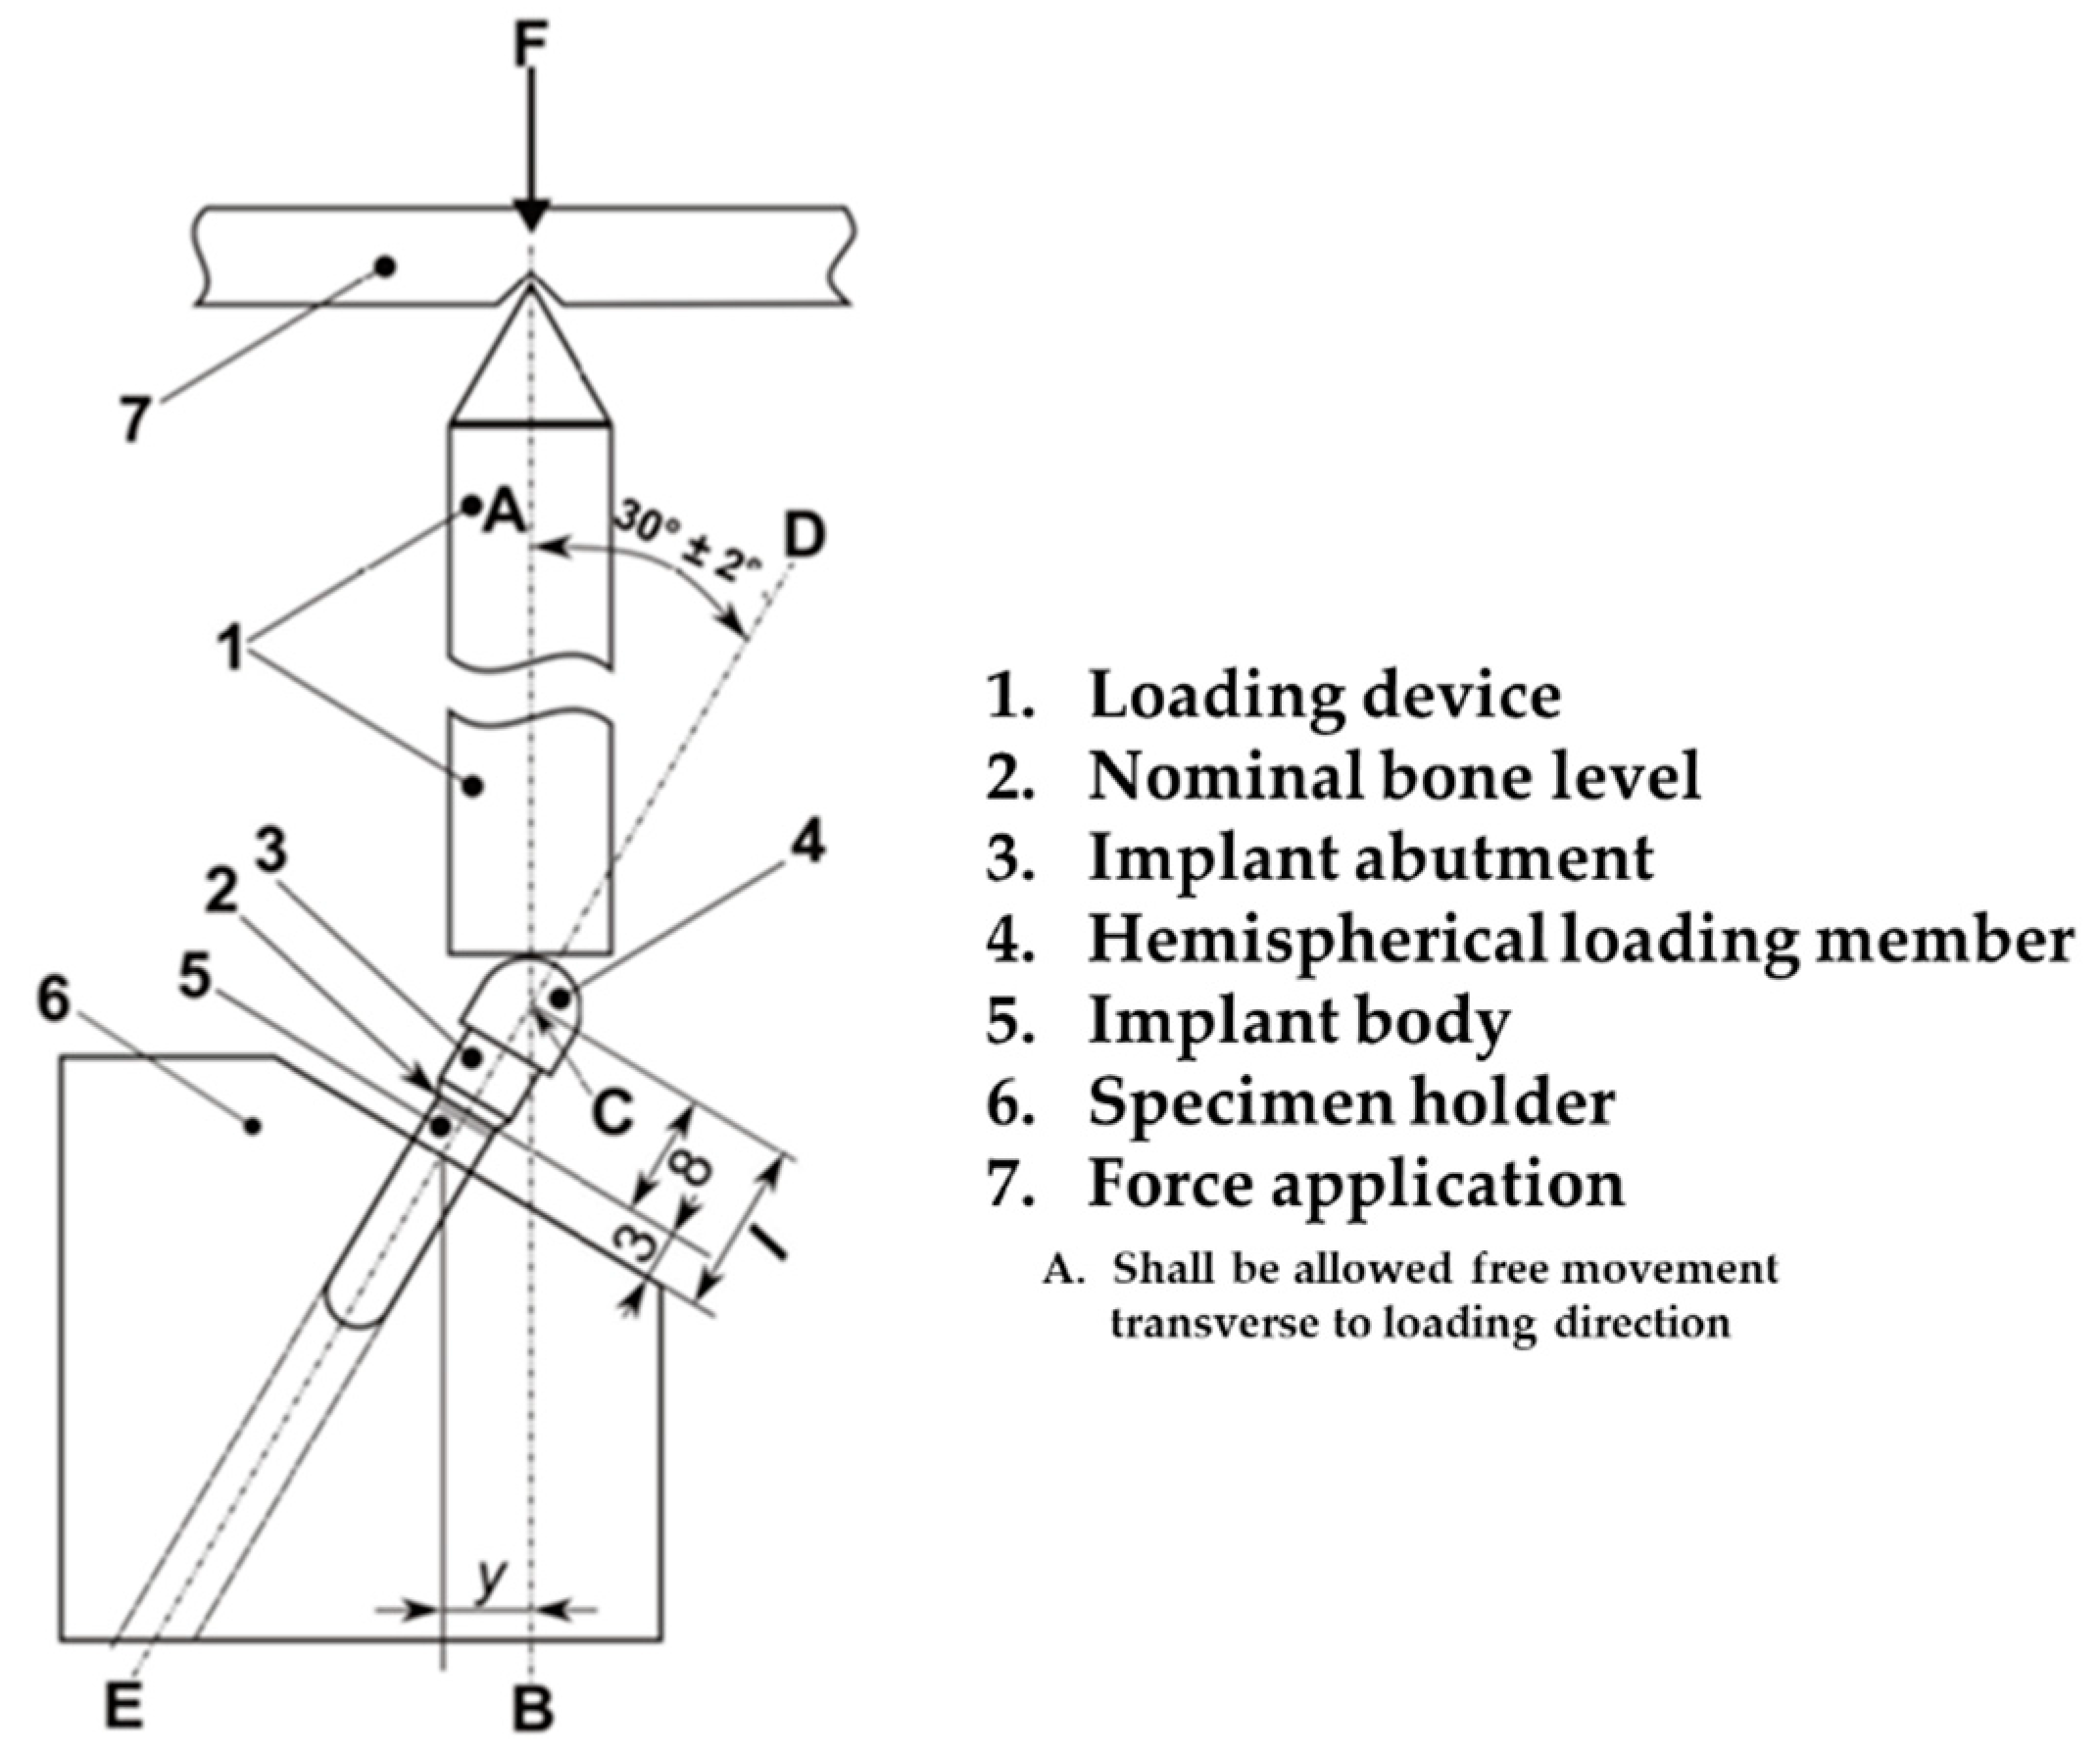
2.3. Mechanical Testing
2.4. Statistical Analysis
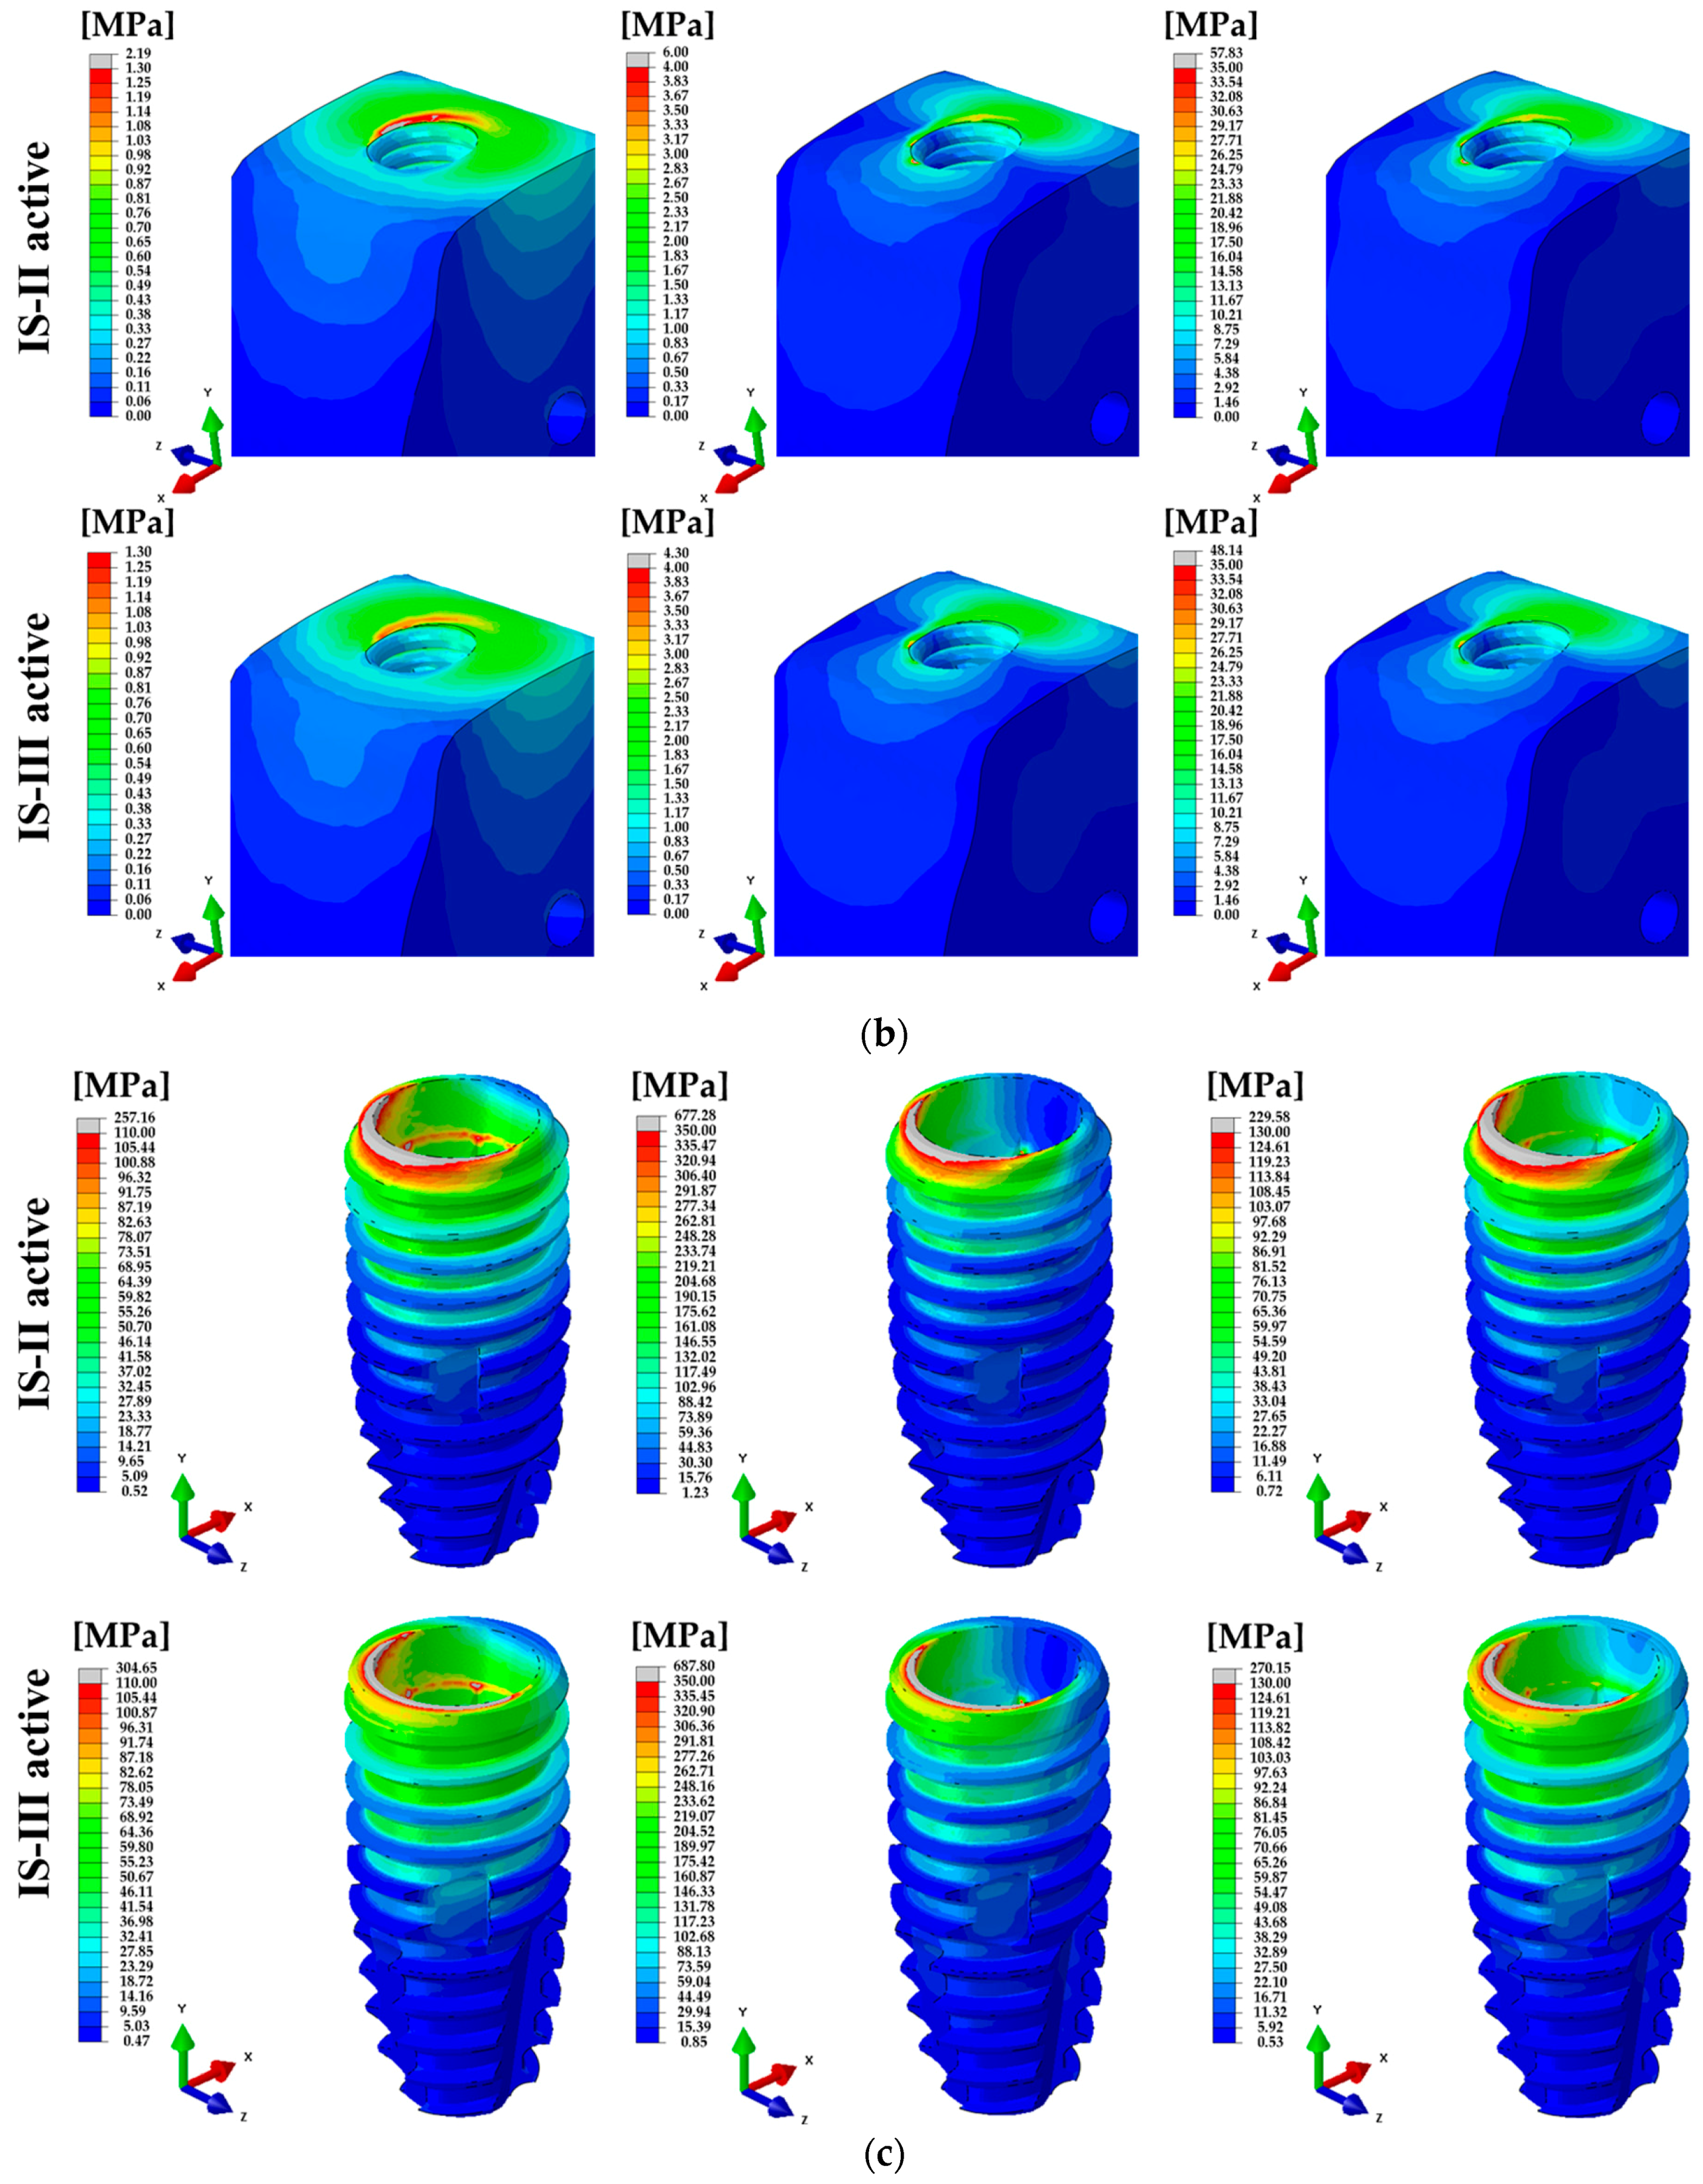
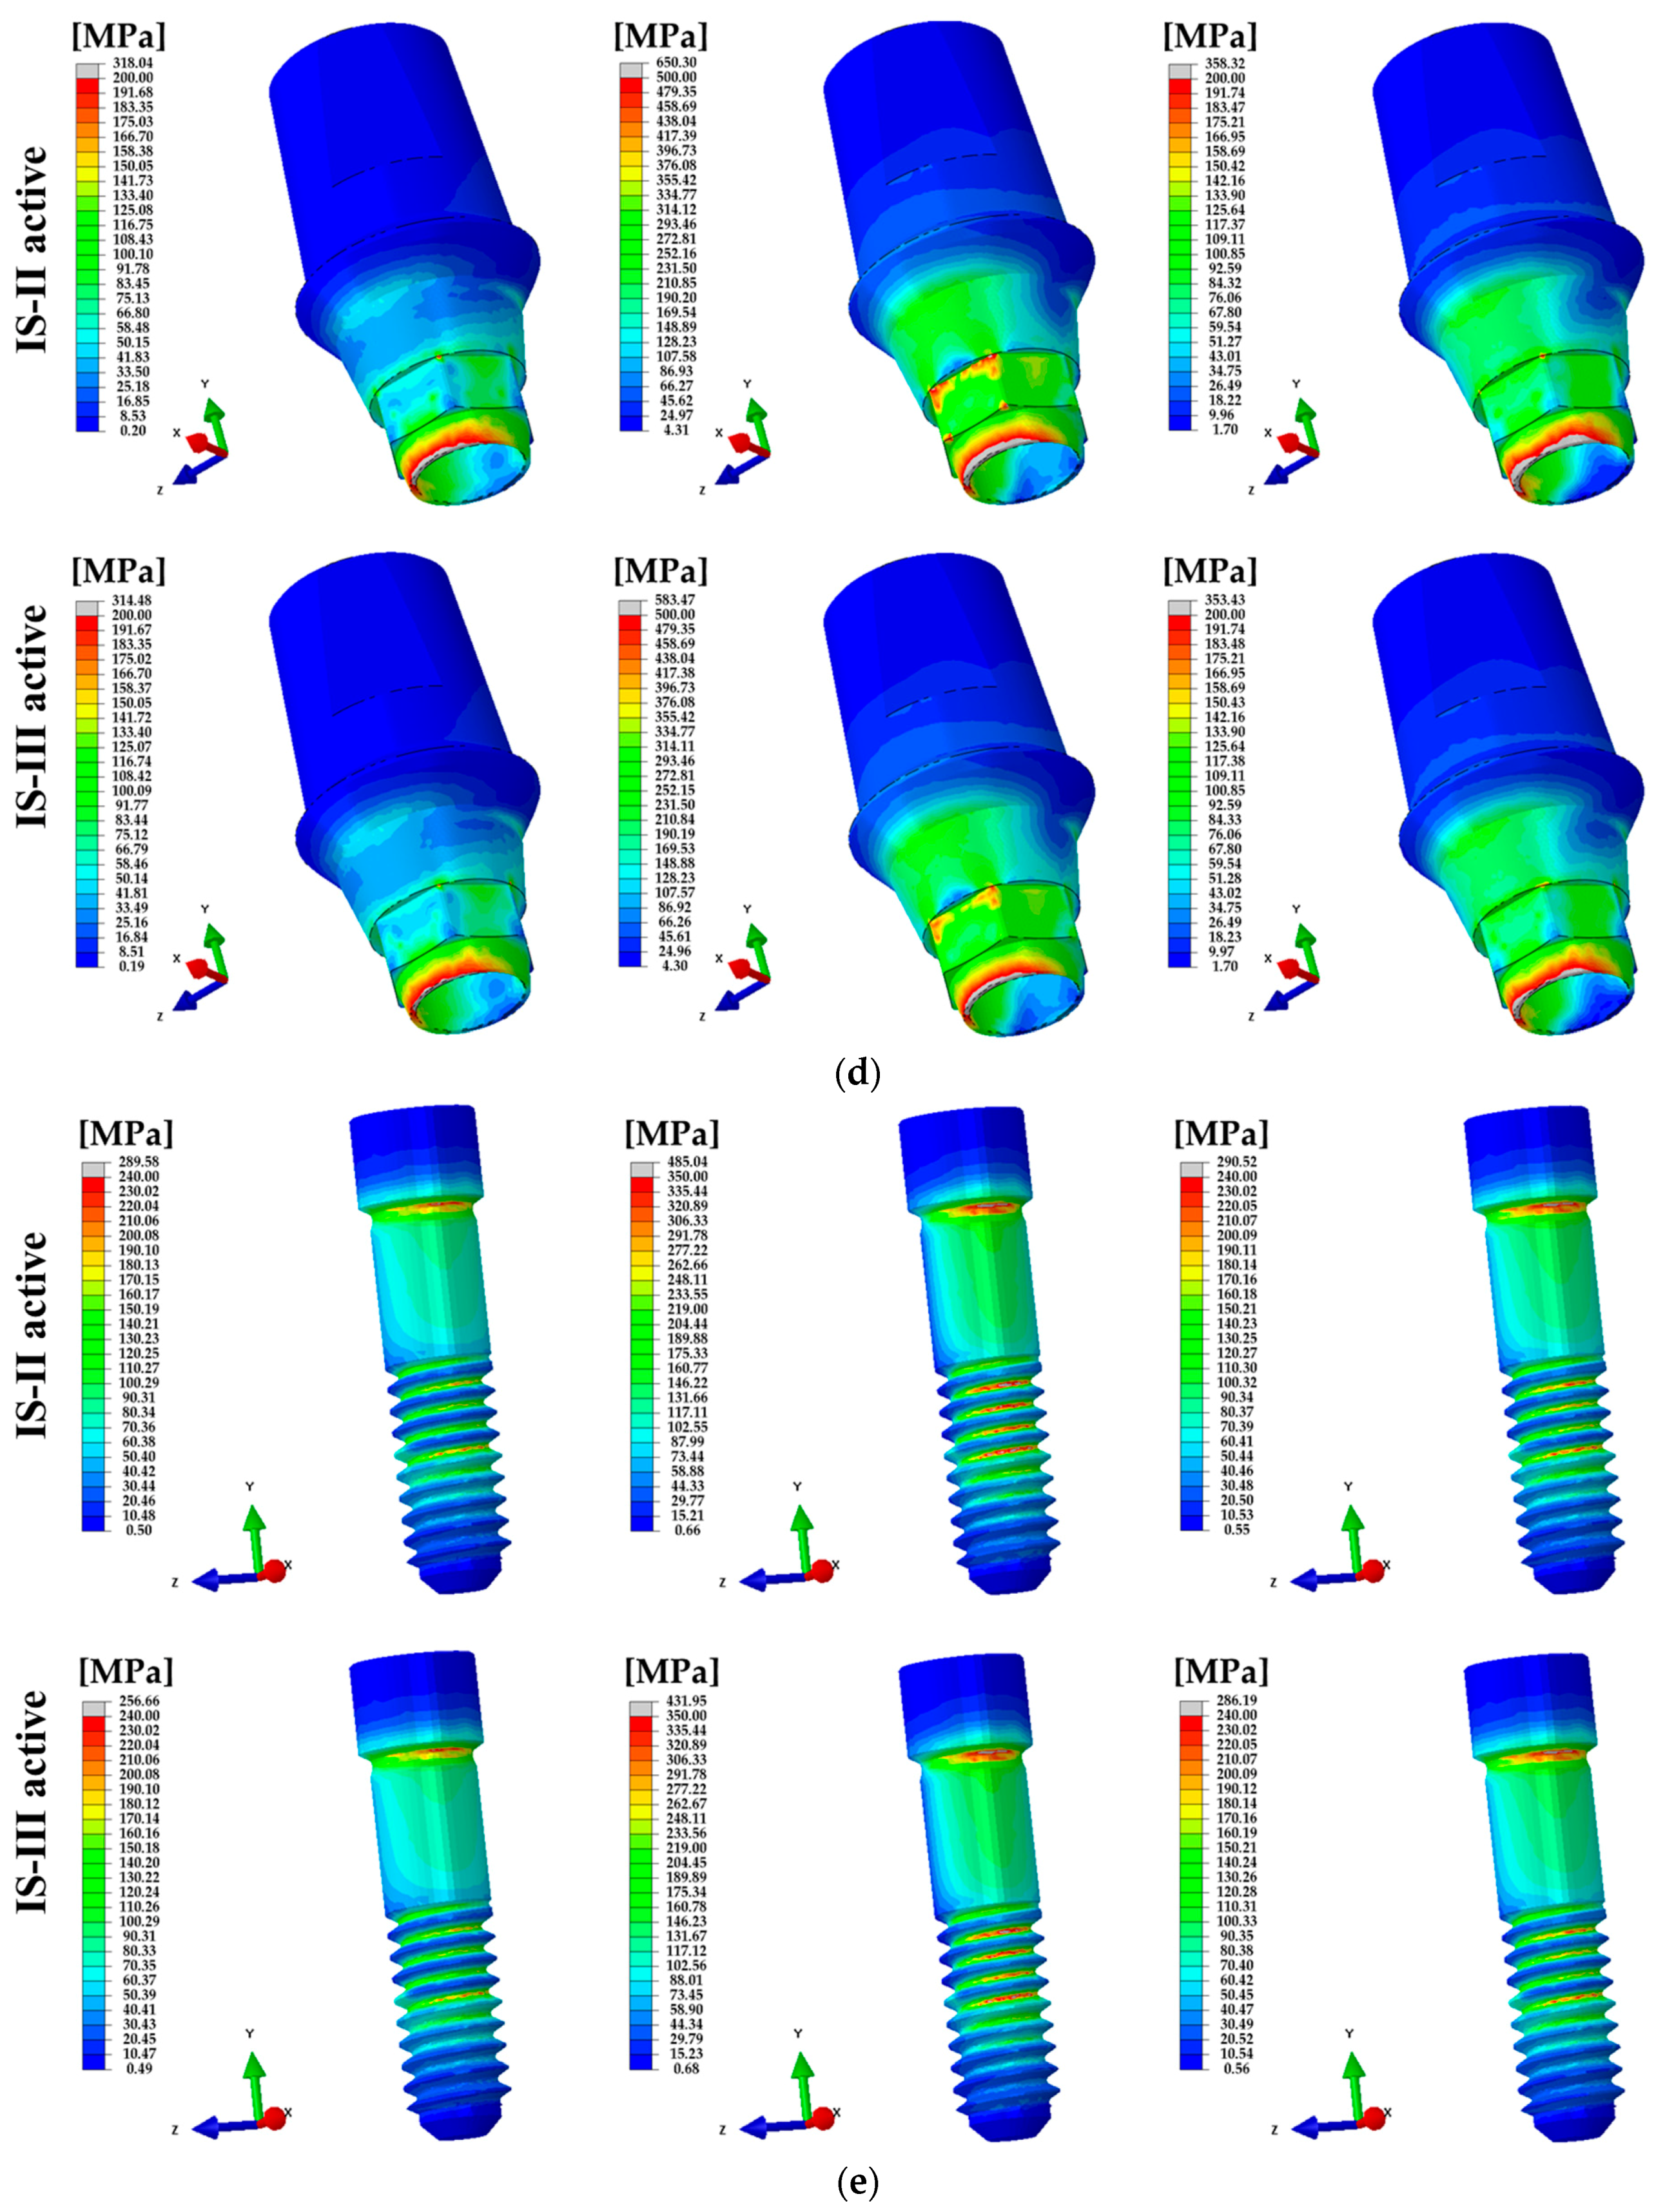
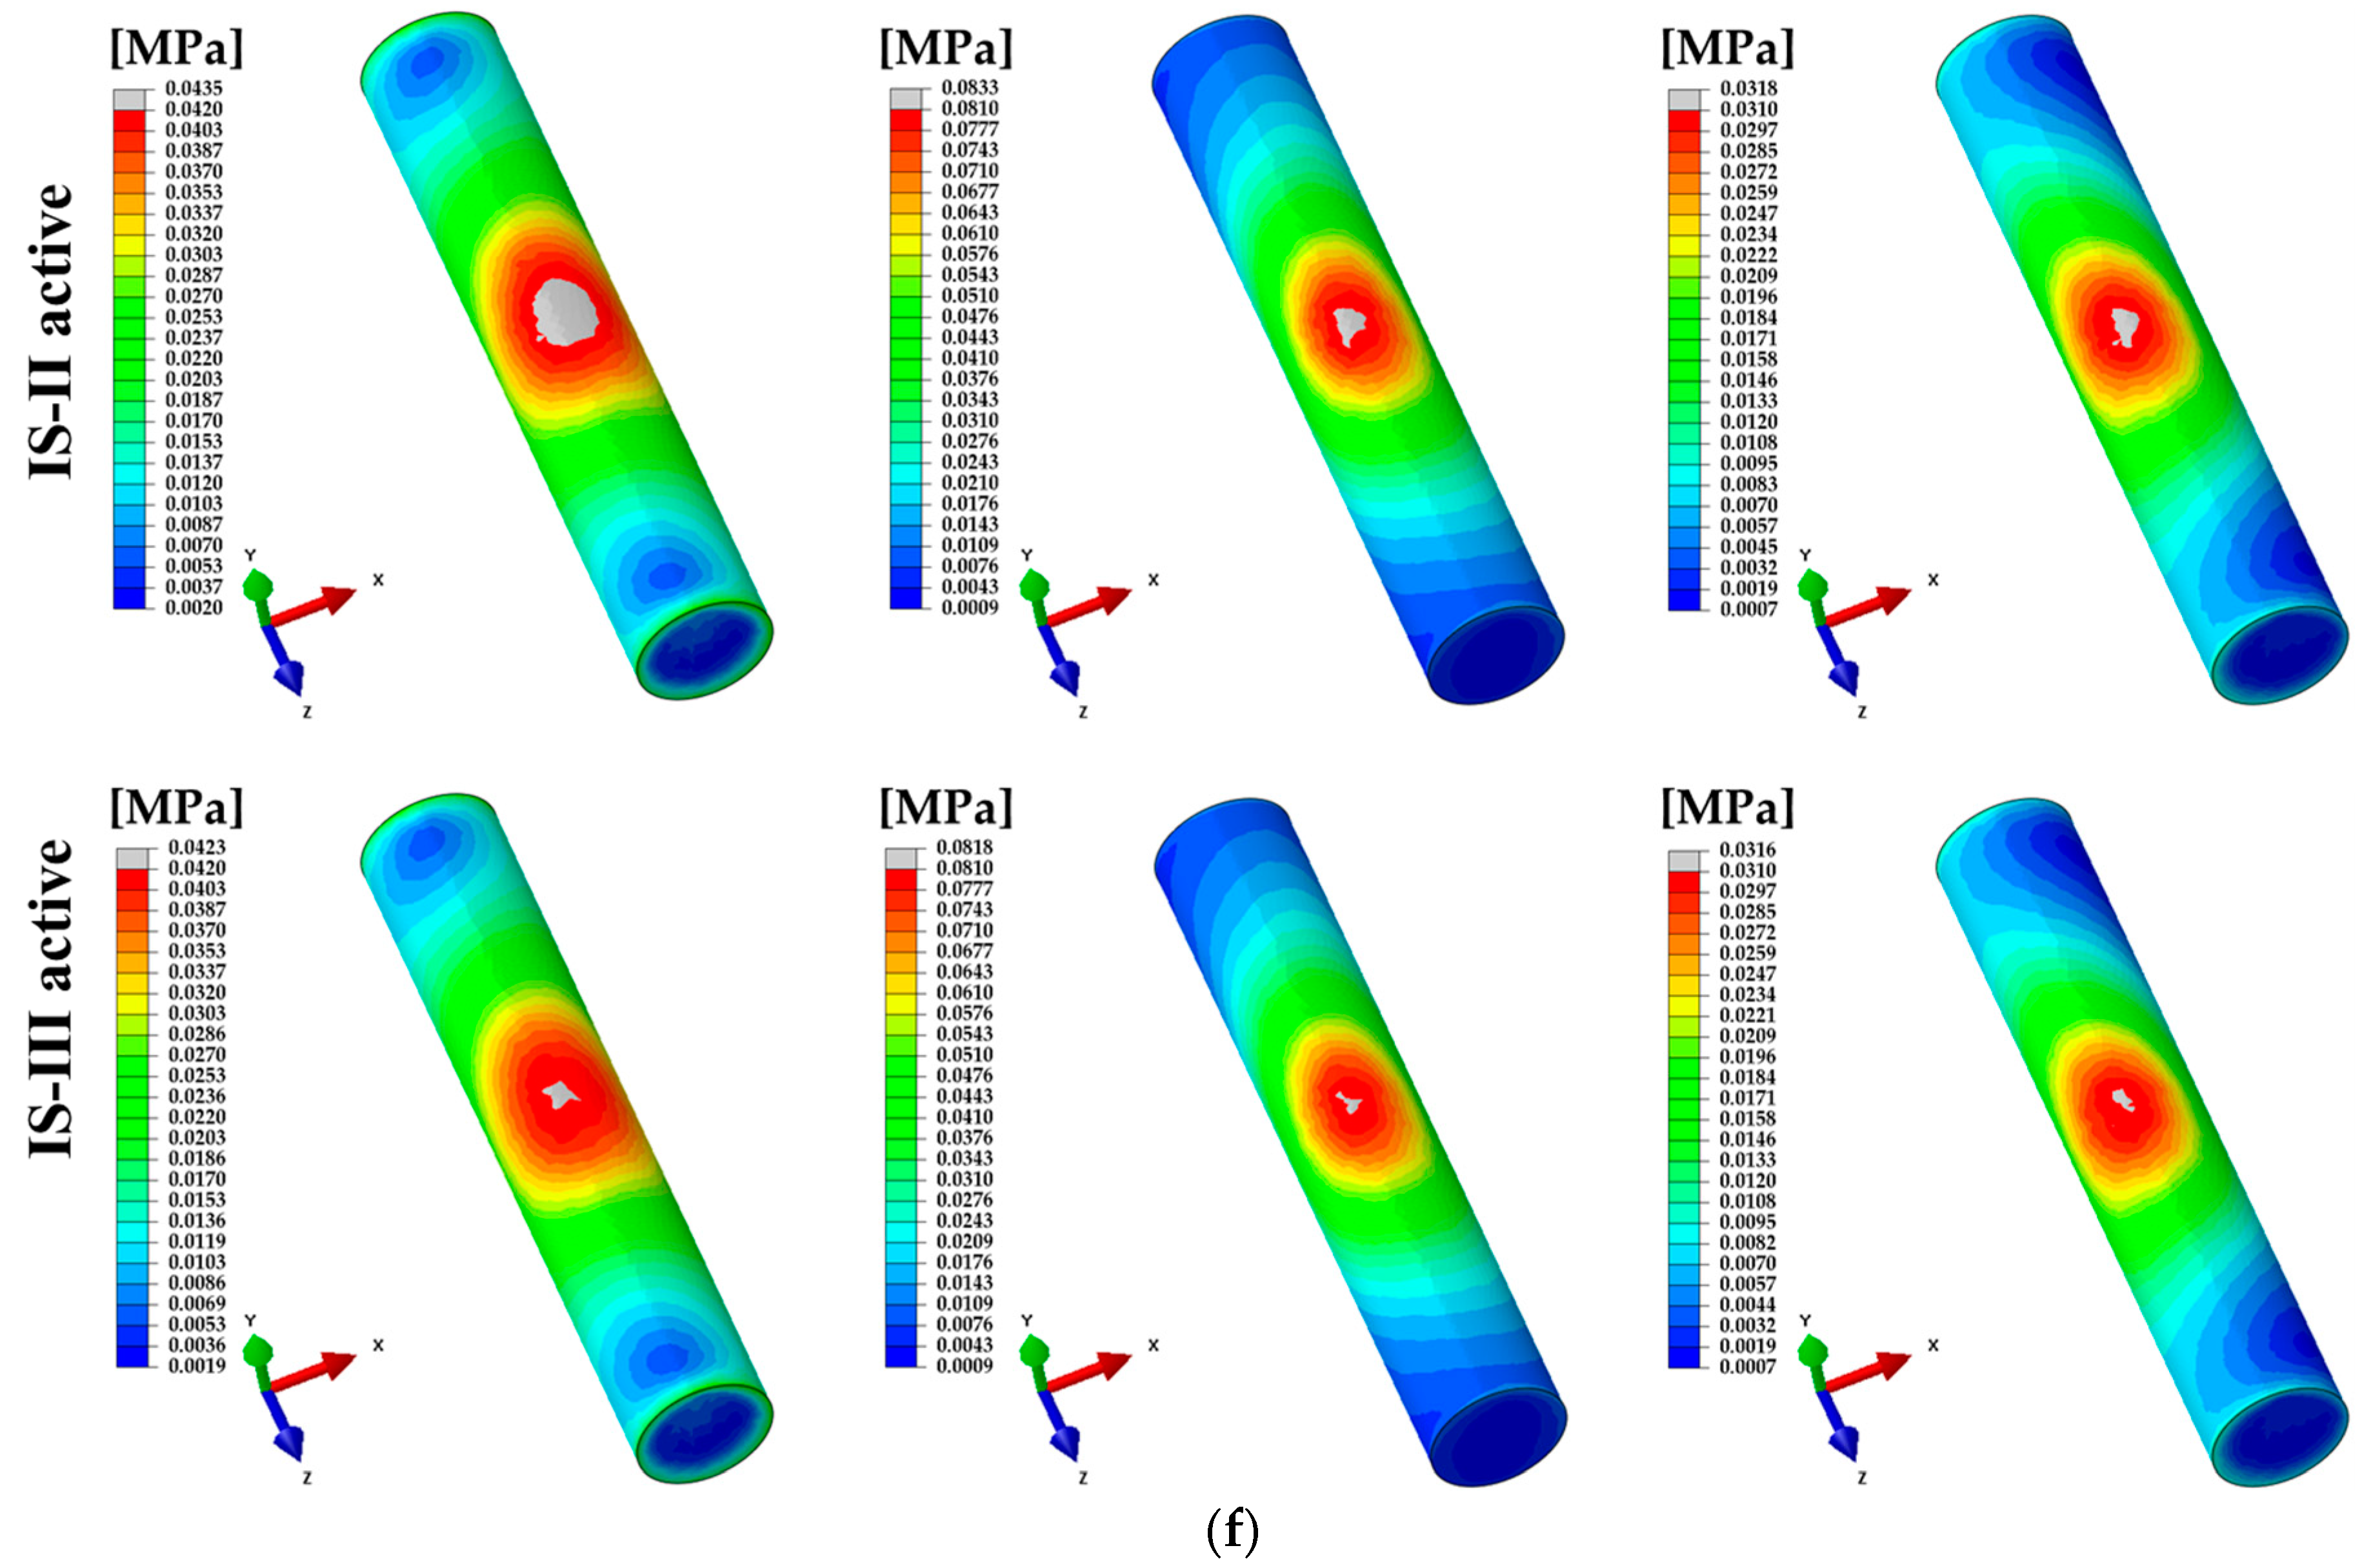
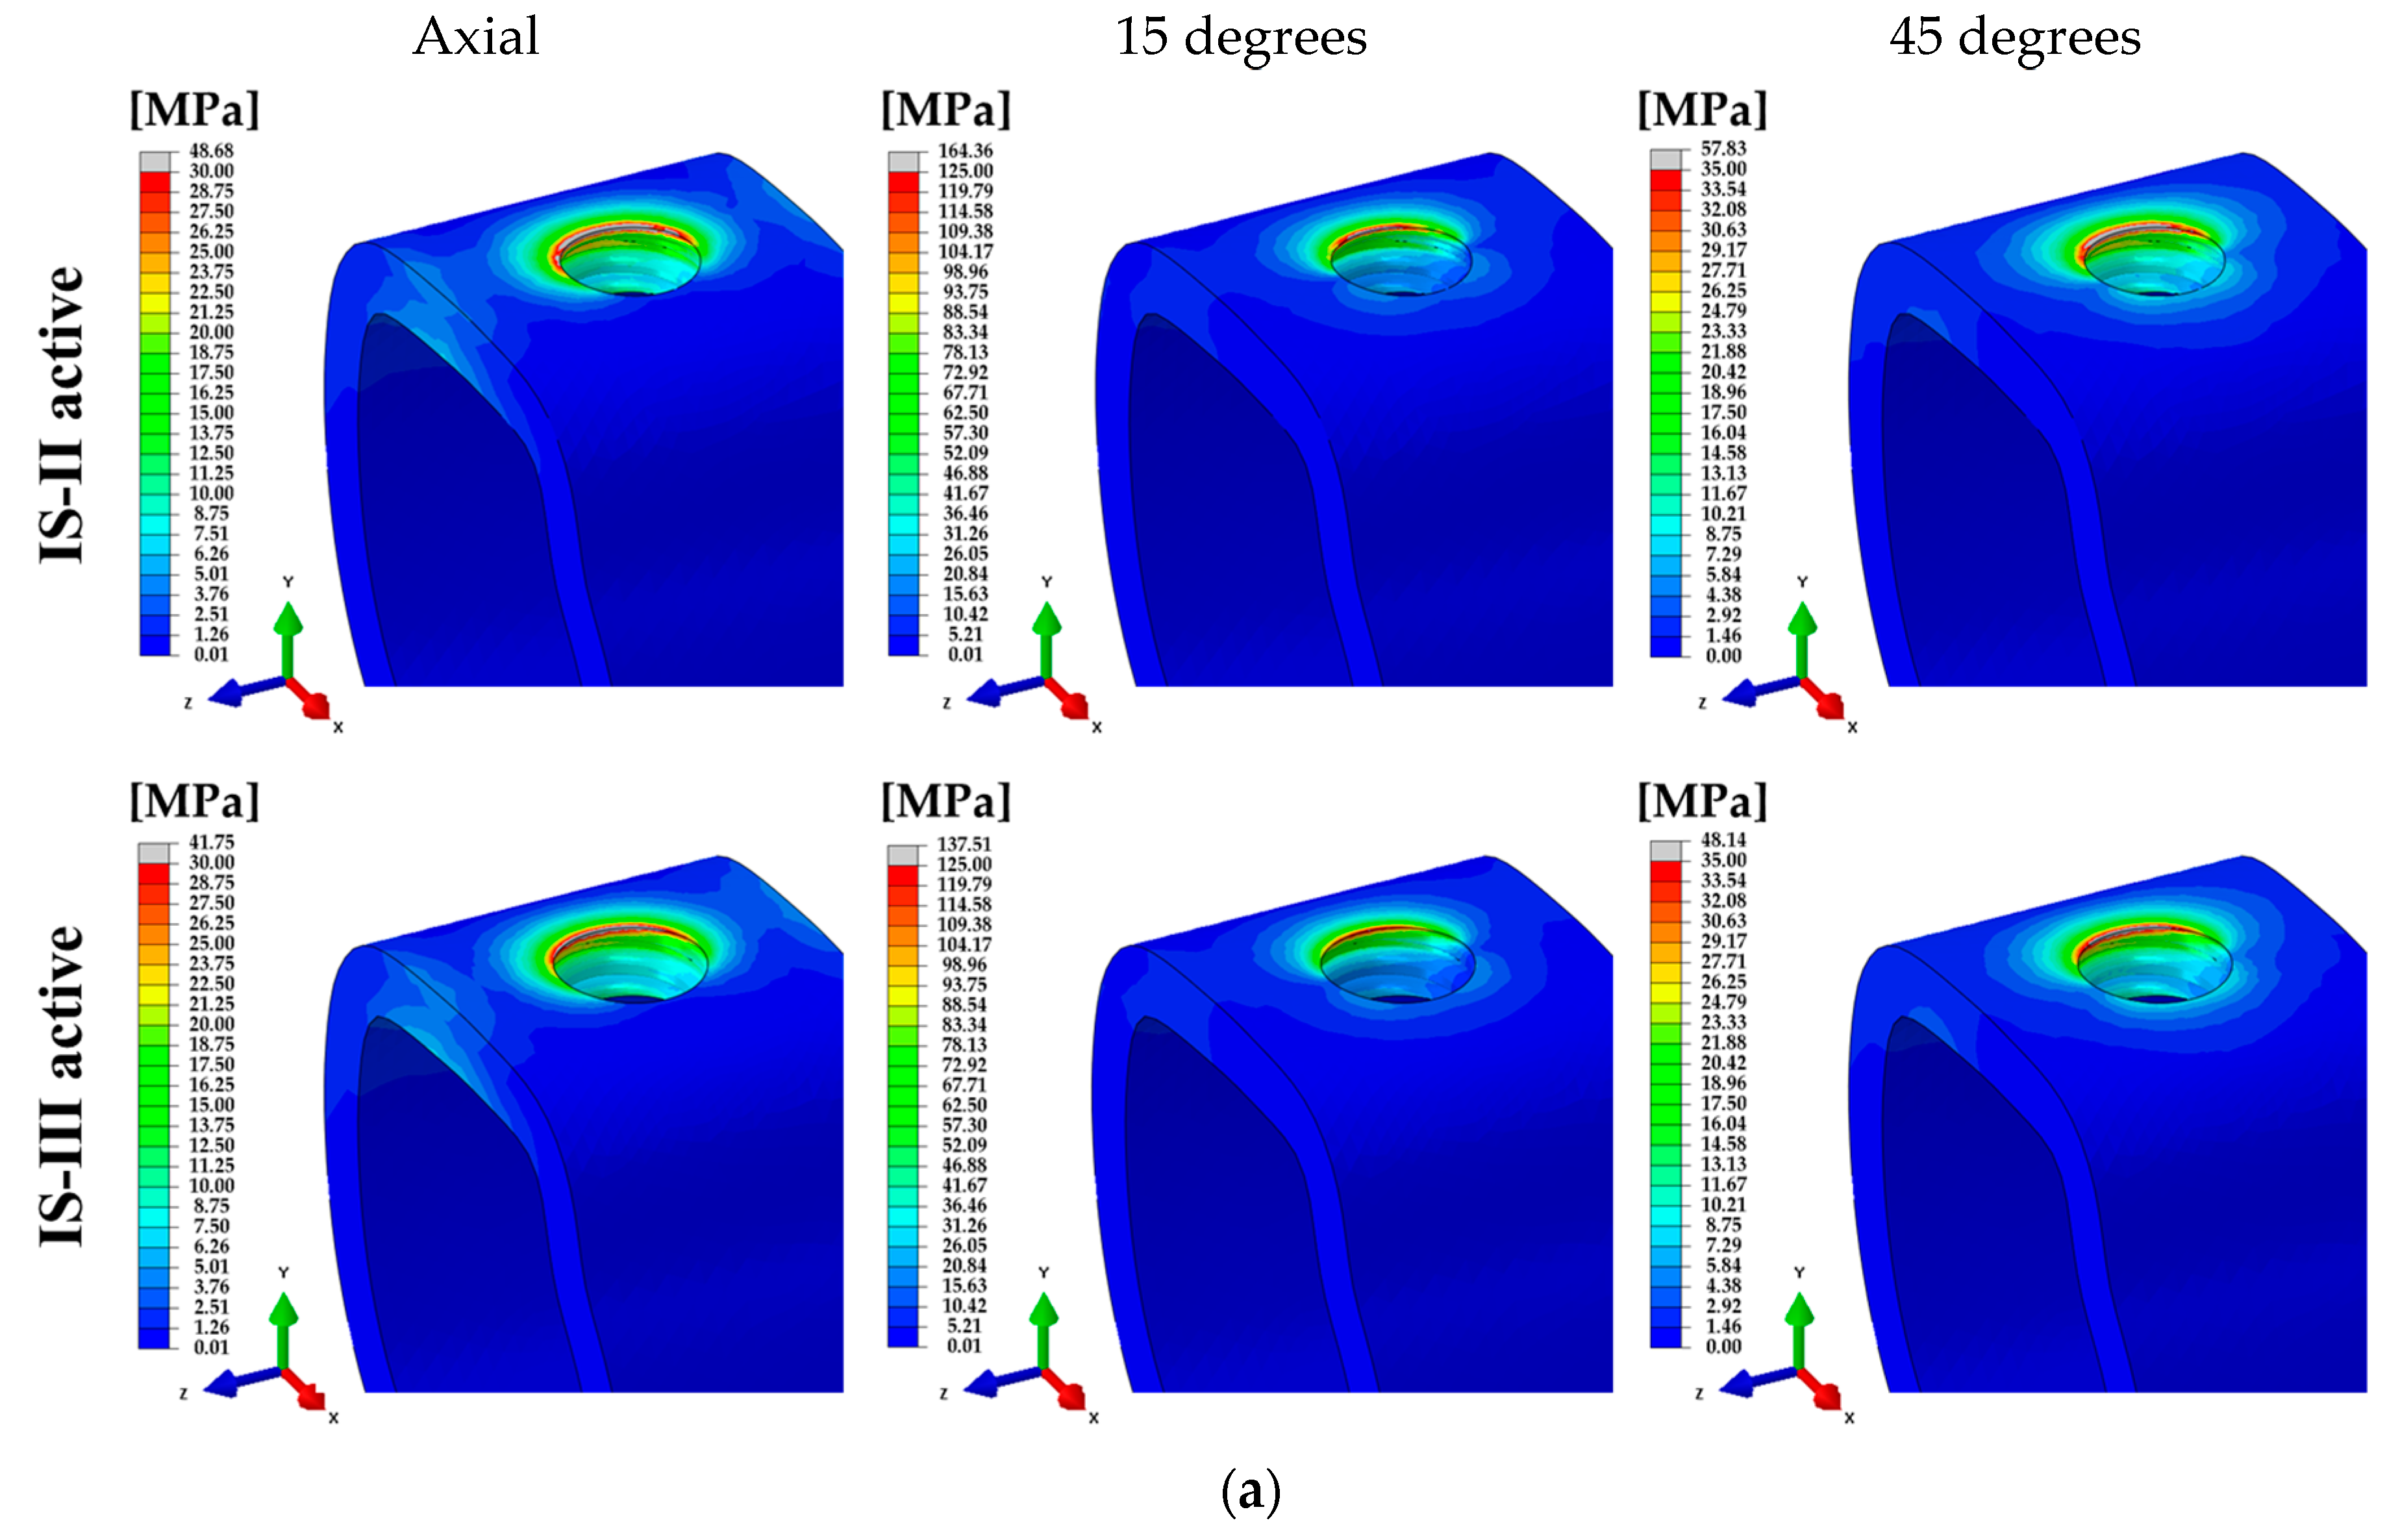
3. Results
4. Discussion
5. Conclusions
Author Contributions
Funding
Conflicts of Interest
References
- Caldas, A.F., Jr.; Marcenes, W.; Sheiham, A. Reasons for tooth extraction in a Brazilian population. Int. Dent. J. 2000, 50, 267–273. [Google Scholar] [CrossRef] [PubMed]
- Chestnutt, I.G.; Binnie, V.I.; Taylor, M.M. Reasons for tooth extraction in Scotland. J. Dent. 2000, 28, 295–297. [Google Scholar] [CrossRef]
- Chrysanthakopoulos, N.A. Periodontal reasons for tooth extraction in a group of Greek army personnel. J. Dent. Res. Dent. Clin. Dent. Prospect 2011, 5, 55–60. [Google Scholar] [CrossRef]
- Calandriello, R.; Tomatis, M. Immediate occlusal loading of single lower molars using brånemark system® wide platform tiunite™ implants: A 5-year follow-up report of a prospective clinical multicenter study. Clin. Implant. Dent. Relat. Res. 2009, 13, 311–318. [Google Scholar] [CrossRef] [PubMed]
- Hattingh, A.; Hommez, G.; De Bruyn, H.; Huyghe, M.; Vandeweghe, S. A prospective study on ultra-wide diameter dental implants for immediate molar replacement. Clin. Implant Dent. Relat. Res. 2018, 20, 1009–1015. [Google Scholar] [CrossRef]
- Bernardi, S.; Gatto, R.; Severino, M.; Botticelli, G.; Caruso, S.; Rastelli, C.; Lupi, E.; Roias, A.Q.; Iacomino, E.; Falisi, G. Short Versus Longer Implants in Mandibular Alveolar Ridge Augmented Using Osteogenic Distraction: One-Year Follow-up of a Randomized Split-Mouth Trial. J. Oral Implantol. 2018, 44, 184–191. [Google Scholar] [CrossRef]
- Brånemark, P.I.; Breine, U.; Adell, R.; Hansson, B.O.; Lindström, J.; Ohlsson, Å. Intra-osseous anchorage of dental prostheses: I. Experimental studies. Scand. J. Plast. Reconstr. Surg. 1969, 3, 81–100. [Google Scholar] [CrossRef]
- Albrektsson, T.; Brånemark, P.I.; Hansson, H.A.; Lindstrom, J. Osseointegrated titanium implants. Requirements for ensuring a long-lasting, direct bone-to-implant anchorage in man. Acta. Orthop. Scand 1981, 52, 155–170. [Google Scholar] [CrossRef]
- Atieh, M.A.; Atieh, A.H.; Payne, A.G.; Duncan, W.J. Immediate loading with single implant crowns: A systematic review and meta-analysis. Int. J. Prosthodont. 2009, 22, 378–387. [Google Scholar]
- Soliman, M.M.; Zaki, A.A.; El Gazaerly, H.M.; Shemmrani, A.A.; Sorour, A. Clinical and radiographic evaluation of copolymerized Polylactic/polyglycolic acids as a bone filler in combination with a cellular dermal matrix graft around immediate implants. Int. J. Health Sci. 2014, 8, 381–392. [Google Scholar] [CrossRef]
- Kim, J.H.; Kim, Y.K.; Yi, Y.J.; Yun, P.Y.; Lee, H.J.; Kim, M.J.; Yeo, I.S. Results of immediate loading for implant restoration in partially edentulous patients: A 6-month preliminary prospective study using SinusQuick™ EB implant system. J. Adv. Prosthodont 2009, 1, 136–139. [Google Scholar] [CrossRef]
- Vidyasagar, L.; Apse, P. Dental implant design and biological effects on bone-implant interface. Stomatologija 2004, 6, 51–54. [Google Scholar]
- Yeniyol, S.; Jimbo, R.; Marin, C.; Tovar, N.; Janal, M.N.; Coelho, P.G. The effect of drilling speed on early bone healing to oral implants. Oral Surg. Oral Med. Oral Pathol. Oral Radiol. 2013, 116, 550–555. [Google Scholar] [CrossRef]
- Oliscovicz, N.F.; Shimano, A.C.; Marcantonio Junior, E.; Lepri, C.P.; Reis, A.C.D. Effect of implant design and bone density in primary stability. Braz. J. Oral Sci. 2013, 12, 158–163. [Google Scholar] [CrossRef] [Green Version]
- Ryu, H.S.; Namgung, C.; Heo, Y.K.; Lee, J.H.; Lim, Y.J. Early loading of splinted implants supporting a two-unit fixed partial denture in the posterior maxilla: 13-month results from a randomized controlled clinical trial of two different implant systems. Clin. Oral Implant. Res. 2015, 27, 1017–1025. [Google Scholar] [CrossRef]
- Simunek, A.; Strnad, J.; Kopecka, D.; Brazda, T.; Pilathadka, S.; Chauhan, R.; Slezak, R.; Capek, L. Changes in stability after healing of immediately loaded dental implants. Int. J. Oral Maxillofac. Implant. 2010, 25, 1085–1092. [Google Scholar]
- Atsumi, M.; Park, S.H.; Wang, H.L. Methods used to assess implant stability: Current status. Int. J. Oral Maxillofac. Implant. 2007, 22, 743–754. [Google Scholar]
- Raghavendar, S.; Wood, M.C.; Taylor, T.D. Early wound healing around endosseous implants: A review of the literature. Int. J. Oral Maxillofac. Implant. 2005, 20, 425–431. [Google Scholar]
- Sennerby, L.; Meredith, N. Implant stability measurements using resonance frequency analysis: Biological and biomechanical aspects and clinical implications. Periodontol 2000 2008, 47, 51–66. [Google Scholar] [CrossRef]
- Abuhussein, H.; Pagni, G.; Rebaudi, A.; Wang, H.L. The effect of thread pattern upon implant osseointegration. Clin. Oral Implant. Res. 2010, 21, 129–136. [Google Scholar] [CrossRef] [Green Version]
- Boggan, R.S.; Strong, J.T.; Misch, C.E.; Bidez, M.W. Influence of hex geometry and prosthetic table width on static and fatigue strength of dental implants. J. Prosthet. Dent. 1999, 82, 436–440. [Google Scholar] [CrossRef]
- Chang, P.K.; Chen, Y.C.; Huang, C.C.; Lu, W.H.; Chen, Y.C.; Tsai, H.H. Distribution of micromotion in implants and alveolar bone with different thread profiles in immediate loading: A finite element study. Int. J. Oral Maxillofac. Implant. 2012, 27, e96–e101. [Google Scholar]
- Eraslan, O.; Inan, O. The effect of thread design on stress distribution in a solid screw implant: A 3D finite element analysis. Clin. Oral Investig. 2010, 14, 411–416. [Google Scholar] [CrossRef]
- Lan, T.H.; Du, J.K.; Pan, C.Y.; Lee, H.E.; Chung, W.H. Biomechanical analysis of alveolar bone stress around implants with different thread designs and pitches in the mandibular molar area. Clin. Oral Investig. 2012, 16, 363–369. [Google Scholar] [CrossRef]
- Kong, L.; Liu, B.L.; Hu, K.J.; Li, D.H.; Song, Y.L.; Ma, P.; Yang, J. Optimized thread pitch design and stress analysis of the cylinder screwed dental implant. Hua Xi Kou Qiang Yi Xue Za Zhi 2006, 24, 509–512. [Google Scholar]
- Chung, S.H.; Heo, S.J.; Koak, J.Y.; Kim, S.K.; Lee, J.B.; Han, J.S.; Han, C.H.; Rhyu, I.C.; Lee, S.J. Effects of implant geometry and sur-face treatment on osseointegration after functional loading: A dog study. J. Oral Rehabil. 2008, 35, 229–236. [Google Scholar] [CrossRef]
- Ao, J.; Li, T.; Liu, Y.; Ding, Y.; Wu, G.; Hu, K.; Kong, L. Optimal design of thread height and width on an immediately loaded cylinder implant: A finite element analysis. Comput. Biol. Med. 2010, 40, 681–686. [Google Scholar] [CrossRef]
- Kim, W.H.; Song, E.S.; Ju, K.W.; Lee, J.-H.; Kim, M.Y.; Lim, D.; Kim, B. Finite Element Analysis of Novel Separable Fixture for Easy Retrievement in Case with Peri-Implantitis. Materials 2019, 12, 235. [Google Scholar] [CrossRef]
- Miyamoto, I.; Tsuboi, Y.; Wada, E.; Suwa, H.; Iizuka, T. Influence of cortical bone thickness and implant length on implant stability at the time of surgery—Clinical, prospective, biomechanical, and imaging study. Bone 2005, 37, 776–780. [Google Scholar] [CrossRef]
- Throckmorton, G.S.; Buschang, P.H.; Ellis, E., III. Improvement of maximum occlusal forces after orthognathic surgery. J. Oral Maxillofac. Surg. 1996, 54, 1080–1086. [Google Scholar] [CrossRef]
- Papakoststas, G.I.; Mcgrath, P.; Stewart, J.; Charles, D.; Chen, Y.; Mischoulon, D.; Dording, C.; Fava, M. Psychic and somatic anxiety symptoms as predictors of response to fluoxetine in major depressive disorder. Psychiatry Res. 2008, 161, 116–120. [Google Scholar] [CrossRef]
- Ha, S.R. Biomechanical three-dimensional finite element analysis of monolithic zirconia crown with different cement type. J. Adv. Prosthodont. 2015, 7, 475–483. [Google Scholar] [CrossRef] [Green Version]
- Foley, J.; Dodson, J.; Schmidt, M.; Gillespie, P.; Besonia, Y. High-Bandwidth Measurement and Validation of Bar and Plate Dynamics; Air Force Research Lab, Munitions Directorate: Eglin AFB, FL, USA, 2008. [Google Scholar]
- Brizuela-Velasco, A.; Pérez-Pevida, E.; Jiménez-Garrudo, A.; Gil-Mur, F.J.; Manero, J.M.; Punset-Fuste, M.; Chávarri-Prado, D.; Diéguez-Pereira, M.; Monticelli, F. Mechanical characterisation and biomechanical and biological behaviours of Ti-Zr Binary-Alloy dental implants. BioMed Res. Int. 2017, 2017, 2785863. [Google Scholar] [CrossRef]
- Zhang, G.; Yuan, H.; Chen, X.; Wang, W.; Chen, J.; Liang, J.; Zhang, P. A three-dimensional finite element study on the biomechanical simulation of various structured dental implants and their surrounding bone tissues. Int. J. Dent. 2016, 2016, 4867402. [Google Scholar] [CrossRef]
- Lee, H.J.; Park, S.Y.; Noh, G.W. Biomechanical analysis of 4 types of short dental implants in a resorbed mandible. J. Prosthet. Dent. 2019, 121, 659–670. [Google Scholar] [CrossRef]
- Holberg, C.; Winterhalder, P.; Wichelhaus, A.; Hickel, R.; Huth, K. Fracture risk of lithium-disilicate ceramic inlays: A finite element analysis. Dent. Mater. 2013, 29, 1244–1250. [Google Scholar] [CrossRef]
- Tribst, J.P.M.; Dal Piva, A.M.D.O.; Rodrigues, V.A.; Borges, A.L.S.; Nishioka, R.S. Stress and strain distributions on short implants with two different prosthetic connections—An in vitro and in silico analysis. Braz. Dent. Sci. 2017, 20, 101–109. [Google Scholar] [CrossRef]
- Barbier, L.; Sloten, J.V.; Krzesinski, G.; Van Der Perre, E.S.G. Finite element analysis of non-axial versus axial loading of oral implants in the mandible of the dog. J. Oral Rehabil. 1998, 25, 847–858. [Google Scholar] [CrossRef]
- Mellal, A.; Wiskott, H.W.A.; Botsis, J.; Scherrer, S.S.; Belser, U.C. Stimulating effect of implant loading on surrounding bone: Comparison of three numerical models and validation by in vivo data. Clin. Oral Implant. Res. 2004, 15, 239–248. [Google Scholar] [CrossRef]
- Chun, H.J.; Cheong, S.Y.; Han, J.H.; Heo, S.J.; Chung, J.P.; Rhyu, I.C.; Choi, Y.C.; Baik, H.K.; Ku, Y.; Kim, M.H. Evaluation of design parameters of osseointegrated dental implants using finite element analysis. J. Oral Rehabil. 2002, 29, 565–574. [Google Scholar] [CrossRef]
- Lu, Y.J.; Chang, S.H.; Ye, J.T.; Ye, Y.S.; Yu, Y.S. Finite Element Analysis of Bone Stress around Micro-Implants of Different Diameters and Lengths with Application of a Single or Composite Torque Force. PLoS ONE 2015, 10, e0144744. [Google Scholar] [CrossRef]
- Galindo-Moreno, P.; León-Cano, A.; Ortega-Oller, I.; Monje, A.; O′ Valle, F.; Catena, A. Marginal bone loss as success criterion in implant dentistry: Beyond 2 mm. Clin. Oral Impl. Res. 2015, 26, e28–e34. [Google Scholar] [CrossRef]
- Tsai, Y.T.; Wang, K.S.; Woo, J.C. Fatigue life and reliability evaluation for dental implants based on computer simulation and limited test data. J. Mech. Eng. Sci. 2013, 227, 554–564. [Google Scholar] [CrossRef]
- Knobe, M.; Gradl, G.; Maier, K.J.; Drescher, W.; Jansen-Troy, A.; Prescher, A.; Knechtel, T.; Antony, P.; Pape, H.C. Rotationally stable screw-anchor versus sliding hip screw plate systems in stable trochanteric femur fractures: A biomechanical evaluation. J. Orthop. Trauma 2013, 27, e127–e136. [Google Scholar] [CrossRef]
- Kwak, D.K.; Kim, W.H.; Lee, S.J.; Rhyu, S.H.; Jang, C.Y.; Yoo, J.H. Biomechanical Comparison of Three Different Intramedullary Nails for Fixation of Unstable Basicervical Intertrochanteric Fractures of the Proximal Femur: Experimental Studies. Biomed Res Int 2018, 2018, 7618079. [Google Scholar] [CrossRef]
- Do, G.H.; Lee, S.J.; Kim, J.M.; Kim, S.M. Study on the Fatigue Test and the Accelerated Life Test for Dental Implant using Universal-Joint Test Type. J. Appl. Reliab. 2017, 17, 50–57. [Google Scholar]
- Weinstein, A.M.; Klawitter, J.J.; Anand, S.C.; Schuessler, R. Stress analysis of porous rooted dental implants. J. Dent. Res. 1976, 55, 772–777. [Google Scholar] [CrossRef]
- Piancino, M.G.; Isola, G.; Cannavale, R.; Cutroneo, G.; Vermiglio, G.; Bracco, P.; Anastasi, G.P. From periodontal mechanoreceptors to chewing motor control: A systematic review. Arch Oral Biol. 2017, 78, 109–121. [Google Scholar] [CrossRef]
- Yang, J.; Xiang, H.J. A three-dimensional finite element study on the biomechanical behavior of an FGBM dental implant in surrounding bone. J. Biomech. 2007, 40, 2377–2385. [Google Scholar] [CrossRef]
- Streckfus, C.F.; Parsell, D.E.; Streckfus, J.E.; Pennington, W.; Johnson, R.B. Relationship between oral alveolar bone loss and aging among African-American and Caucasian individuals. Gerontology 1999, 45, 110–114. [Google Scholar] [CrossRef]
- Mohammed, H.; Varoni, E.M.; Cochis, A.; Cordaro, M.; Gallenzi, P.; Patini, R.; Staderini, E.; Lajolo, C.; Rimondini, L.; Rocchetti, V. Oral Dysbiosis in Pancreatic Cancer and Liver Cirrhosis: A Review of the Literature. Biomedicines 2018, 6, 115. [Google Scholar] [CrossRef]
- Patini, R.; Gallenzi, P.; Spagnuolo, G.; Cordaro, M.; Cantiani, M.; Amalfitano, A.; Arcovito, A.; Callà, C.A.M.; Mingrone, G.; Nocca, G. Correlation between metabolic syndrome, periodontitis and reactive oxygen species production: A pilot study. Open Dent. J. 2017, 11, 621–627. [Google Scholar] [CrossRef]
- Carinci, F.; Lauritano, D.; Bignozzi, C.A.; Pazzi, D.; Candotto, V.; Santos de Oliveira, P.; Scarano, A. A New Strategy Against Peri-Implantitis: Antibacterial Internal Coating. Int. J. Mol. Sci. 2019, 20, 3897. [Google Scholar] [CrossRef]


| Components | Young’s Modulus (MPa) | Poisson’s Ratio |
|---|---|---|
| Crown (Zirconia) [32] | 205,000 | 0.19 |
| Abutment (Ti grade 5) [33] | 114,000 | 0.33 |
| Fixture (Ti grade 4) [34] | 105,000 | 0.34 |
| Abutment screw (Ti grade 5) [33] | 114,000 | 0.33 |
| Cortical bone [35] | 13,000 | 0.30 |
| Cancellous bone [35] | 690 | 0.30 |
| Nerve canal [36] | 70 | 0.45 |
| Cement [37] | 10,310 | 0.24 |
| Components | Elements | Nodes | Mesh Size (mm) | |||
|---|---|---|---|---|---|---|
| IS-II | IS-III | IS-II | IS-III | Maximum | Minimum | |
| Crown | 121,740 | 25,678 | 0.30 | 0.15 | ||
| Abutment | 88,637 | 21,139 | 0.15 | 0.05 | ||
| Fixture | 125,966 | 48,692 (up) 104,432 (down) | 24,396 | 12,300 (up) 23,594 (down) | 0.15 | 0.05 |
| Abutment screw | 60,588 | 13,836 | 0.15 | 0.03 | ||
| Cement | 85,425 | 20,482 | 0.1 | 0.03 | ||
| Cortical bone | 287,389 | 295,533 | 62,917 | 64,492 | 1.00 | 0.15 |
| Cancellous bone | 275,822 | 273,597 | 57,108 | 56,765 | 1.00 | 0.15 |
| Nerve | 58,241 | 15,781 | 0.15 | 0.05 | ||
| Components | Direction | Maximum Equivalent Stress (MPa) | ||||
| IS-II | n | IS-III | n | p-value | ||
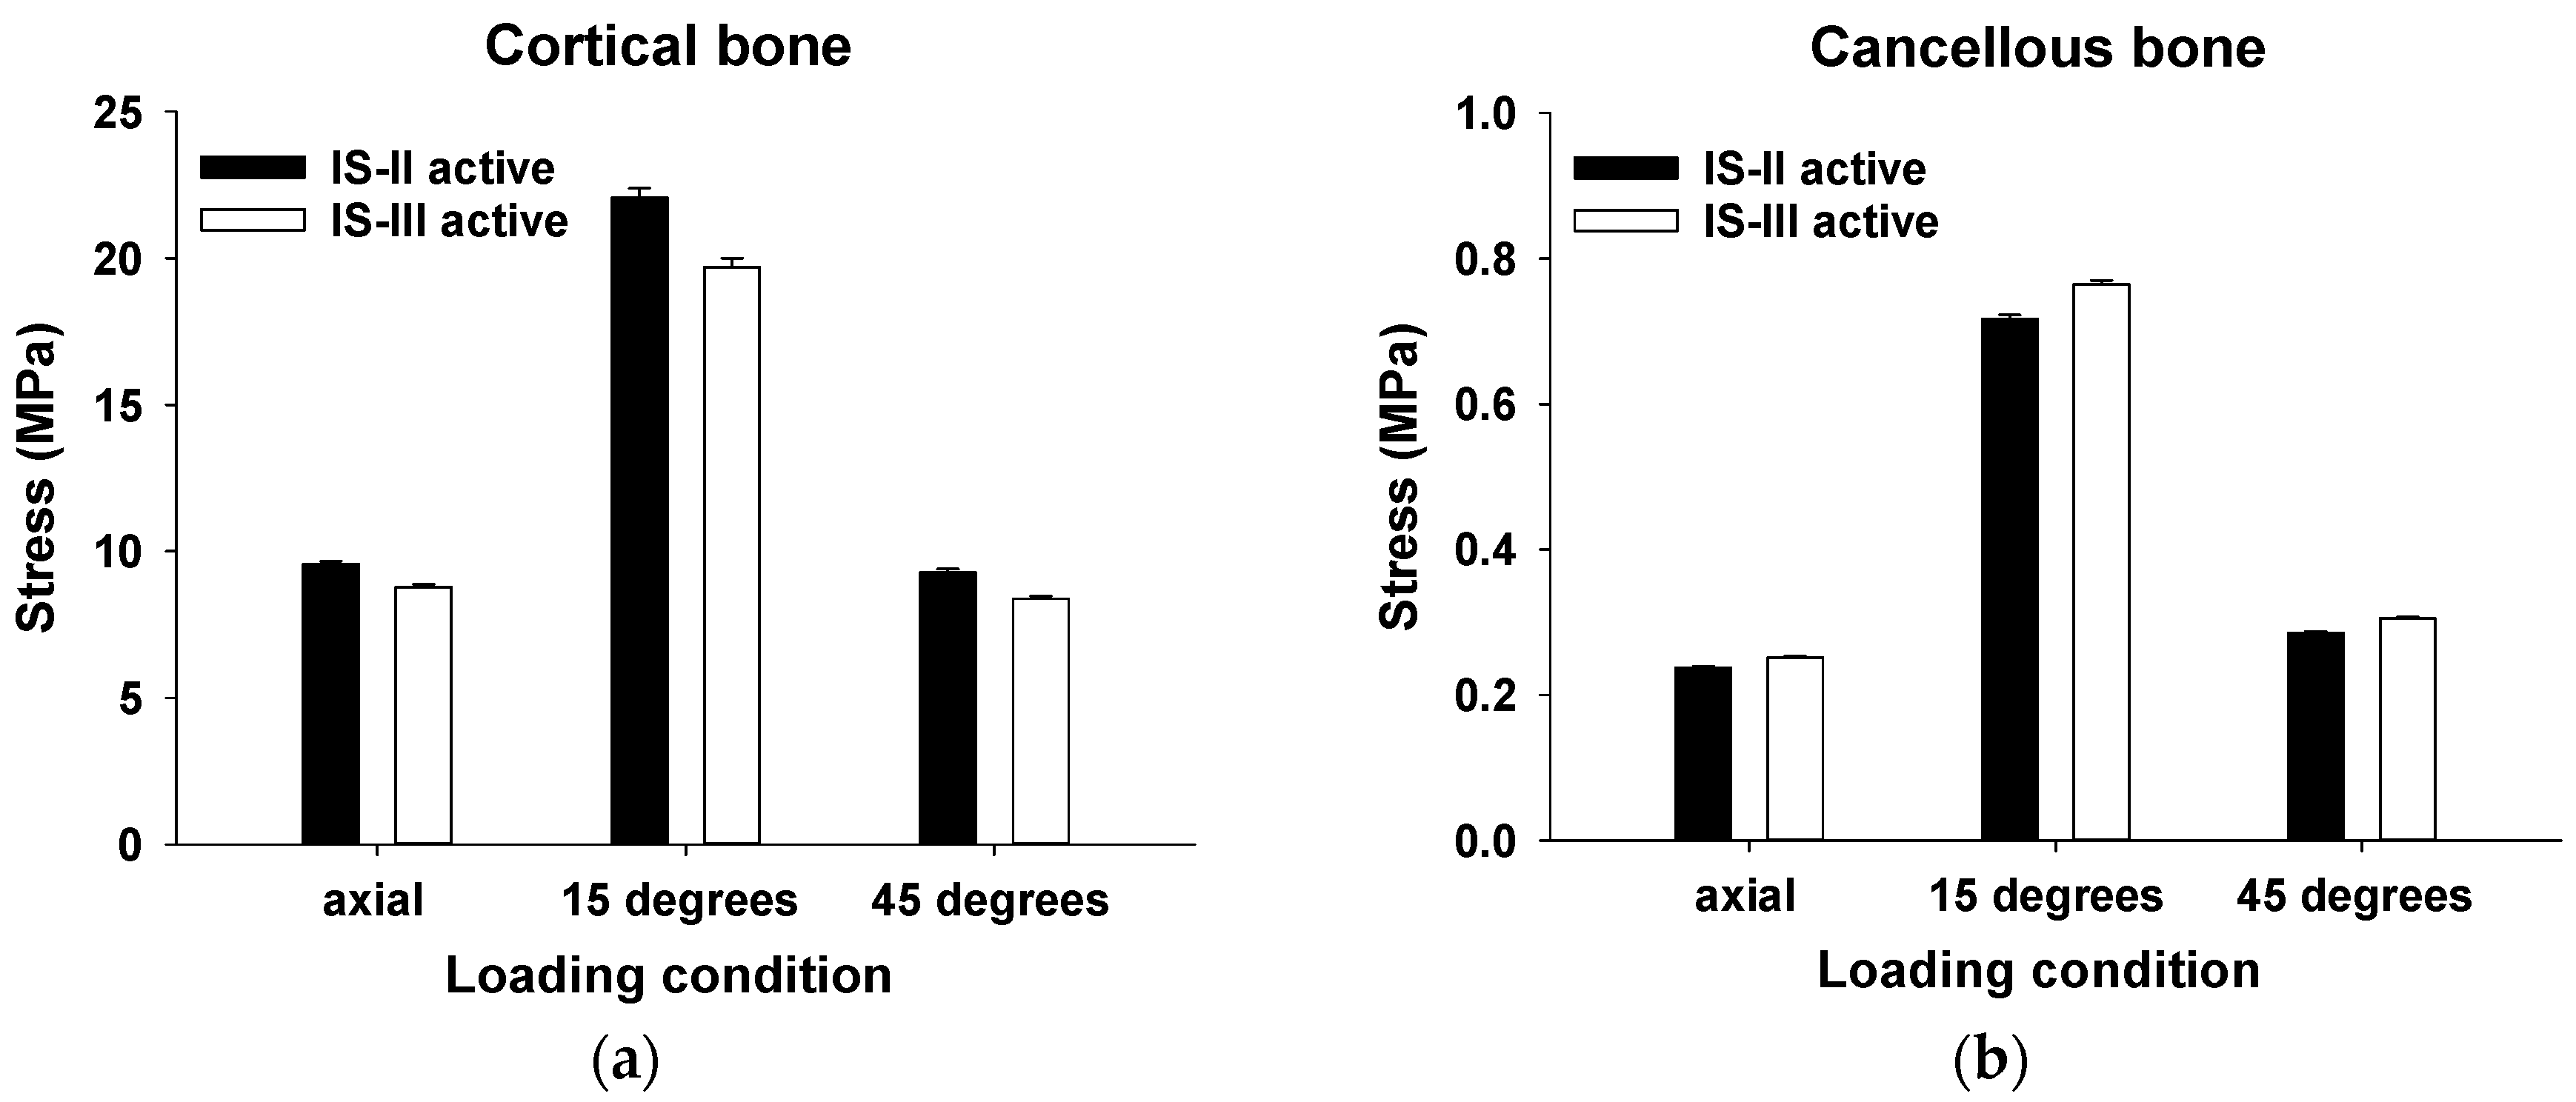
| Cortical bone | 100 N (Axial) | 9.56 ± 0.10 | 4586 | 8.78 ± 0.09 | 3906 | <0.001 * |
| 100 N (15°) | 22.07 ± 0.32 | 19.70 ± 0.29 | <0.001 * | |||
| 30 N (45°) | 9.28 ± 0.12 | 8.38 ± 0.10 | <0.001 * | |||
| Cancellous bone | 100 N (Axial) | 0.24 ± 0.002 | 8192 | 0.25 ± 0.002 | 7450 | <0.001 * |
| 100 N (15°) | 0.72 ± 0.005 | 0.76 ± 0.005 | <0.001 * | |||
| 30 N (45°) | 0.29 ± 0.002 | 0.31 ± 0.002 | <0.001 * | |||
| Components | Direction | Maximum Equivalent Stress (kPa) | ||||
| IS-II | n | IS-III | n | p-value | ||
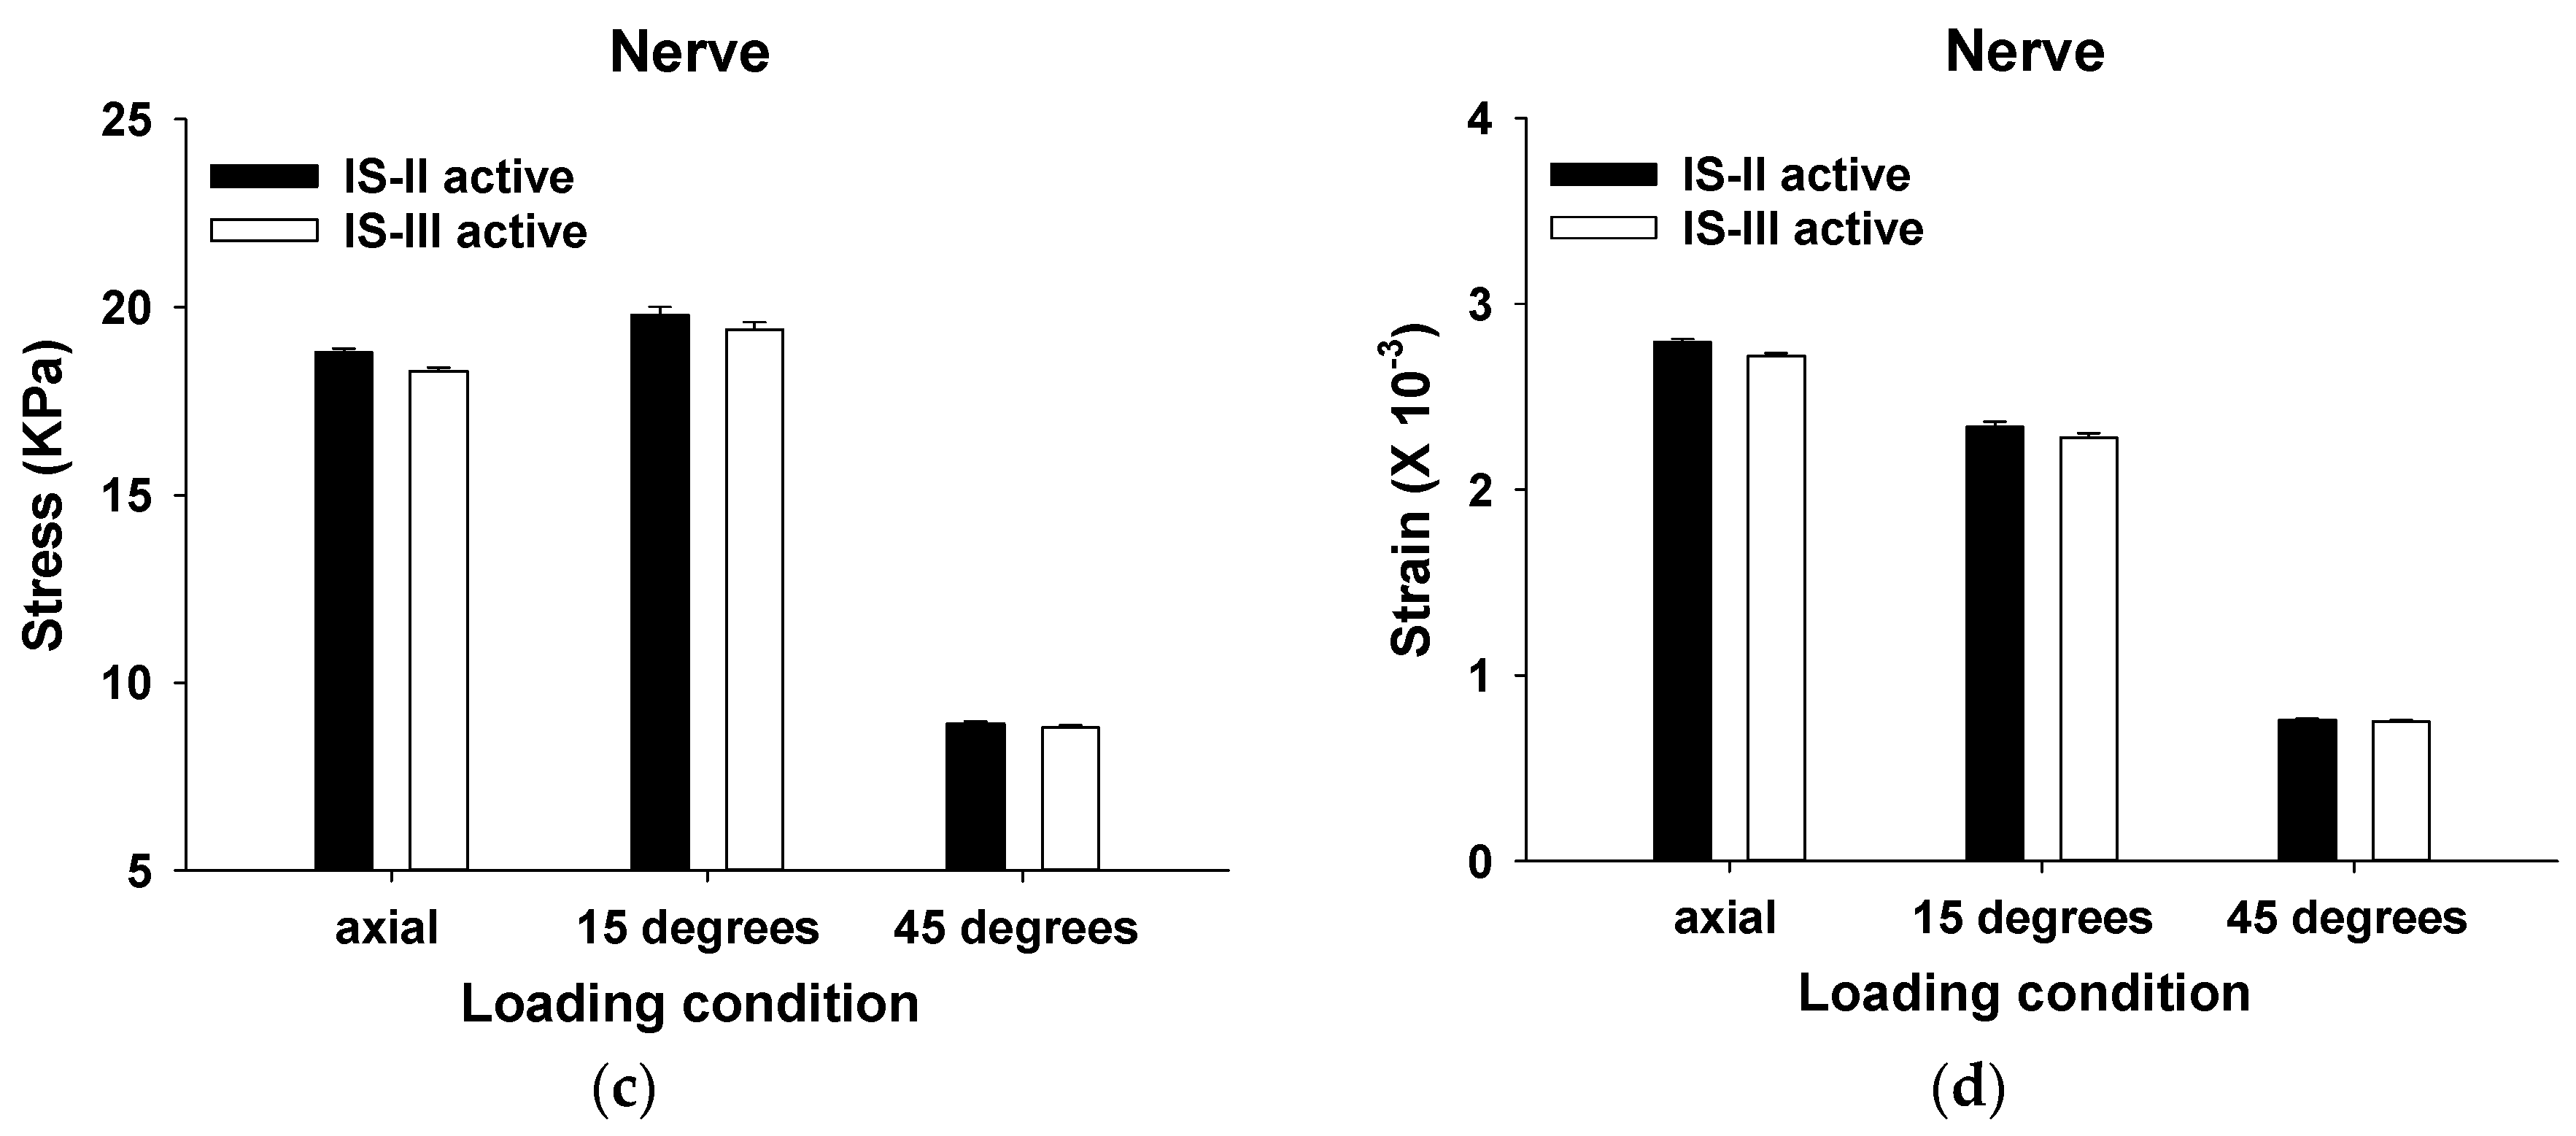
| Nerve | 100 N (Axial) | 18.80 ± 0.10 | 6031 | 18.30 ± 0.09 | 6031 | <0.001 * |
| 100 N (15°) | 19.80 ± 0.21 | 19.40 ± 0.20 | 0.168 | |||
| 30 N (45°) | 8.90 ± 0.07 | 8.80 ± 0.07 | 0.775 | |||
| Components | Direction | Minimum Principal Strain (×10−3) | ||||
| IS-II | n | IS-III | n | p-value | ||
| Nerve | 100 N (Axial) | 2.796 ± 0.015 | 6031 | 2.719 ± 0.015 | 6031 | <0.001 * |
| 100 N (15°) | 2.339 ± 0.025 | 2.278 ± 0.025 | 0.088 | |||
| 30 N (45°) | 0.759 ± 0.007 | 0.751 ± 0.006 | 0.408 | |||
| Type | Measurement Point (mm3) | ||
|---|---|---|---|
| One Pitch | Pitches and Apex | Apex Region | |
| IS-II | 2.68 | 33.42 | 77.99 |
| IS-III | 2.86 | 35.90 | 78.05 |
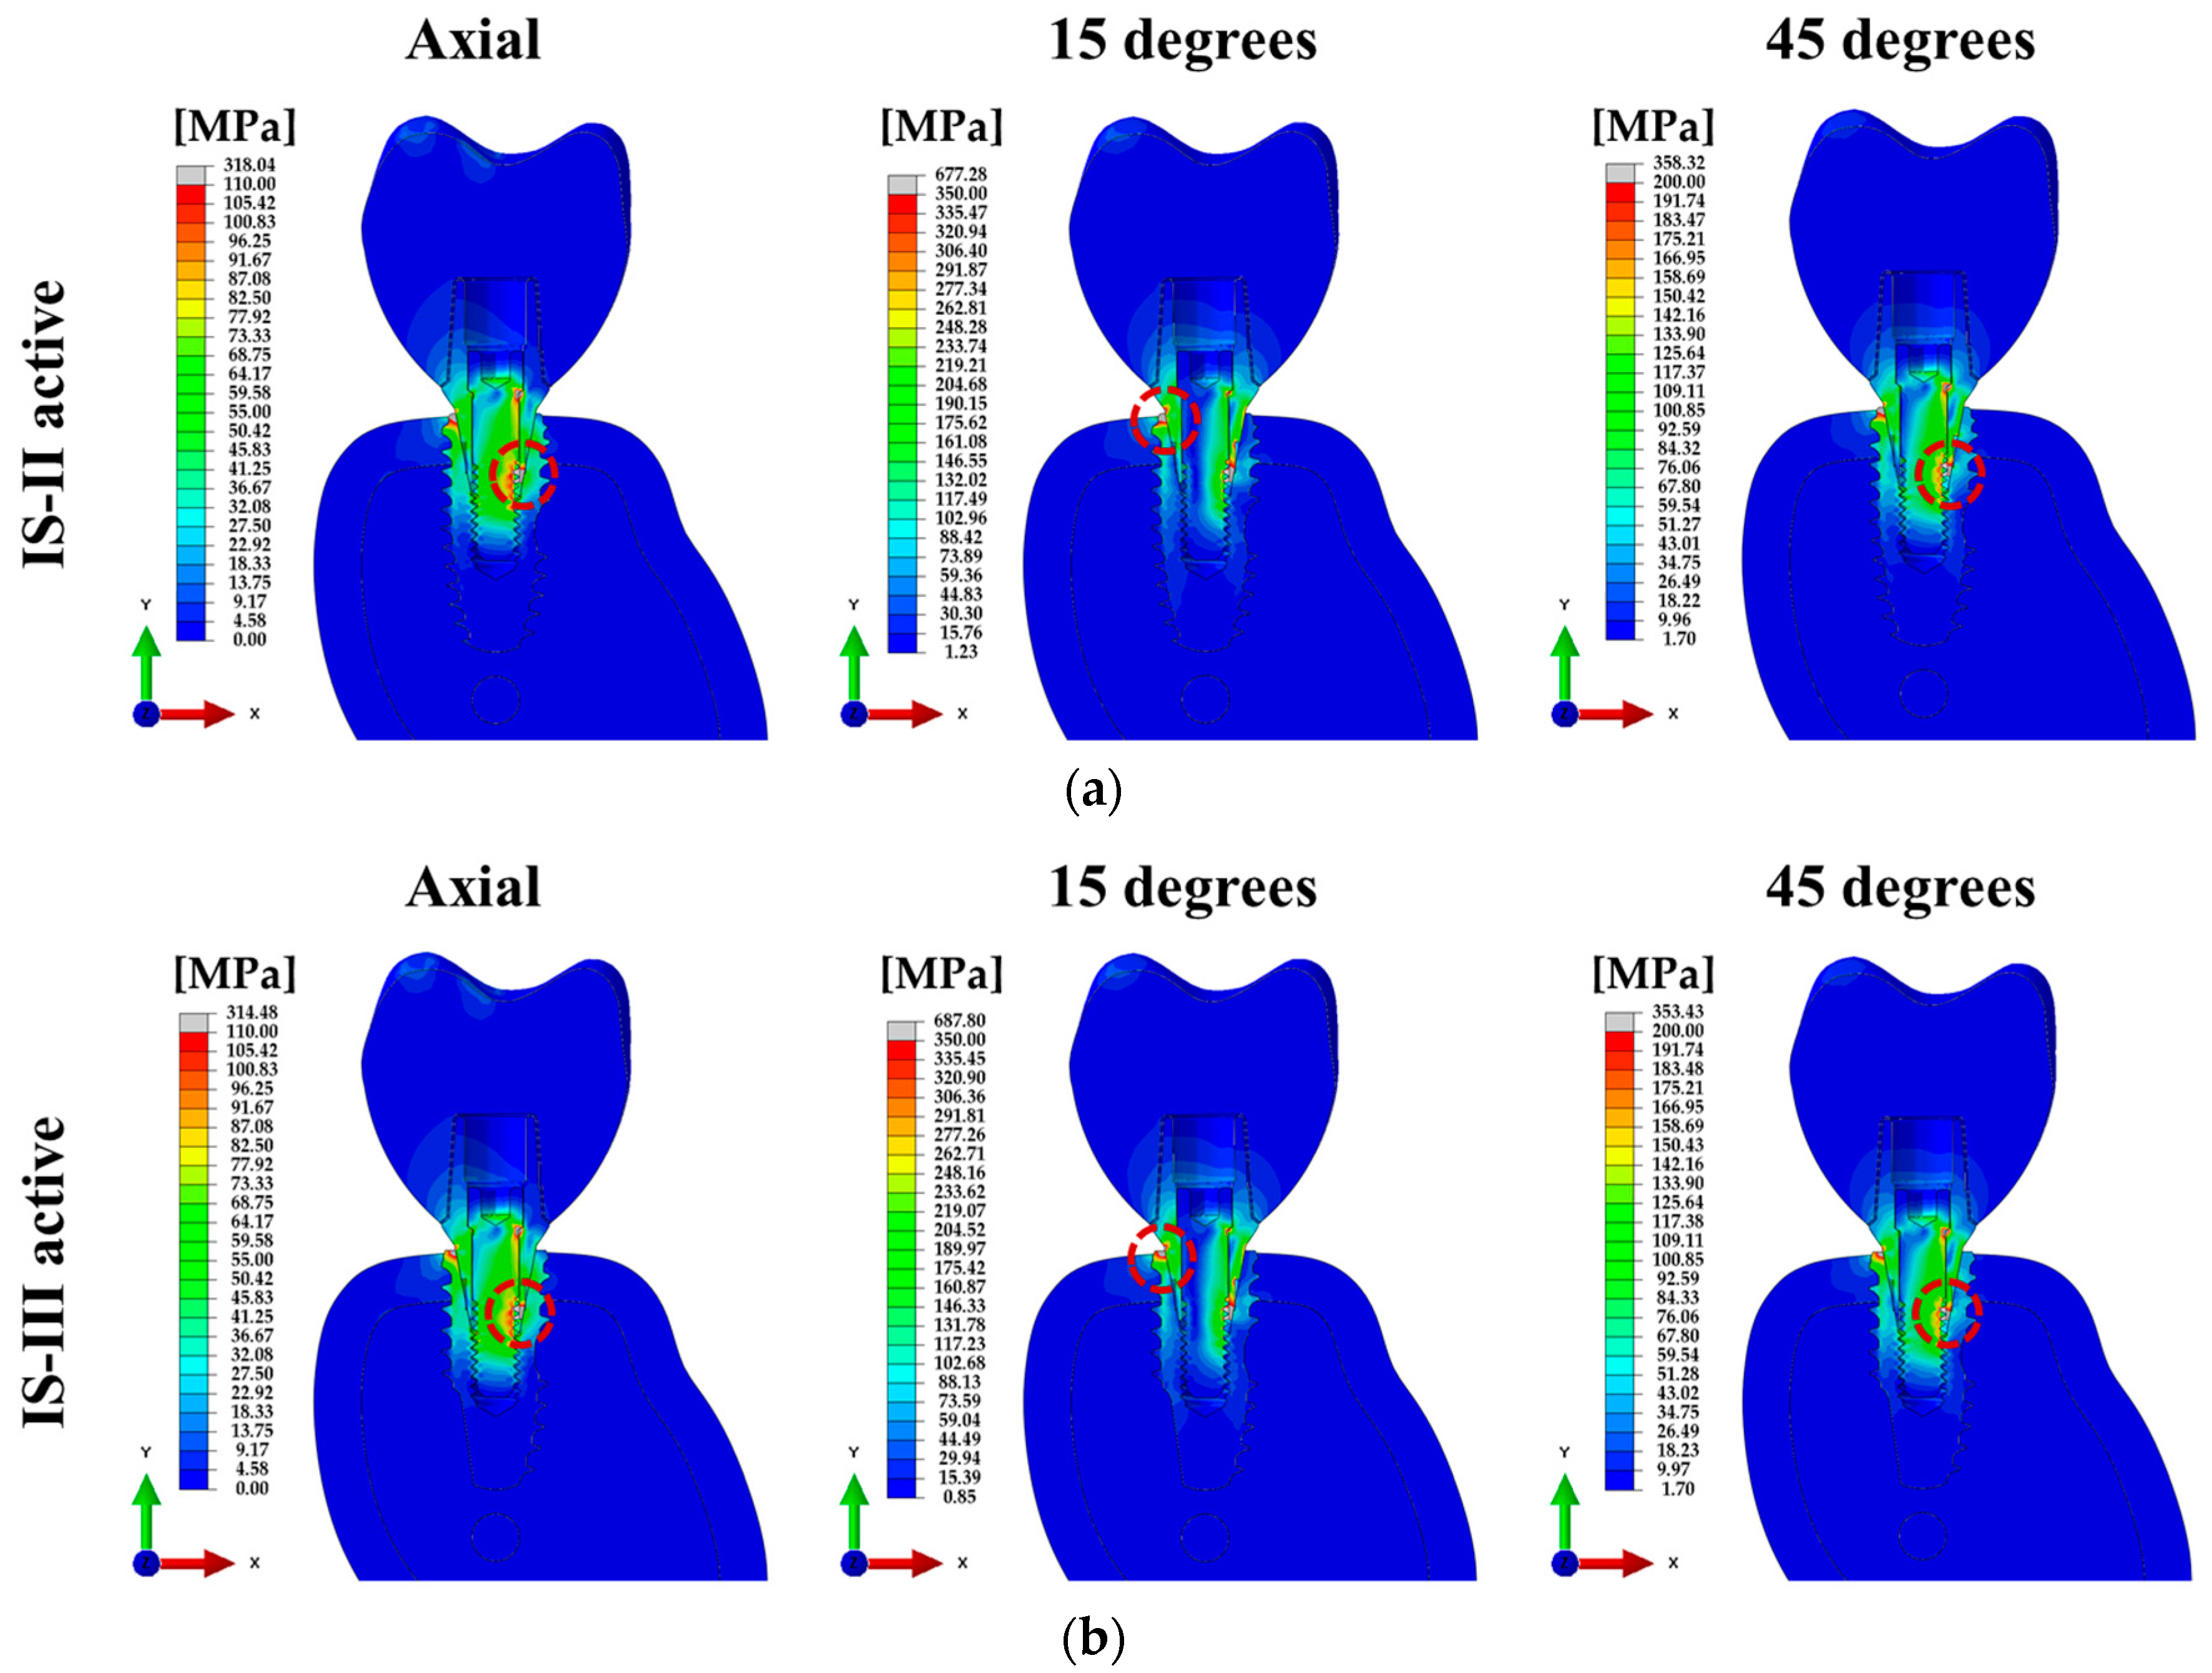
| Loading Conditions | PVMS (Mpa) | |||||||
|---|---|---|---|---|---|---|---|---|
| Abutment | Fixture | Abutment Screw | Cement | |||||
| IS-II | IS-III | IS-II | IS-III | IS-II | IS-III | IS-II | IS-III | |
| 100 N (Axial) | 318.04 | 314.48 | 257.16 | 304.65 | 289.58 | 256.66 | 15.22 | 15.17 |
| 100 N (15°) | 650.30 | 583.47 | 677.28 | 687.80 | 485.04 | 431.95 | 43.12 | 43.18 |
| 30 N (45°) | 358.32 | 353.43 | 229.58 | 270.15 | 290.52 | 286.19 | 15.89 | 15.86 |
© 2019 by the authors. Licensee MDPI, Basel, Switzerland. This article is an open access article distributed under the terms and conditions of the Creative Commons Attribution (CC BY) license (http://creativecommons.org/licenses/by/4.0/).
Share and Cite
Kim, W.H.; Lee, J.-C.; Lim, D.; Heo, Y.-K.; Song, E.-S.; Lim, Y.-J.; Kim, B. Optimized Dental Implant Fixture Design for the Desirable Stress Distribution in the Surrounding Bone Region: A Biomechanical Analysis. Materials 2019, 12, 2749. https://doi.org/10.3390/ma12172749
Kim WH, Lee J-C, Lim D, Heo Y-K, Song E-S, Lim Y-J, Kim B. Optimized Dental Implant Fixture Design for the Desirable Stress Distribution in the Surrounding Bone Region: A Biomechanical Analysis. Materials. 2019; 12(17):2749. https://doi.org/10.3390/ma12172749
Chicago/Turabian StyleKim, Won Hyeon, Jae-Chang Lee, Dohyung Lim, Young-Ku Heo, Eun-Sung Song, Young-Jun Lim, and Bongju Kim. 2019. "Optimized Dental Implant Fixture Design for the Desirable Stress Distribution in the Surrounding Bone Region: A Biomechanical Analysis" Materials 12, no. 17: 2749. https://doi.org/10.3390/ma12172749