De-alloying Behavior of Mg–Al alloy in Sulphuric Acid and Acetic Acid Aqueous Solutions

1
College of Mechanical and Vehicle Engineering, Taiyuan University of Technology, Taiyuan 030024, China
2
Taiyuan Heavy Machinery Group Co., Ltd, Taiyuan 030024, China
3
College of Materials Science and Engineering, Taiyuan University of Science and Technology, Taiyuan 030024, China
*
Author to whom correspondence should be addressed.
Materials 2019, 12(13), 2046; https://doi.org/10.3390/ma12132046
Submission received: 20 May 2019
/
Revised: 5 June 2019
/
Accepted: 24 June 2019
/
Published: 26 June 2019
(This article belongs to the Section Corrosion)
Abstract
:The fabricated Mg–Al alloy consists of α-Mg phase and Mg–Mg17Al12 eutectic phase. The corrosion behavior of cast Mg–Al alloy in sulphuric acid (H2SO4) and acetic acid (HAc) aqueous solutions was investigated. The Mg–Al alloy shows general corrosion in H2SO4 solution, and the α-Mg dendrites revealed a slightly faster corrosion rate than that of the eutectics. In HAc solution, the alloy shows an obvious selective corrosion characteristic, with the α-Mg dendrites being corroded preferentially. Grain orientation plays an important role in corrosion behavior of the alloy in the HAc solutions.
1. Introduction
Magnesium and its alloys have attracted huge interest as engineering materials for industry and electronics applications because of their low density and good mechanical properties [1,2,3]. The poor corrosion resistance has limited the wide use of magnesium alloys [4,5,6]. Reducing the impurities is an effective way for improving the corrosion resistance of these alloys [7,8,9,10,11]. The corrosion behavior of Mg alloys is highly related to their microstructures. Intermetallic phases, formed during casting, affect the corrosion process [12].
Generally speaking, the second phases in Mg alloys have been investigated by the following two main methods. On the one hand, researchers have prepared many alloys with different second-phase contents and distributions through various fabrication processes and element content control methods. Studying the corrosion resistance of these alloys can aid in understanding the roles of second phases in the corrosion process [13,14,15]. On the other hand, single-phase alloys are prepared with the same chemical compositions as the second phases of interest. By investigating the corrosion behavior of these single-phase alloys, the corrosion mechanisms of Mg alloys can be understood deeply [12,16].
Among the various commercially available alloys, the Mg–Al–Mn and Mg–Al–Zn series are widely used as engineering material [17,18,19]. The main alloying element in both alloy series is Al. The distribution of the Al can affect the corrosion behavior of Mg alloys. Al exists in Mg alloys in two ways: As a solid solution state in the α-Mg or as a second phase. The role of the Al element has been addressed, and it has been shown that the anti-corrosion ability of Mg alloys is clearly improved when the Al content reaches 10 wt% [20]. In both the (Mg–Al–Mn) AM and (Mg–Al–Zn) AZ series of alloys, β-Mg17Al12 and Al–Mn phases are the most common second phases. Of these phases, the quantity, morphology, and distribution of the intermetallic Mg17Al12 have significant effects on the anti-corrosion performance of Mg alloys. A fine β-Mg17Al12 phase is continuously distributed in the microstructure, which is beneficial to the anti-corrosion performance [21,22]. However, a β-Mg17Al12 phase with a discontinuous distribution can act as a cathode coupled with the Mg matrix, which will accelerate the corrosion [13,14]. The Mn element exists in the alloy in the form of an Al–Mn phase because of its lower solubility. Under atmospheric corrosion conditions, the anti-corrosion performance is not obviously affected by the Al–Mn phase [15]. However, it acts as a cathode in corrosive solutions [23].
There is a common phase, Mg–Al eutectic, which, although its content is low, also has a vital influence on the anti-corrosion behavior of the AZ and AM series of alloys. For example, some investigations showed that an Mg alloy with an Al content of 8.0 wt% (AZ80 Mg alloy) has better mechanical properties [24] and corrosion resistance among the AZ series, even having better corrosion resistance than AZ91D alloy [25,26,27]. Many eutectics act as good corrosion-inhibitive microstructures, which are responsible for the high anti-corrosion performance of AZ80 [26,27]. The AZ80 alloy is composed of three phases: α-Mg, Al–Mn, and Mg17Al12. Thus, the Al–Mn phase may take some effect on the corrosion behavior of the AZ80 alloy. Some investigations have reported the corrosion behavior of the respective single phases β-Mg17Al12, α-Mg, and Al8Mn5. However, the role of the Mg–Al eutectic in Mg alloys have not been understood deeply. Moreover, AZ80 alloy has relatively good anti-corrosion performance because of the existing eutectics. An investigation by Wei et al. [28] showed that the eutectic has better performance in anti-corrosion than the α-Mg phase in AM60 alloy in a polluted atmospheric environment. A similar result was obtained by Shoesmith et al. [3] in a study of the AM50 alloy in a solution containing chloride ions. For the reasons stated above, the Mg–Al alloy was fabricated in this investigation, consisting of α-Mg dendrites and Mg–Al eutectics. No Mn element was added to the Mg–Al alloy, thus avoiding any influence from an Al–Mn phase. It is very useful to clarify in more detail the corrosion process of the Mg–Al alloy in acid aqueous solutions. Some investigations show that researchers used H2SO4 solution as the de-alloying electrolyte for Mg-containing alloys. For example, in investigations by Li et al. [29] and Bian et al. [30], nanoporous copper and silver were prepared using Ag–Mg–Ce and Mg–Cu–Y alloys as raw materials, respectively. Aqueous sulphuric acids (H2SO4) in 0.04 and 0.1 mol/L concentrations were respectively applied as de-alloying solutions to dissolve the α-Mg phase. Thus, choosing the H2SO4 solution as the corrosive solution, on one hand, will mean the corrosion behavior is clarified during the immersion test. Moreover, whether the H2SO4 solution is a proper selective corrosive agent for Mg–Al alloys or not can be known at the same time. Many investigations also showed that the Mg–Al alloys have nearly the same corrosion behavior in different strong acid aqueous solutions. But the corrosion behavior in weak acid solutions, for example, acetic acid (HAc), for the Mg–Al alloys has rarely been reported up to now. For these reasons, HAc was selected as a corrosive solution in the investigation so that some novel experimental phenomena might also be present.
2. Experimental
2.1. Materials
In the experiment, pure Mg and commercial pure Al were used. The Mg–Al alloy was melted at 720 °C in a furnace. The Al weight content is 32.5%. During the melting, the protection gas Ar was used. Finally, the melt was cast into a mould. When the ingot cooled to room temperature, the Mg–Al alloy was obtained. The fabrication process of the single-phase Mg17Al12 (SP Mg17Al12) was the same with that of the Mg–Al alloy. In the experiment, the corrosion potential difference between α-Mg and Mg17Al12 phase of Mg–Al alloy is difficult to test. However, this difference is an important parameter for de-alloying process. Thus, the solid solution AZ91D (SS AZ91) and AZ61 (SS AZ61) alloys were also used in the experiment. The chemical composition of AZ91D and AZ61 alloys are shown in Table 1. The AZ61 alloy was subjected to solid solution at 400 °C for 12 h and then quenched in water at 30 °C. The AZ91D alloy was treated at 420 °C for 24 h and then quenched in water at 30 °C. SP Mg17Al12 was fabricated, which represents the cathodes of the eutectic. Pure Mg, SS AZ61, and SS AZ91D were used to act in the role of anode.
2.2. Corrosion Medium
Acetic acid (analytical reagent, mass fraction: 99.9 wt%) was used to prepare the HAc aqueous solutions. First, 19 mL of 99.9 wt% HAc was transferred into a 1000 mL beaker and diluted to 1000 mL with deionized water. Five parallel HAc solutions were prepared and stirred for 30 min using an electromagnetic stirrer. The pH values were tested using an electronic pH tester. The pH values of the solutions were in the range 1.00–1.10, which illustrates that the solution preparation method can keep the solution pH stable.
In the present study, 0.05 mol/L H2SO4 aqueous solutions was chosen as a possible corrosive medium for de-alloying treatment of an active Mg–Al alloy. The corrosion behavior of the alloy in H2SO4 solution was also investigated. The corrosive solution was prepared in the following steps. The corrosive medium was obtained by adding 3 mL of 98.3 wt% concentrated H2SO4 to 1000 mL of deionized water. The pH of the solution was stable in the range 1.00–1.05.
2.3. Weight Loss
The dimensions of specimens were 15 mm × 15 mm × 2 mm. Specimens were ground with sand paper and rinsed with acetone and deionized water. Specimens were weighed respectively using a Mettler Toledo ML204 electronic balance with a resolution of 0.1 mg; original weight is represented by m0. After being corroded for various times in the acid solution and removing the corrosion products by chromic (20 wt% CrO3 + 1 wt% AgNO3), the specimens were weighed again, and the value was recorded as m1. Five replicas of the Mg–Al alloy were immersed in the corrosive medium for 30, 60, and 90 min. Every specimen was immersed in a beaker with 300 mL acid solution. The following formula was used to calculate the corrosion rate:
where vm is the corrosion rate, t the corrosion time, and S the specimen’s surface area.
2.4. Hydrogen Evolution
The average corrosion rates can be assessed by hydrogen evolution [31]. In this investigation, the hydrogen evolution volumes of specimens in H2SO4 solution were recorded once every minute because of the low pH of the corrosive medium. The hydrogen evolution rate of the specimen in HAc solution was lower, and the total hydrogen volume was recorded once every 2 min. The corrosion rate was obtained from the following formula:
2.5. pH Measurement
The acid solution pH was measured by a precision pH meter (Mettler Toledo SG2, ±0.01, Zurich, Switzerland) during the immersion experiment. By measuring the solution pH, the H+ concentration can be obtained immediately. The solution pH greatly affects the corrosion behavior of Mg-based materials [32,33,34]. If the solution pH remained unchanged after the experiment had finished, the real corrosion behavior of the specimen in the acid solution given could be determined.
2.6. Electrochemical Measurements
The electrochemical corrosion behavior of a sample was characterized by using a PGSTAT30 electrochemical workstation. The samples used for the electrochemical test were similar to those for the immersion test. The F029 corrosion test system was used to measure the polarization curves. Each test was conducted by using 300 mL acid solution coupled with three-electrode system. Polarization measurements were carried out in a corrosion cell containing 300 mL corrosive acid solution using a standard three-electrode system. The saturated KCl calomel electrode (SCE) served as the reference electrode. The sample was encased in resin, with 1 cm2 being left exposed as the working electrode. The counter-electrode was a platinum sheet. The electrochemical test was carried out in the potential range of −2.0 to 0 V with a rate of 0.5 mV/s. Each test was conducted by using three parallel specimens. The electrochemical parameters were gained by using the Tafel extrapolation method.
2.7. Surface Analysis
The corroded specimen surface was examined by a scanning electron microscope (SEM, Tescan VEGA3, Brno, Czech Republic) attached with an energy-dispersive spectrometer (EDS). Combining the line-scanning and area-scanning methods, the chemical composition on the sample surface can be analyzed effectively.
3. Experimental Results
3.1. Microstructural Characterization
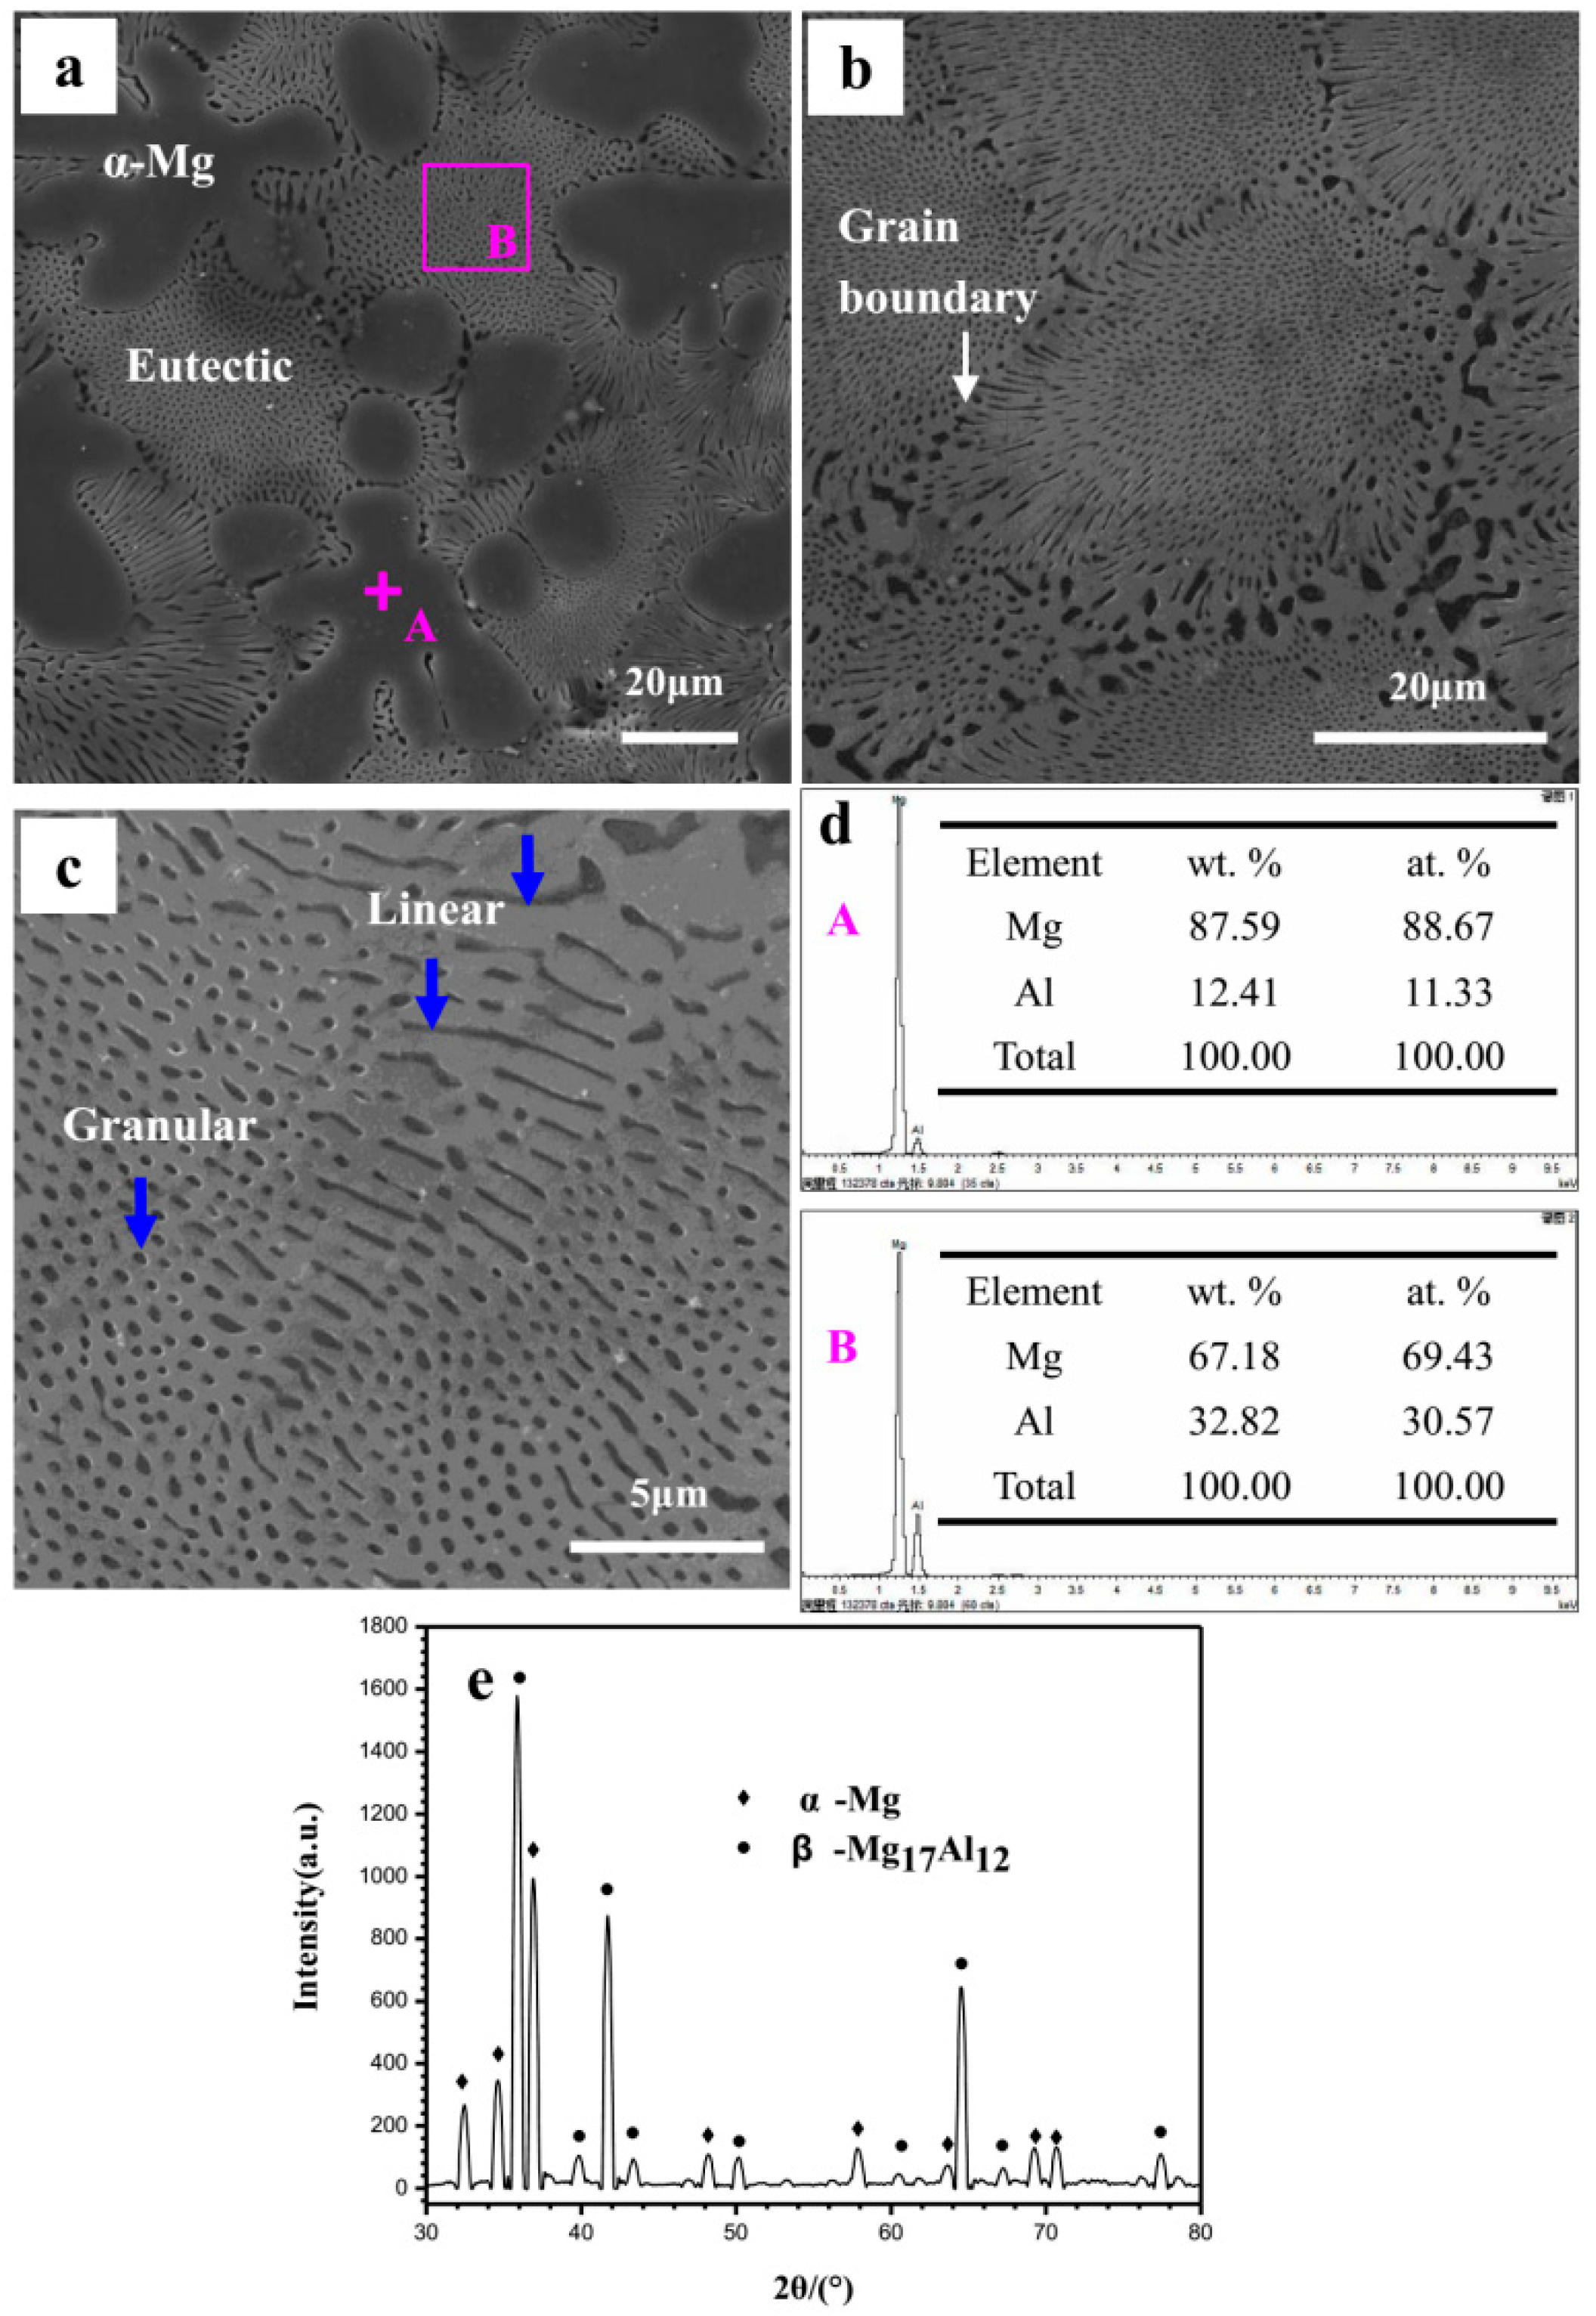
The Mg–Al alloy is composed of α-Mg matrix and eutectic, as shown in Figure 1a. The α-Mg phase shows large dendrites and is randomly distributed in the matrix. By contrast, the eutectic is very fine. Figure 1b is an enlarged view of the eutectic microstructure. It can be seen that the eutectic is about 30 μm in grain size. The eutectic near to the grain boundary has a radial distribution. In the eutectics, the α-Mg phase exhibits two kinds of morphologies: Typically, round-like with a radius of 0.5 μm and bar-like with a width of 0.5 μm (Figure 1c). It should be noted in particular that the round-like α-Mg phase may possibly be an outcrop on the specimen surface of the bar-like phase. The presence of two morphologies in the eutectic is due to different α-Mg phase characters on the specimen surface: Point-like eutectic and feather-like eutectic. The α-Mg phase in the alloy is easily corroded, and its distribution has a significant influence on the corrosion behavior of specimen. The real morphology of the α-Mg phase in the eutectic may be revealed during the corrosion process, as discussed in Section 4. In this investigation, the Mg–Al alloy has a high Al content, and thus the Al content of α-Mg dendrites formed in its microstructure may be different from that in the common alloys AZ31, AZ91, AM60, etc. The EDS results in Figure 1d show that the Al content of the α-Mg dendrites is 12.4 wt% (the average value of seven test points, including the point A), which is higher than that of the common Mg alloys [35] and will inevitably affect the specimen’s corrosion behavior. The eutectic in site B has an Al content of 32.8 wt%, which is quite close to the ideal value, 32.3 wt% [36]. The XRD pattern shows that the Mg–Al alloy only consists of α-Mg and Mg17Al12 phases (Figure 1e), which agree with the results shown in Figure 1a.
3.2. Polarization Curves
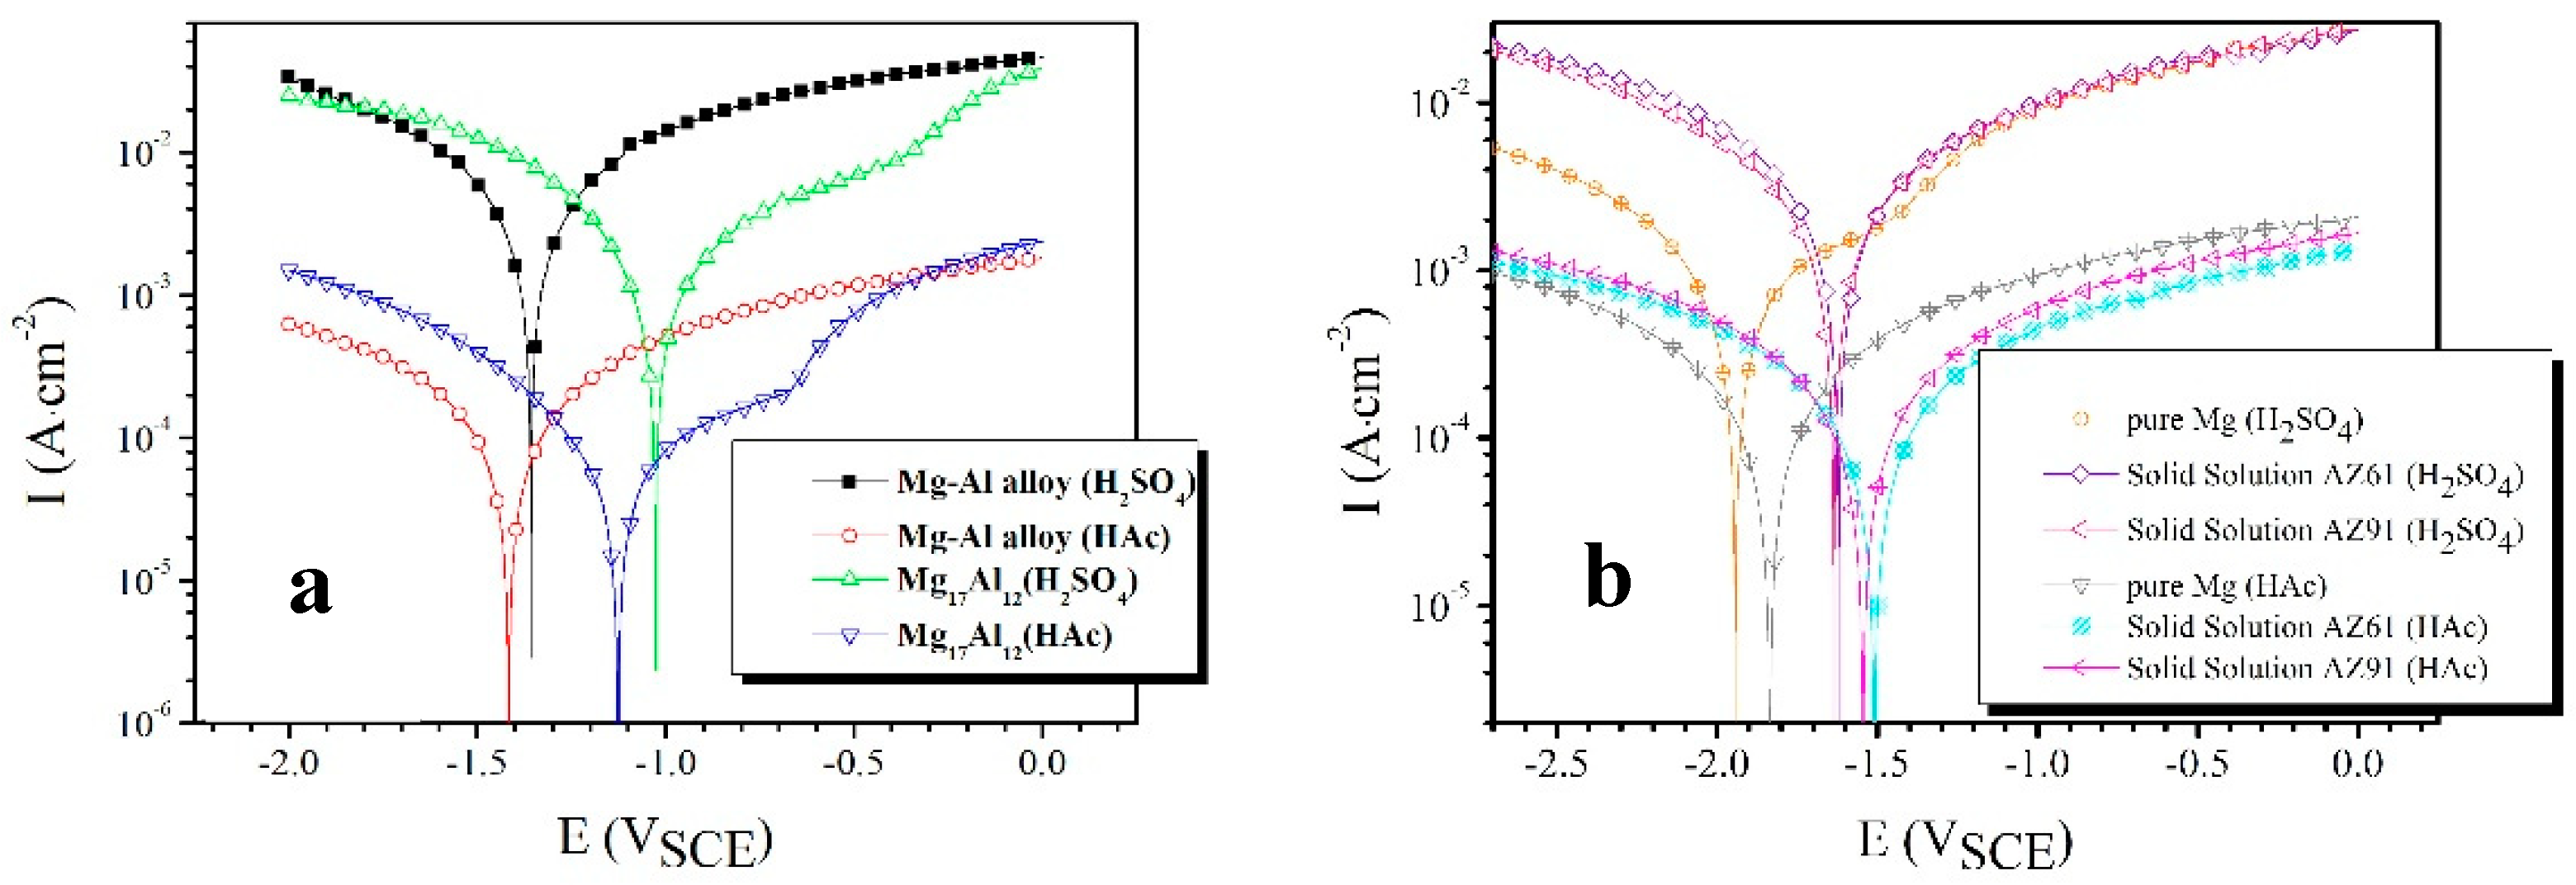
The polarization curves results are shown in Figure 2. It isclear that the corrosion potential (Ecorr) of SP Mg17Al12 is more positive than that of the Mg–Al alloy in H2SO4 solution, and the same results are obtained in HAc solution. GPES software in combination with the electrochemical workstation was used to measure the electrochemical parameters of the specimens, which are shown in Table 2. icorr is the corrosion current density. The cathodic branches and Ecorr are used to fit the icorr [37,38].
The SP Mg17Al12 has a 330 mV more positive corrosion potential than the Mg–Al alloy in H2SO4 solution (Figure 2a). The similar results were observed in HAc solution, and the potential difference is 289 mV. The icorr can be used to evaluate the anti-corrosion ability of an alloy [39]. The icorr values of the Mg17Al12 in H2SO4 and HAc solution are both about half that of the Mg–Al alloy. Apparently, the SP Mg17Al12 has higher anti-corrosion performance than the Mg–Al alloy.
The corrosion potential difference (α-Mg phase and Mg17Al12) is difficult to measure in an acid solution, and so we fabricated several alloys, such as the SP Mg17Al12, pure Mg, solid solution AZ61, and AZ91D. The SP Mg17Al12 could be regarded as the cathode when the eutectic alloy was immersed in solution. Pure Mg, SS AZ61, and SS AZ91 were considered as the anode and their polarization curves were tested (Figure 2b) to determine the influence of Al content on corrosion resistance. From the polarization curves and their electrochemical parameters, one can find that all selected candidate alloys for the anode above have nearly the same order in the corrosion current density in H2SO4 solution and HAc solution, respectively. But an obvious difference appears in the corrosion potential. Because the pure Mg has a very low corrosion potential compared with the SS AZ61 and the SS AZ91, it is unsuitable to represent the anode of eutectics. There is a little difference between the SS AZ61 and the SS AZ91 in the corrosion potential, and the latter has a higher Al content. For this reason, the SS AZ91 was selected as a replacer of the anode of the eutectic in this investigation. The measured corrosion potential difference between the SS AZ91 and the SP Mg17Al12 is 610 mV in H2SO4 solution and 418 mV in the HAc solution, respectively.
3.3. Corrosion Rate
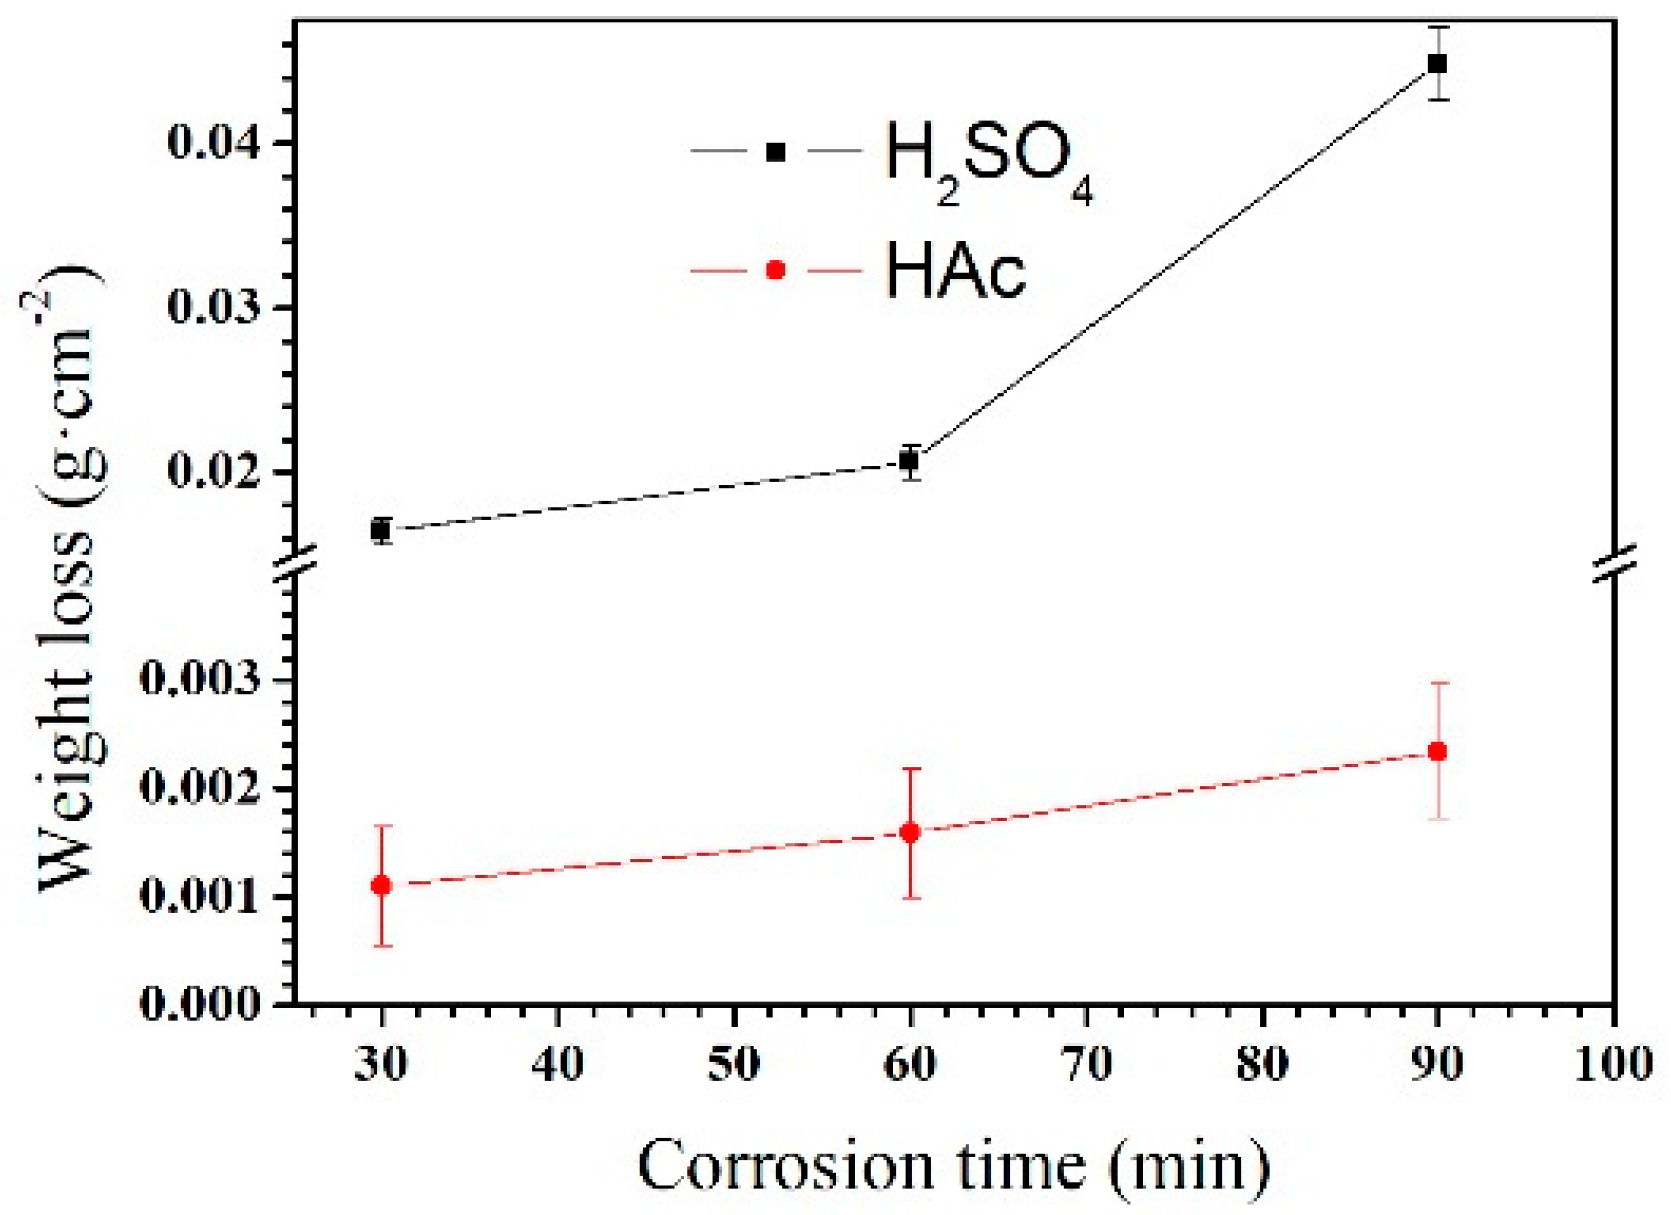
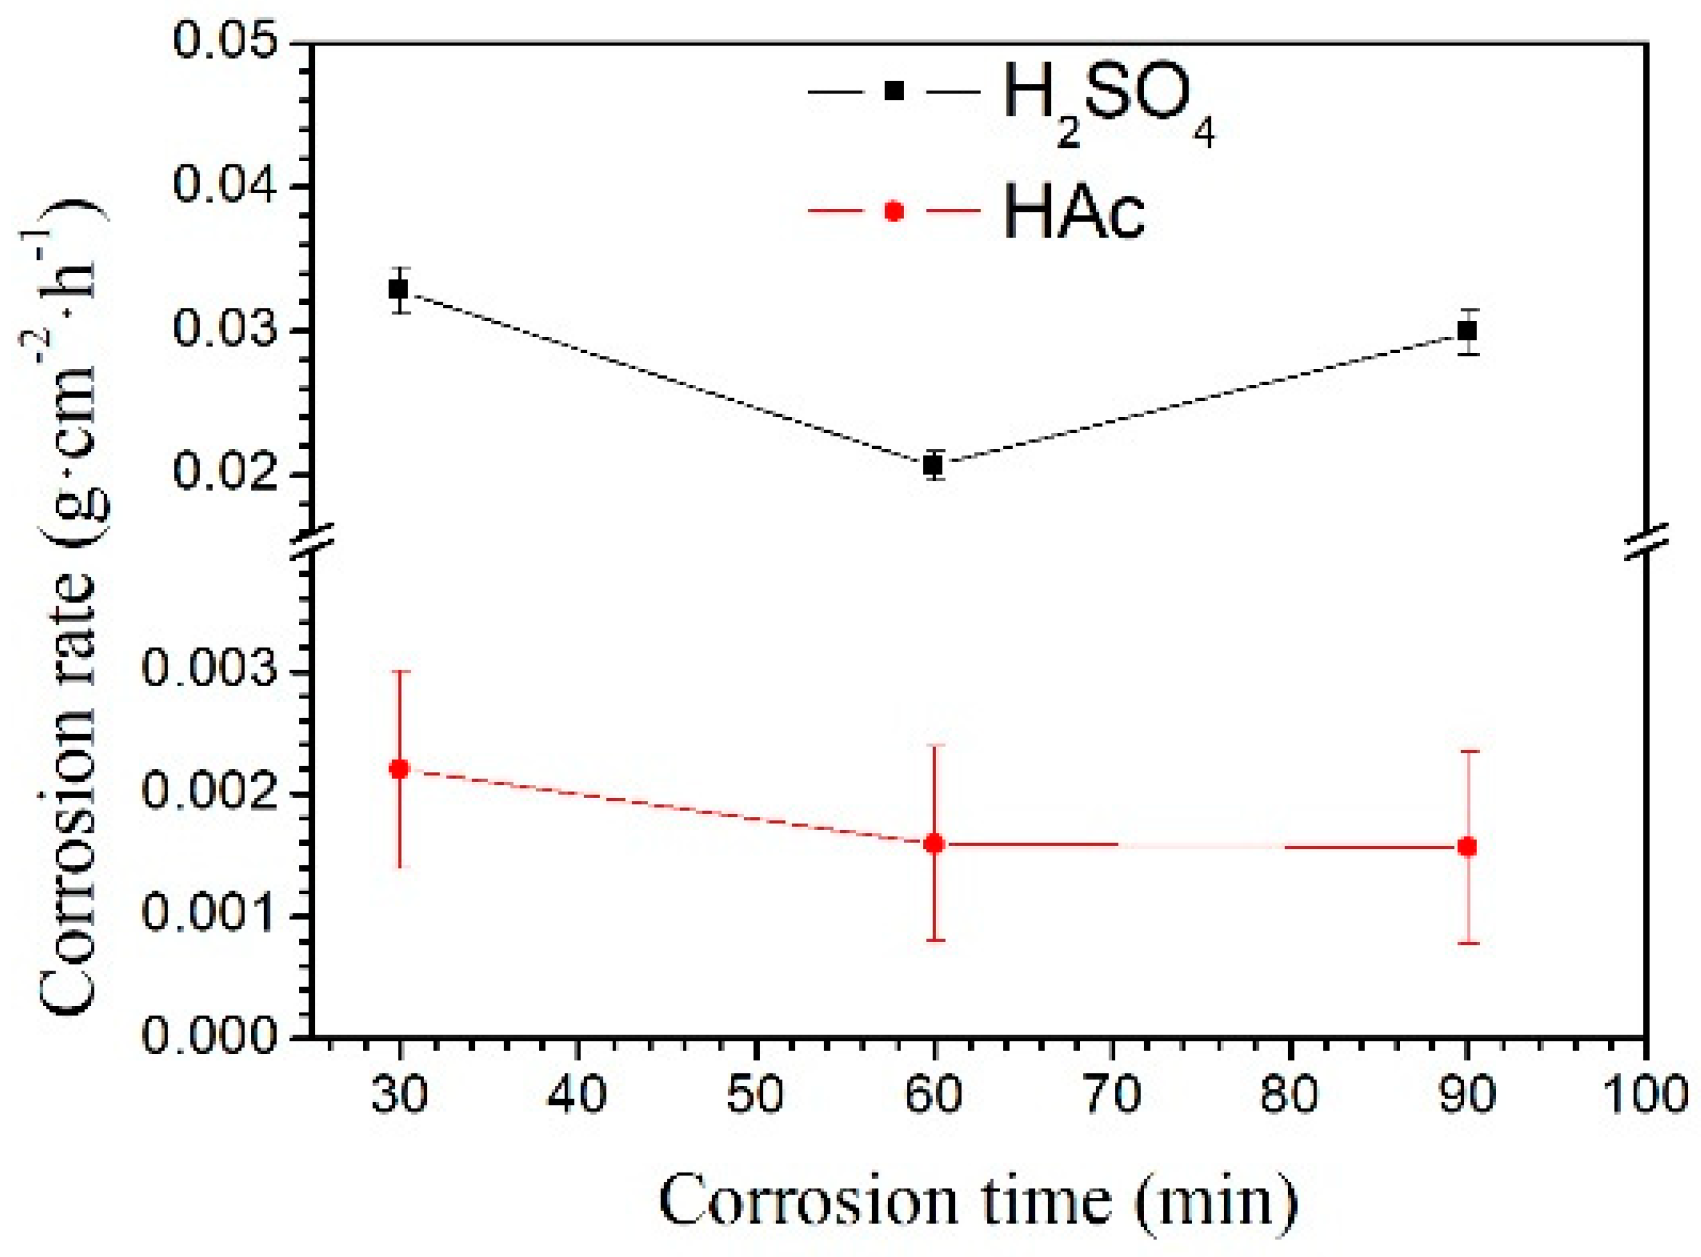
The weight loss rate of the Mg–Al alloy in H2SO4 solution is shown in Figure 3. The weight loss rate is not linear with the corrosion time. Within the corrosion time range of 30–60 min, the weight loss rate increases slowly. However, it increases rapidly in the range 60–90 min. When specimens were immersed in HAc solution, the weight loss rate is linear to the corrosion time. In the experiment, the weight loss rate reflects the weight change per unit area; by contrast, the corrosion rate, shown in Figure 4, is a better reflection of the corrosion speed for a specimen. In the first 30 min, specimens had a higher corrosion rate than that after 60 min immersion in H2SO4 solution. However, with the prolong of corrosion time to 90 min, the corrosion rate increased again. In HAc solution, the specimens exhibit a steady corrosion rate.
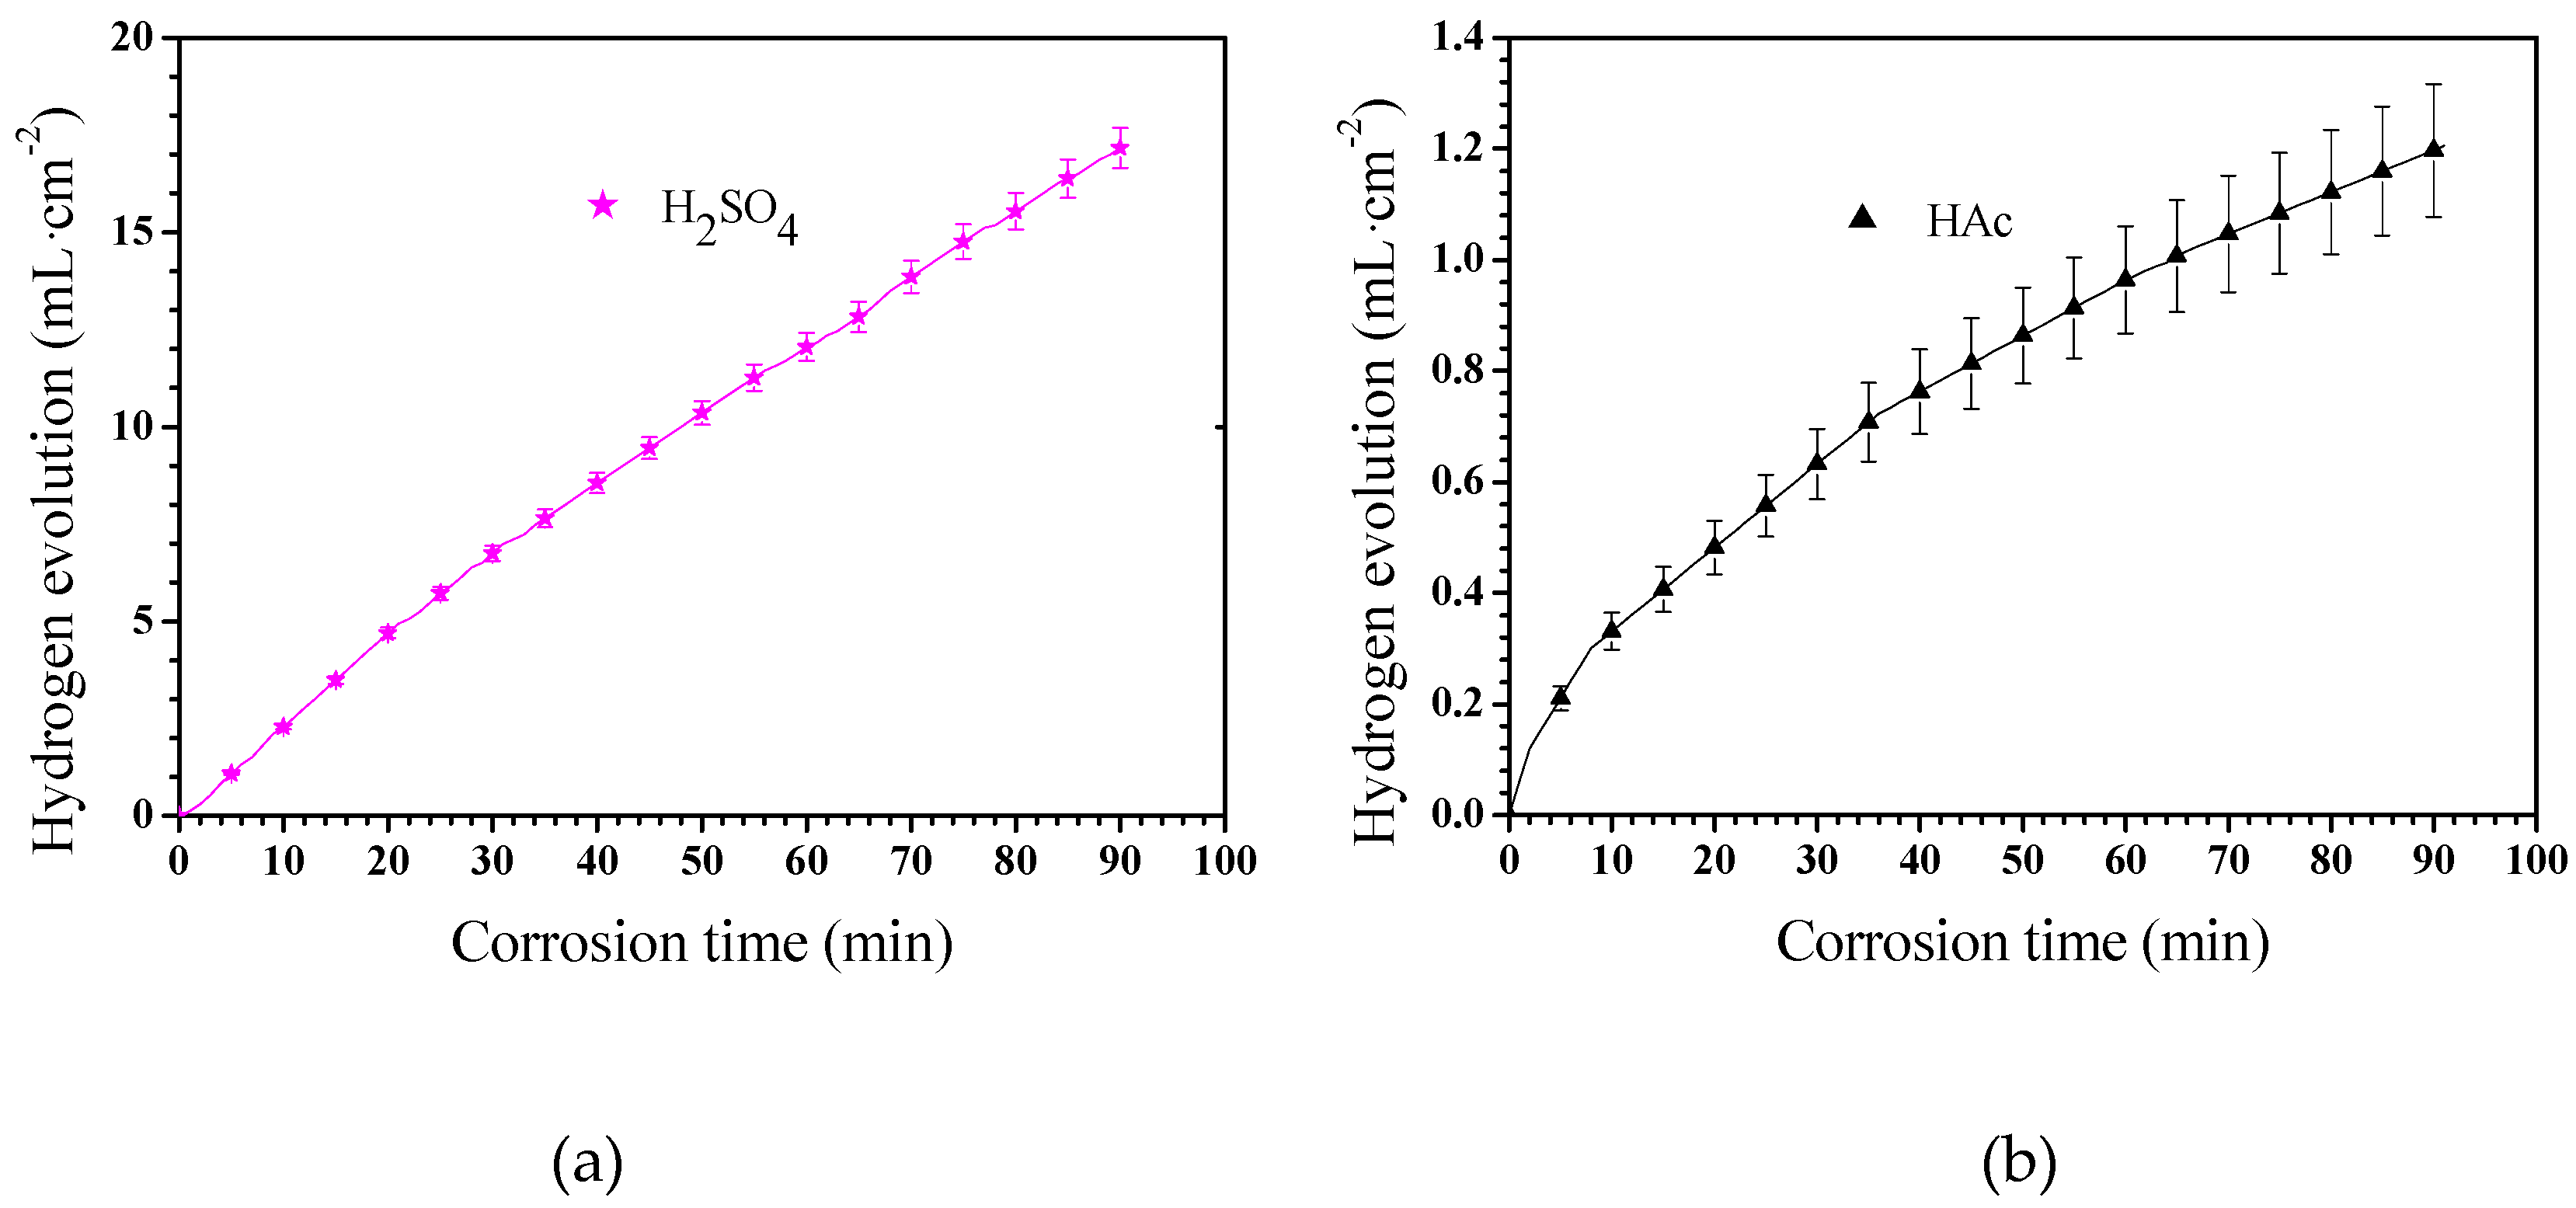
The corrosion rate of Mg–Al alloys can also be assessed by hydrogen evolution measurement [40]. The Mg–Al alloy’s hydrogen evolution results in these two solutions is shown in Figure 5. The Mg–Al alloy’s hydrogen evolution volume per unit area in H2SO4 solution shows an approximately linear dependence on the corrosion time from 0 to 90 min (Figure 5a). The hydrogen evolution volume of the specimen in HAc solution slowed down gradually with extended corrosion time, which indicates that the corrosion process was suppressed (Figure 5b). Specifically, the hydrogen evolution rate was rapid in the first 8 min, after which the hydrogen evolution process progressed sluggishly.
3.4. Corrosion Morphology
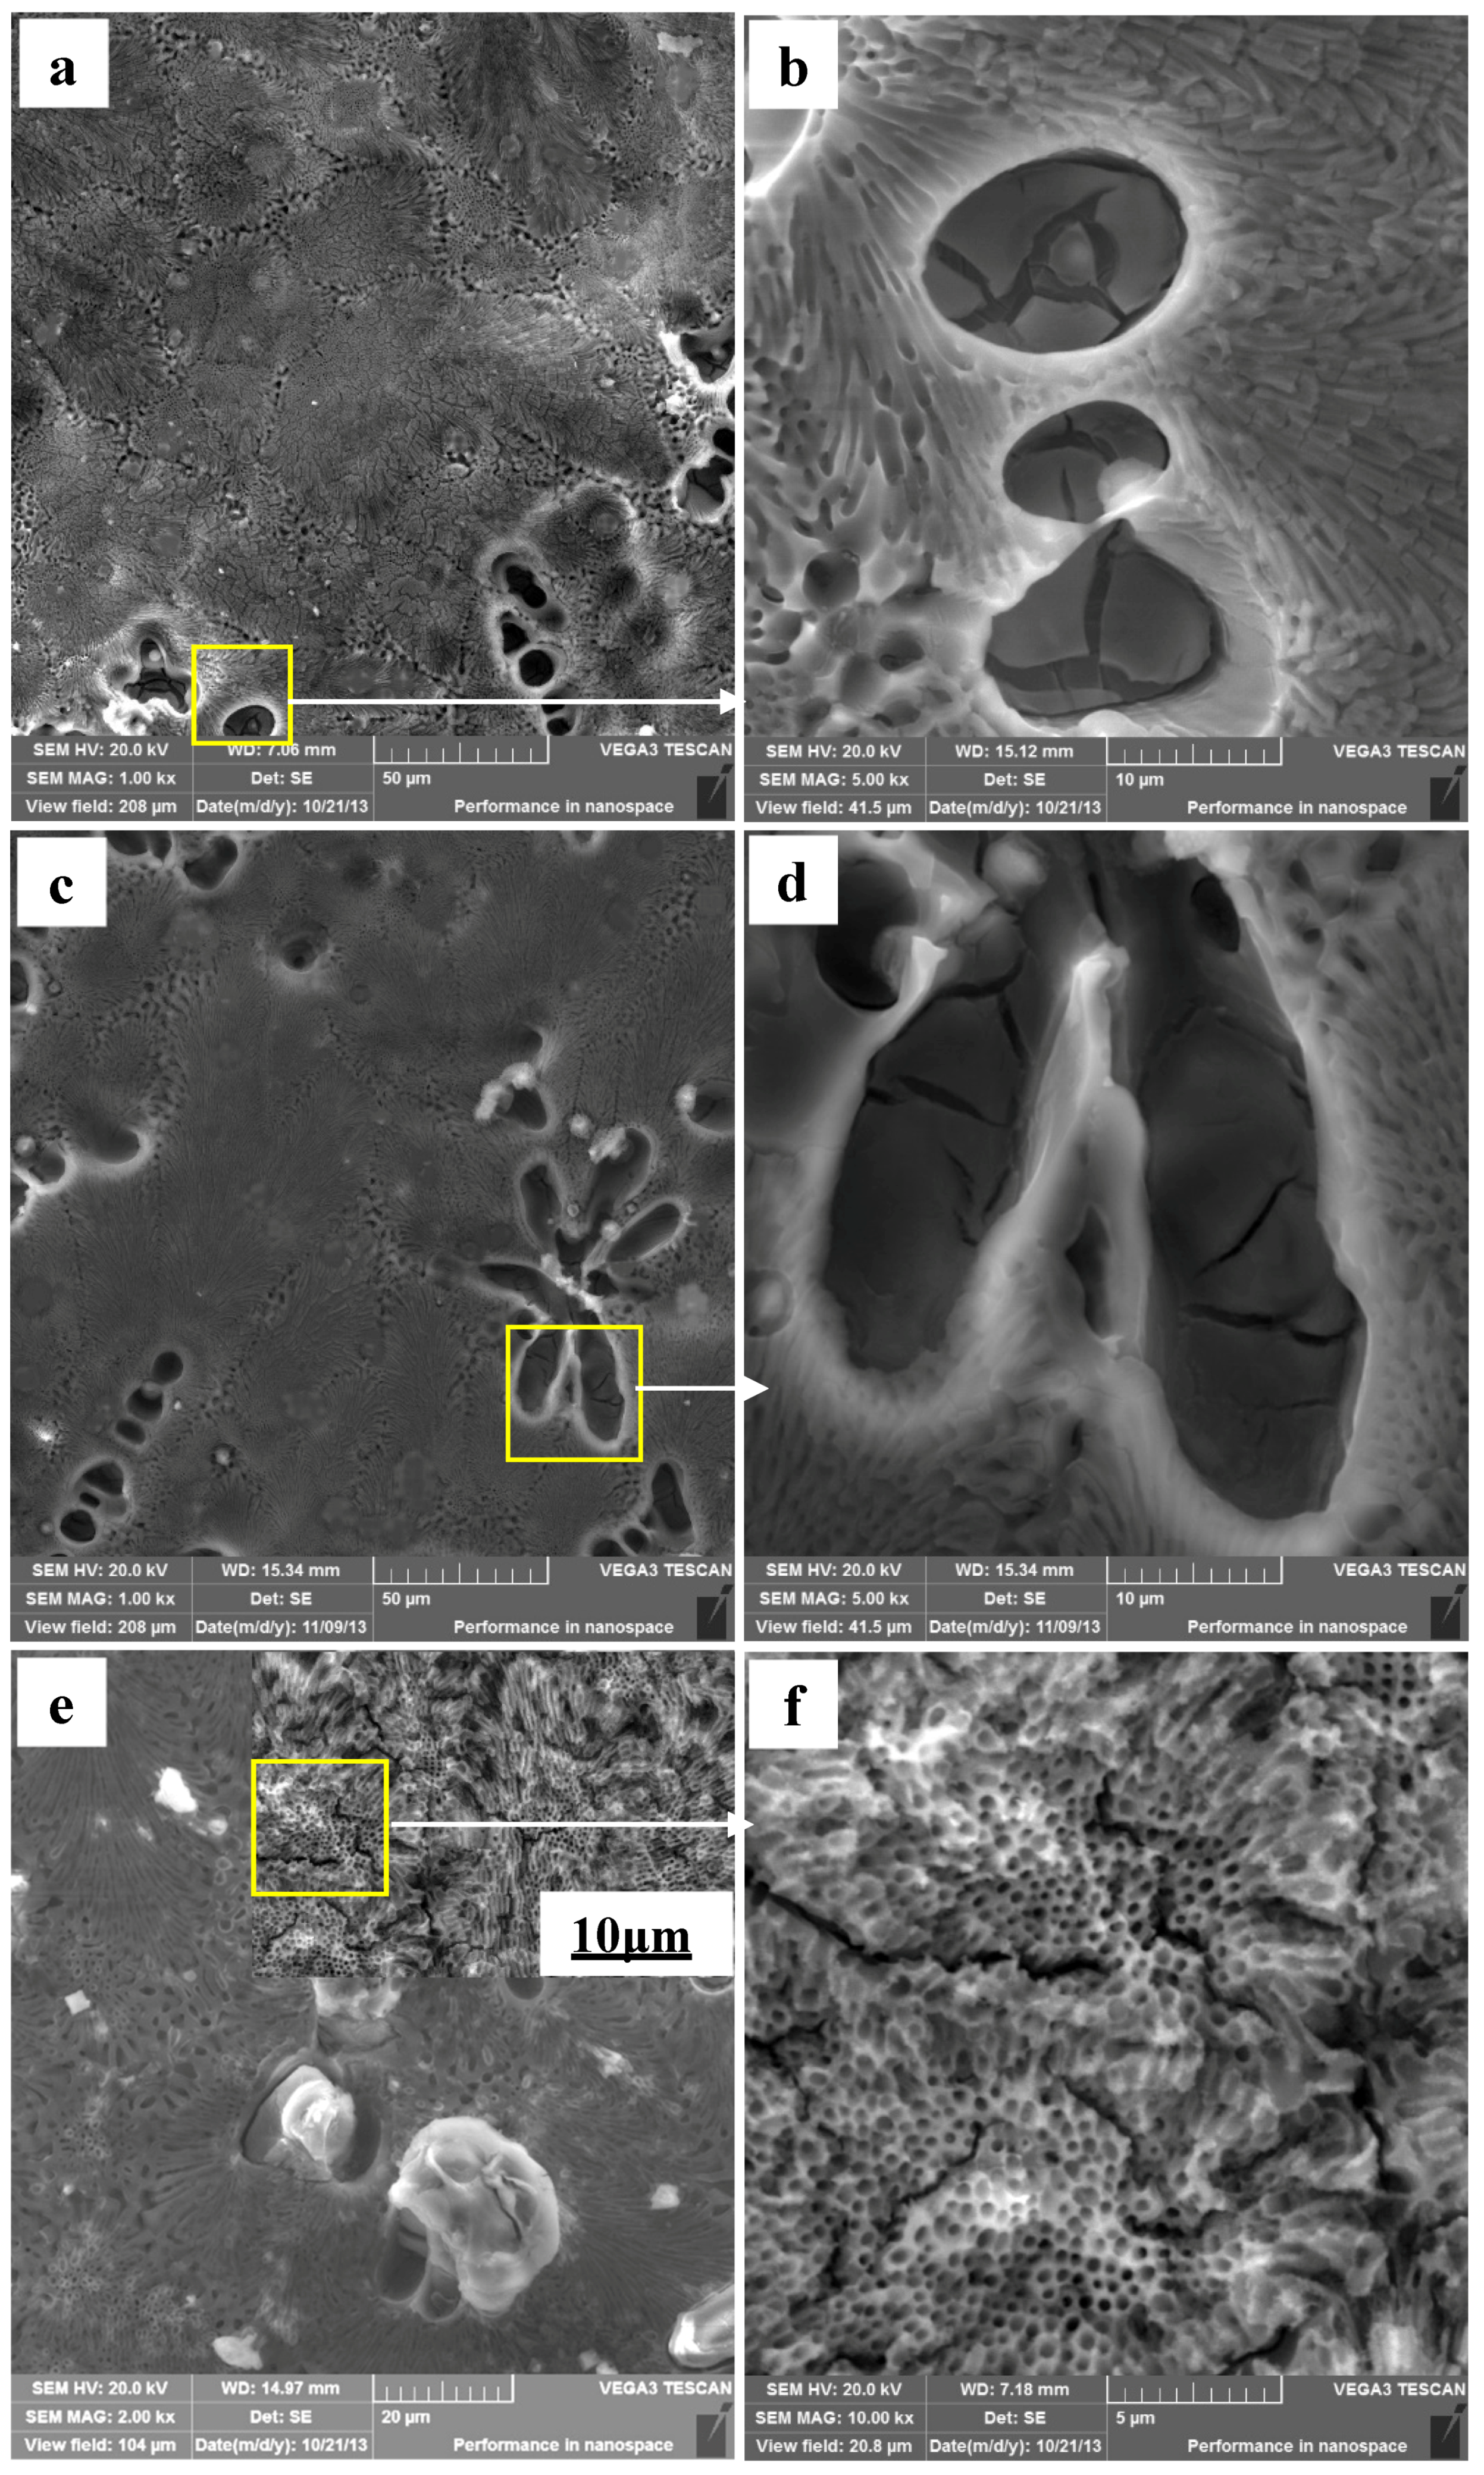
The Mg–Al alloy’s surface morphologies after immersion for various times in H2SO4 solution are shown in Figure 6. The Mg–Al specimen’s corroded surface morphology after immersion for 30 min is shown in Figure 6a. Overall, the corroded specimen surface is uniform, and the α-Mg dendrites are corroded more severely than the eutectics. Figure 6b is an enlarged detailed view of the corroded α-Mg dendrite in Figure 6a and shows that some deeper pits formed at the α-Mg dendrite areas and that these α-Mg phases are not corroded completely, with some corrosion films and cracks being formed on it. It indicates that the protective effect of these films is not enough to hinder the corrosion of the matrix. Some corrosion products are observed at the border of the α-Mg dendrites for specimens immersed for 60 min (Figure 6c). In Figure 6d, it can be seen that discontinuous films are present on the α-Mg dendrite surfaces. The corrosion products on the specimen surfaces increase in quantity gradually as the immersion time is prolonged to 90 min (Figure 6e). Under higher magnification, Figure 6f shows that the eutectic surface becomes uneven, with the appearance of many cracks. All these results illustrate that the specimens are severely corroded. In general, the eutectics have better corrosion resistance than α-Mg dendrites, no matter how long the specimen is immersed in H2SO4 solution.
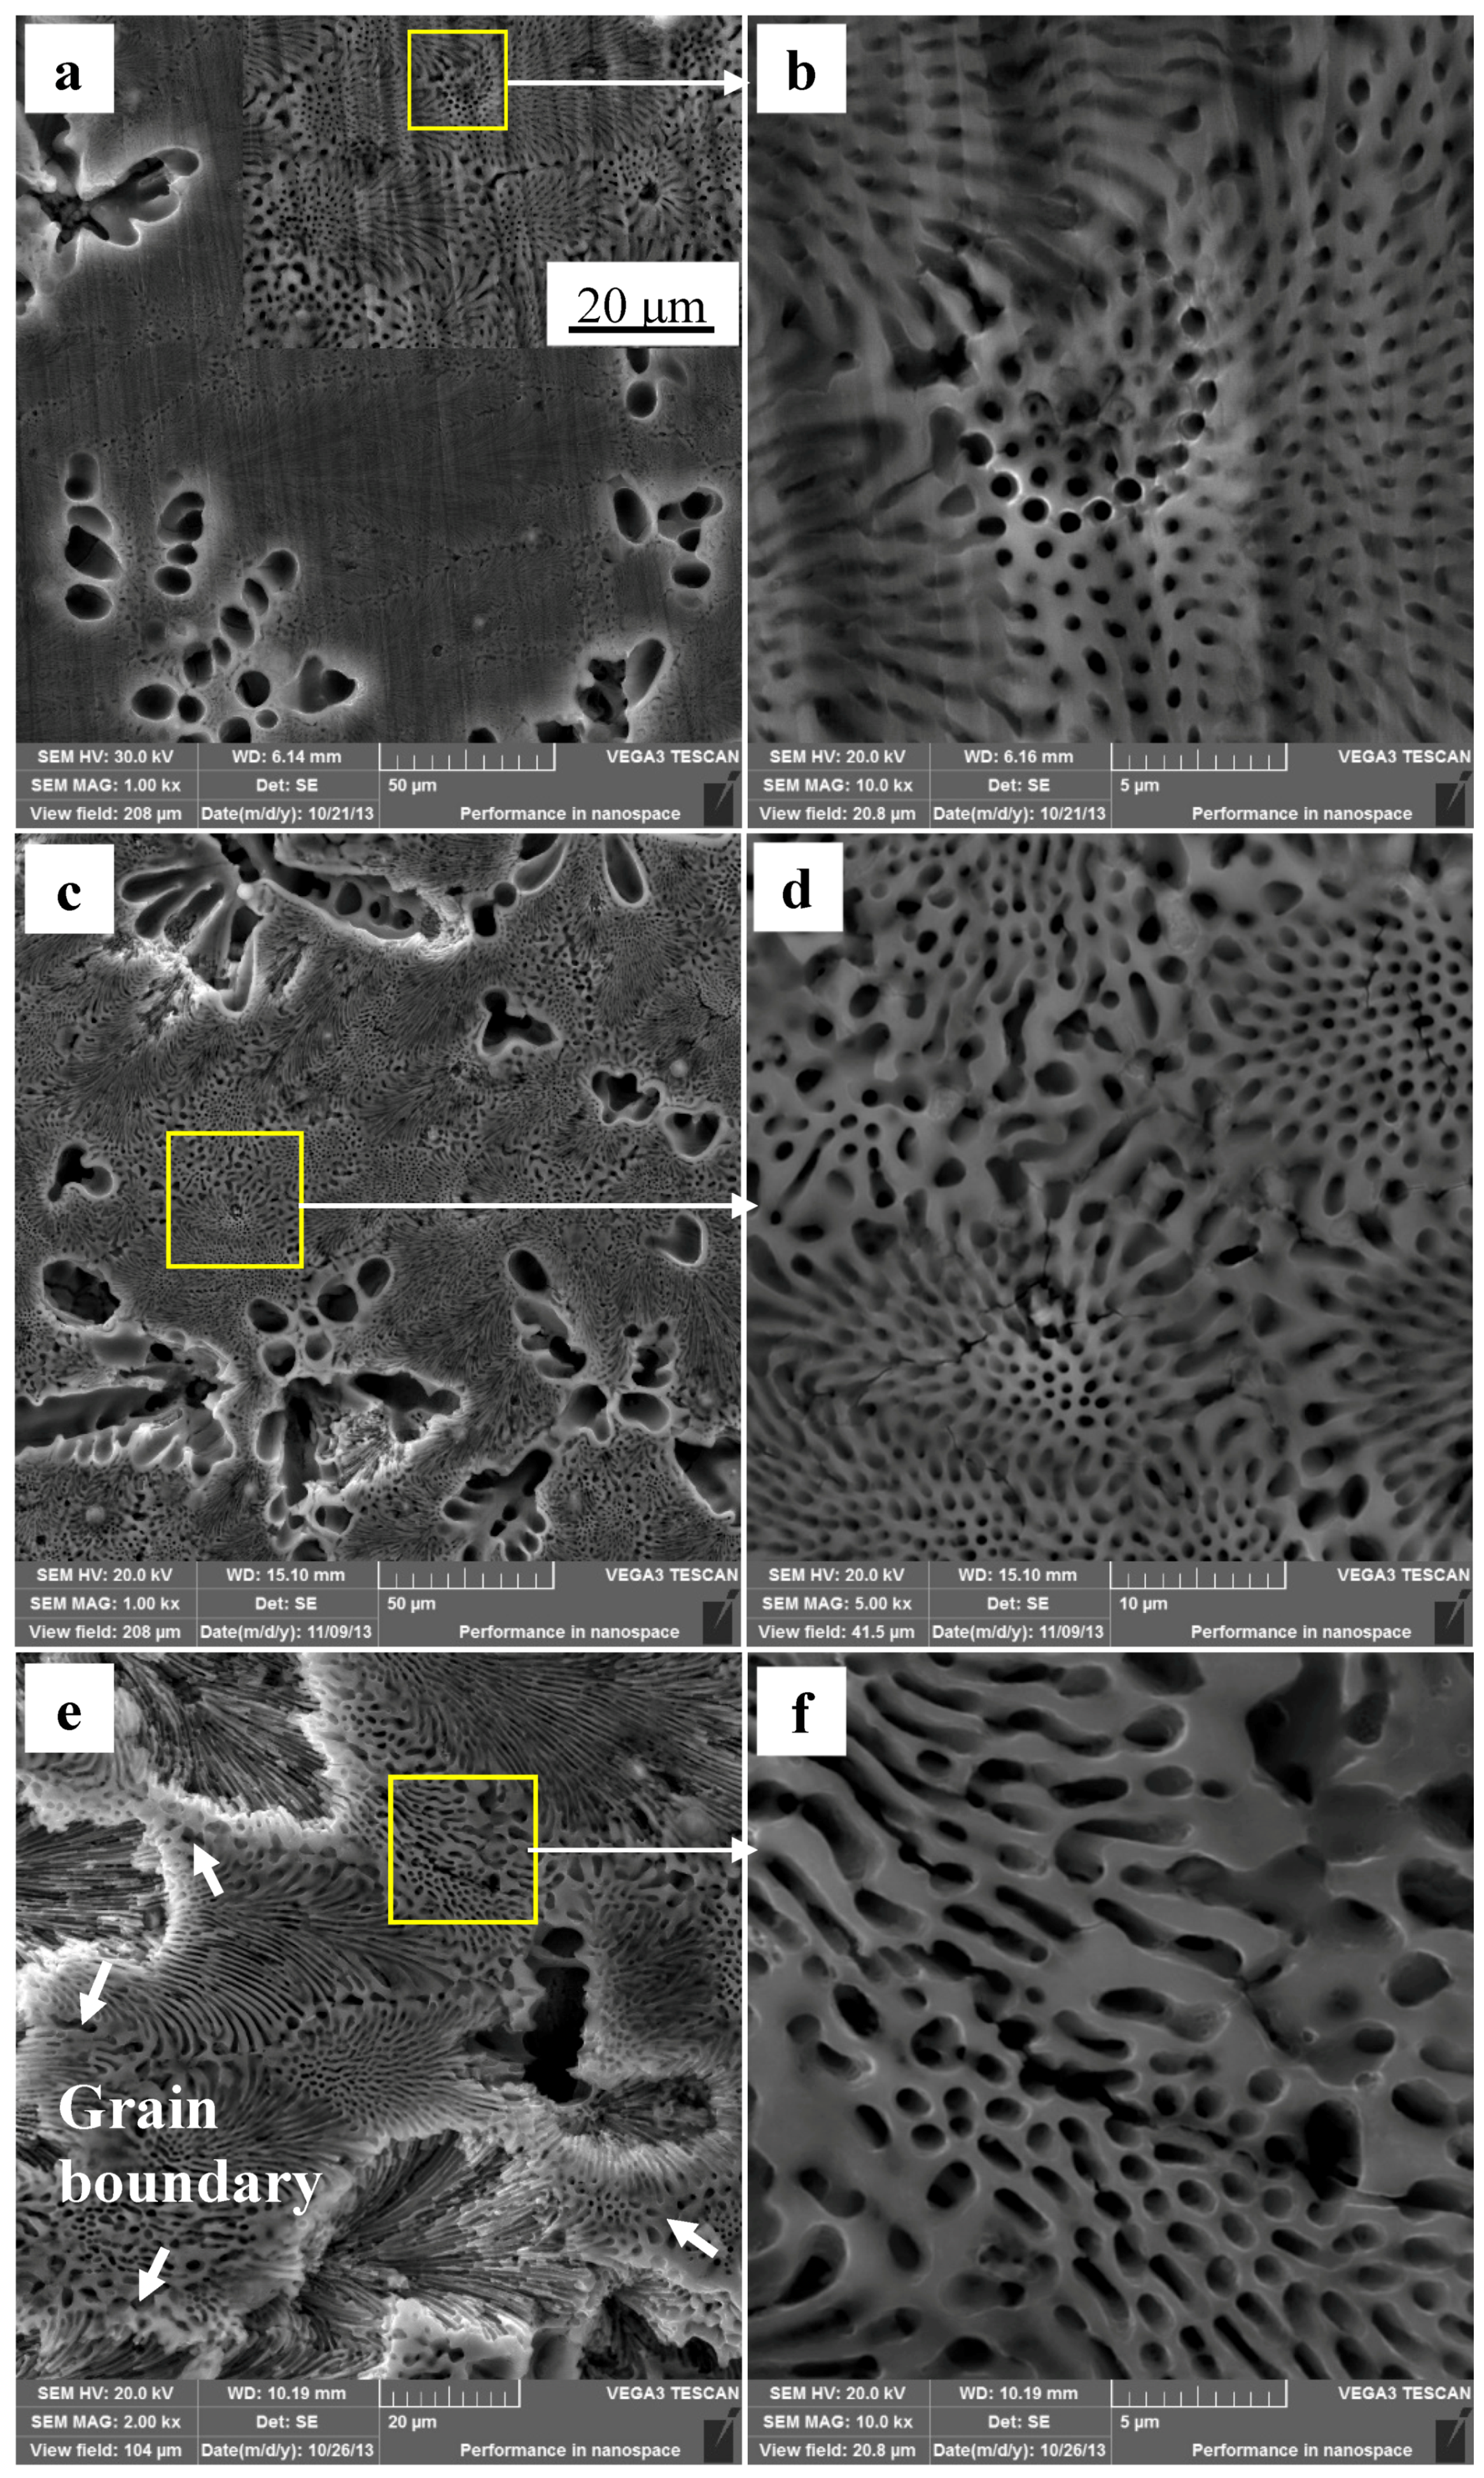
Figure 7 shows the Mg–Al alloy’s surface morphologies after immersion in HAc solution. It is rather obvious that the corrosion behavior of the Mg–Al specimen in these two acid solutions is very different. The α-Mg dendrites are corroded completely, and the bottoms and borders of the pits are rather smooth after the specimen has been immersed for 30 min (Figure 7a). However, only part of the α-Mg phase of eutectic disappears (Figure 7b). Figure 7c shows the corrosion morphology of a specimen immersed for 60 min. It is found that the eutectic regions of the alloy surface are still smooth, as was the inner wall of the pit at the site of the original α-Mg dendrite (Figure 7d). The enlarged local image in Figure 7c shows that the α-Mg phase in the eutectic is almost entirely corroded (Figure 7d). Some feather-like eutectics peel off from the matrix when the corrosion time is prolonged to 90 min (Figure 7e), which results in the formation of corrosion pits. The borders of these pits are very near to the grain boundary, which is the shallowest corrosion site for a fixed pit. Moreover, the pit center has the deepest corrosion depth. By comparison, the point-like eutectics have not peeled off from the matrix, although a few cracks have formed in them (Figure 7f).
3.5. Cross-Sectional Morphology
The Mg–Al alloy’s cross-sectional morphologies are gained after immersion for various times in H2SO4 solution (Figure 8). On the specimen surface, there are some randomly distributed deep pits instead of a smooth surface (Figure 8a). The α-Mg phases in these pits are not corroded completely. On the uncorroded α-Mg dendrite surface, an incomplete film is formed during the immersion test (Figure 8b), the same results shown in Figure 6b. A porous layer about 3 μm thick is left in some areas after the immersion test. After corrosion for 60 min, a similar specimen surface morphology is observed (Figure 8c), and the character of the α-Mg dendrite corrosion also resembles this (Figure 8b). The EDS results illustrate the corrosion films formed had high Al and O contents, which might imply that these films are mainly composed of Al-rich oxides (Figure 8d). Moreover, a porous layer may be also present, with a thickness of 3 μm. After immersing for 90 min, the specimens’ cross-sectional morphologies are obtained and shown in Figure 8e,f. No porous layer is observed, which may be related to the periodic peeling off of these layers during immersion.
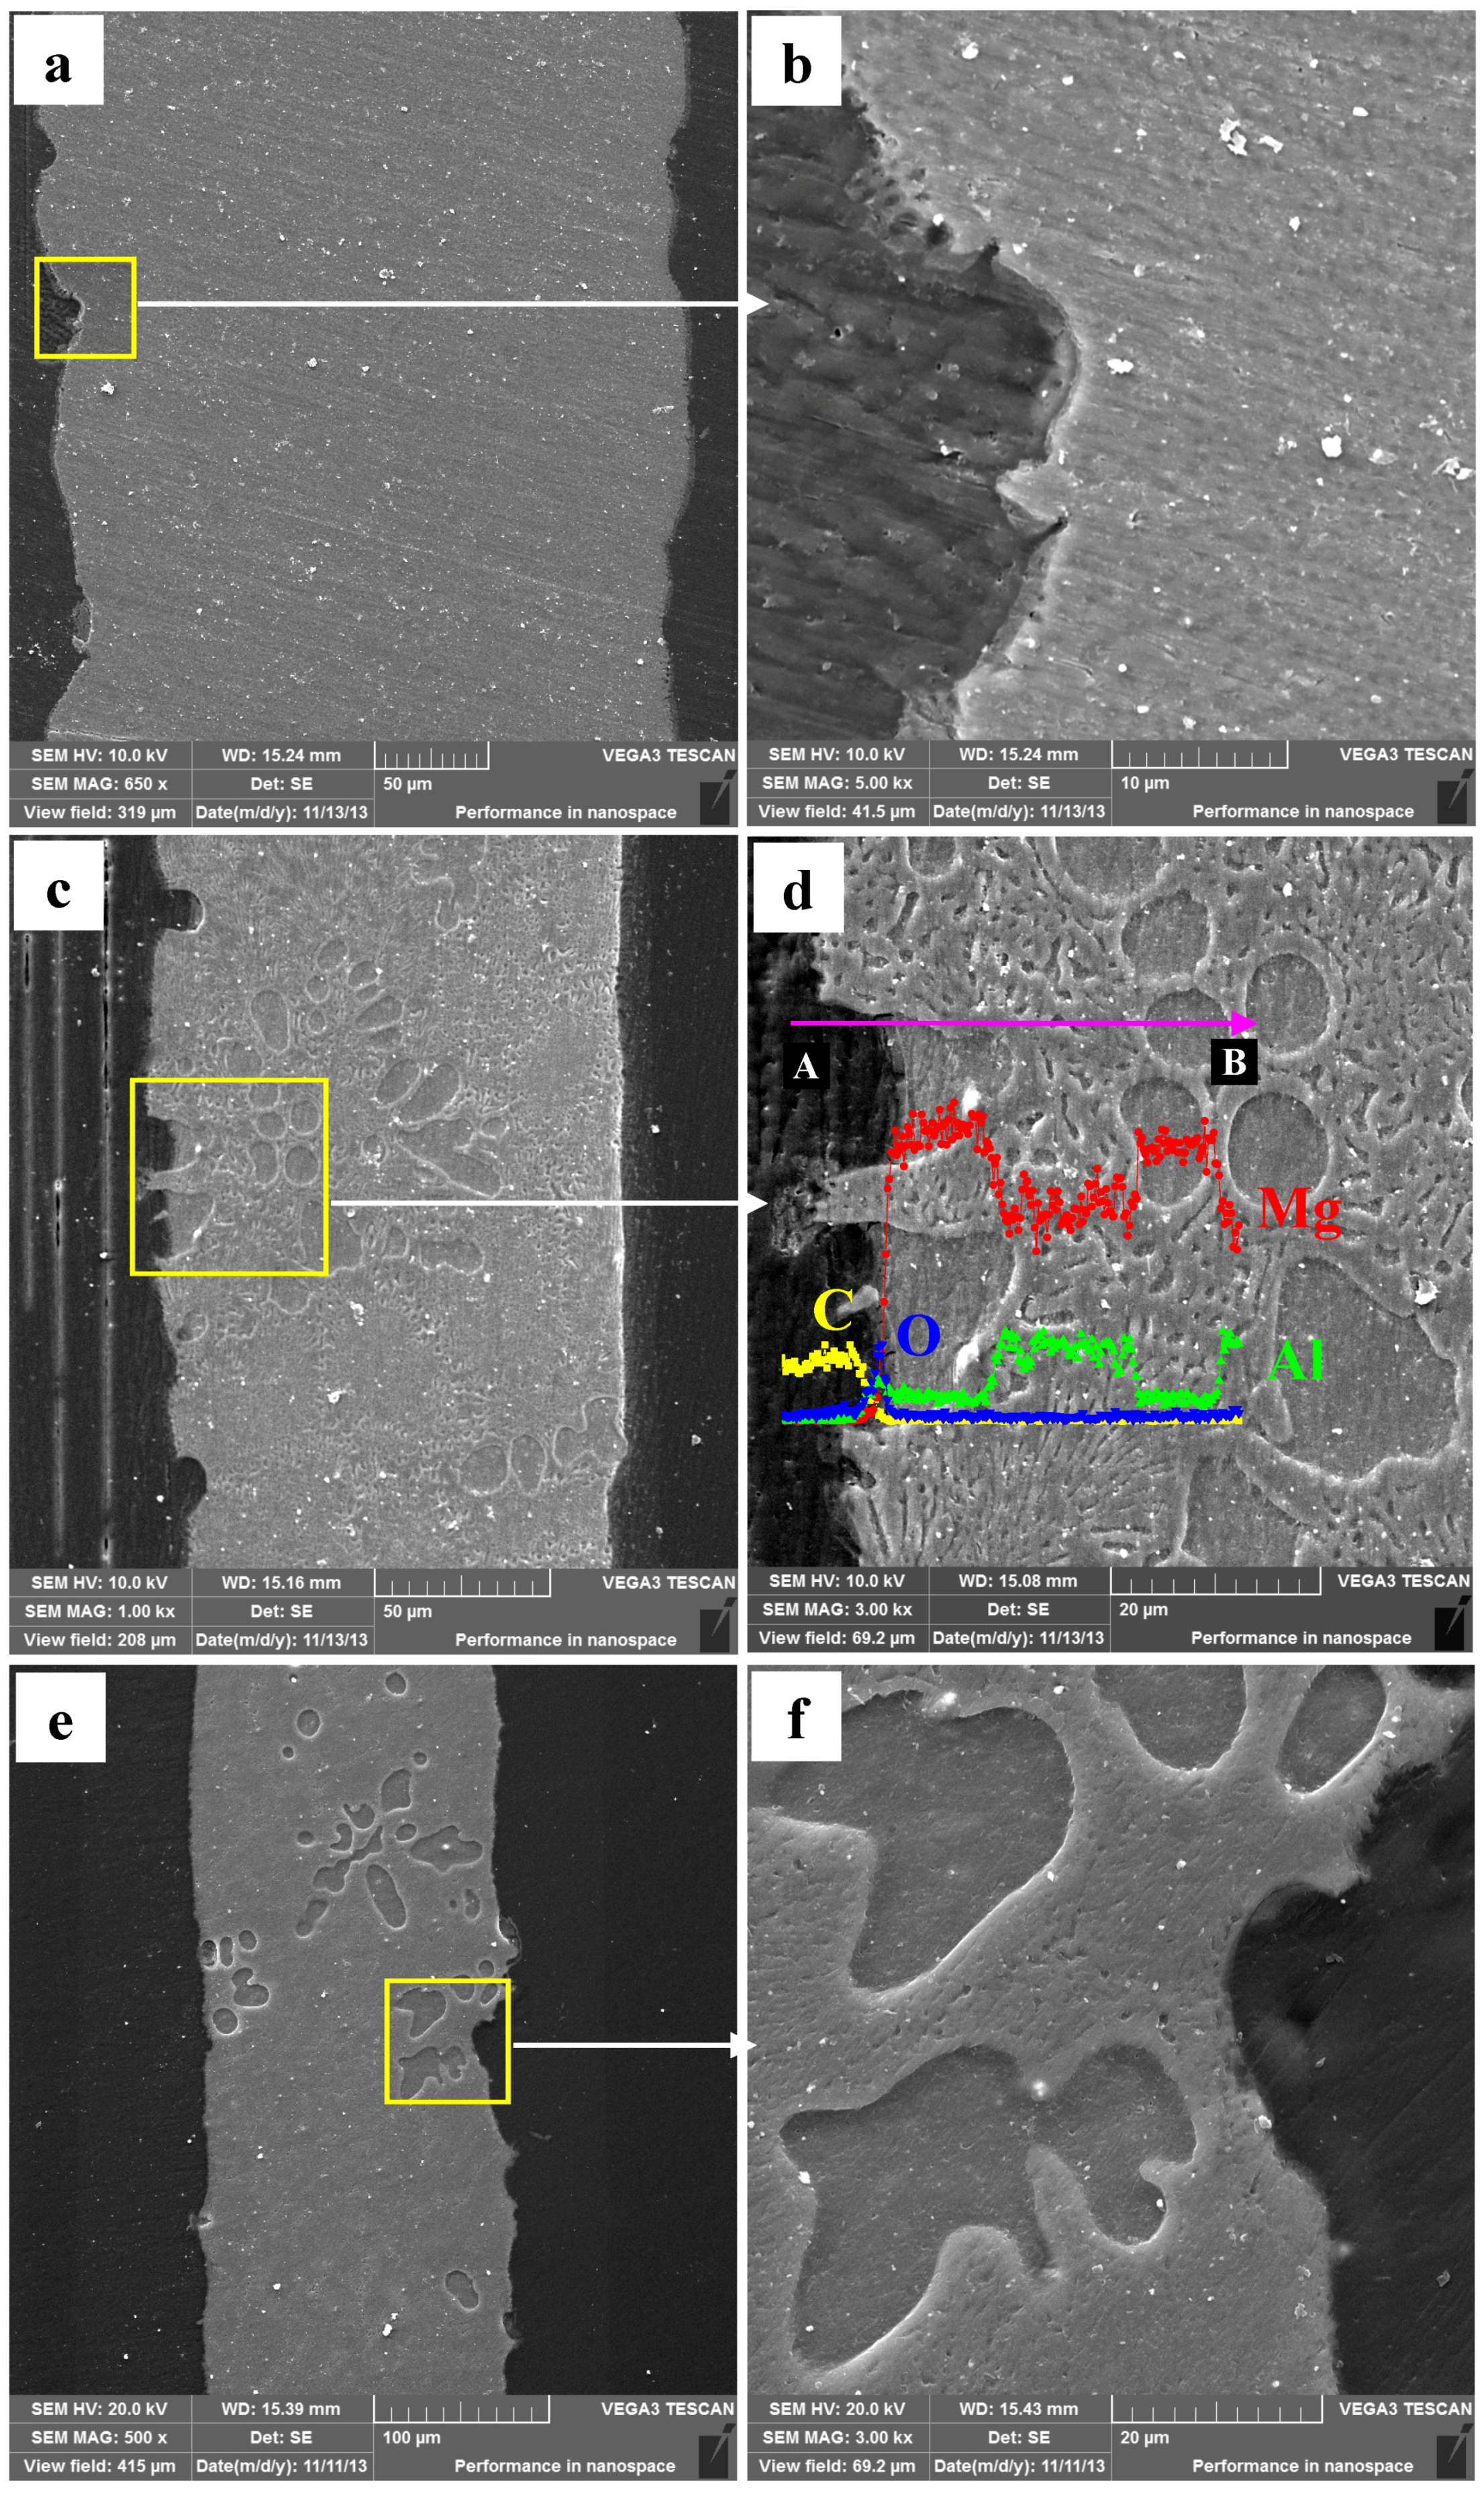
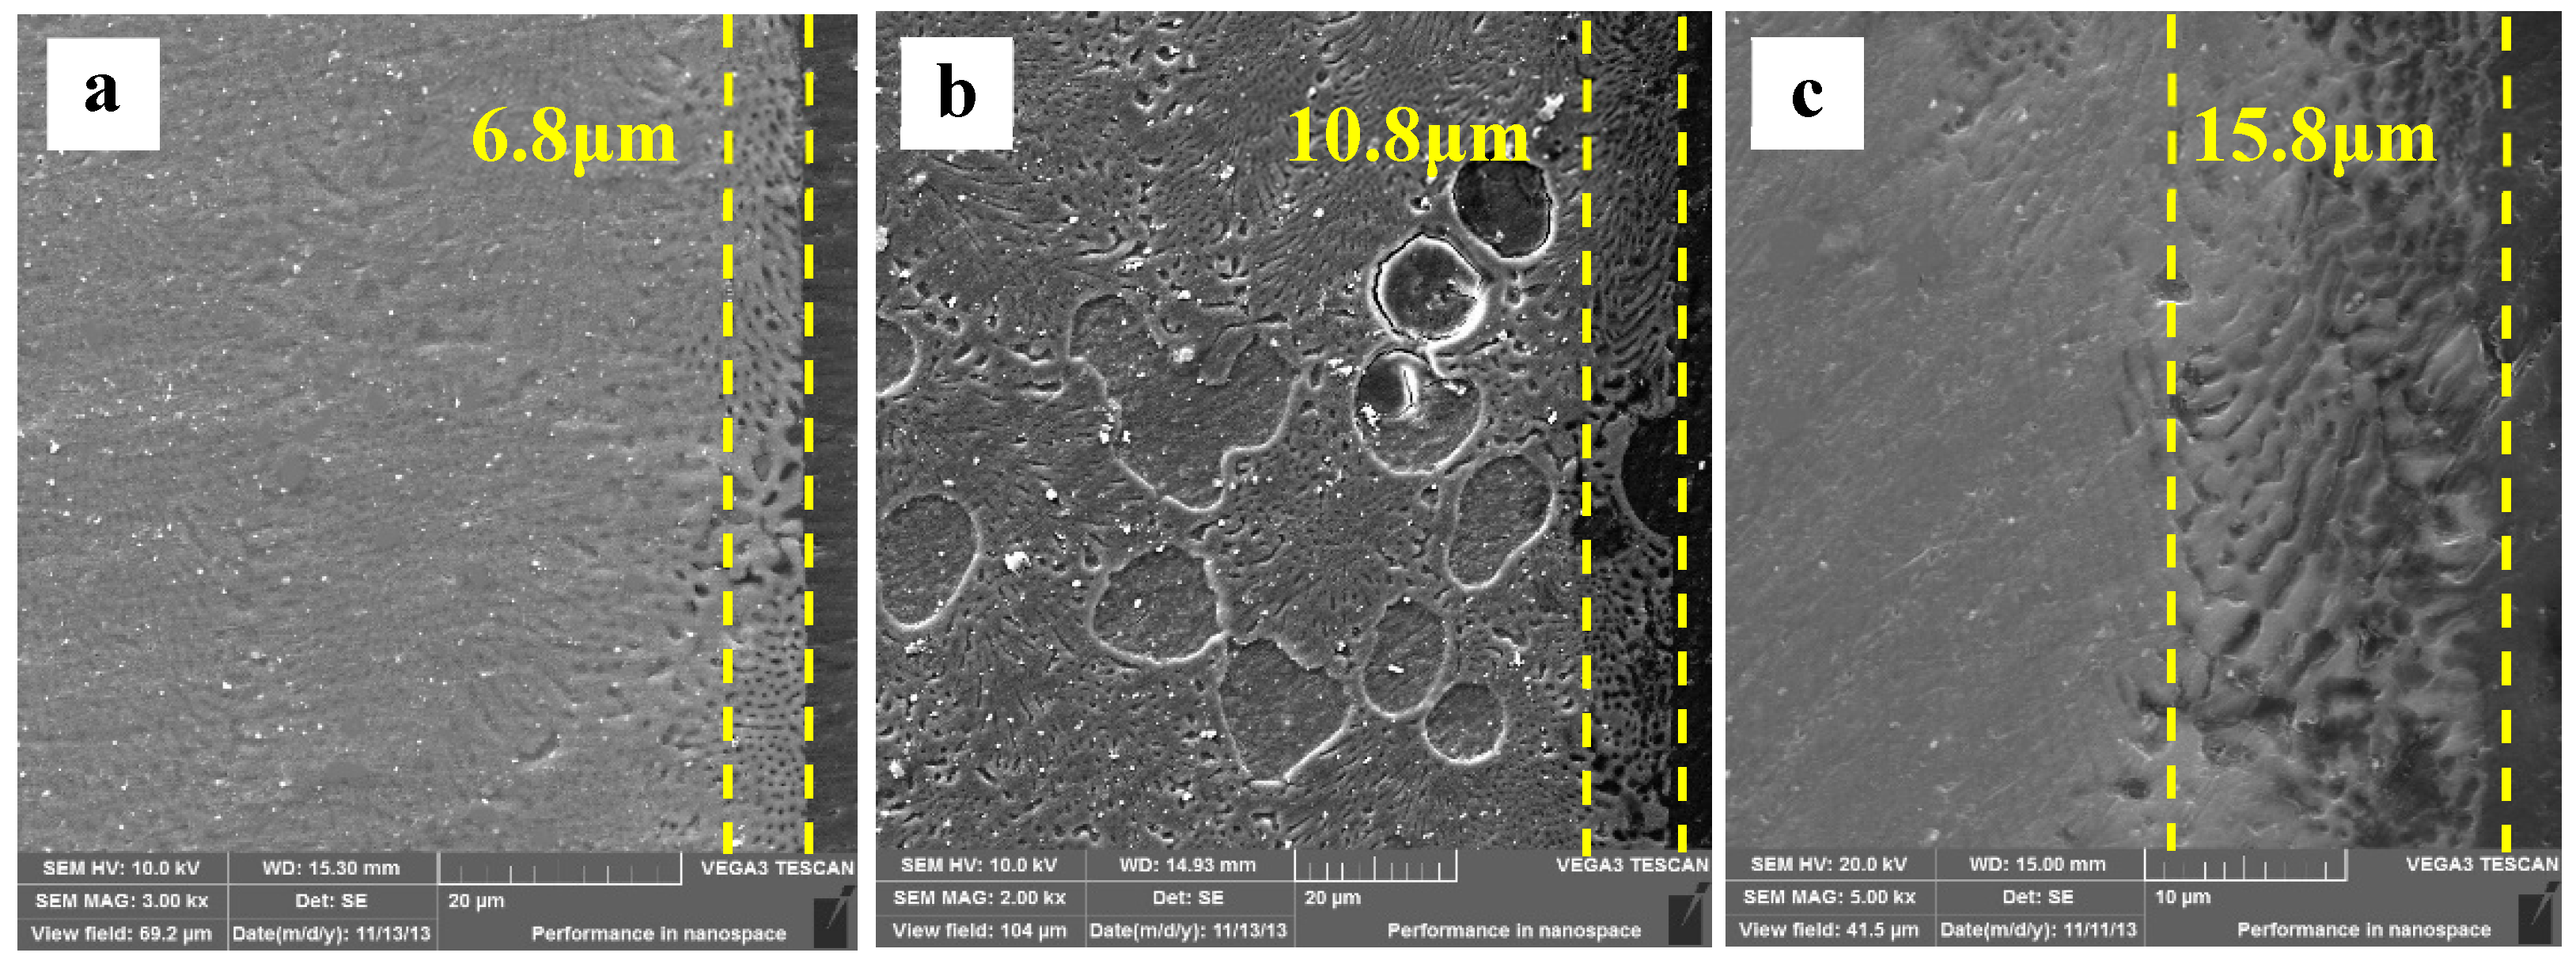
After immersing specimens in HAc solution for 30 min, the cross-sectional morphologies are characterized (Figure 9a). There are obvious differences in cross-sectional morphology between Figure 9a and Figure 8. First, the specimen surface remains smooth, is slightly corroded, and is not like the uneven one shown in Figure 9a. Second, the enlarged detail shows that the α-Mg dendrites as well as the α-Mg phase of the eutectics are both corroded, with only the Mg17Al12 framework left. The results show that the corroded depth, measured by line scanning, is extended about 6.8 μm to the deeper matrix. The Mg content in the corroded layer increases from the surface to the interior of the specimen, which indicates that the α-Mg phase in the eutectics is not corroded completely throughout the layer. In other words, the degree of de-alloying is not complete in the 6.8 μm thick layer. With the immersion time prolonged to 60 min, the specimen surface is still smooth. The corroded depth is increased to 10.8 μm (Figure 9b). Some deeper pits form at the original α-Mg dendrite sites owing to their poor corrosion resistance. The maximum depth of these pits reaches 40 μm, which can be demonstrated by the resin in these pits. With the immersion time increased to 90 min, the corrosion depth is up to 15.8 μm (Figure 9c), approximately 10 μm of which is a completely de-alloyed layer. Overall, the corroded depth at the sites of the α-Mg dendrites is deeper than that in the eutectic regions. During immersion testing, the original Mg17Al12 framework is preserved, which suggests that the Mg–Al alloy is corroded in a selective form in HAc solution.
3.6. Corrosion Behavior of SP Mg17Al12 and Mg–Al Alloy
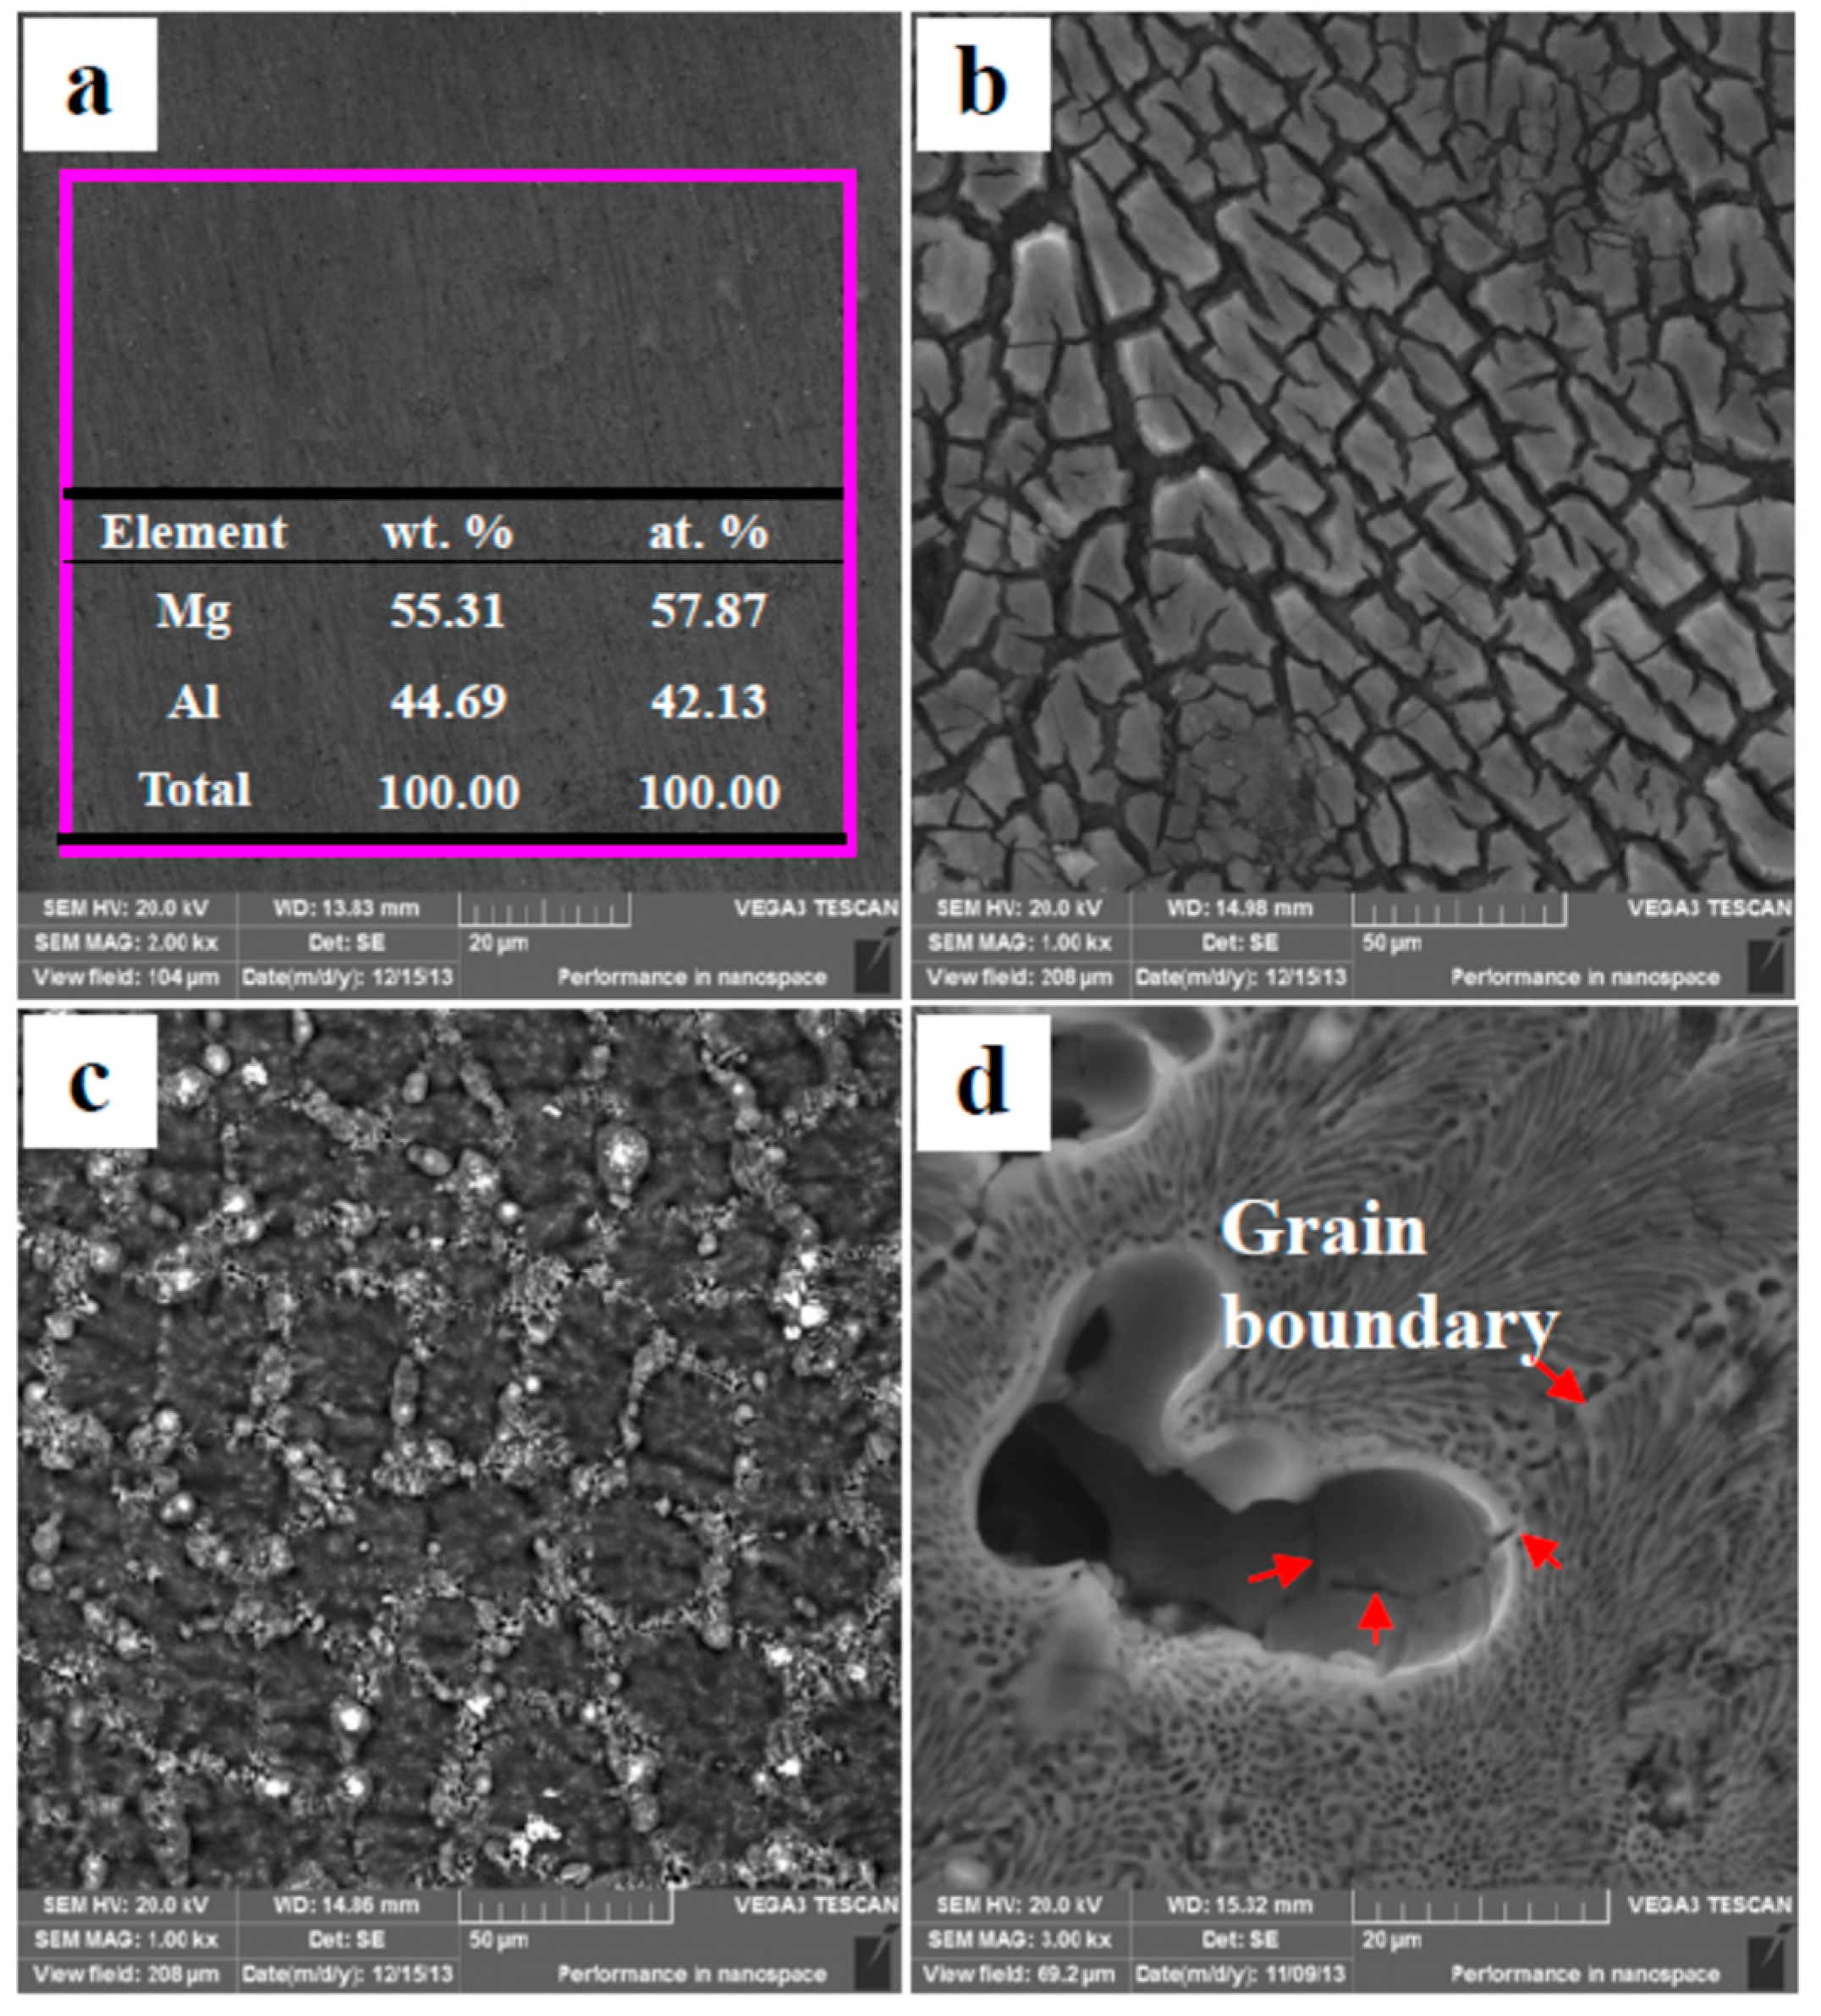
There are two phases in the Mg–Al alloy, α-Mg and Mg17Al12. The β-Mg17Al12 is a cathode phase in microstructure, so the corrosion behavior of the whole specimen is significant affected by the α-Mg. The original morphology of cast Mg17Al12 is shown in Figure 10a. The EDS results are consistent with the ideal composition of the Mg17Al12. After immersion for 90 min in H2SO4 solution, many cracks occur on the Mg17Al12 specimen surface, and some fragments detach from the matrix (Figure 10b), which illustrates that the SP Mg17Al12 do not have sufficient resistance to corrosion in H2SO4 solution. Despite that the β-Mg17Al12 phase has a relative high Al content and an Al-rich film forms on the specimen surface, these advantages cannot hinder corrosion. Al2O3 is an amphoteric oxide and is not stable in H2SO4 solution. When the Mg–Al alloy is immersed in H2SO4 solution, Al-rich films also form on the α-Mg dendrite surfaces (Figure 8d). As a result, a corrosion attack occurs at nearly the same time over the whole specimen surface (Figure 8), although the two phases in the alloy show a great difference in corrosion potential. The corrosion occurs in the α-Mg dendrites only a little earlier than that in the β-Mg17Al12 phases (Figure 8c,d).
The corrosion morphologies of the SP Mg17Al12 inHAc solution are shown in Figure 10c. No fragments peel off from the matrix, which illustrates that the Mg17Al12 has higher anti-corrosion ability in HAc solution. Meanwhile, the large corrosion potential difference between two phases leads to the β-Mg17Al12 phase acting as an effective cathode in a corrosive environment. Thus, the α-Mg phase is corroded first in the HAc solution. In the Mg–Al alloy, the eutectics exhibit better corrosion resistance than the α-Mg dendrites, which will be corroded preferentially (Figure 7). The Mg–Al alloy’s corrosion morphology is obtained from HAc solution after immersion for 30 min and is shown in Figure 10d. The grain boundary can be seen clearly, which indicates that the α-Mg dendrites are eaten away completely, although the α-Mg phase in the eutectic is not, as also is shown in Figure 7b. In the eutectic microstructures, the network β-Mg17Al12 phase mainly plays a positive role in corrosion resistance, similar to the experiment results gained by using die-cast AZ91 Mg alloy [41,42]. Thus, the eutectics have higher ability of anti-corrosion than the α-Mg dendrites. The results also show the α-Mg phase in the eutectics is corroded more slowly.
The data in Table 2 show that Mg17Al12 and SS AZ91D alloys have nearly the same value in icorr when they were immersed in H2SO4 solution. However, Mg17Al12 has a larger value than SS AZ91D alloy in HAc solution. The results above indicate that Mg17Al12 and SS AZ91D alloys have nearly the same corrosion resistance in H2SO4 solution. By contrast, Mg17Al12 has higher anti-corrosion ability than SS AZ91D in HAc solution. Therefore, the selective corrosion can occur in HAc solution, but cannot occur in H2SO4 solution for Mg–Al alloy (Figure 7 and Figure 8).
4. Discussion
4.1. Corrosion Characters Analysis
The Mg–Al alloy’s average corrosion rate in H2SO4 solution for 30 min is higher than that of the alloy immersed for 60 or 90 min (Figure 4). Of these specimens, the one that is corroded for 60 min has the lowest average corrosion rate. The weight loss data (Figure 3) show that the weight loss of the specimens is 44.9 mg·cm−2 after corrosion for 90 min. During this corrosion process, each corrosion period contributes 36.6%, 9.4%, and 54% of the total weight loss in the time ranges 0–30 min, 30–60 min, and 60–90 min, respectively. According to results, Mg–Al alloy’s hydrogen evolution volume is 17.2 mL·cm−2 in H2SO4 solution for 90 min (Figure 5). The hydrogen evolution volume for the respective 30 min corrosion time periods account for 39.3%, 30.8%, and 29.9% of the total value. At the beginning of the 30 min, the hydrogen evolution volume and weight loss per unit area account for nearly the same proportion of their corresponding total values for 90 min. When the corrosion time is longer than 30 min, the proportion of hydrogen evolution relative to the total value for a specimen immersed for 90 min in each time range, 30–60 min and 60–90 min, is obviously different from the relative proportion of weight loss, because of the periodic peeling off from the sample surface layer in the H2SO4 solution. Before the surface layer peels off, the hydrogen evolution volume of the samples increased continuously, with a lower weight loss. When the surface layer peels off, the weight loss increases suddenly. However, the fragment is also corroded, producing hydrogen. Thus, the hydrogen evolution volume increases steadily, although the weight loss shows an obvious fluctuation.
The changes in corrosion rate are different in these two solutions. The weight loss of the specimen is 2.3 mg·cm−2 after immersion for 90 min. During the immersion testing, for the three time ranges 0–30 min, 30–60 min, and 60–90 min, the weight loss account for 47%, 21%, and 32%, respectively, of the total value, and the hydrogen evolution volume account for 52%, 27%, and 21%, respectively, of the total value. The cross-sectional morphologies shown in Figure 9a–c indicate that the specimen is corroded in a selective form in HAc solution. The α-Mg phase is corroded preferentially, leaving a porous Mg17Al12 framework. The EDS results show the total thickness of the corroded layer is about 15.8 μm after immersion for 90 min. The thicknesses of the corroded layer are 6.8 and 10.8 μm after immersion for 30 and 60 min, respectively. Thus, the corrosion depth in each time range accounts for 43%, 25%, and 32% of the total value, which is basically consistent with the ways in which the weight loss and hydrogen evolution volume change. After immersion for 30 min in HAc solution, the specimen’s corrosion rate slows down, which may be due to the following reasons. First, the H+ concentration at the corrosion interface decreases as the corrosion proceeds. Second, the contact area is reduced between the corrosive solution and the α-Mg phase, which has a poor corrosion resistance. The porous surface layer hinders the corrosive ion exchange. The α-Mg dendrites are corroded rapidly and completely in the first 30 min. All of these factors result in a slower corrosion rate in the following corrosion process.
4.2. Grain Orientation’s Role in Corrosion Process
In this section, ‘grain orientation’ means the growth direction of α-Mg and β-Mg17Al12 in eutectic.
Figure 8 shows the corrosion rate of α-Mg dendrites is higher than that of the eutectic microstructures. The eutectics peel off in 3 μm thicknesses from the specimen surface to its center. During the immersion test, Al-rich films would be formed on the α-Mg dendrite surface, which was also found by Pardo et al. [26,27]. However, this film is not sufficiently dense (Figure 6b,d) and cannot effectively prevent corrosion. Even if the film is dense enough, it will not be able to inhibit corrosion yet, because of the amphoteric nature of the oxide Al2O3, which is unstable in dilute H2SO4 solution. The Al-rich films can easily be observed as a result of the α-Mg phase being corroded preferentially, with the remaining Al atoms being deposited from solution on the α-Mg phase surface. This process may be similar to the re-deposition of atoms during de-alloying [43,44]. In this study, the Al content of the α-Mg dendrites is nearly as high as the Al atom’s solid-solution limit in the Mg matrix, which may lead to Al atoms being readily deposited on the alloy surface and then corroded to form oxide. During the corrosion test, cracks formed in the β-Mg17Al12 phase of the eutectic. Despite the good corrosion resistance of the eutectic, cracks may result in a layer peeling off from the specimen surface. In summary, the Mg–Al alloy’s α-Mg dendrites are corroded preferentially in H2SO4 solution, followed by the eutectic. The macro-morphology shows the general corrosion and the approximately uniform thinning of the sample thickness. The grain orientation has little effect on Mg–Al alloy’s corrosion behavior in H2SO4 solution.
There is a significant difference in corrosion behavior in two solutions. Specifically, the α-Mg phase is corroded, but the β-Mg17Al12 phase is hardly affected. The Mg–Al alloy is corroded selectively in HAc solution. The cross-sectional morphology in Figure 9 shows that the specimen thickness remains nearly unchanged after the immersion test. Moreover, the β-Mg17Al12 phase is left and only some of the feather-like eutectic peels off from the specimen surface after corrosion for 90 min (Figure 7). These two results are the best evidence of the occurrence of selective corrosion.
From the original microstructure, it can be seen that the diameter or width of the α-Mg phase of the eutectic is about 0.5 μm and its length is about 5 μm at least, although generally this value will be in the range 10–20 μm. Thus, the α-Mg phase in the eutectic can be considered as consisting of submicron rods instead of submicron balls. The thickness of the de-alloyed layer reaches 15.8 μm, with that of the completely de-alloyed layer being about 10 μm. At this time, some of the feather-like eutectics peel off from the specimen surface, with this phenomenon occurring over nearly the whole grain. This behavior can be explained as follows. The diameter of α-Mg rods is much less than the de-alloyed layer thickness, which is nearly equal to the length of the rods and the grain size in the eutectic areas. In this situation, when the grain orientation is almost the same as the specimen surface (forming feather-like eutectics), and when the α-Mg phase is corroded completely, the Mg17Al12 phase finally loses support from its surrounding α-Mg phase and peels off from the matrix. Corrosion pits 5–10 μm deep are then formed in the eutectic areas. These corrosion pits occur because the growth orientation of the corresponding eutectic is parallel to the specimen surface, and the presence of a shallow pit can then lead to some discontinuous β phases peeling off. In contrast, when the grain grows along the direction that is normal to the sample surface, the α-Mg will not be corroded completely, because of the lower de-alloyed layer thickness. Thus, the β phases of the point-like eutectics are still well preserved. The point-like eutectic and feather-like eutectic in the specimen surface thus show different corrosion and peel-off behavior due to the differences in their grain orientation.
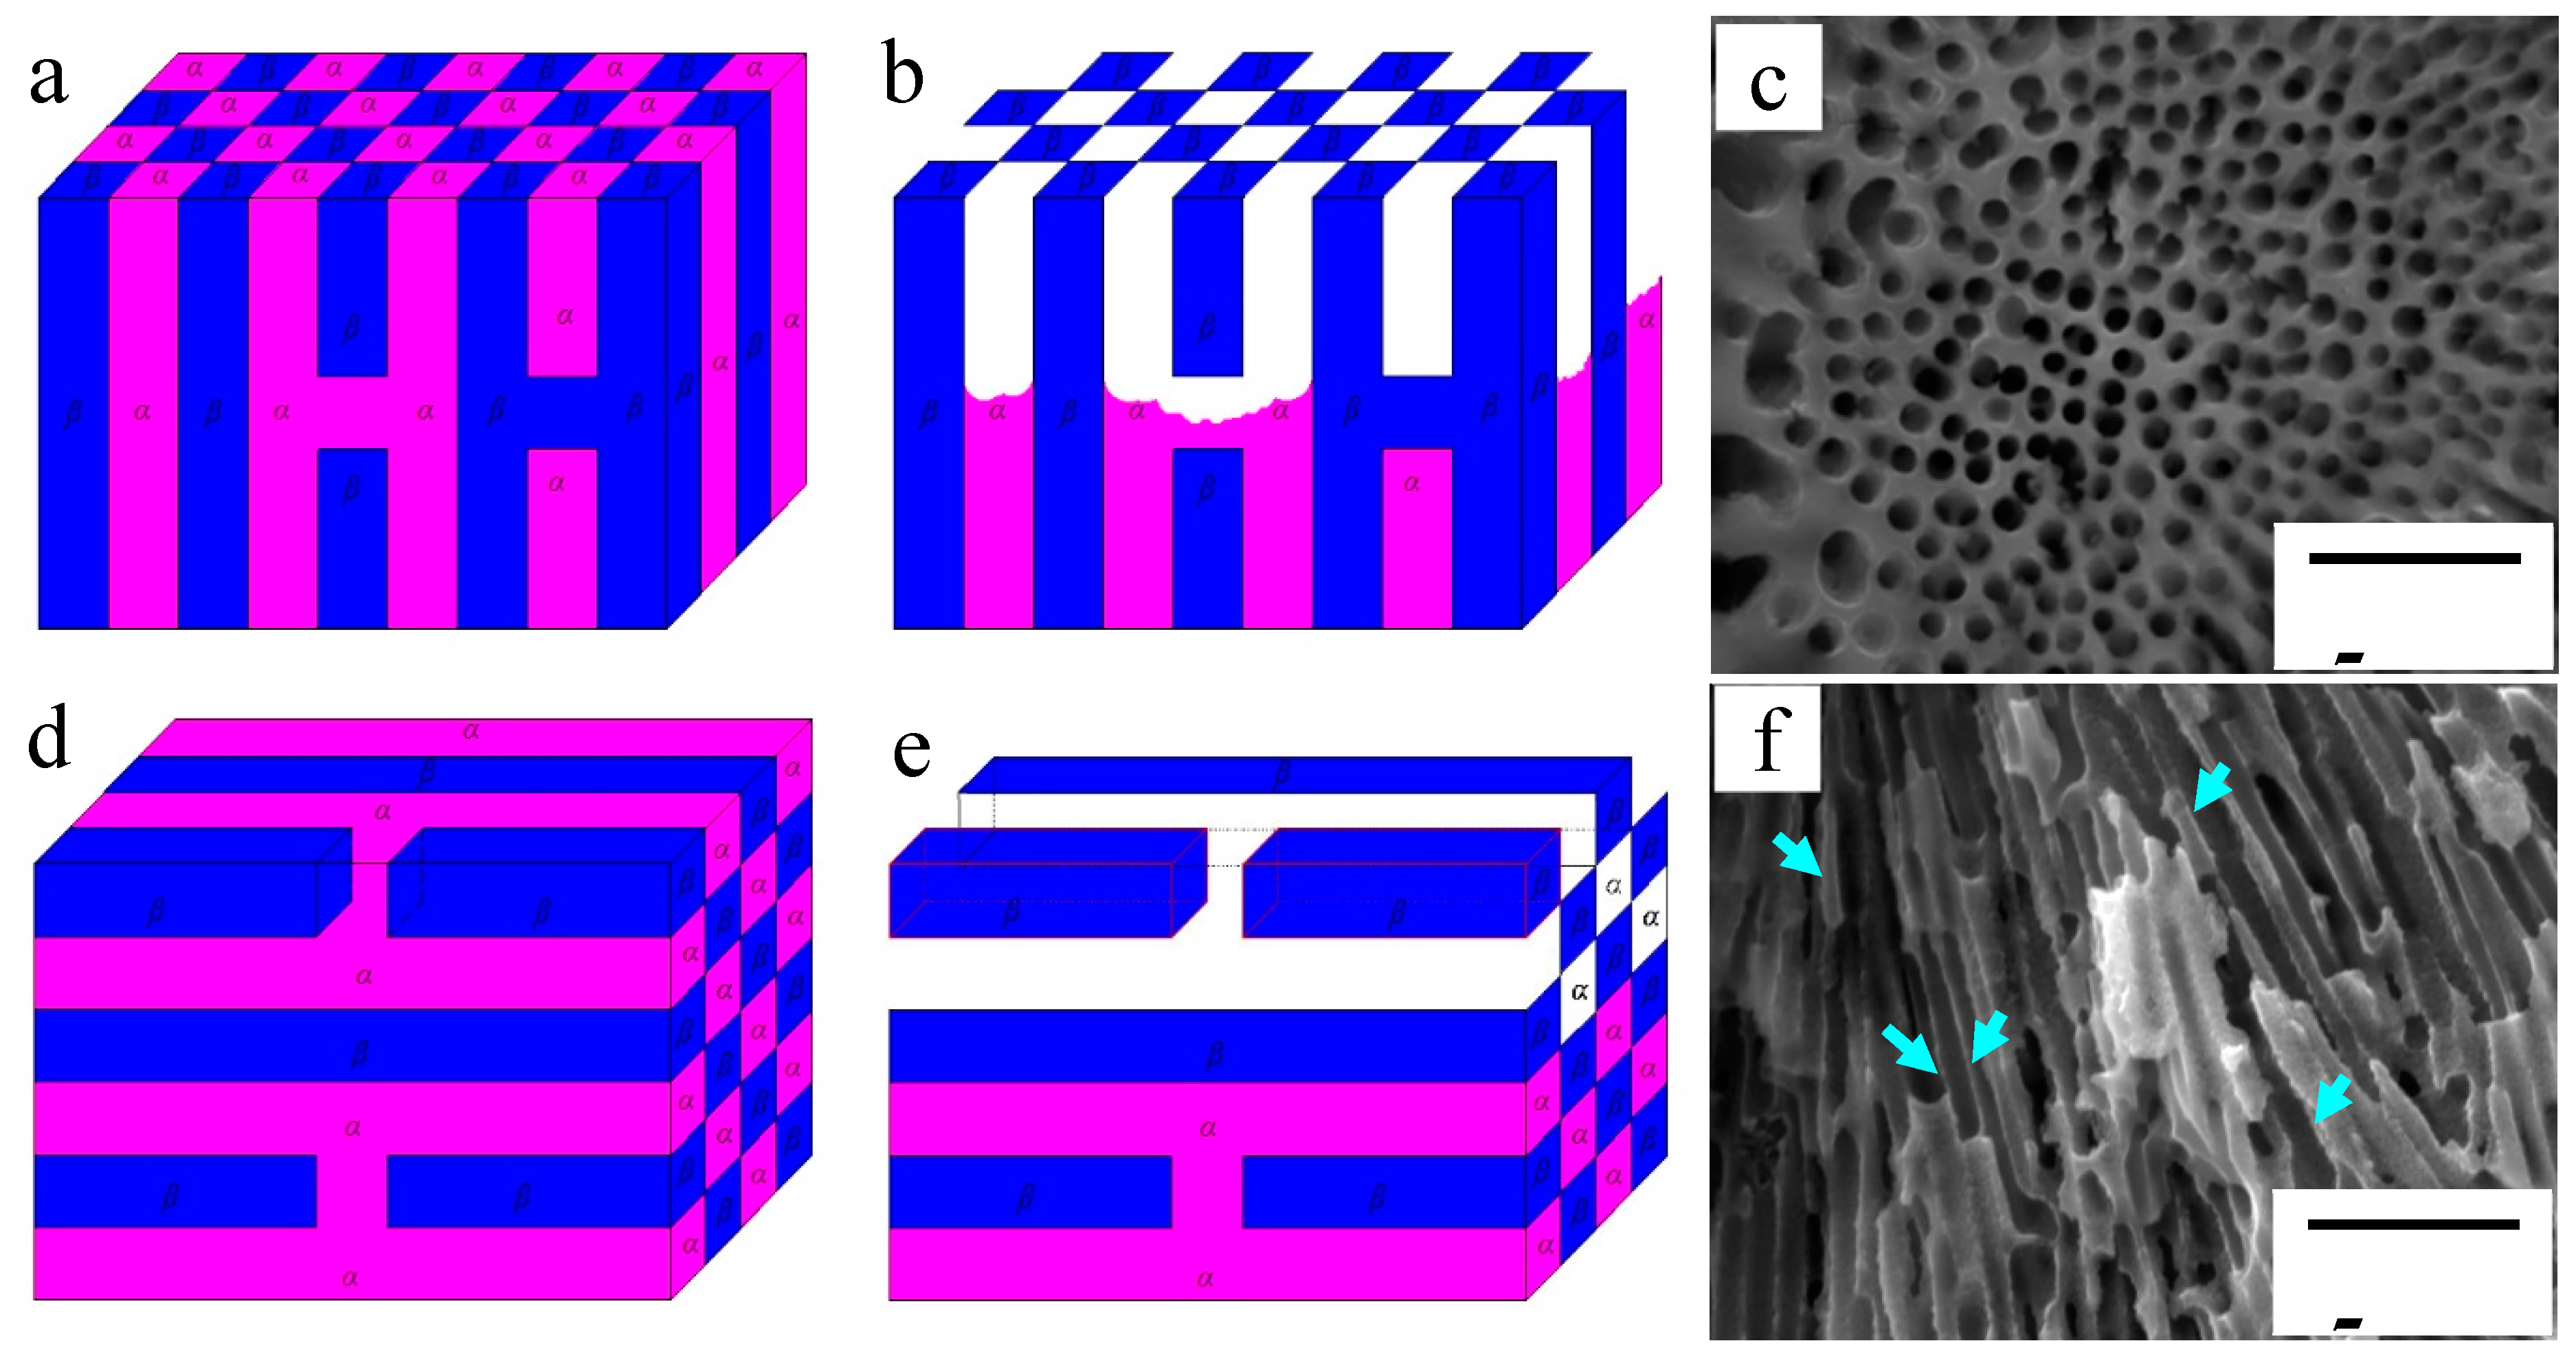
According to the above analysis, these two kinds of eutectics on the specimen surface can be simplified as shown in Figure 11. Schematic diagrams of point-like eutectic before and after corrosion are shown in Figure 11a,b. The porous β-Mg17Al12 phases are left after immersion for 90 min as shown in Figure 11c, which is the real specimen surface morphology. Figure 11d is a schematic diagram of feather-like eutectic before immersion. The α-Mg near the surface is also corroded because of the presence of discontinuous β-Mg17Al12 phases. Then, the β-Mg17Al12 phases in the upper most surface are separated from matrix, with only some sites remaining weakly connect to the matrix (Figure 11e). Although HAc has a smaller corrosive effect on the β phase than on α-Mg, the β phase can be easily detached from the matrix. The real surface morphology of the feather-like eutectic is shown in Figure 11f. After the corrosion test, the β-phase walls are very thin, as indicated by the arrows, which is consistent with Figure 11e. Thus, the immersion tests illustrate the deduction from Figure 1 that the difference in morphologies of the eutectics results from the different grain orientations. In other words, the round-like α-Mg phase of the point-like eutectics is only an outcrop of submicron α-Mg rods on the specimen surface.
4.3. Corrosion Behavior Analysis
General corrosion character is observed on Mg–Al alloy’s surface in H2SO4 solution. Microanalysis results show that the α-Mg dendrites are corroded faster than the β phase, and Al-rich films will form on the surface of the former at the same time. Because of its poor corrosion resistance, the β phase begins to corrode before the α-Mg dendrites are eaten up. The formed porous Mg17Al12 on the specimen surface will peel off layer by layer, with each layer having a thickness of 3 μm. As a result, the corrosion rates of the specimens are very high in H2SO4 solution. Investigations by Zhang et al. [45] and Atrens et al. [46] show that MgH2 will be formed on the Mg alloy’s surface and intermetallics phase’s surface, with this occurring more easily on the latter, when they are immersed in a corrosive solution [47]. Hydrogenation of Mg alloys or Mg/Al intermetallics can accelerate their powdering [48], which may be the basic reason thatthe Mg–Al alloy peels off very rapidly, starting from specimen surface, in H2SO4 solution. By contrast, the specimens have a low corrosion rate in HAc solution, and no layered peeling can be observed during the tests.
In HAc solution, the Mg–Al alloy’s corrosion process can be divided into three steps. In the first step, the α-Mg dendrites are corroded preferentially due to the great corrosion potential difference existing in α-Mg and β-phases, and the better corrosion resistance of the β-phase in HAc solution. In the second step, the corrosion spread to the α-Mg phases of the eutectics. In the third step, with the spread of corrosion, the α-Mg phase in β phasesurrounding is eaten up, and the feather-like eutectic then begins to peel off from the matrix, resulting in the formation of a large corrosion pit.
In summary, the corrosion potential difference is smaller between α-Mg and β phase in HAc solution than that in H2SO4 solution (Figure 2). In HAc solution, Figure 10 shows the SP Mg17Al12 has a higher anti-corrosion ability than it in H2SO4 solution. Thus, the corrosion potential difference is not the only prerequisite for the occurrence of a selective corrosion. Based on the above analysis, in HAc solution, the selective corrosion characteristic is observed in Mg–Al alloy, which possibly results from the following two reasons. (i) Two-phase (α-Mg and β-phase) corrosion potential difference is great enough. (ii) The noble phase, β-Mg17Al12 phase, has a good corrosion resistance in the de-alloying electrolyte.
5. Conclusions
A Mg–Al alloy was fabricated in this investigation and composed of α-Mg dendrites and eutectics. Immersion tests show that the Mg–Al alloy’s corrosion behavior in H2SO4 solution is considerably different from that in HAc solution.
- (1)
- The general corrosion character is observed in Mg–Al alloy in H2SO4 solution with a pH of 1.0. Conversely, the Mg–Al alloy is selectively corroded in HAc solution with a pH of 1.0.
- (2)
- In HAc solution, the Mg–Al alloy’s corrosion behavior is affected by the grain orientation. The point-like eutectics show a better resistance to peeling than the feather-like eutectics. In contrast, the similar corrosion character is not observed in H2SO4 solution.
- (3)
- In both H2SO4 and HAc solutions, the eutectics show a greater anti-corrosion ability than the α-Mg dendrites.
Author Contributions
Data curation, Y.W.; formal analysis, Y.W.; funding acquisition, Y.L.; investigation, S.Y.; methodology, Y.L. and S.Y.; writing—original draft, Y.L.
Funding
This research was funded by National Natural Science Foundation of China (No. 51705352) and China Postdoctoral Science Foundation (No. 2018M641682) for supporting this work.
Conflicts of Interest
The authors declare no conflict of interest.
References
- Cui, L.Y.; Liu, Z.Y.; Hu, P.; Shao, J.M.; Li, X.G.; Du, C.W.; Jiang, B. The corrosion behavior of AZ91D magnesium alloy in simulated haze aqueous solution. Materials 2018, 11, 970. [Google Scholar] [CrossRef] [PubMed]
- Chen, J.; Lan, X.N.; Wang, C.; Zhang, Q.Y. The formation mechanism and corrosion resistance of a composite phosphate conversion film on AM60 alloy. Materials 2018, 11, 402. [Google Scholar] [CrossRef] [PubMed]
- Asmussen, R.M.; Jakupi, P.; Danaie, M.; Botton, G.A.; Shoesmith, D.W. Tracking the corrosion of magnesium sand cast AM50 alloy in chloride environments. Corros. Sci. 2013, 75, 114–122. [Google Scholar] [CrossRef]
- Taltavull, C.; López, A.J.; Torres, B.; Rams, J. Dry sliding wear behaviour of laser surface melting treated AM60B magnesium alloy. Surf. Coat. Technol. 2013, 236, 368–379. [Google Scholar] [CrossRef]
- Lu, D.; Jiang, Y.; Zhou, R. Wear performance of nano-Al2O3 particles and CNTs reinforced magnesium matrix composites by friction stir processing. Wear 2013, 305, 286–290. [Google Scholar] [CrossRef]
- Falcon-Franco, L.; Bedolla-Becerril, E.; Lemus-Ruiz, J.; Gonzalez-Rodríguez, J.G.; Guardian, R.; Rosales, I. Wear performance of TiC as reinforcement of a magnesium alloy matrix composite. Composites Part B 2011, 42, 275–279. [Google Scholar] [CrossRef]
- Hanawalt, J.D.; Nelson, C.E.; Peloubet, J.A. Corrosion studies of magnesium and its alloys. Trans. AIME 1942, 147, 273–299. [Google Scholar]
- Matsubara, H.; Ichige, Y.; Fujita, K.; Nishiyama, H.; Hodouchi, K. Effect of impurity Fe on corrosion behavior of AM50 and AM60 magnesium alloys. Corros. Sci. 2013, 66, 203–210. [Google Scholar] [CrossRef]
- Asada, H.; Komori, S.; Aoki, K.; Aoyama, K. Study on the high purity and iron-free magnesium and its alloys. J. Jpn. Inst. Light Met. 1958, 8, 65–73. [Google Scholar] [CrossRef]
- Inoue, M.; Iwai, M.; Matuzawa, K.; Kamado, S.; Kojima, Y. Effect of impurities on corrosion behavior of pure magnesium in salt water environment. J. Jpn. Inst. Light Met. 1998, 48, 257–262. [Google Scholar] [CrossRef]
- Bakke, P.; Sannes, S.; Albright, D. Effects of Ni, Cu, Si and Co on the corrosion properties of permanent mould cast medallions and die cast plates of magnesium alloy AZ91. SAE Trans. 1999, 775–784. [Google Scholar]
- Jönsson, M.; Thierry, D.; LeBozec, N. The influence of microstructure on the corrosion behaviour of AZ91D studied by scanning Kelvin probe force microscopy and scanning Kelvin probe. Corros. Sci. 2006, 48, 1193–1208. [Google Scholar] [CrossRef]
- Song, G.; Atrens, A.; Wu, Z.; Zhang, B. Corrosion behaviour of AZ21, AZ501, and AZ91 in sodium chloride. Corros. Sci. 1998, 40, 1769–1791. [Google Scholar] [CrossRef]
- Yang, L.; Li, Y.; Wei, Y.; Hou, L.; Li, Y.; Tian, Y. Atmospheric corrosion of field-exposed AZ91D Mg alloys in a polluted environment. Corros. Sci. 2010, 52, 2188–2196. [Google Scholar] [CrossRef]
- Li, Y.G.; Wei, Y.H.; Hou, L.F.; Guo, C.L.; Han, P.J. Fabrication of a surface-porous magnesium–aluminium alloy. Electrochem. Commun. 2014, 46, 94–98. [Google Scholar] [CrossRef]
- Liu, M.; Zanna, S.; Ardelean, H.; Frateur, I.; Schmutz, P.; Song, G.; Atrens, A.; Marcus, P. A first quantitative XPS study of the surface films formed, by exposure to water, on Mg and on the Mg–Al intermetallics: Al3Mg2 and Mg17Al12. Corros. Sci. 2009, 51, 1115–1127. [Google Scholar] [CrossRef]
- Zarandia, F.; Sealea, G.; Vermab, R.; Essadiqic, E.; Yue, S. Effect of Al and Mn additions on rolling and deformation behavior ofAZ series magnesium alloys. Mater. Sci. Eng. A 2008, 496, 159–168. [Google Scholar] [CrossRef]
- Ji, S.; Qian, M.; Fan, Z. Semisolid processing characteristics of AM series Mg alloys by Rheo-diecasting. Metall. Mater. Trans. A 2006, 37, 779–787. [Google Scholar] [CrossRef]
- Akyuz, B. Influence of Al content on machinability of AZ series Mg alloys. Trans. Nonferrous Met. Soc. China 2013, 23, 2243–2249. [Google Scholar] [CrossRef]
- Song, G.; Atrens, A. Understanding magnesium corrosion—A framework for improved alloy performance. Adv. Eng. Mater. 2003, 5, 837–858. [Google Scholar] [CrossRef]
- Zhao, M.C.; Liu, M.; Song, G.; Atrens, A. Influence of the β-phase morphology on the corrosion of Mg alloy AZ91. Corros. Sci. 2008, 50, 1939–1953. [Google Scholar] [CrossRef]
- Yang, L.; Wei, Y.; Hou, L.; Zhang, D. Corrosion behaviour of die-cast AZ91D magnesium alloy in aqueous sulphate solutions. Corros. Sci. 2010, 52, 345–351. [Google Scholar] [CrossRef]
- Andreatta, F.; Apachitei, I.; Kodentsov, A.A.; Dzwonczyk, J.; Duszczyk, J. Volta potential of second phase particles in extruded AZ80 magnesium alloy. Electrochim. Acta 2006, 51, 3551–3557. [Google Scholar] [CrossRef]
- Shi, B.Q.; Chen, R.S.; Ke, W. Effects of forging processing on the texture and tensile properties of ECAEed AZ80 magnesium alloy. Mater. Sci. Eng. A 2012, 546, 323–327. [Google Scholar] [CrossRef]
- Feliu, S., Jr.; Pardo, A.; Merino, M.C.; Coy, A.E.; Viejo, F.; Arrabal, R. Correlation between the surface chemistry and the atmospheric corrosionof AZ31, AZ80 and AZ91D magnesium alloys. Appl. Surf. Sci. 2009, 255, 4102–4108. [Google Scholar] [CrossRef]
- Pardo, A.; Merino, M.C.; Coy, A.E.; Arrabal, R.; Viejo, F.; Matykina, E. Corrosion behaviour of magnesium/aluminium alloys in 3.5 wt.% NaCl. Corros. Sci. 2008, 50, 823–834. [Google Scholar] [CrossRef]
- Pardo, A.; Merino, M.C.; Coy, A.E.; Viejo, F.; Arrabal, R.; Feliú, S., Jr. Influence of microstructure and composition on the corrosion behaviour of Mg/Al alloys in chloride media. Electrochim. Acta 2008, 53, 7890–7902. [Google Scholar] [CrossRef]
- Li, Y.; Wei, Y.; Hou, L.; Han, P. Atmospheric corrosion of AM60 Mg alloys in an industrial city environment. Corros. Sci. 2013, 69, 67–76. [Google Scholar] [CrossRef]
- Luo, X.K.; Li, R.; Huang, L.; Zhang, T. Nucleation and growth of nanoporous copper ligaments during electrochemical dealloying of Mg-based metallic glasses. Corros. Sci. 2013, 67, 100–108. [Google Scholar] [CrossRef]
- Fan, J.P.; Bian, X.F.; Niu, Y.C.; Bai, Y.W.; Xiao, X.X.; Yang, C.C.; Yang, J.F.; Yang, J.Y. Formation of three-dimensional nano-porous silver films and application toward electrochemical detection of hydrogen peroxide. Appl. Surf. Sci. 2013, 285, 185–189. [Google Scholar] [CrossRef]
- Zeng, R.; Sheng, Y.; Zheng, Y.; Cui, H.; Han, E. Corrosion and characterization of dual phase Mg-Li-Ca alloy in Hank’s solution: The influence of microstructural features. Corros. Sci. 2014, 79, 69–82. [Google Scholar] [CrossRef]
- Tian, Y.; Yang, L.J.; Li, Y.F.; Wei, Y.H.; Hou, L.F.; Li, Y.G.; Murakami, R.I. Corrosion behaviour of die-cast AZ91D magnesium alloys in sodium sulphate solutions with different pH values. Trans. Nonferrous Met. Soc. China 2011, 21, 912–920. [Google Scholar] [CrossRef]
- Dhanapal, A.; Boopathy, S.R.; Balasubramanian, V. Influence of pH value, chloride ion concentration and immersion time on corrosion rate of friction stir welded AZ61A magnesium alloy weldments. J. Alloys Compd. 2012, 523, 49–60. [Google Scholar] [CrossRef]
- Chen, Y.; Zhang, S.; Li, J.; Song, Y.; Zhao, C.; Wang, H.; Zhang, X. Influence of Mg2+ concentration, pH value and specimen parameter on the hemolytic property of biodegradable magnesium. Mater. Sci. Eng. B 2011, 176, 1823–1826. [Google Scholar] [CrossRef]
- Krawiec, H.; Stanek, S.; Vignal, V.; Lelito, J.; Suchy, J.S. The use of microcapillary techniques to study the corrosion resistance of AZ91 magnesium alloy at the microscale. Corros. Sci. 2011, 53, 3108–3113. [Google Scholar] [CrossRef]
- Raynor, G.V. The Physical Metallurgy of Magnesium and its Alloys; Pergamon Press: New York, NY, USA, 1959. [Google Scholar]
- Brito, P.; Schuller, E.; Silva, J.; Roberta, T.; Campos, T.R.; de Araújo, C.R.; Carneiro, J.R. Electrochemical corrosion behaviour of (100), (110) and (111) Fe3Al single crystals in sulphuric acid. Corros. Sci. 2017, 126, 366–373. [Google Scholar] [CrossRef]
- Flamini, D.O.; Valle, M.I.; Sandoval, M.J.; Massheimer, V.L.; Saidman, S.B. Electrodeposition study of polypyrrole-heparin and polypyrrole-salicylate coatings on Nitinol. Mater. Chem. Phys. 2018, 209, 76–85. [Google Scholar] [CrossRef]
- Wazarkar, K.; Kathalewar, M.; Sabnis, A. Anticorrosive and insulating properties of cardanol based anhydride curing agent for epoxy coatings. React. Funct. Polym. 2018, 122, 148–157. [Google Scholar] [CrossRef]
- Frankel, G.S.; Samaniego, A.; Birbilis, N. Evolution of hydrogen at dissolving magnesium surfaces. Corros. Sci. 2013, 70, 104–111. [Google Scholar] [CrossRef] [Green Version]
- Song, G.; Atrens, A.; Dargusch, M. Influence of microstructure on the corrosion of diecast AZ91D. Corros. Sci. 1999, 41, 249–273. [Google Scholar] [CrossRef]
- Ambat, R.; Aung, N.N.; Zhou, W. Evaluation of microstructural effects on corrosion behaviour of AZ91D magnesium alloy. Corros. Sci. 2000, 42, 1433–1455. [Google Scholar] [CrossRef]
- Chen, Q.; Sieradzki, K. Mechanisms and morphology evolution in dealloying. J. Electrochem. Soc. 2013, 160, C226–C231. [Google Scholar] [CrossRef]
- Polunin, A.V.; Pchelnikov, A.P.; Losev, V.V.; Marshakov, I.K. Electrochemical studies of the kinetics and mechanism of brass dezincification. Electrochim. Acta 1982, 27, 467–475. [Google Scholar] [CrossRef]
- Zhang, T.; Shao, Y.; Meng, G.; Wang, F. Electrochemical noise analysis of the corrosion of AZ91D magnesium alloy in alkaline chloride solution. Electrochim. Acta 2007, 53, 561–568. [Google Scholar] [CrossRef]
- Liu, M.; Schmutzm, P.; Zanna, S.; Seyeux, A.; Ardelean, H.; Song, G.; Atrens, A.; Marcus, P. Electrochemical reactivity, surface composition and corrosion mechanisms of the complex metallic alloy Al3Mg2. Corros. Sci. 2010, 52, 562–578. [Google Scholar] [CrossRef]
- Schlapbach, L.; Züttel, A. Hydrogen-storage materials for mobile applications. Nature 2001, 414, 353–358. [Google Scholar] [CrossRef] [PubMed]
- Xiao, Y.; Wu, C.; Chen, Y.; Wu, H.; Yang, F. Study of hydrogen generation by hydrolysis of Mg17Al12 hydride. J. Funct. Mater. 2011, 42, 704–707. [Google Scholar]
Figure 1.
The cast Mg–Al alloy’s microstructure: (a) Cast Mg–Al alloy; (b) SEM image of eutectic structure at high resolution; (c) linear and granular like α-Mg phases in eutectic; (d) EDS analysis results at sites A and B in the SEM image (a); (e) the Mg–Al alloy’s XRD test result.
Figure 1.
The cast Mg–Al alloy’s microstructure: (a) Cast Mg–Al alloy; (b) SEM image of eutectic structure at high resolution; (c) linear and granular like α-Mg phases in eutectic; (d) EDS analysis results at sites A and B in the SEM image (a); (e) the Mg–Al alloy’s XRD test result.

Figure 2.
Polarization curves of (a) the Mg–Al alloy and SP Mg17Al12 in H2SO4 and HAc solutions and (b) pure Mg, SS AZ61, and SS AZ91 in H2SO4 and HAc solutions, respectively.
Figure 2.
Polarization curves of (a) the Mg–Al alloy and SP Mg17Al12 in H2SO4 and HAc solutions and (b) pure Mg, SS AZ61, and SS AZ91 in H2SO4 and HAc solutions, respectively.

Figure 3.
Weight losses of the Mg–Al alloy in H2SO4 and HAc solutions for 30, 60, and 90 min.

Figure 4.
The Mg–Al alloy’s corrosion rates in H2SO4 and HAc solutions for 30, 60, and 90 min.

Figure 5.
The Mg–Al alloy’s hydrogen evolutions in H2SO4 (a)and HAc (b)solutions for 90 min.

Figure 6.
The corroded Mg–Al alloyspecimen’s corrosion morphologies gained from H2SO4 solution for different immersion times: (a,b) 30 min; (c,d) 60 min; (e,f) 90 min.
Figure 6.
The corroded Mg–Al alloyspecimen’s corrosion morphologies gained from H2SO4 solution for different immersion times: (a,b) 30 min; (c,d) 60 min; (e,f) 90 min.

Figure 7.
The corroded Mg–Al alloyspecimen’s corrosion morphologies gained from HAc solution for different immersion times: (a,b) 30 min; (c,d) 60 min; (e,f) 90 min.
Figure 7.
The corroded Mg–Al alloyspecimen’s corrosion morphologies gained from HAc solution for different immersion times: (a,b) 30 min; (c,d) 60 min; (e,f) 90 min.

Figure 8.
The corroded Mg–Al alloy specimen’s cross-sectional morphologies obtained from H2SO4 solution for different immersion times: (a,b) 30 min; (c,d) 60 min; (e,f) 90 min.
Figure 8.
The corroded Mg–Al alloy specimen’s cross-sectional morphologies obtained from H2SO4 solution for different immersion times: (a,b) 30 min; (c,d) 60 min; (e,f) 90 min.

Figure 9.
The corroded Mg–Al alloy specimen’s cross-sectional morphologies gained from HAc solution after immersion for different times: (a) 30 min, (b) 60 min, (c) 90 min.
Figure 9.
The corroded Mg–Al alloy specimen’s cross-sectional morphologies gained from HAc solution after immersion for different times: (a) 30 min, (b) 60 min, (c) 90 min.

Figure 10.
Surface morphologies of the SP Mg17Al12 and the Mg–Al alloy: (a) Original morphology of the SP Mg17Al12 (un-etched); (b) the SP Mg17Al12 alloy’s corrosion morphology after 90 min of immersion in H2SO4 solution; (c) the SP Mg17Al12 alloy’s corrosion morphology after 90 min of immersion in HAc solution; (d) the Mg–Al alloy’s corrosion morphology after 30 min of immersion in HAc solution.

Figure 11.
Effect of grain orientation on corrosion mechanism and corrosion morphologies of eutectic microstructures: (a,b) Schematic diagrams of the point-like eutectic before and after immersion test; (c) corrosion morphologies of the point-like eutectic after 90 min of immersion; (d,e) schematic diagrams of the feather-like eutectic before and after immersion test; (f) corrosion morphologies of the feather-like eutectic after 90 min of immersion in HAc solution.


Table 1.
Thechemical composition of AZ91D and AZ61 alloys (wt.%)
| Alloy | Al | Zn | Mn | Fe | Si | Cu | Ni | Be | Mg |
|---|---|---|---|---|---|---|---|---|---|
| AZ91D | 8.91 | 0.67 | 0.21 | 0.0026 | 0.0331 | 0.0047 | 0.00060 | 0.0009 | Bal. |
| AZ61 | 6.67 | 1.03 | 0.40 | 0.0036 | 0.0210 | 0.0018 | 0.00051 | 0.0007 | Bal. |
Table 2.
Electrochemical parameters obtained from polarization curves in H2SO4 and acetic acid (HAc) solutions.
Table 2.
Electrochemical parameters obtained from polarization curves in H2SO4 and acetic acid (HAc) solutions.
| In H2SO4 Solution | Ecorr (V/SCE) | icorr (μA cm−2) | In HAc Solution | Ecorr (V/SCE) | icorr (μA cm−2) |
|---|---|---|---|---|---|
| Mg17Al12 | −1.026 ± 0.010 | 452 ± 208 | Mg17Al12 | −1.126 ± 0.009 | 15.3 ± 7.1 |
| Mg–Al alloy | −1.356 ± 0.023 | 755 ± 345 | Mg–Al alloy | −1.415 ± 0.013 | 22.8 ± 10.5 |
| Pure Mg | −1.944 ± 0.019 | 197 ± 91 | Pure Mg | −1.835 ± 0.021 | 29.4 ± 13.5 |
| SS AZ61 | −1.621 ± 0.030 | 385 ± 173 | SS AZ61 | −1.509 ± 0.017 | 20.7 ± 9.4 |
| SS AZ91D | −1.636 ± 0.025 | 453 ± 159 | SS AZ91D | −1.544 ± 0.011 | 25.0 ± 11.2 |
© 2019 by the authors. Licensee MDPI, Basel, Switzerland. This article is an open access article distributed under the terms and conditions of the Creative Commons Attribution (CC BY) license (http://creativecommons.org/licenses/by/4.0/).
Share and Cite
MDPI and ACS Style
Li, Y.; Wei, Y.; Yang, S. De-alloying Behavior of Mg–Al alloy in Sulphuric Acid and Acetic Acid Aqueous Solutions. Materials 2019, 12, 2046. https://doi.org/10.3390/ma12132046
AMA Style
Li Y, Wei Y, Yang S. De-alloying Behavior of Mg–Al alloy in Sulphuric Acid and Acetic Acid Aqueous Solutions. Materials. 2019; 12(13):2046. https://doi.org/10.3390/ma12132046
Chicago/Turabian StyleLi, Yonggang, Yinghui Wei, and Shengqiang Yang. 2019. "De-alloying Behavior of Mg–Al alloy in Sulphuric Acid and Acetic Acid Aqueous Solutions" Materials 12, no. 13: 2046. https://doi.org/10.3390/ma12132046
Note that from the first issue of 2016, this journal uses article numbers instead of page numbers. See further details here.