Effect of Hatch Spacing on Melt Pool and As-built Quality During Selective Laser Melting of Stainless Steel: Modeling and Experimental Approaches

Abstract
1. Introduction
2. Materials and Methods
2.1. Simulation
2.2. Experimentation
3. Results and Discussion
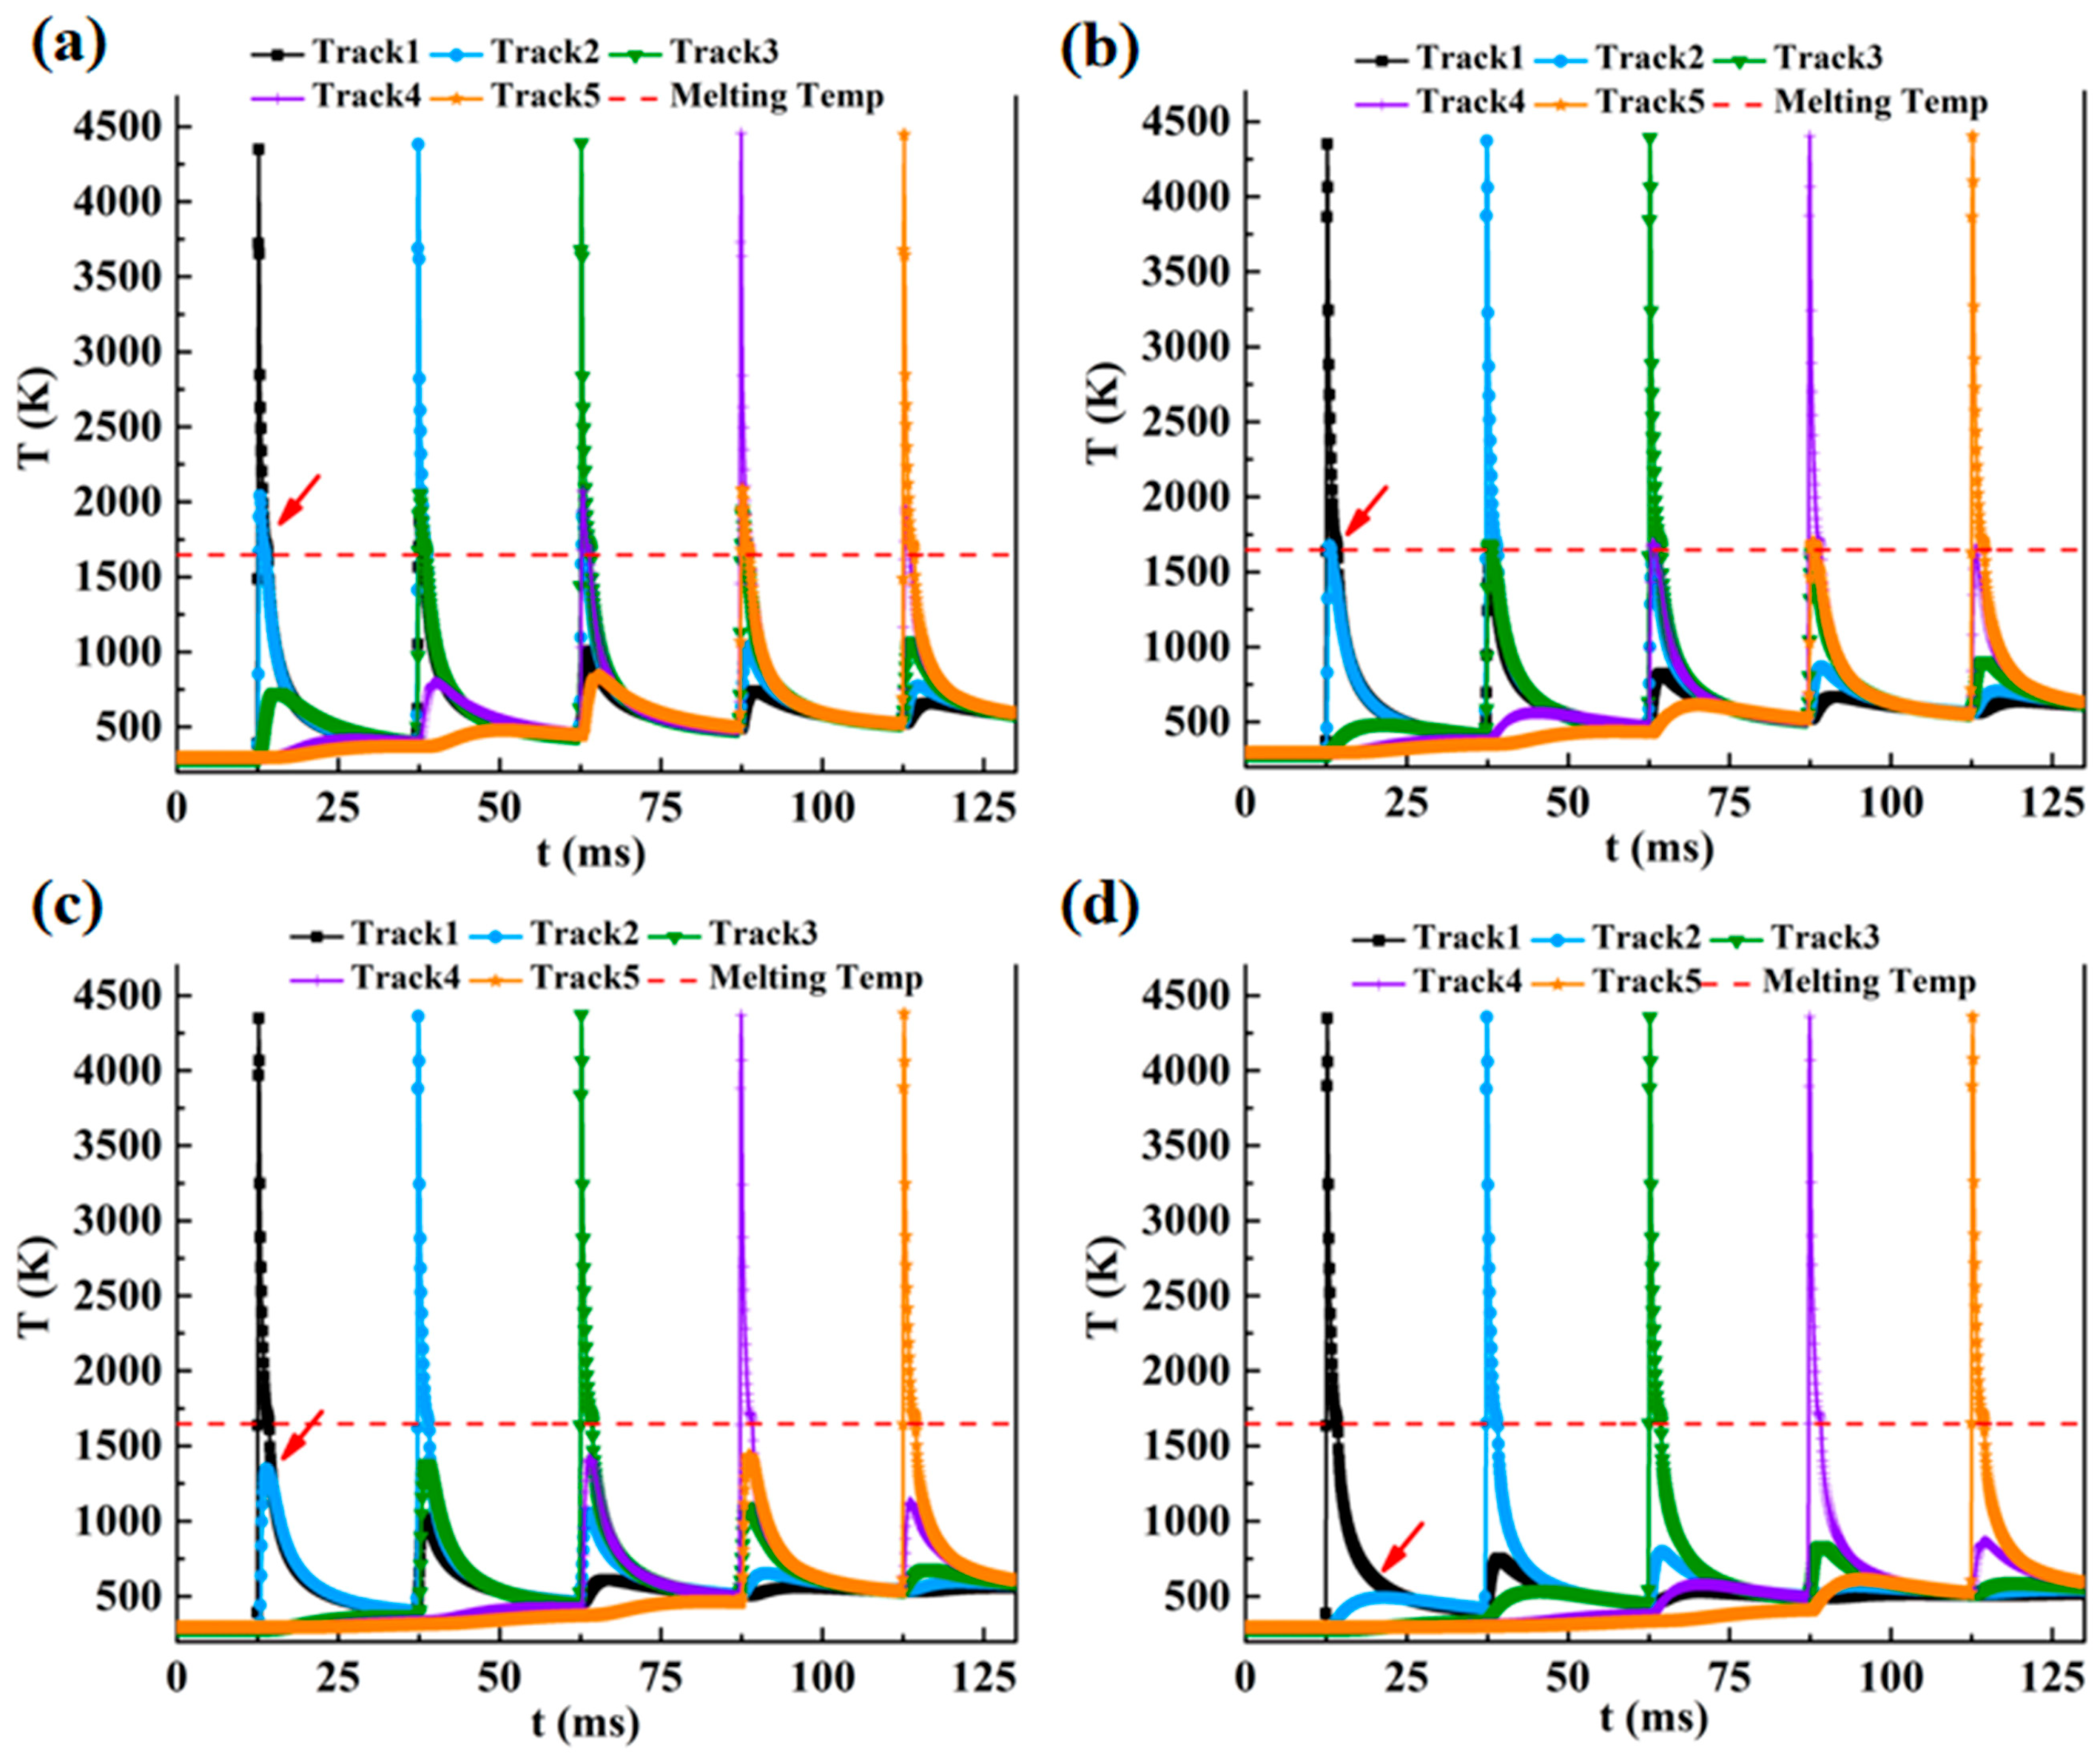
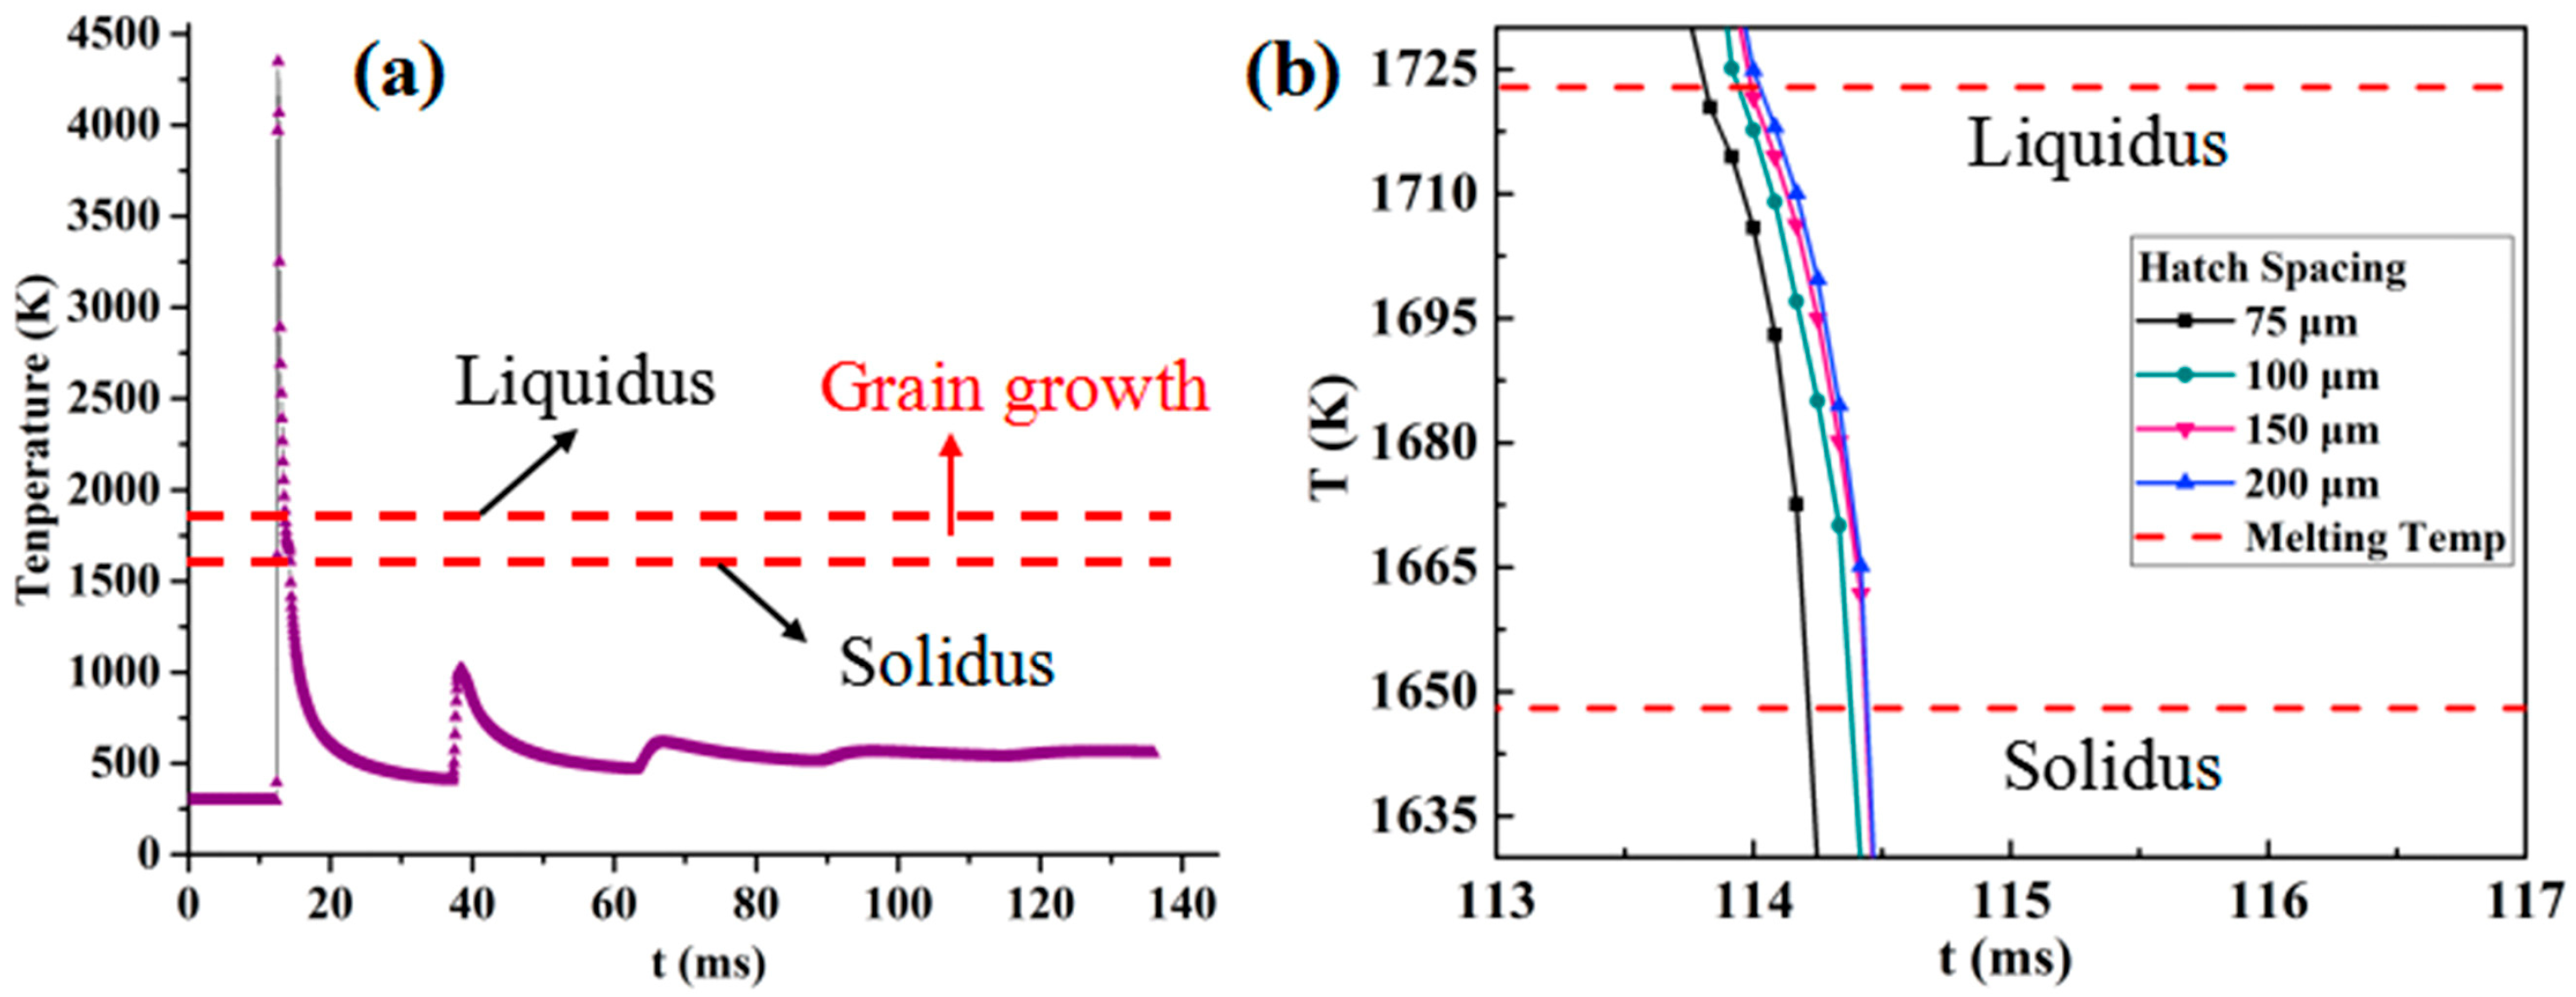
3.1. Temperature Distribution
3.2. Melt pool Size
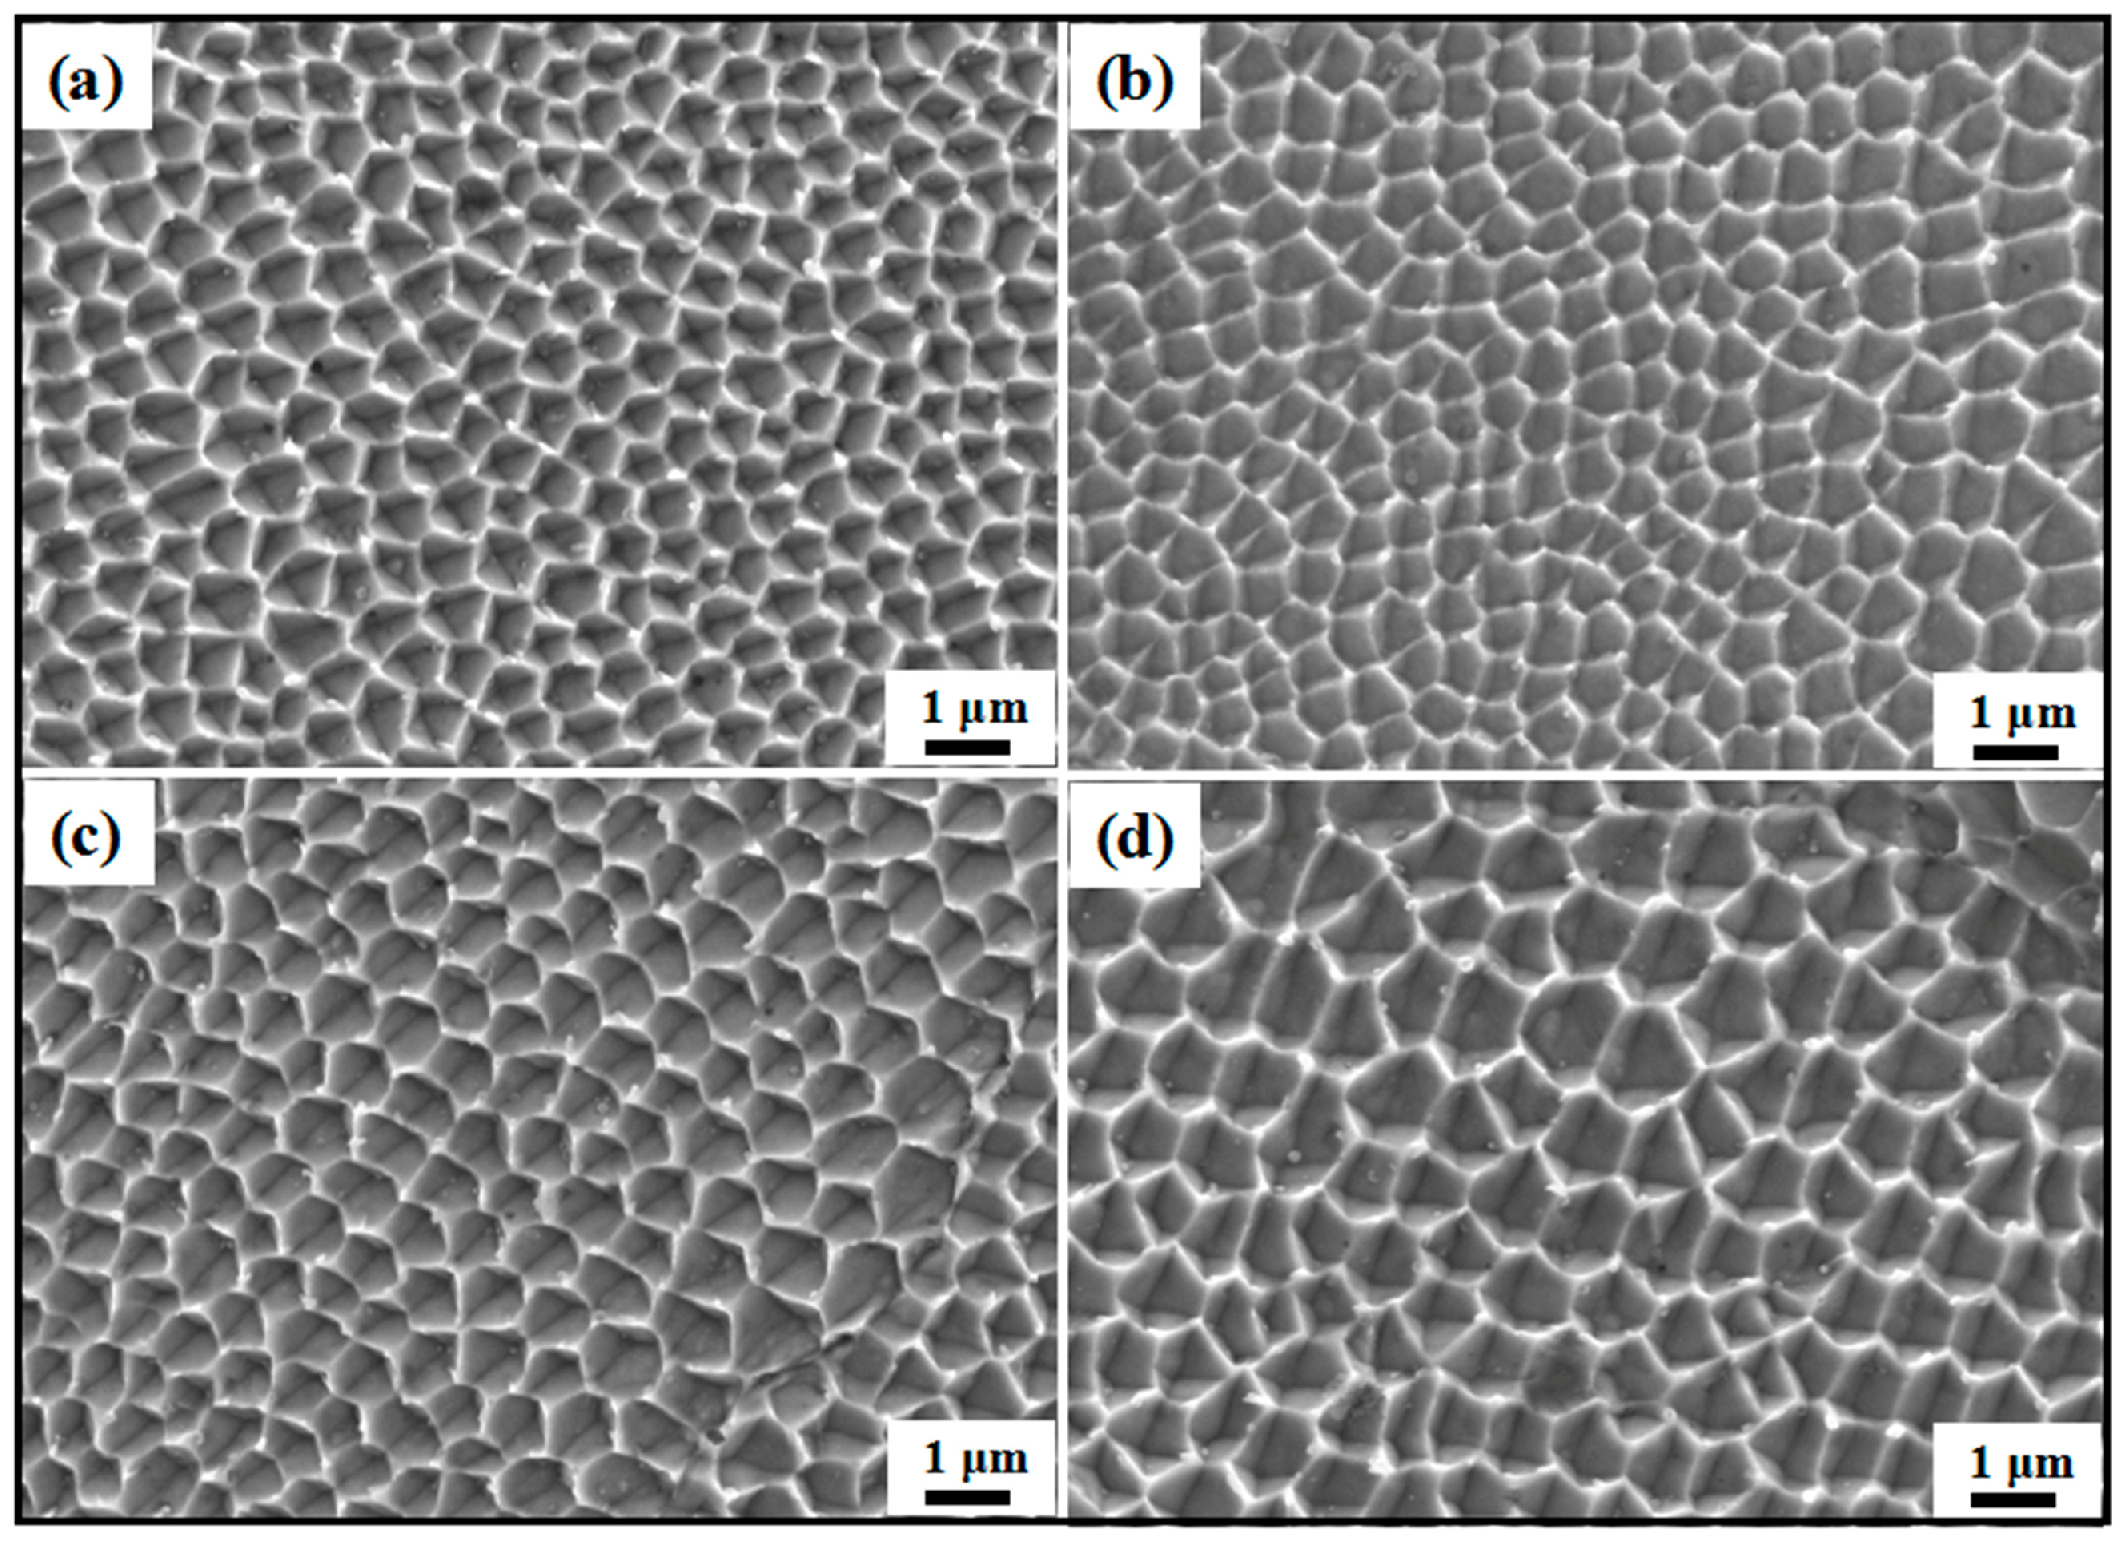
3.3. Microstructure
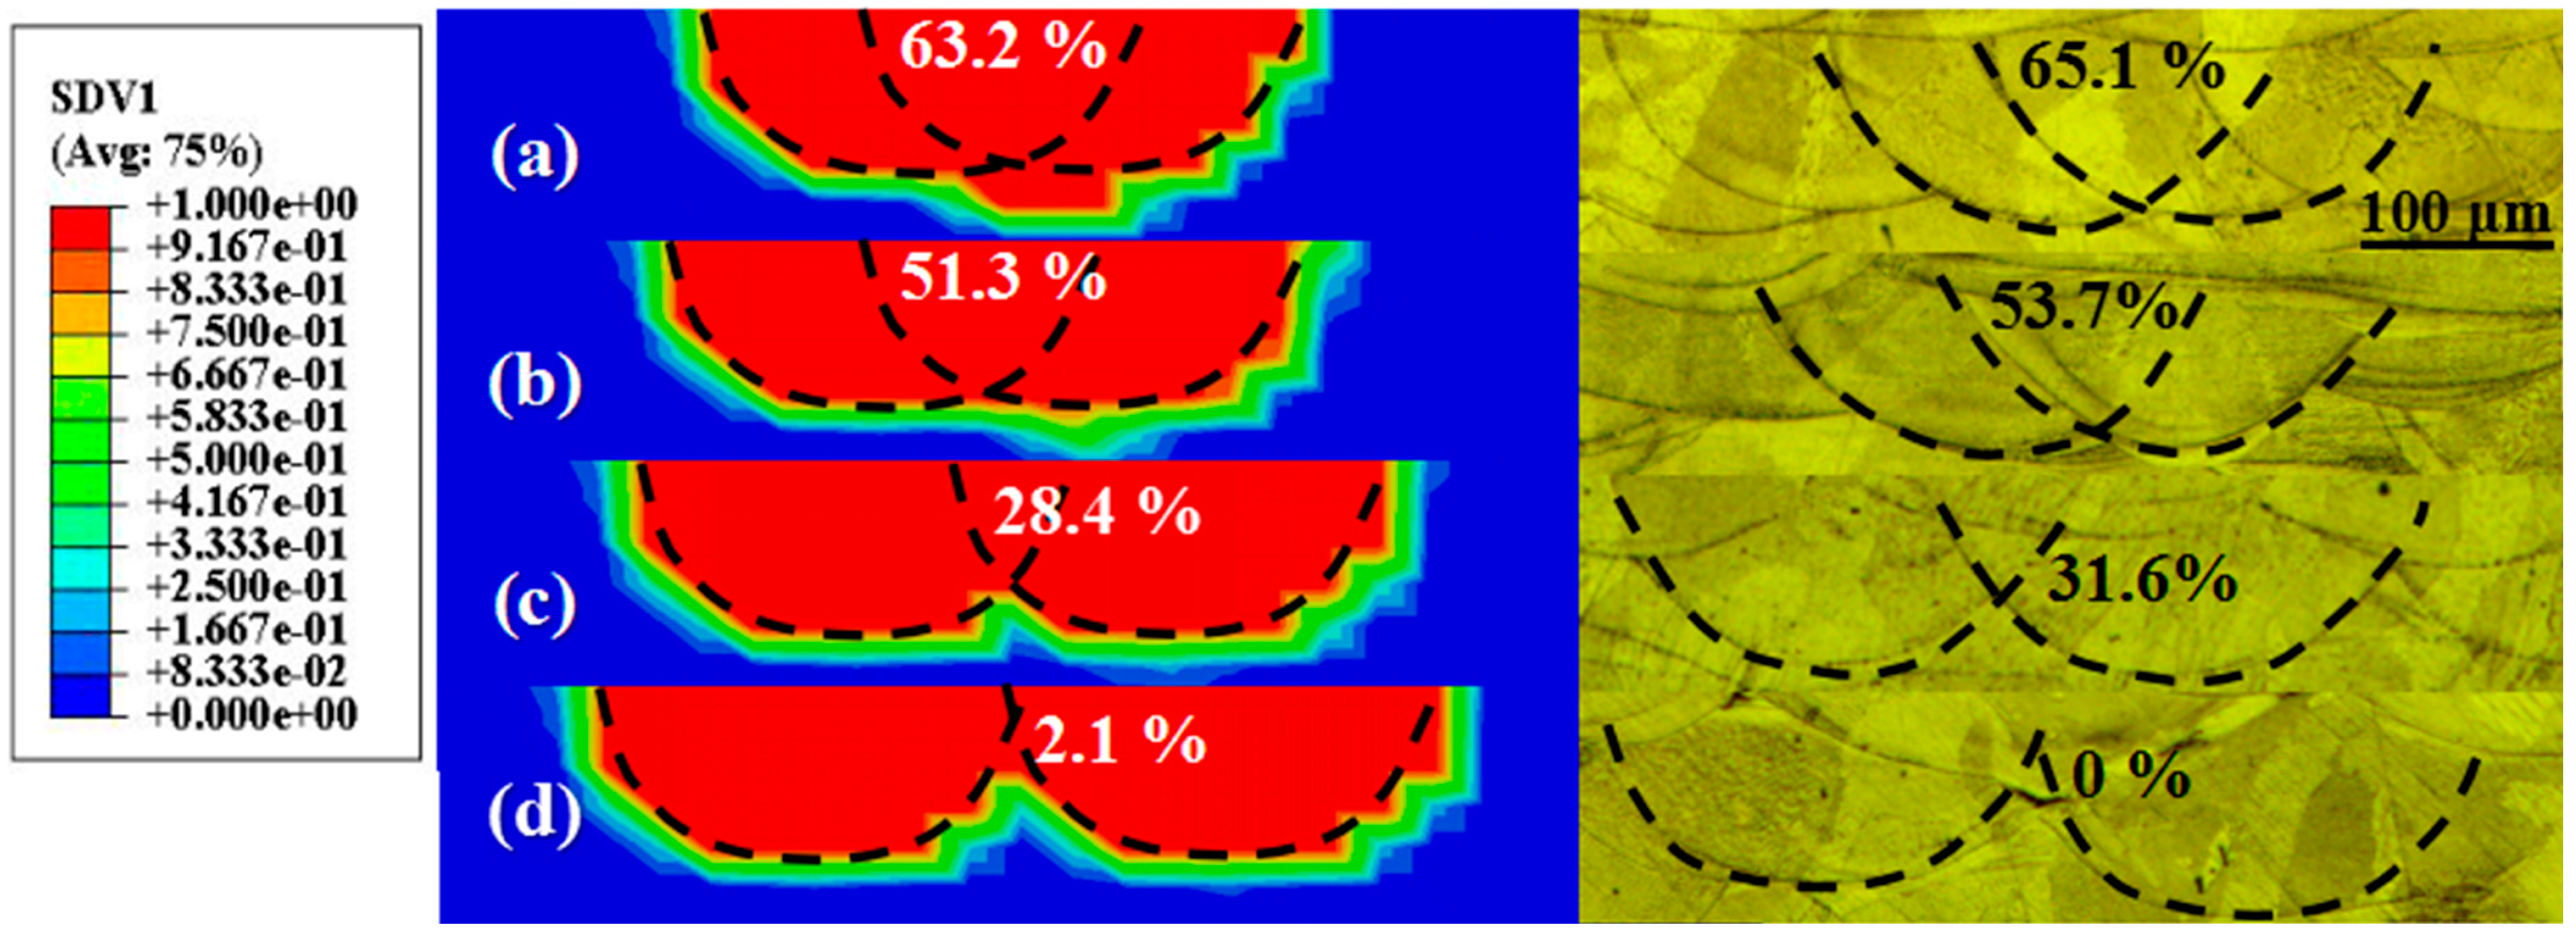
3.4. Overlap Rate
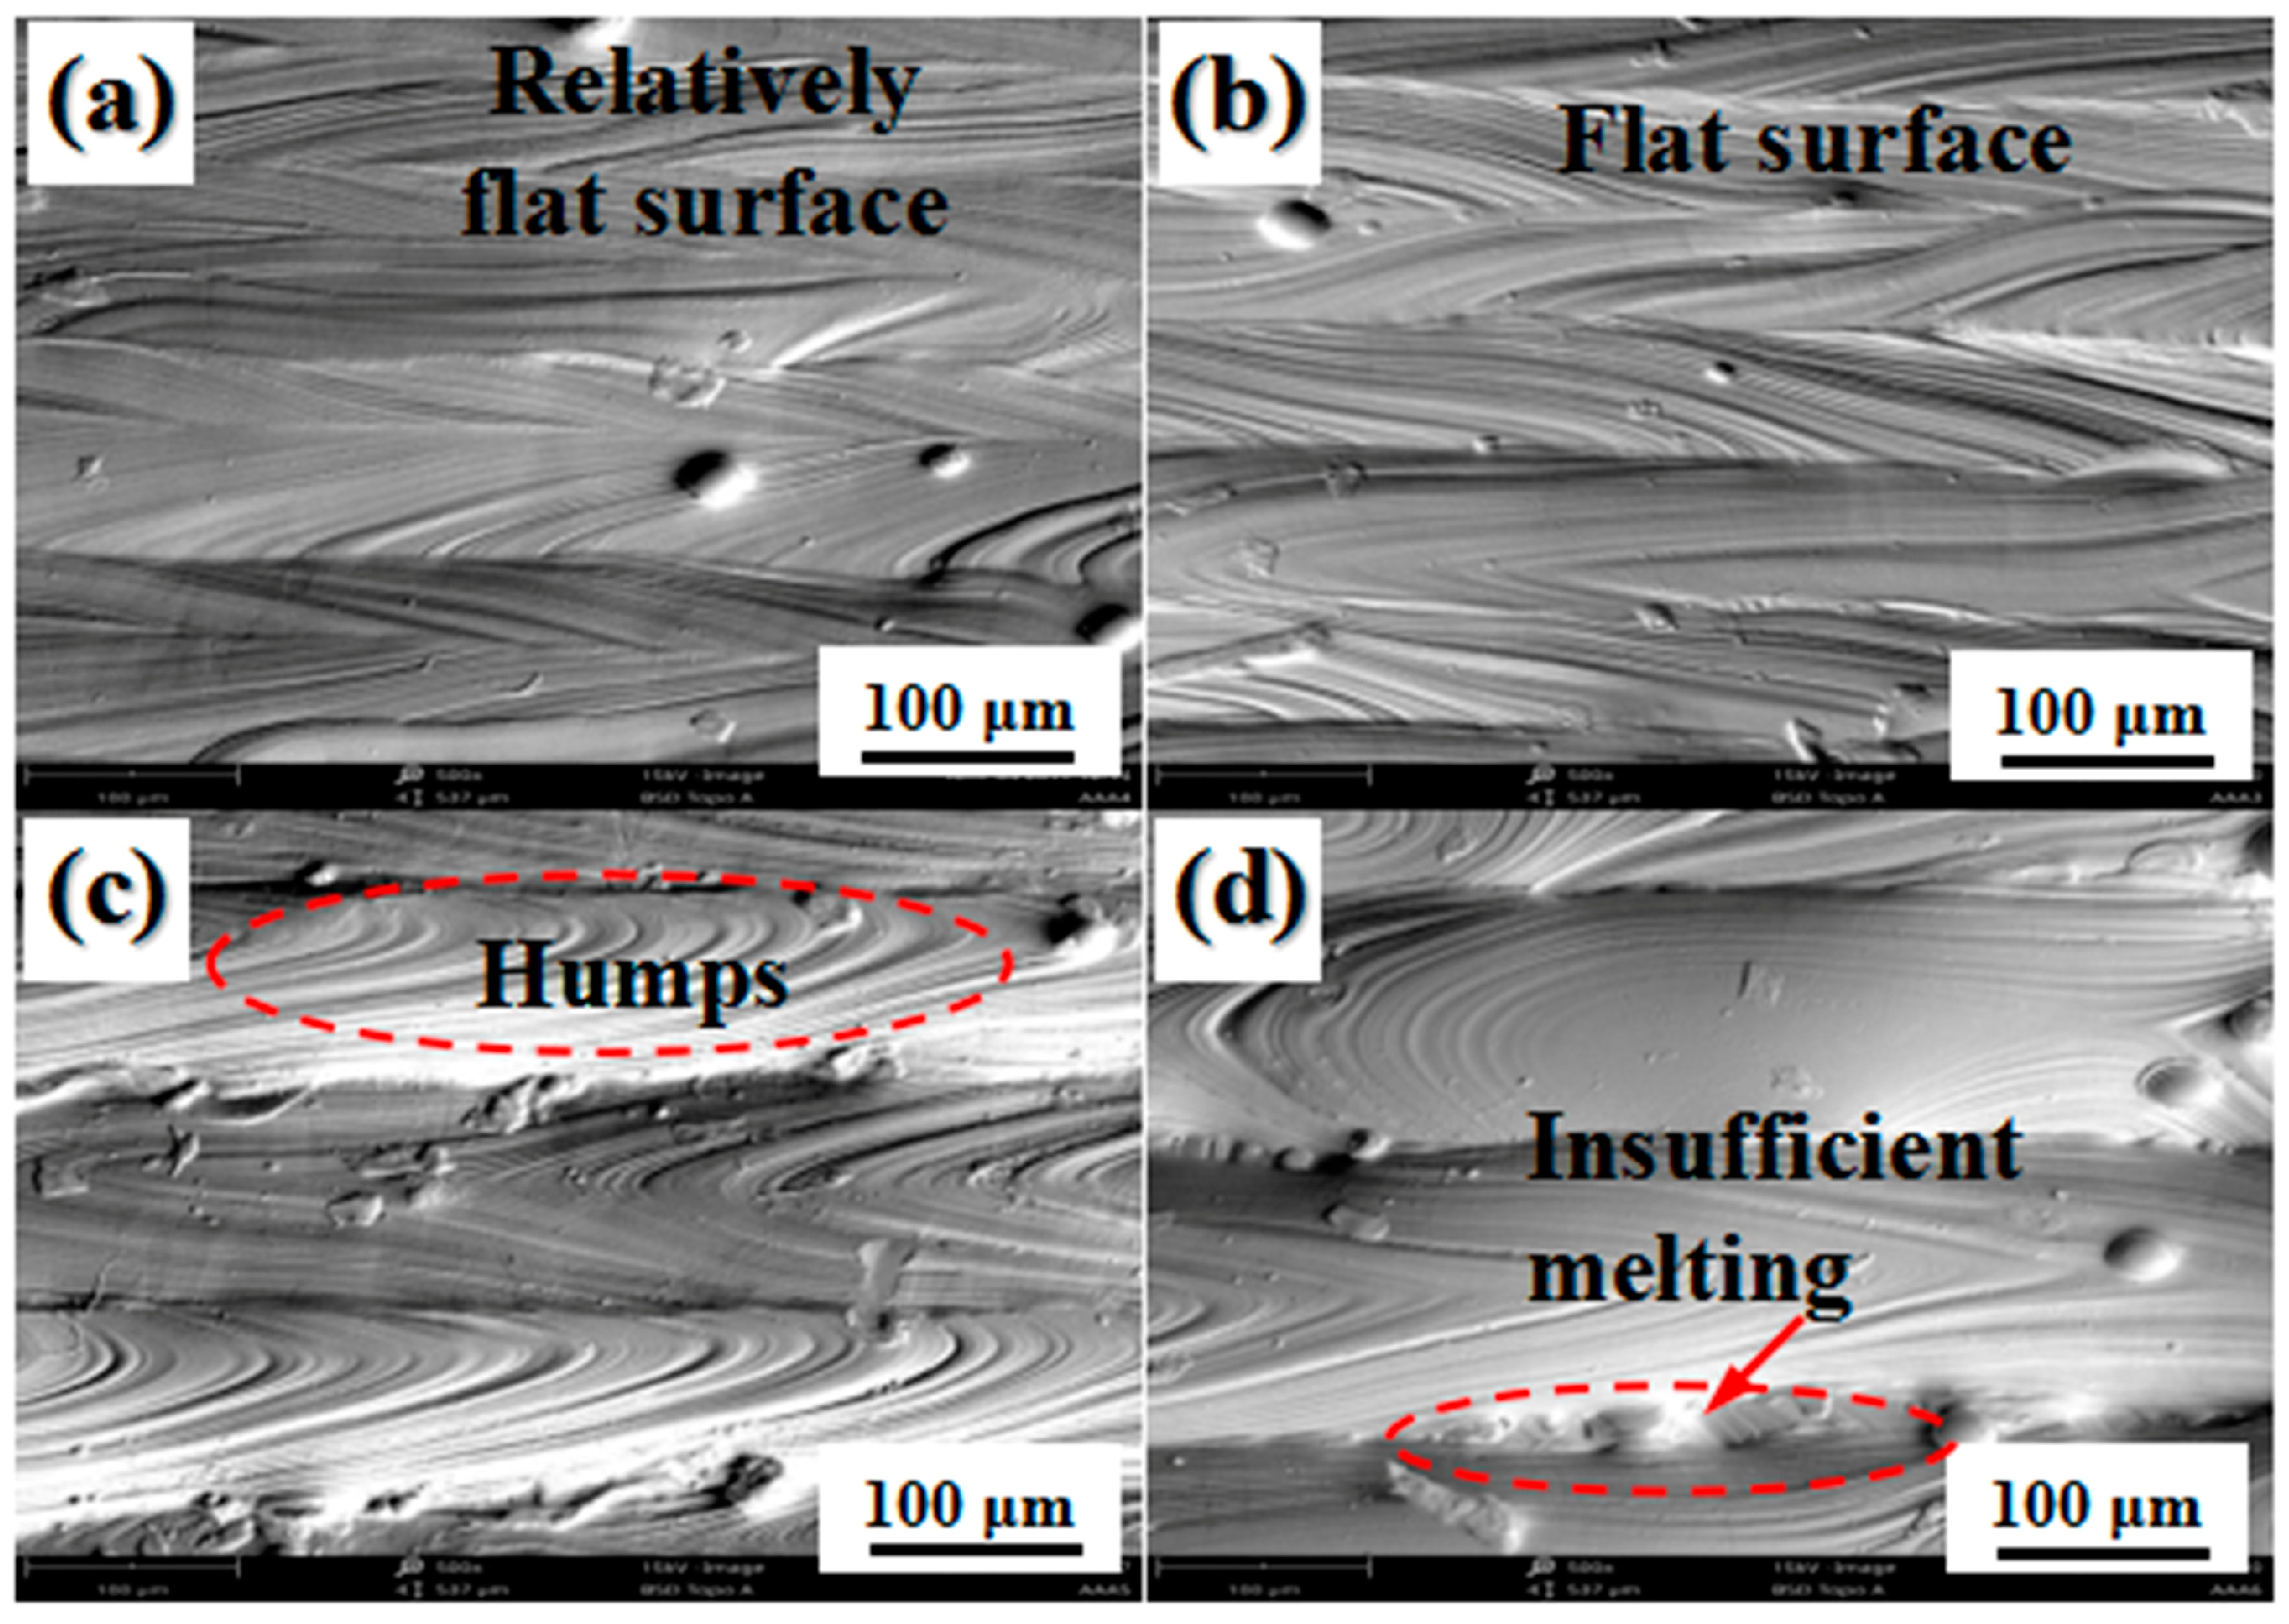
3.5. Surface Roughness
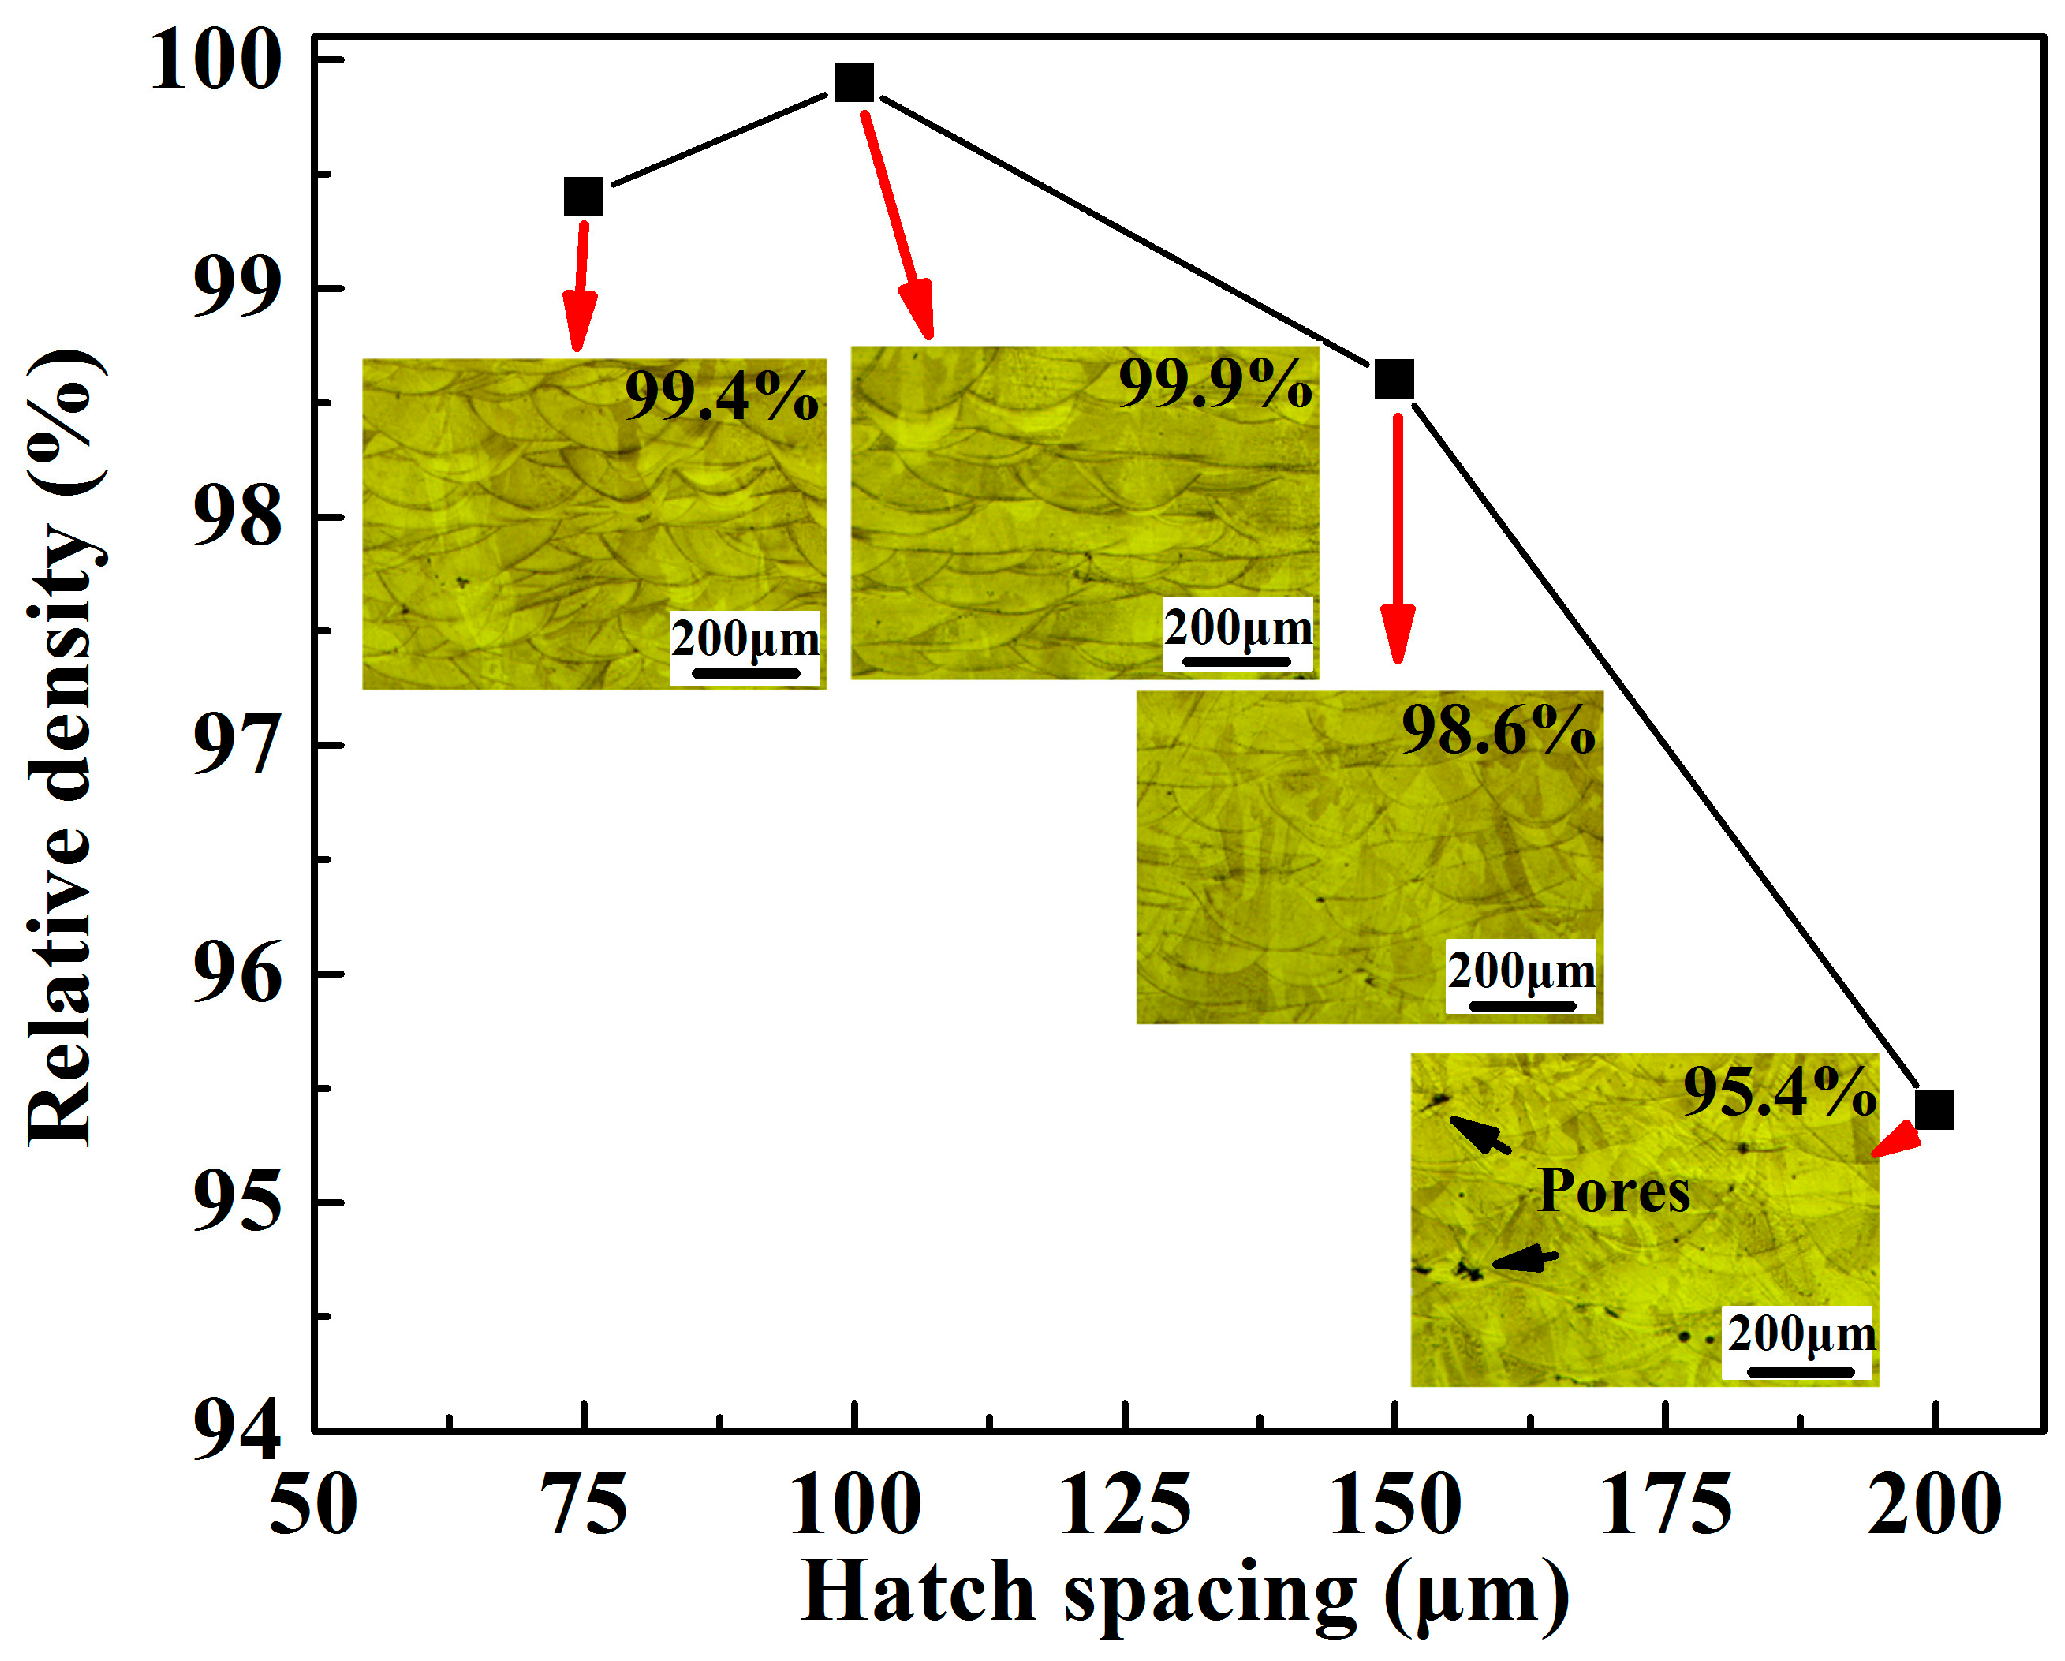
3.6. Relative Density
4. Conclusions
- Increasing the hatch spacing reduces the maximum temperature and heat accumulation. When the hatch spacing increased from 75 to 200 μm, the simulated width of the melt pool decreased from 221 to 212 μm, while the depth of the melt pool increased from 81.4 to 85.2 μm. The finite element analysis model also managed to predict the microstructure and melt pool sizes based on the cooling rate. The simulation results were in good agreement with the experimental data.
- The simulation models were used for several hatch spacings. The solidified development at the end of the fifth track was clearly demonstrated. The overlap rate between adjacent tracks was investigated by numerical simulations. A reasonable value of the hatch spacing of 100 μm was revealed, which yielded a relatively flat sintering condition and an appropriate overlap rate (approximately 54%) between adjacent tracks. Similarly, the experiments also confirmed the simulation results.
- The hatch spacing had a strong influence on the surface quality and relative density of the SLM-fabricated 316L SS samples. The experimental results showed that, with an appropriate hatch spacing of 100 μm, samples with a high relative density of 99.9% and low average surface roughness of 2.68 μm could be fabricated by SLM. These findings provide significant insight into the optimization of SLM process parameters.
Author Contributions
Funding
Conflicts of Interest
References
- Herzog, D.; Seyda, V.; Wycisk, E.; Emmelmann, C. Additive Manufacturing of metals. Acta Mater. 2016, 117, 371–392. [Google Scholar] [CrossRef]
- Shang, Y.T.; Yuan, Y.P.; Li, D.F.; Li, Y.S.; Chen, J.M. Effects of scanning speed on in vitro biocompatibility of 316L stainless steel parts elaborated by selective laser melting. Int. J. Adv. Manuf. Technol. 2017, 92, 4379–4385. [Google Scholar] [CrossRef]
- Suryawanshi, J.; Prashanth, K.G.; Ramamurty, U. Mechanical behavior of selective laser melted 316L stainless steel. Mater. Sci. Eng. A 2017, 696, 113–121. [Google Scholar] [CrossRef]
- Gusarov, A.; Yadroitsev, I.; Bertrand, P.; Smurov, I. Model of radiation and heat transfer in laser-powder interaction zone at selective laser melting. J. Heat Transf. 2009, 131, 072101. [Google Scholar] [CrossRef]
- Töppel, T.; Müller, B.; Gebauer, M.; Neugebauer, R. Additive manufacturing boosts efficiency of heat transfer components. Assem. Autom. 2011, 31, 344–347. [Google Scholar] [CrossRef]
- Li, Z.H.; Li, B.Q.; Bai, P.K.; Liu, B.; Wang, Y. Research on the thermal behaviour of a selectively laser melted aluminium alloy: Simulation and experiment. Materials 2018, 11, 1172. [Google Scholar] [CrossRef] [PubMed]
- Yan, W.T.; Qian, Y.; Ge, W.J.; Lin, S.; Liu, W.K.; Lin, F.; Wagner, G.J. Meso-scale modeling of multiple-layer fabrication process in selective electron beam melting: Inter-layer/track voids formation. Mater. Des. 2018, 141, 210–219. [Google Scholar] [CrossRef]
- Foroozmehr, A.; Badrossamay, M.; Foroozmehr, E.; Golabi, S. Finite element simulation of selective laser melting process considering optical penetration depth of laser in powder bed. Mater. Des. 2016, 89, 255–263. [Google Scholar] [CrossRef]
- Wei, P.; Wei, Z.Y.; Chen, Z.; Li, J.F.; Zhang, S.Z.; Jun, J. Numerical simulation and parametric analysis of selective laser melting process of AlSi10Mg powder. Appl. Phys. A 2017, 123, 540. [Google Scholar] [CrossRef]
- Khairallah, S.A.; Anderson, A. Mesoscopic simulation model of selective laser melting of stainless steel powder. J. Mater. Process. Technol. 2014, 214, 2627–2636. [Google Scholar] [CrossRef]
- Song, B.; Dong, S.; Liao, H.; Coddet, C. Process parameter selection for selective laser melting of Ti6Al4V based on temperature distribution simulation and experimental sintering. Int. J. Adv. Manuf. Technol. 2012, 61, 967–974. [Google Scholar] [CrossRef]
- Dong, Z.C.; Zhang, X.Y.; Shi, W.H.; Zhou, H.; Lei, H.S.; Liang, J. Study of size effect on microstructure and mechanical properties of AlSi10Mg sample made by selective laser melting. Materials 2018, 11, 2463. [Google Scholar] [CrossRef] [PubMed]
- Alsalla, H.H.; Smith, C.; Hao, L. Effect of build orientation on the surface quality, microstructure and mechanical properties of selective laser melting 316L stainless steel. Rapid Prototyp. J. 2018, 24, 9–17. [Google Scholar] [CrossRef]
- Kurzynowski, T.; Gruber, K.; Stopyra, W.; Kuźnicka, B.; Chlebus, E. Correlation between process parameters, microstructure and properties of 316 L stainless steel processed by selective laser melting. Mater. Sci. Eng. A 2018, 718, 64–73. [Google Scholar] [CrossRef]
- Tran, H.C.; Lo, Y.L. Heat transfer simulations of selective laser melting process based on volumetric heat source with powder size consideration. J. Mater. Process. Technol. 2018, 255, 411–425. [Google Scholar] [CrossRef]
- Dai, D.H.; Gu, D.D. Tailoring surface quality through mass and momentum transfer modeling using a volume of fluid method in selective laser melting of TiC/AlSi10Mg powder. Int. J. Mach. Tools Manuf. 2015, 88, 95–107. [Google Scholar] [CrossRef]
- Xia, M.J.; Gu, D.D.; Yu, G.Q.; Dai, D.H.; Chen, H.Y.; Shi, Q.M. Influence of hatch spacing on heat and mass transfer, thermodynamics and laser processability during additive manufacturing of Inconel 718 alloy. Int. J. Mach. Tools Manuf. 2016, 109, 147–157. [Google Scholar] [CrossRef]
- Qiu, C.L.; Panwisawas, C.; Ward, M.; Basoalto, H.C.; Brooks, J.W.; Attallah, M.M. On the role of melt flow into the surface structure and porosity development during selective laser melting. Acta Mater. 2015, 96, 72–79. [Google Scholar] [CrossRef]
- Su, X.B.; Yang, Y.Q. Research on track overlapping during selective laser melting of powders. J. Mater. Process. Technol. 2012, 212, 2074–2079. [Google Scholar] [CrossRef]
- Yadroitsev, I.; Bertrand, P.; Smurov, I. Parametric analysis of the selective laser melting process. Appl. Surf. Sci. 2007, 253, 8064–8069. [Google Scholar] [CrossRef]
- Wen, P.; Jauer, L.; Voshage, M.; Chen, Y.; Poprawe, R.; Schleifenbaum, J.H. Densification behavior of pure Zn metal parts produced by selective laser melting for manufacturing biodegradable implants. J. Mater. Process. Technol. 2018, 258, 128–137. [Google Scholar] [CrossRef]
- AlMangour, B.; Grzesiak, D.; Borkar, T.; Yang, J.M. Densification behavior, microstructural evolution, and mechanical properties of TiC/316L stainless steel nanocomposites fabricated by selective laser melting. Mater. Des. 2018, 138, 119–128. [Google Scholar] [CrossRef]
- Antony, K.; Arivazhagan, N.; Senthilkumaran, K. Numerical and experimental investigations on laser melting of stainless steel 316L metal powder. J. Manuf. Process. 2014, 16, 345–355. [Google Scholar] [CrossRef]
- Yu, G.Q.; Gu, D.D.; Dai, D.H.; Xia, M.J.; Ma, C.L.; Shi, Q.M. On the role of processing parameters in thermal behavior, surface morphology and accuracy during laser 3D printing of aluminum alloy. J. Phys. D Appl. Phys. 2016, 49, 135501. [Google Scholar] [CrossRef]
- Wu, Y.C.; San, C.H.; Chang, C.H.; Lin, H.J.; Marwan, B.R. Numerical modeling of melt-pool behavior in selective laser melting with random powder distribution and experimental validation. J. Mater. Process. Technol. 2018, 245, 72–78. [Google Scholar] [CrossRef]
- Thorsten, H.; Michael, C.; Konrad, W. Melt pool simulation for the evaluation of process parameters in selective laser melting. Addit. Manuf. 2017, 14, 116–125. [Google Scholar] [CrossRef]
- Dai, D.H.; Gu, D.D. Influence of thermodynamics within melt pool on migration and distribution state of reinforcement during selective laser melting of AlN/AlSi10Mg composites. Int. J. Mach. Tools Manuf. 2016, 100, 14–24. [Google Scholar] [CrossRef]
- Hussein, A.; Hao, L.; Yan, C.Z.; Everson, R. Finite element simulation of the temperature and stress fields in single layers built without-support in selective laser melting. Mater. Des. 2013, 52, 638–647. [Google Scholar] [CrossRef]
- Dai, K.; Shaw, L. Thermal and mechanical finite element modeling of laser forming from metal and ceramic powders. Acta Mater. 2004, 52, 69–80. [Google Scholar] [CrossRef]
- Wang, D.; Yang, Y.; Su, X.; Chen, Y. Study on energy input and its influences on single track, multi-track and multi-layer in SLM. Int. J. Adv. Manuf. Technol. 2012, 58, 1189–1199. [Google Scholar] [CrossRef]
- Ding, X.P.; Wang, L.Z. Heat transfer and fluid flow of molten pool during selective laser melting of AlSi10Mg powder: Simulation and experiment. J. Manuf. Process. 2017, 26, 280–289. [Google Scholar] [CrossRef]
- Casati, R.; Lemke, J.; Vedani, M. Microstructure and fracture behavior of 316L austenitic stainless steel produced by selective laser melting. J. Mater. Sci. Technol. 2016, 32, 738–744. [Google Scholar] [CrossRef]
- Li, X.W.; Habimana, J.W.; Chang, S.; Lu, W.H.; Herng, T.S.; Ding, J. Selective laser melting of stainless steel and alumina composite: Experimental and simulation studies on processing parameters, microstructure and mechanical properties. Mater. Des. 2018, 145, 1–10. [Google Scholar] [CrossRef]
- Yadroitsev, I.; Krakhmalev, P.; Yadroitsava, I.; Johansson, S.; Smurov, I. Energy input effect on morphology and microstructure of selective laser melting single track from metallic powder. J. Mater. Process. Technol. 2013, 213, 606–613. [Google Scholar] [CrossRef]
- Ma, M.; Wang, Z.; Gao, M.; Zeng, X. Layer thickness dependence of performance in high-power selective laser melting of 1Cr18Ni9Ti stainless steel. J. Mater. Process. Technol. 2015, 215, 142–150. [Google Scholar] [CrossRef]
- Chen, H.Y.; Gu, D.D.; Dai, D.H.; Ma, C.L.; Xia, M.J. Microstructure and composition homogeneity, tensile property, and underlying thermal physical mechanism of selective laser melting tool steel parts. Mater. Sci. Eng. A 2017, 682, 279–289. [Google Scholar] [CrossRef]
- Khairallah, S.A.; Anderson, A.T.; Rubenchik, A.; King, W.E. Laser powder-bed fusion additive manufacturing: Physics of complex melt flow and formation mechanisms of pores, spatter, and denudation zones. Acta Mater. 2016, 108, 36–45. [Google Scholar] [CrossRef]
- Ventola, L.; Robotti, F.; Dialameh, M.; Calignano, F.; Manfredi, D.; Chiavazzo, E. Rough surfaces with enhanced heat transfer for electronics cooling by direct metal laser sintering. Int. Commun. Heat Mass Transfer 2014, 75, 58–74. [Google Scholar] [CrossRef]
- AlMangour, B.; Grzesiak, D.; Cheng, J.Q.; Ertas, Y. Thermal behavior of the molten pool, microstructural evolution, and tribological performance during selective laser melting of TiC/316L stainless steel nanocomposites: Experimental and simulation methods. J. Mater. Process. Technol. 2018, 257, 288–301. [Google Scholar] [CrossRef]
- Yusuf, S.M.; Chen, Y.F.; Boardman, R.; Yang, S.F.; Gao, N. Investigation on porosity and microhardness of 316L stainless steel fabricated by selective laser melting. Metals 2017, 7, 64. [Google Scholar] [CrossRef]


| Parameter | Value |
|---|---|
| Laser power, P (W) | 200 |
| Layer thickness, d (μm) | 50 |
| Diameter of laser beam, D (μm) | 75 |
| Scan speed, V (mm/s) | 400 |
| Hatch spacing, H (μm) | 75, 100, 150, 200 |
| Absorption rate of powder, A | 0.33 |
| Latent heat of fusion (kJ/kg) | 273 |
| Temperature, T (K) | 293 | 633 | 1073 | 1353 | 1713 | 2073 |
| Thermal conductivity, ks [W/(m∙K)] | 13.1 | 16.3 | 22.5 | 28.9 | 35.5 | 18.9 |
| Specific heat capacity, c [J/(kg∙K)] | 472 | 505 | 562 | 680 | 822 | 820 |
| Density,(kg/m3) | 7.9 | 7.8 | 7.7 | 7.5 | 7.4 | 7.1 |
| Element | Fe | Cr | Ni | Mo | Mn | Si | N | O | P | C | S |
|---|---|---|---|---|---|---|---|---|---|---|---|
| wt% | Balance | 16–18 | 11–13 | 2.5 | 1.5 | 0.8 | 0.1 | 0.1 | 0.04 | 0.03 | 0.02 |
| Sample (Hatch Spacing, μm) | Ṫ (105 K/s) | λFEM (μm) | λSEM (μm) |
|---|---|---|---|
| 75 | 2.62 | 1.25 | 0.86 |
| 100 | 2.44 | 1.28 | 0.95 |
| 150 | 2.23 | 1.32 | 1.08 |
| 200 | 2.18 | 1.33 | 1.15 |
© 2018 by the authors. Licensee MDPI, Basel, Switzerland. This article is an open access article distributed under the terms and conditions of the Creative Commons Attribution (CC BY) license (http://creativecommons.org/licenses/by/4.0/).
Share and Cite
Dong, Z.; Liu, Y.; Wen, W.; Ge, J.; Liang, J. Effect of Hatch Spacing on Melt Pool and As-built Quality During Selective Laser Melting of Stainless Steel: Modeling and Experimental Approaches. Materials 2019, 12, 50. https://doi.org/10.3390/ma12010050
Dong Z, Liu Y, Wen W, Ge J, Liang J. Effect of Hatch Spacing on Melt Pool and As-built Quality During Selective Laser Melting of Stainless Steel: Modeling and Experimental Approaches. Materials. 2019; 12(1):50. https://doi.org/10.3390/ma12010050
Chicago/Turabian StyleDong, Zhichao, Yabo Liu, Weibin Wen, Jingran Ge, and Jun Liang. 2019. "Effect of Hatch Spacing on Melt Pool and As-built Quality During Selective Laser Melting of Stainless Steel: Modeling and Experimental Approaches" Materials 12, no. 1: 50. https://doi.org/10.3390/ma12010050
APA StyleDong, Z., Liu, Y., Wen, W., Ge, J., & Liang, J. (2019). Effect of Hatch Spacing on Melt Pool and As-built Quality During Selective Laser Melting of Stainless Steel: Modeling and Experimental Approaches. Materials, 12(1), 50. https://doi.org/10.3390/ma12010050