Long-Term Atmospheric Corrosion Behavior of Epoxy Prime Coated Aluminum Alloy 7075-T6 in Coastal Environment


Abstract
:1. Introduction
2. Experimental
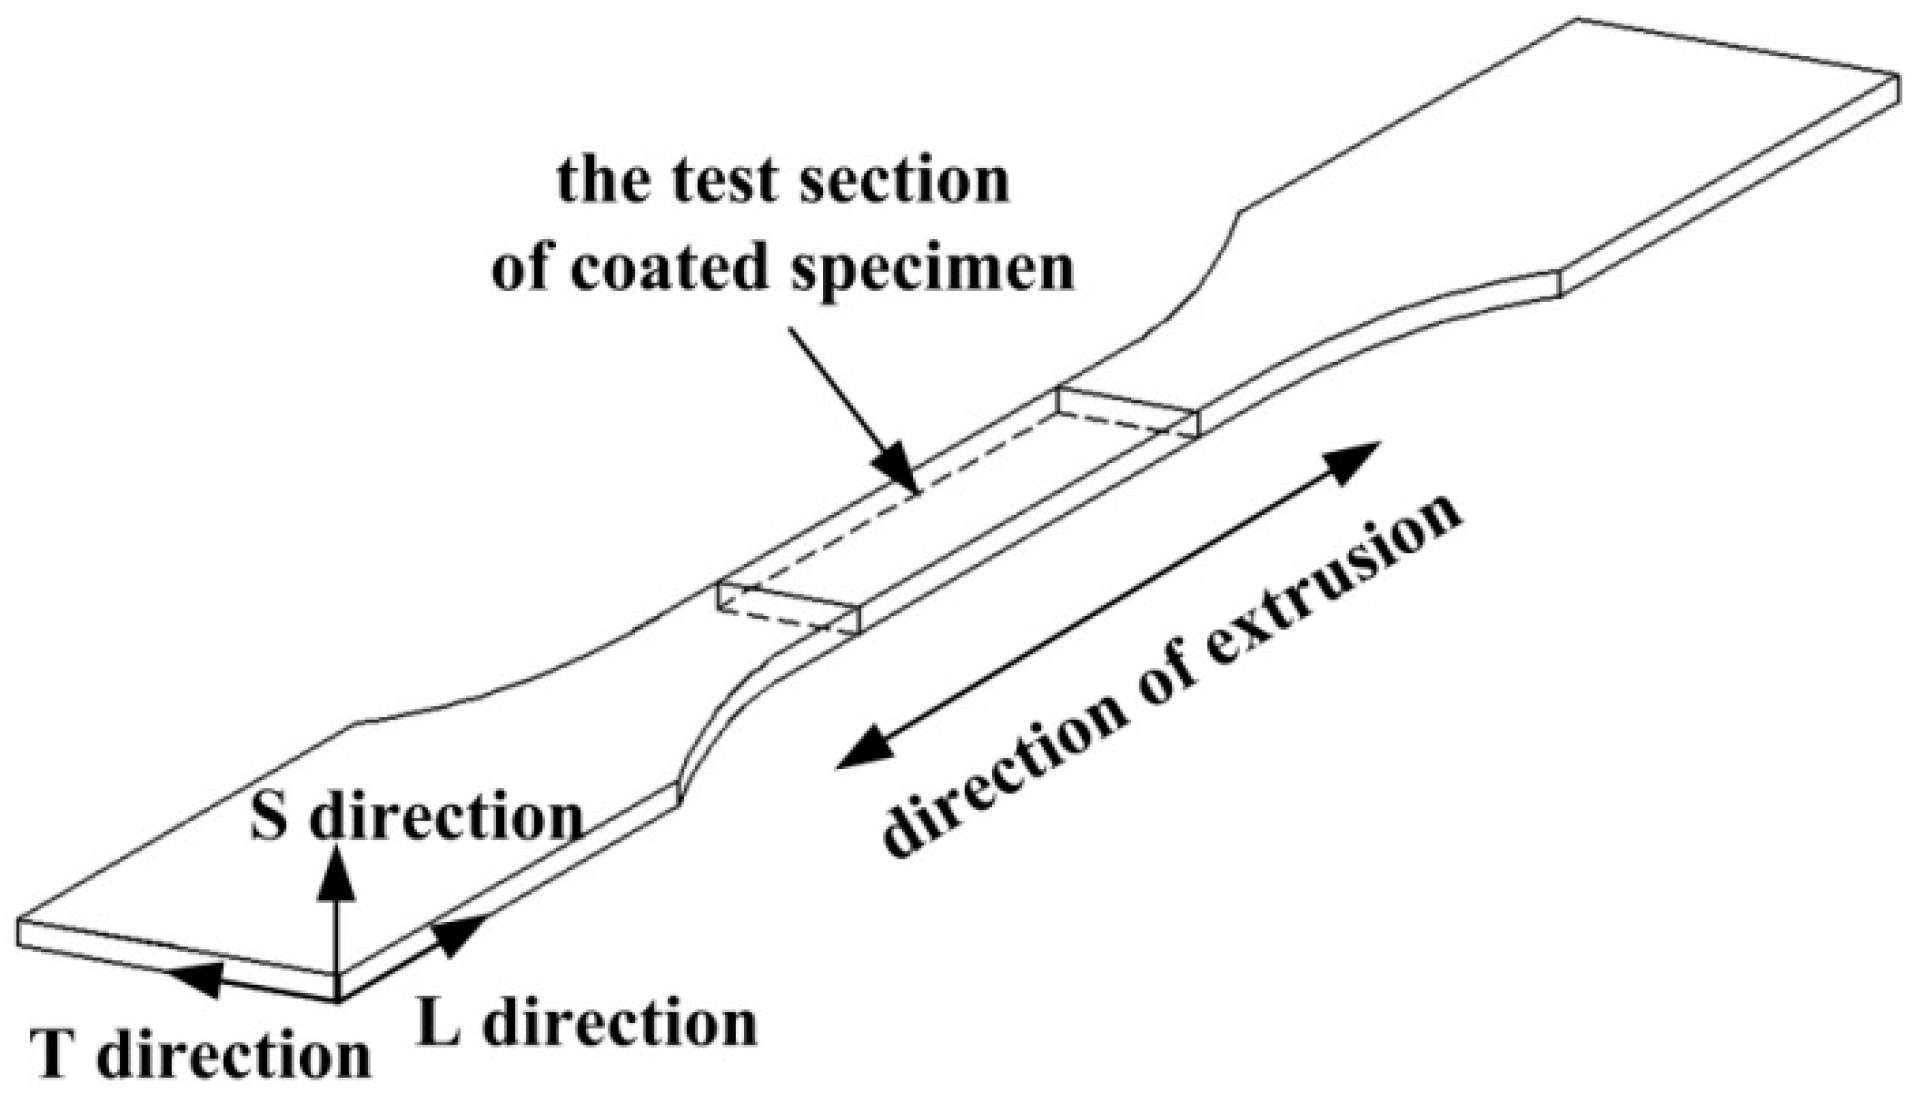
2.1. Specimens
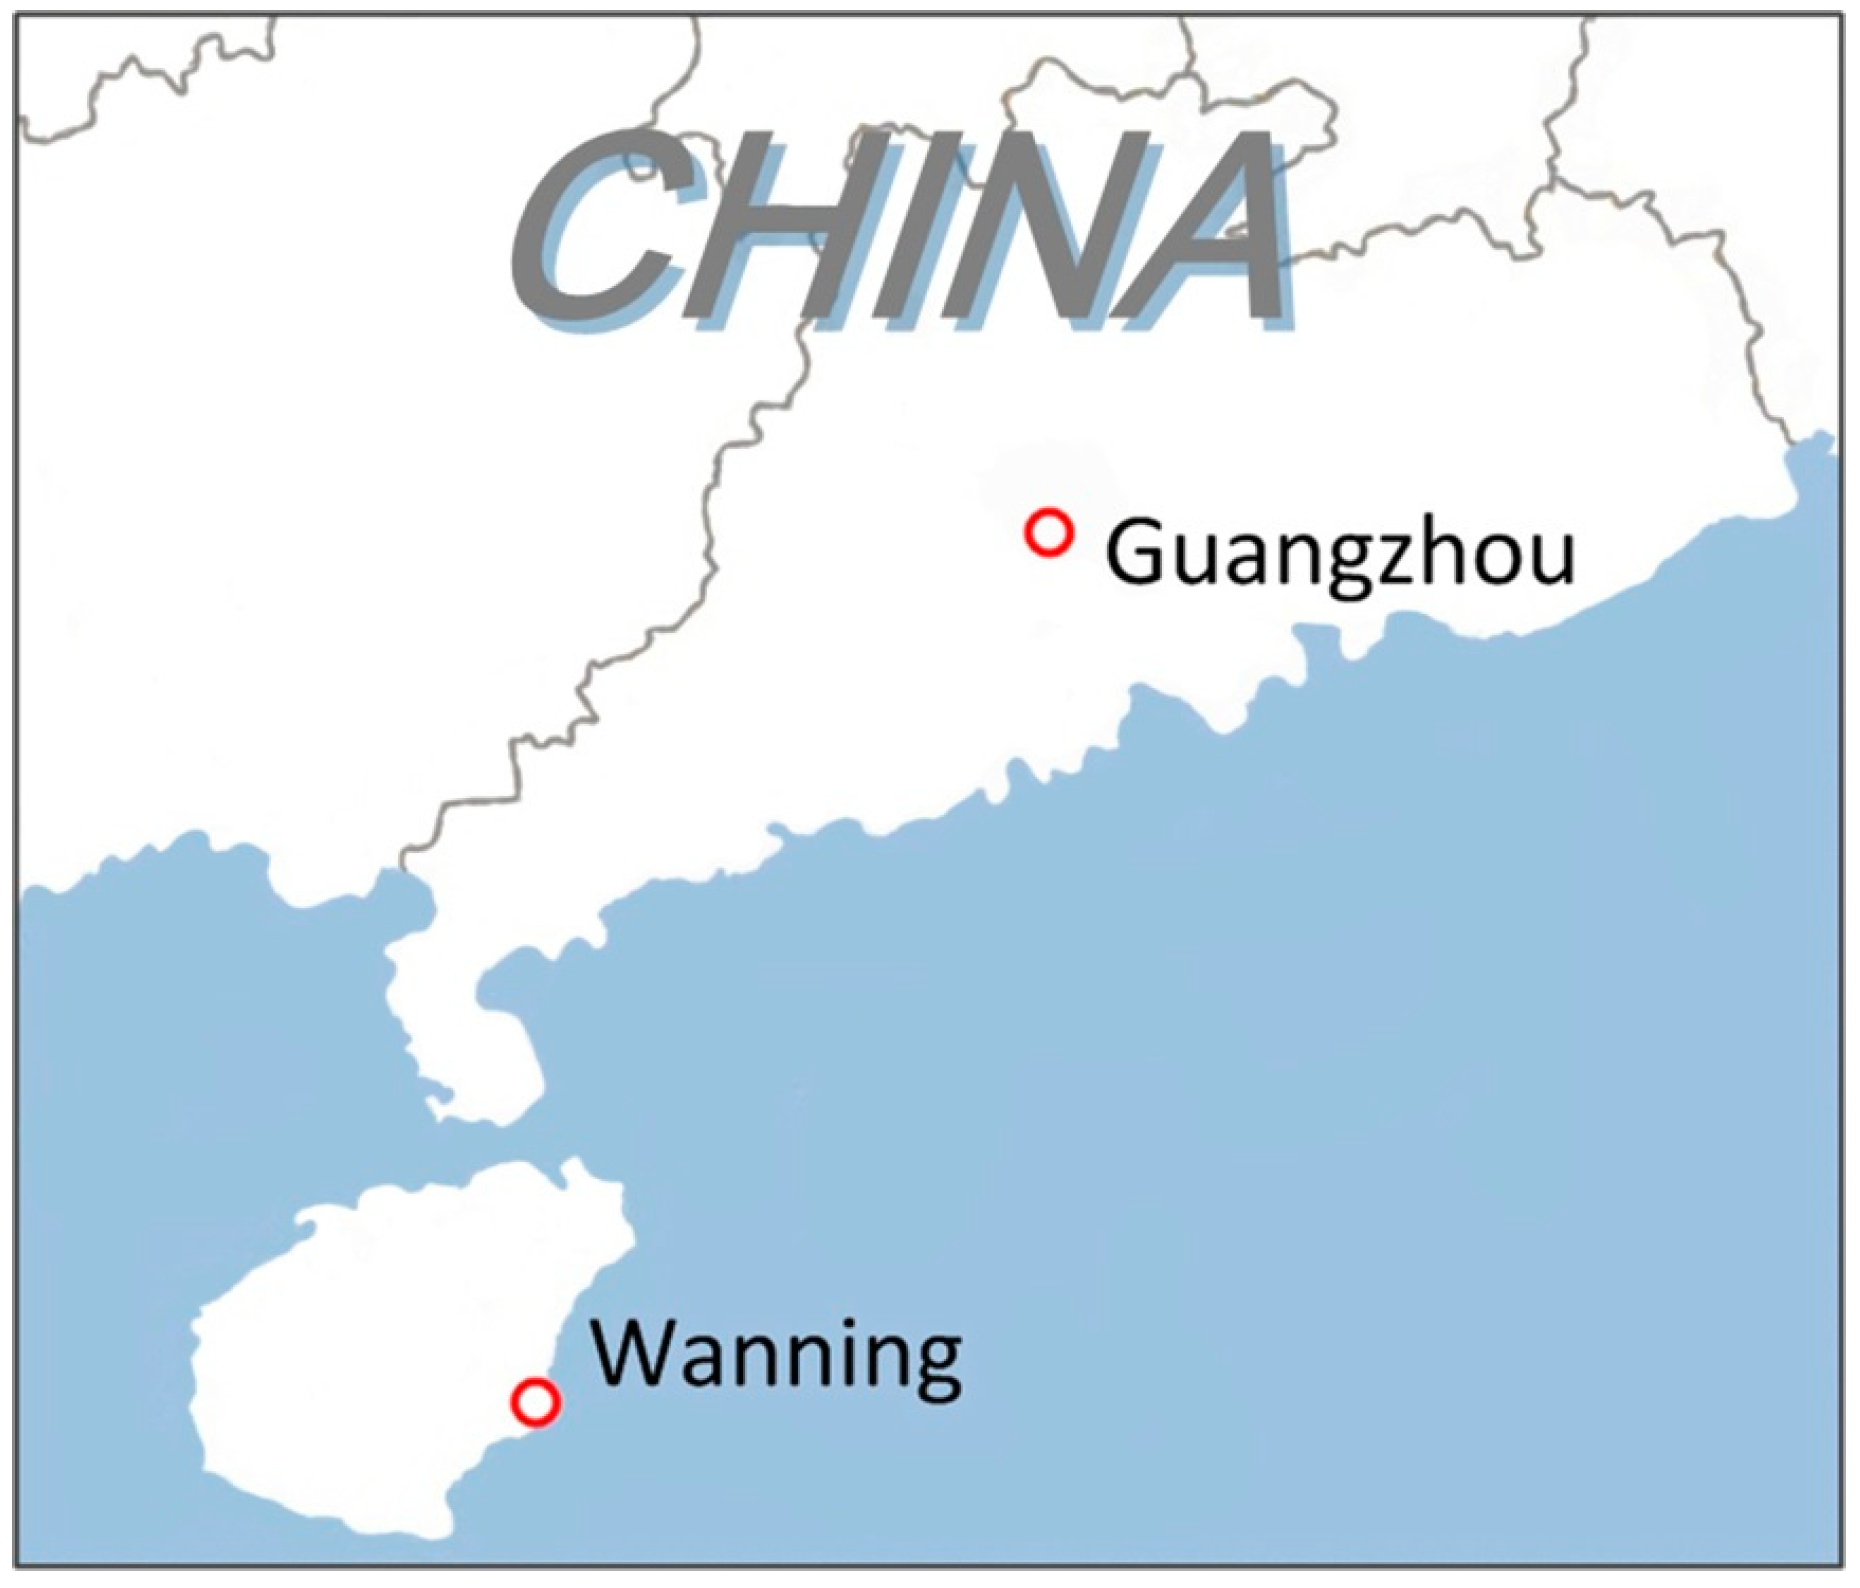
2.2. Field Exposure Test
2.3. Surface and Corrosion Products Analyses
2.4. Electrochemical Impedance Measurement
2.5. Sectional Analyses
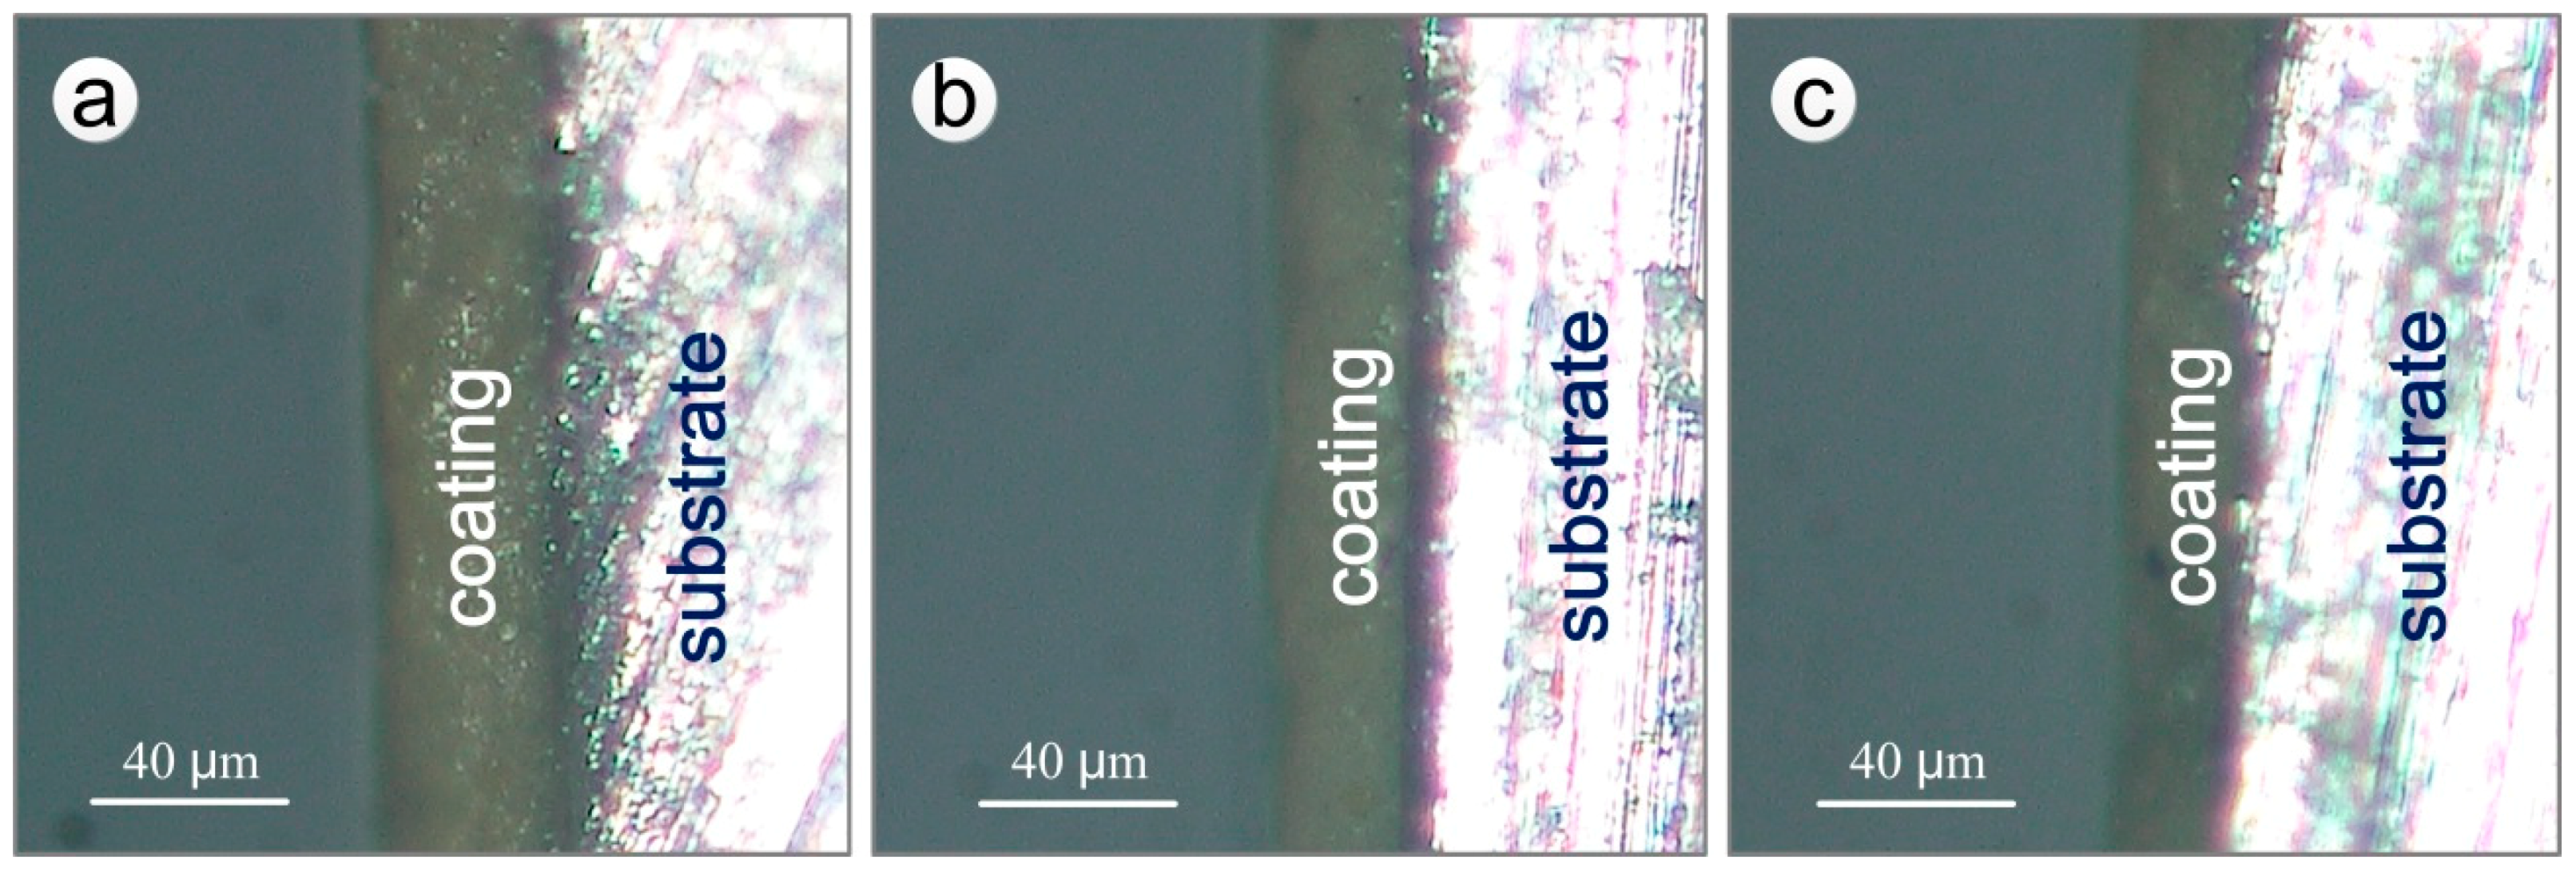
2.5.1. Measurement of Thickness of Coating
2.5.2. Analysis of Exfoliation Corrosion Resistance of Aluminum Alloy Substrate
2.5.3. Corrosion Failure Analysis of Aluminum Alloy Coating System
3. Results and Discussion
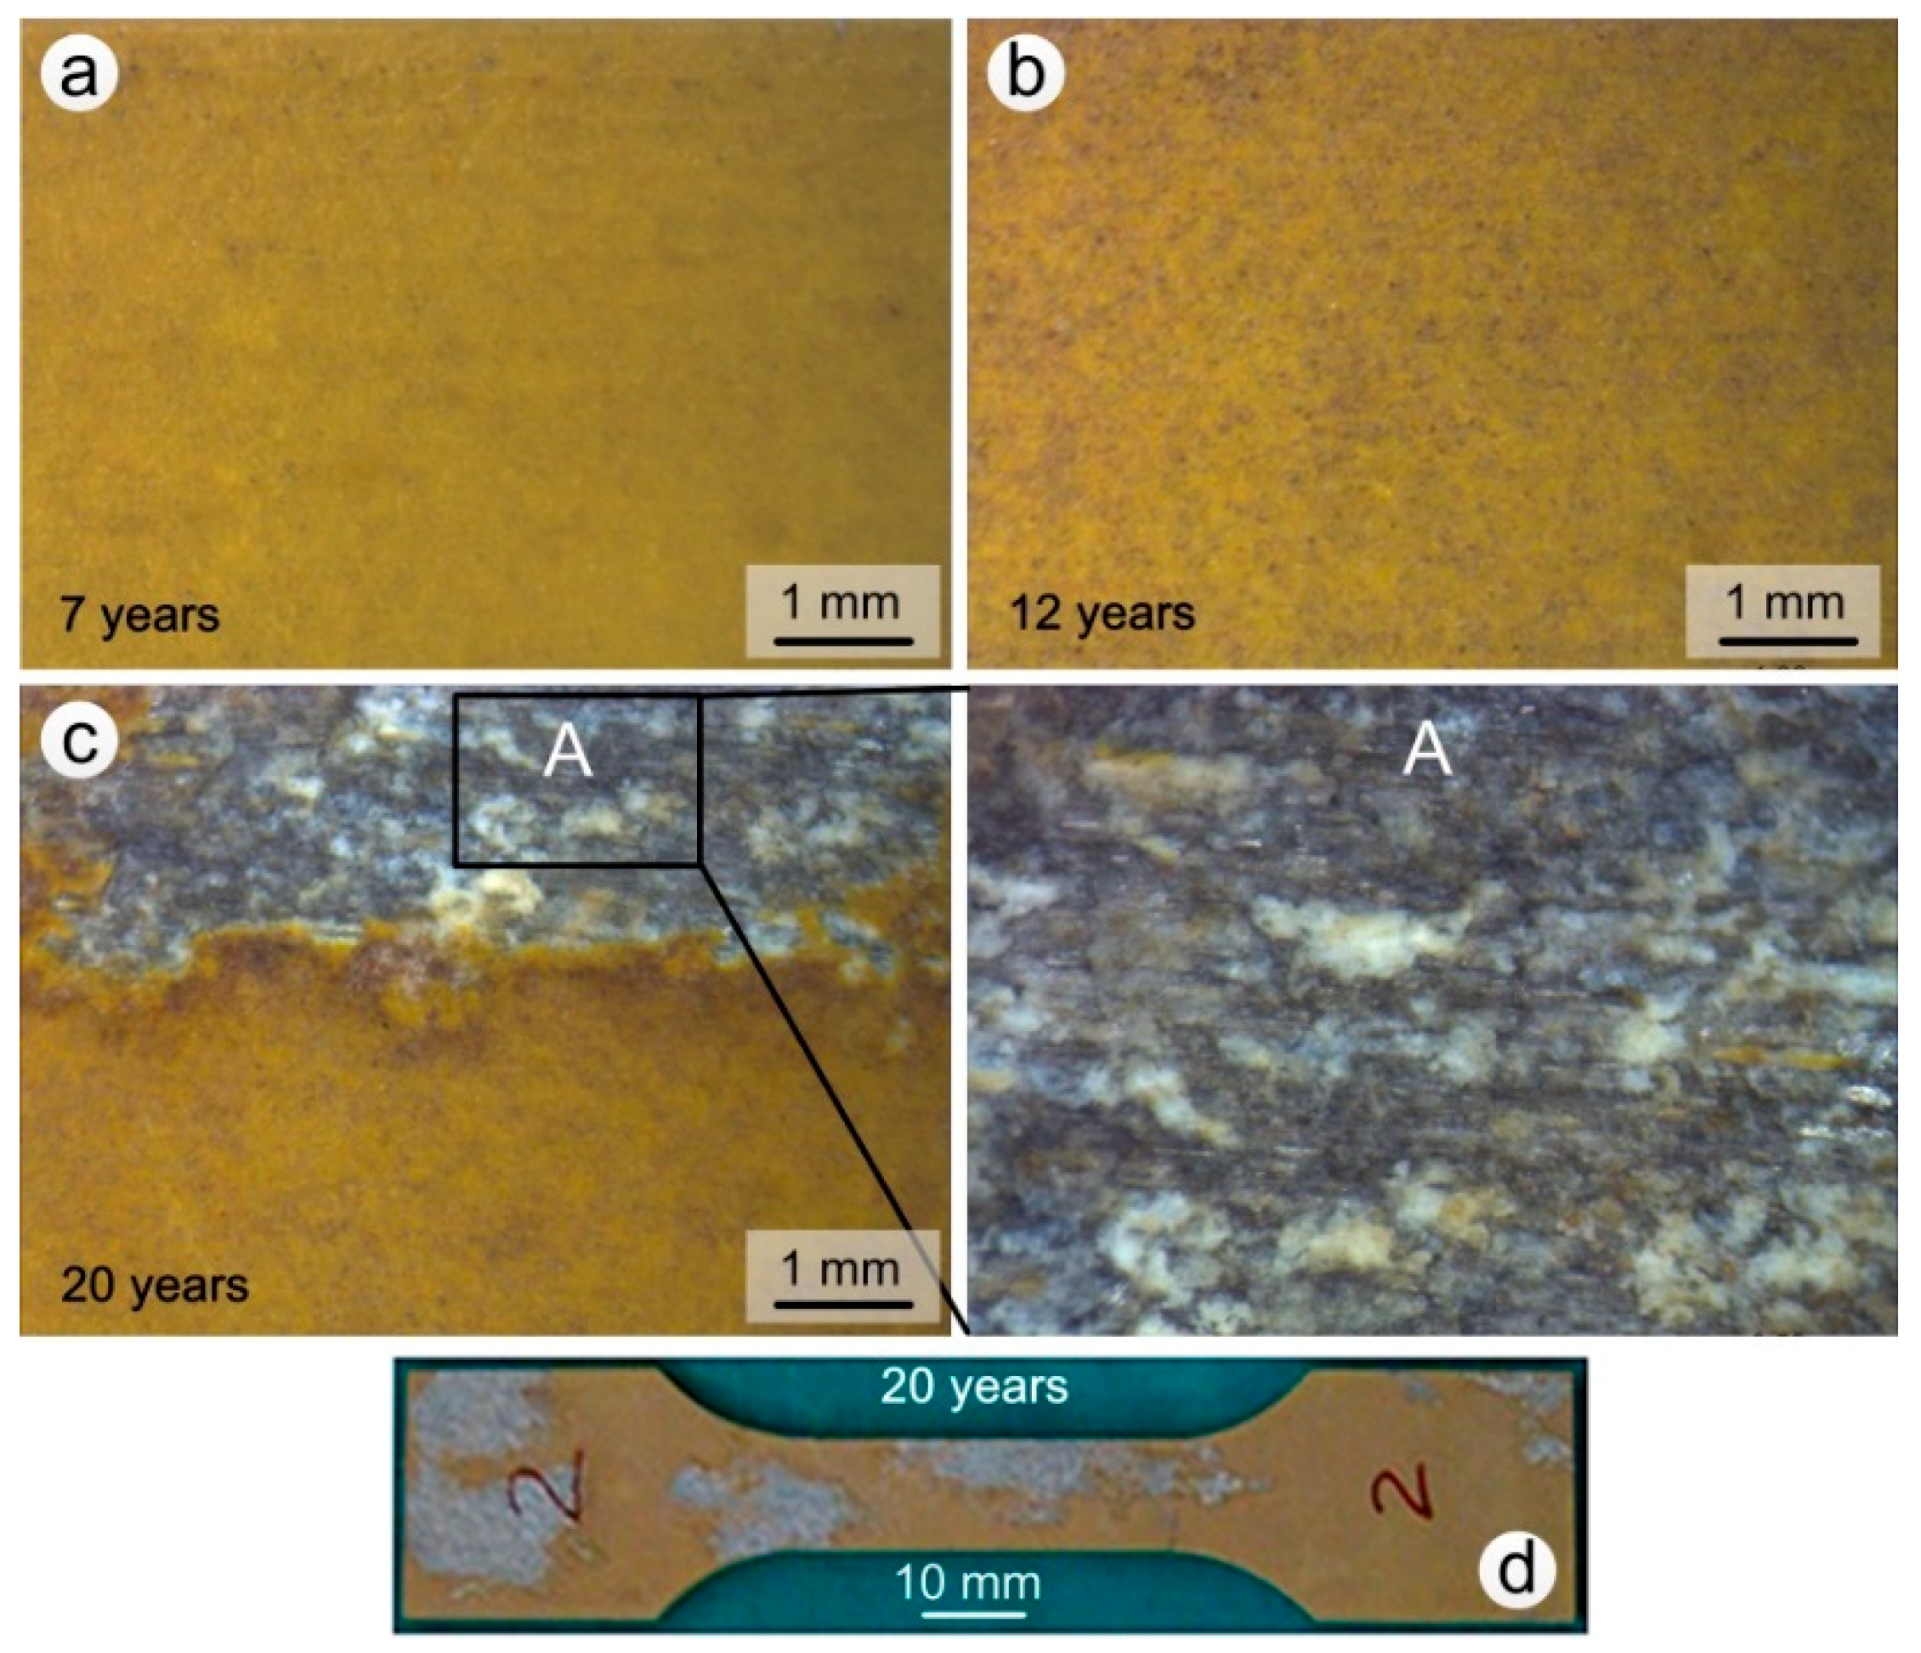
3.1. Surface Appearance and Characterization
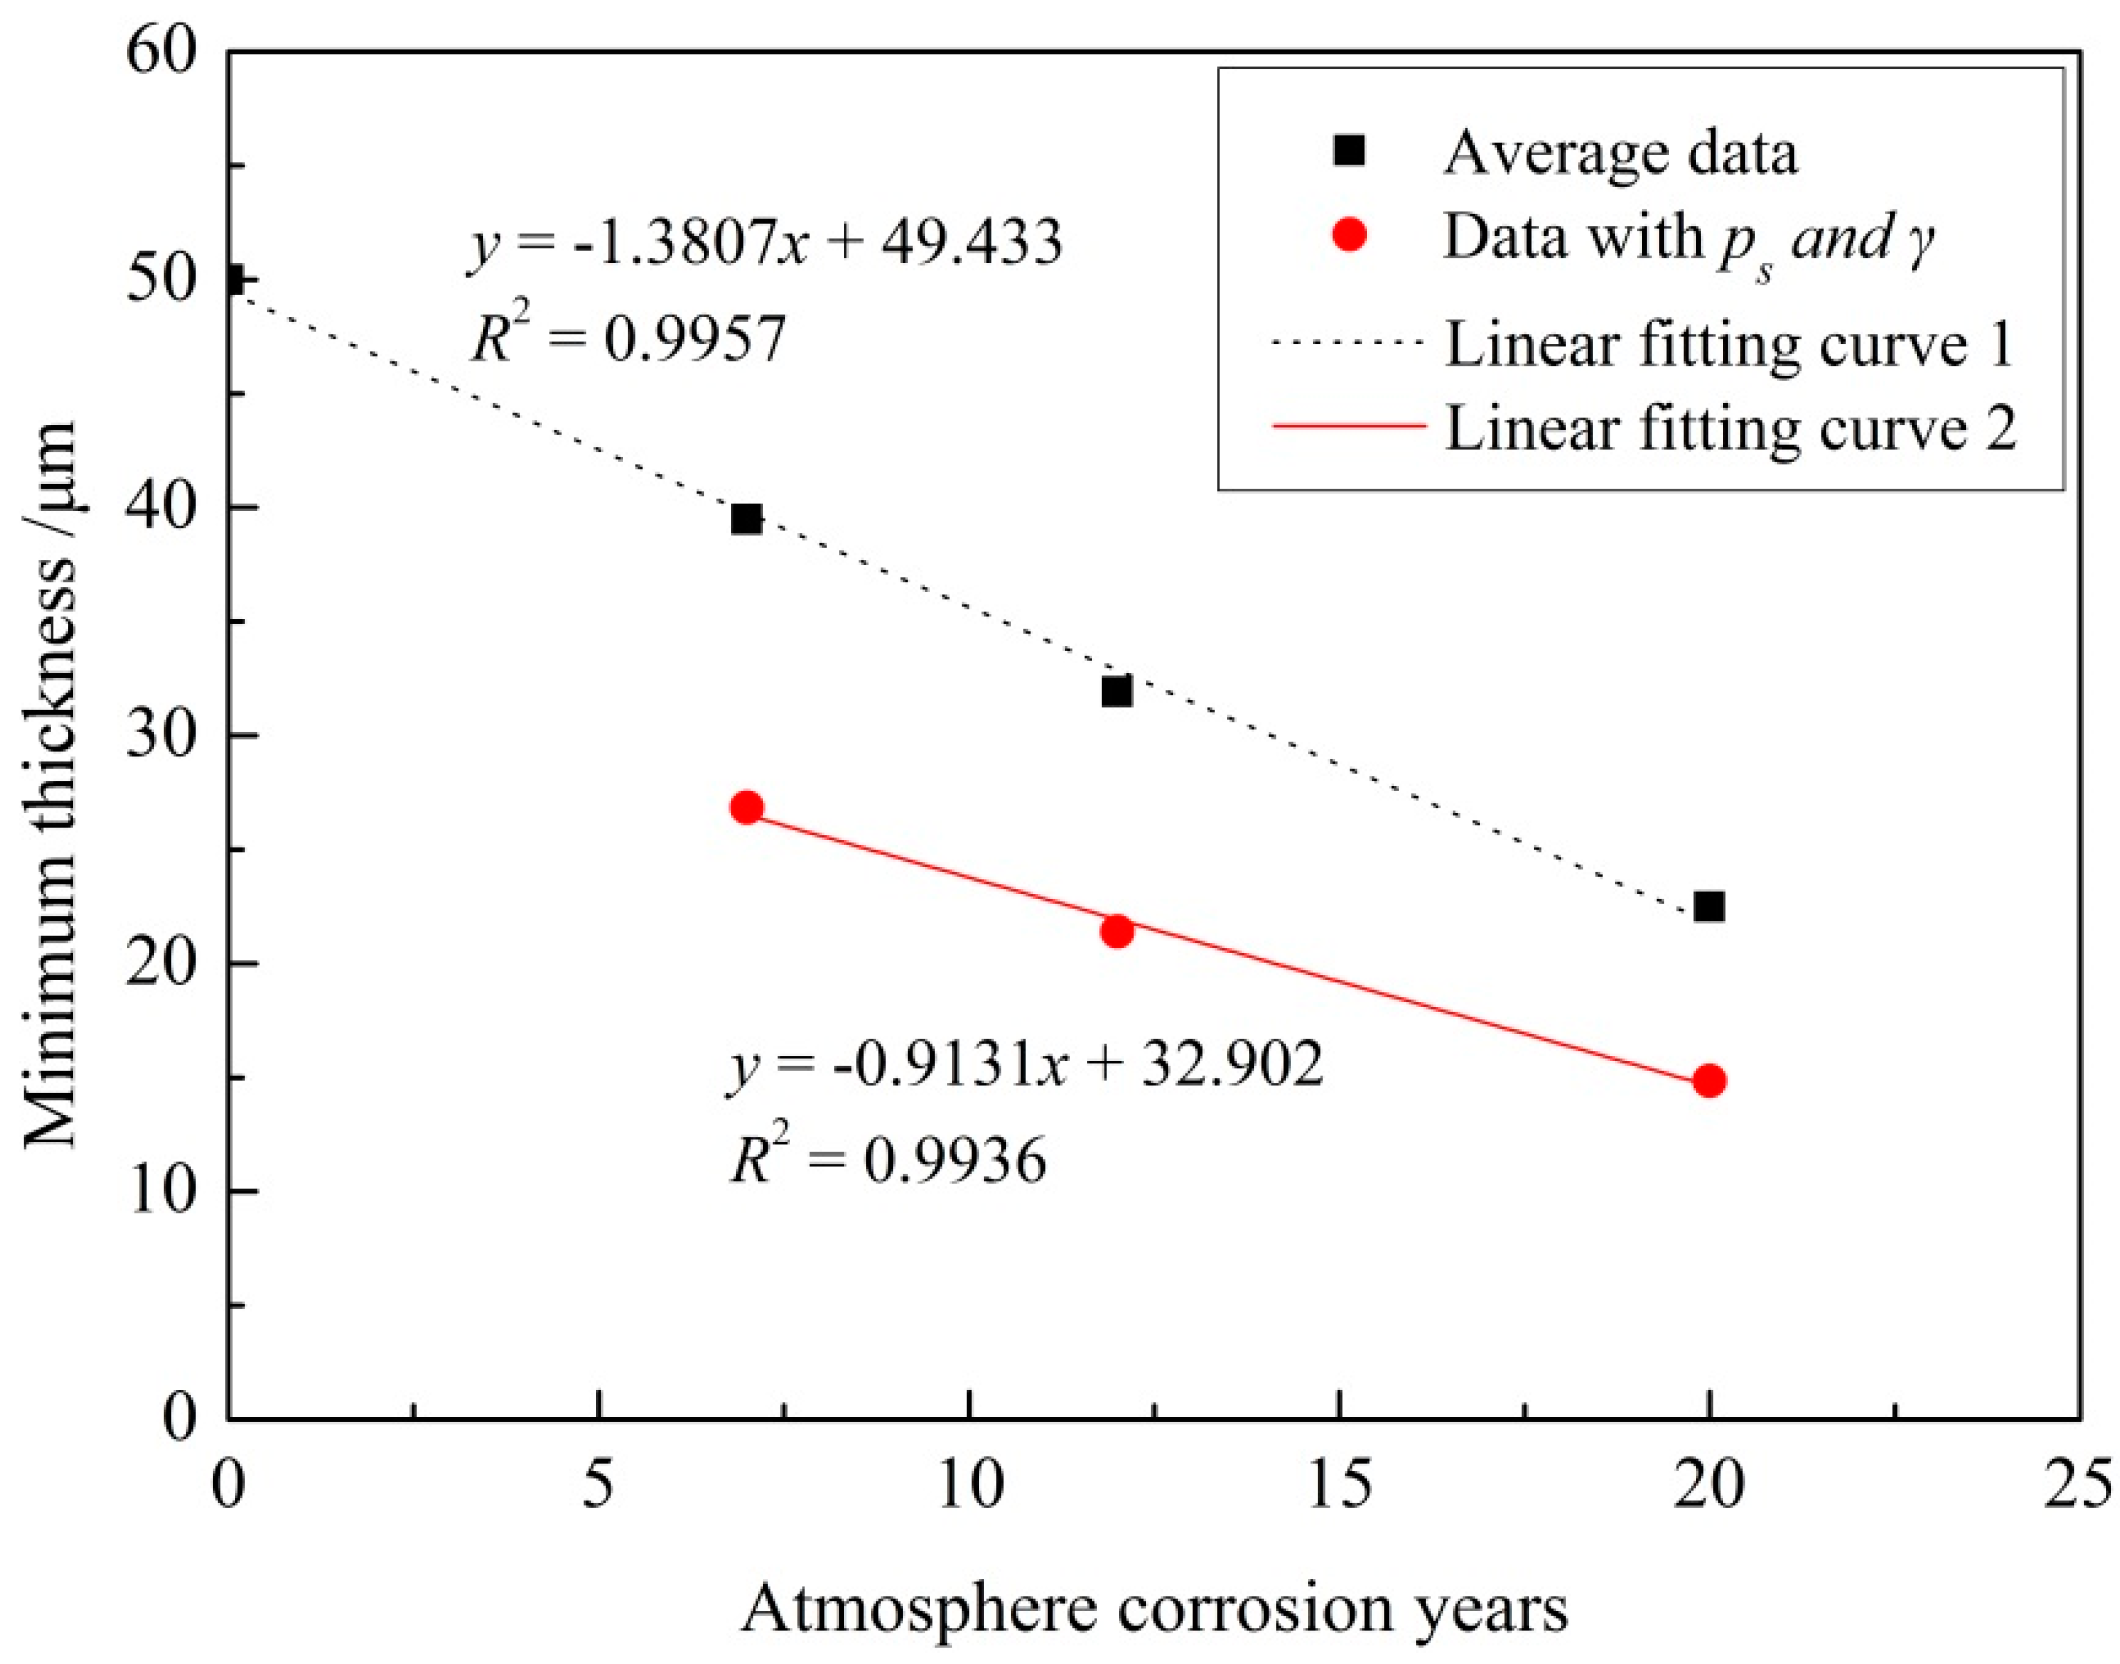
3.2. Statistical Analysis of the Remaining Thickness of Coating
- (1)
- Normal distribution:
- (2)
- Log-normal distribution:
- (3)
- Gumbel distribution:
- (4)
- Logistic distribution:
- (5)
- Weibull distribution:
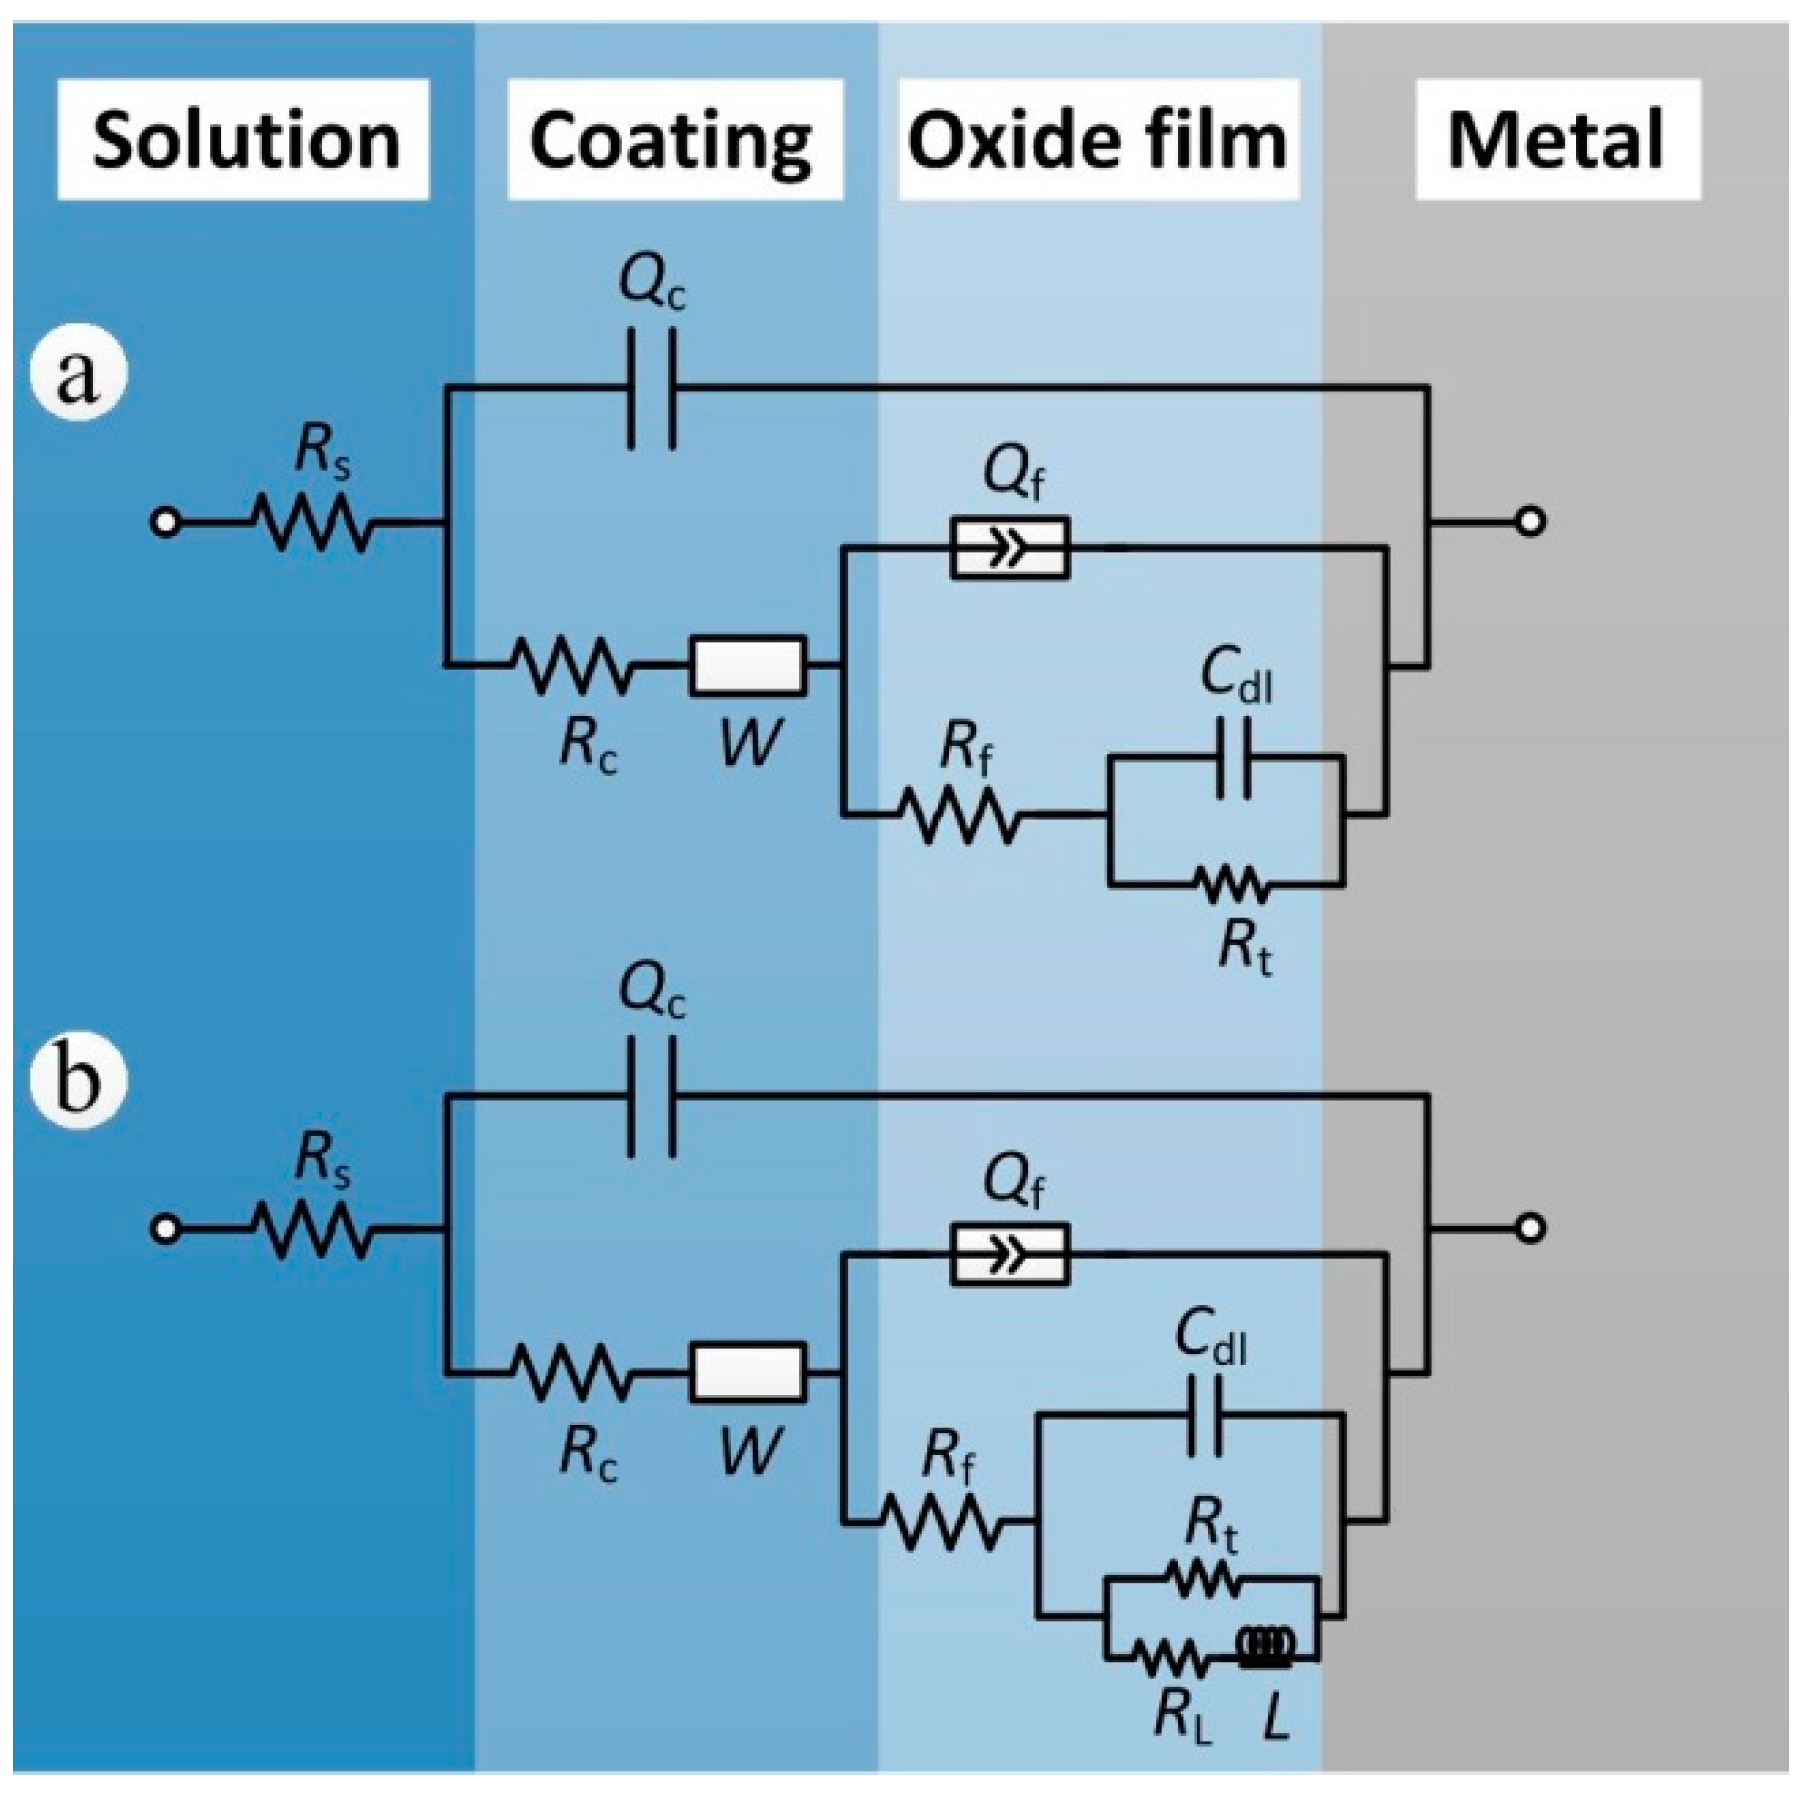
3.3. Electrochemical Characterization of Coated Samples with Different Exposure Years
- (1)
- Cathodic disbondment: Under the conditions of atmospheric corrosion, the anodic oxide film or aluminum alloy substrate under the coating endures electrochemical corrosion. The oxygen reduction reaction (Equation (9)) occurs on the cathode and the pH in the cathode reign increases significantly. The strong basic environment damages the metal oxide or polymer-coating of the interface, which affects the bonding of the coating to the anodic oxide film, and then causes the cracking [35,36,37].
- (2)
- Photoaging of coatings: Small molecules such as ketones, alcohols and acids can be washed away by water during photoaging (ultraviolet irradiation), continuously changing the composition of the coating, which therefore contracts and is subject to a decrease in thickness. This causes and embrittlement of the coating [38]. In addition, the loss of the polymer from the coating will effectively increase the volume concentration of the pigments on the surface of coating. Thus, the surface of coating will become relatively brittle while the inner layer of coating is still relatively elastic, which leads to the superficial and inner cracking of the coating.
- (3)
- Temperature alterations: The seasonal and daily alternations of atmospheric temperature cause the expansion and contraction of the coating, and the change of coating tension and internal stress, which leads to the decrease of adhesion, cracking and destruction of coating [39].
- (4)
- Effect of SO2 air pollutant: The air pollutant SO2 can significantly reduce the adhesion of the coating, resulting in cracking between the coating and anodic oxide film. When SO2 and H2O are simultaneously present, the destruction of the coating is more obvious [40].
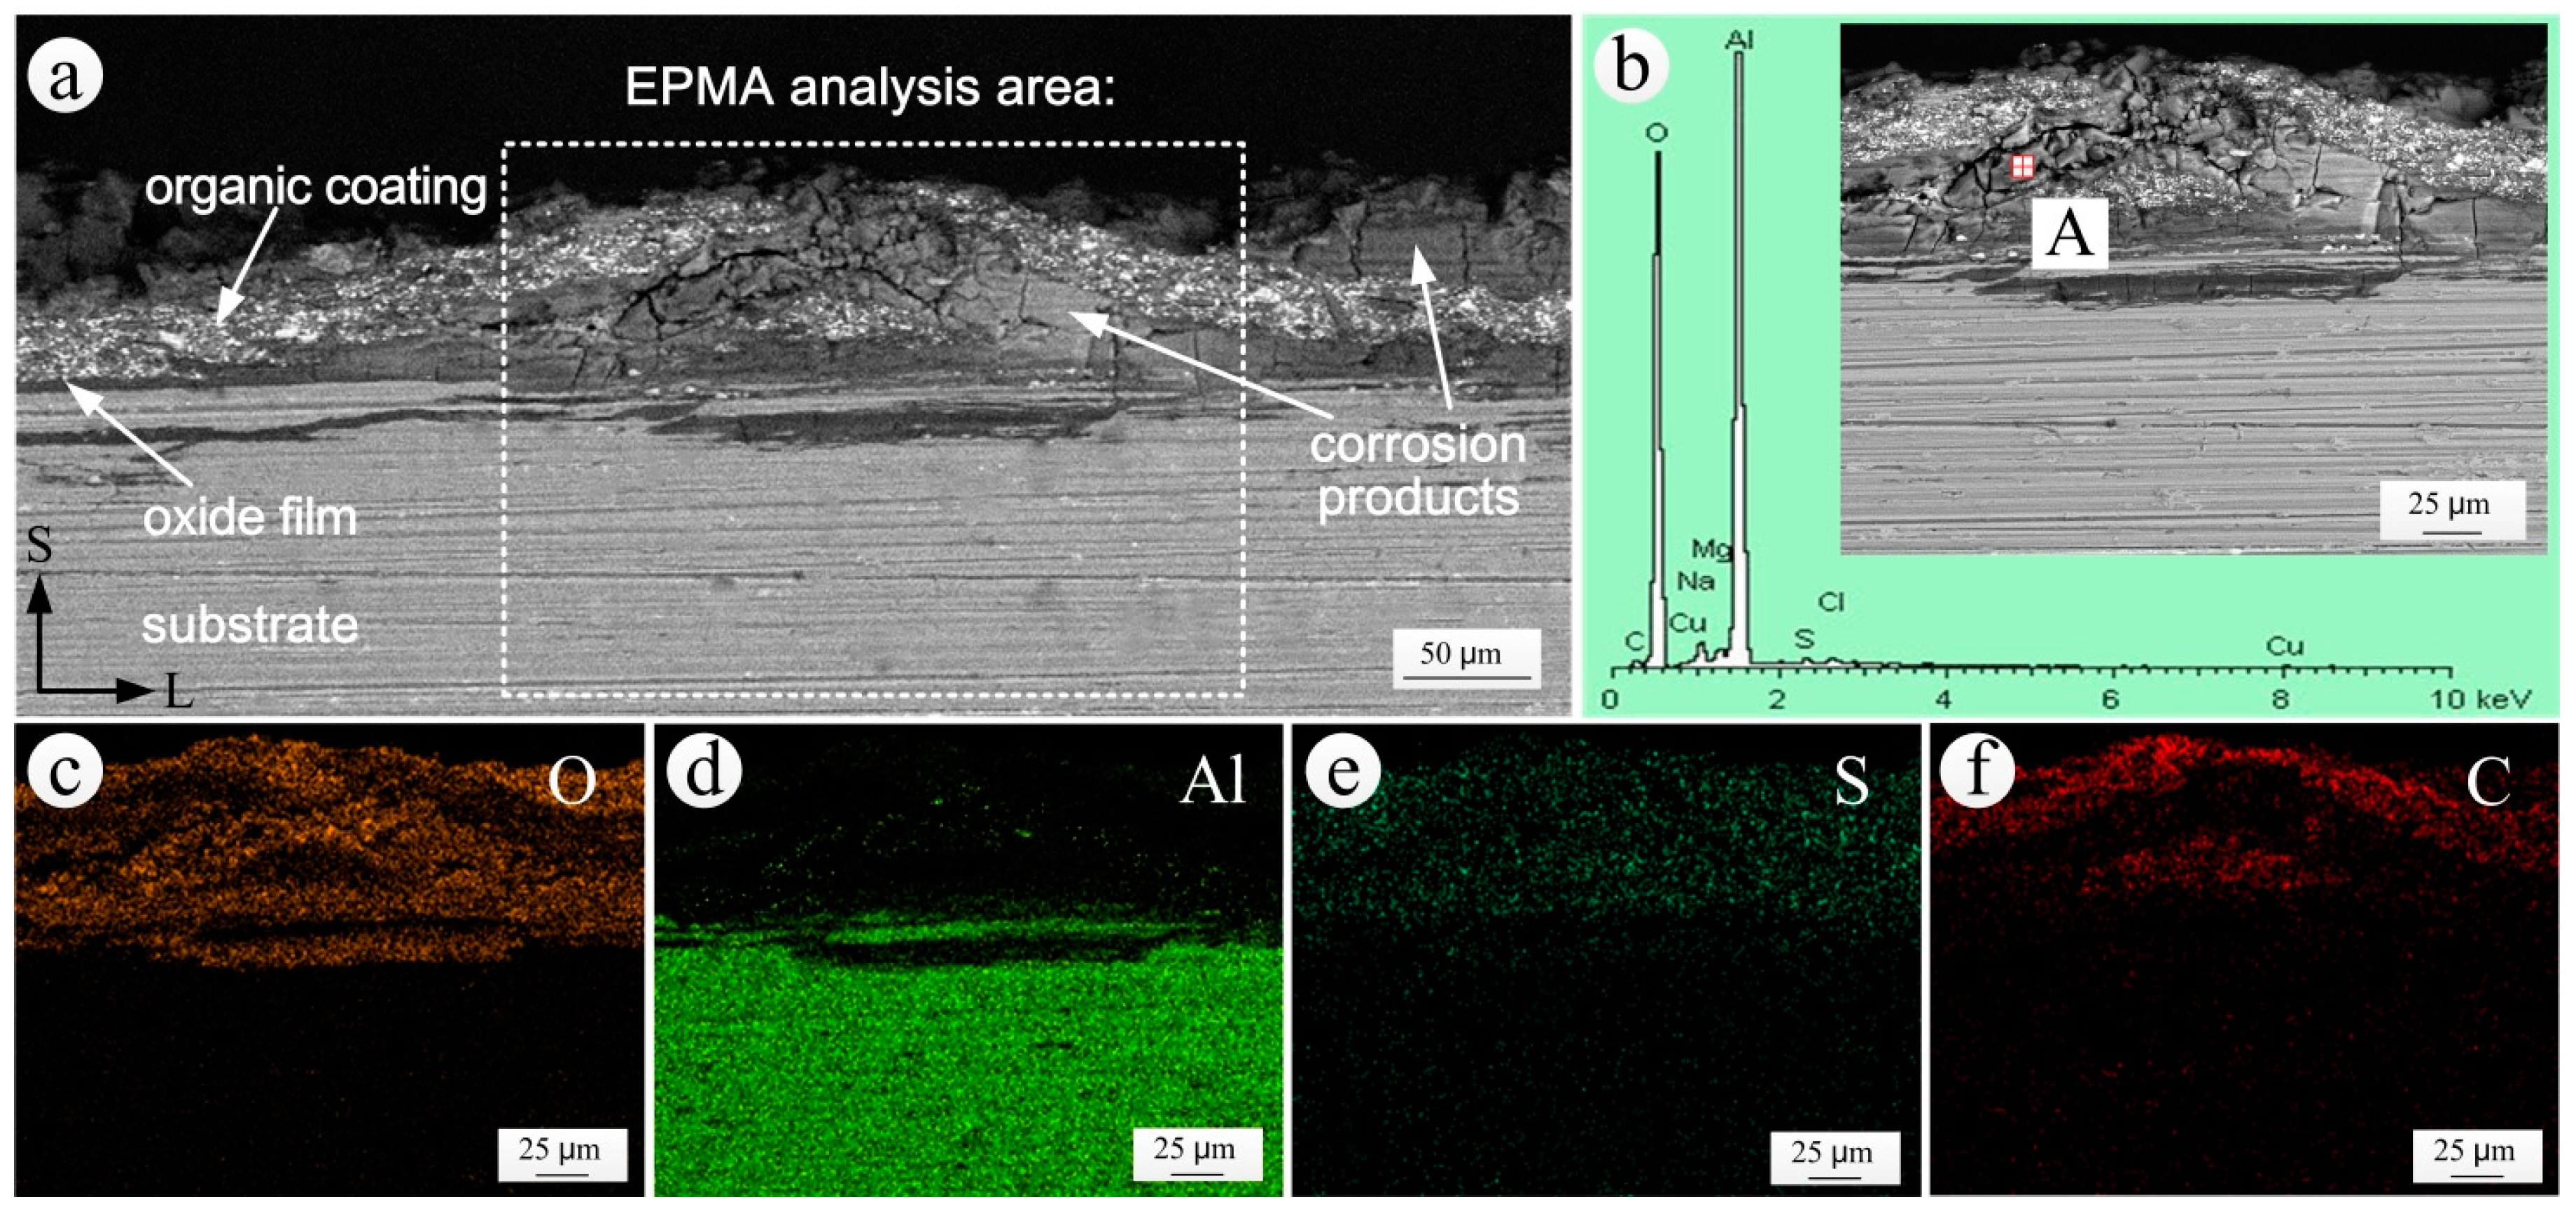
3.4. Analysis of the S-L Section of Coating Bubbling Area
3.5. Analysis of Exfoliation Corrosion of the Aluminum Alloy Substrate
3.5.1. Exfoliation Corrosion Resistance Analysis of the Aluminum Alloy Substrate
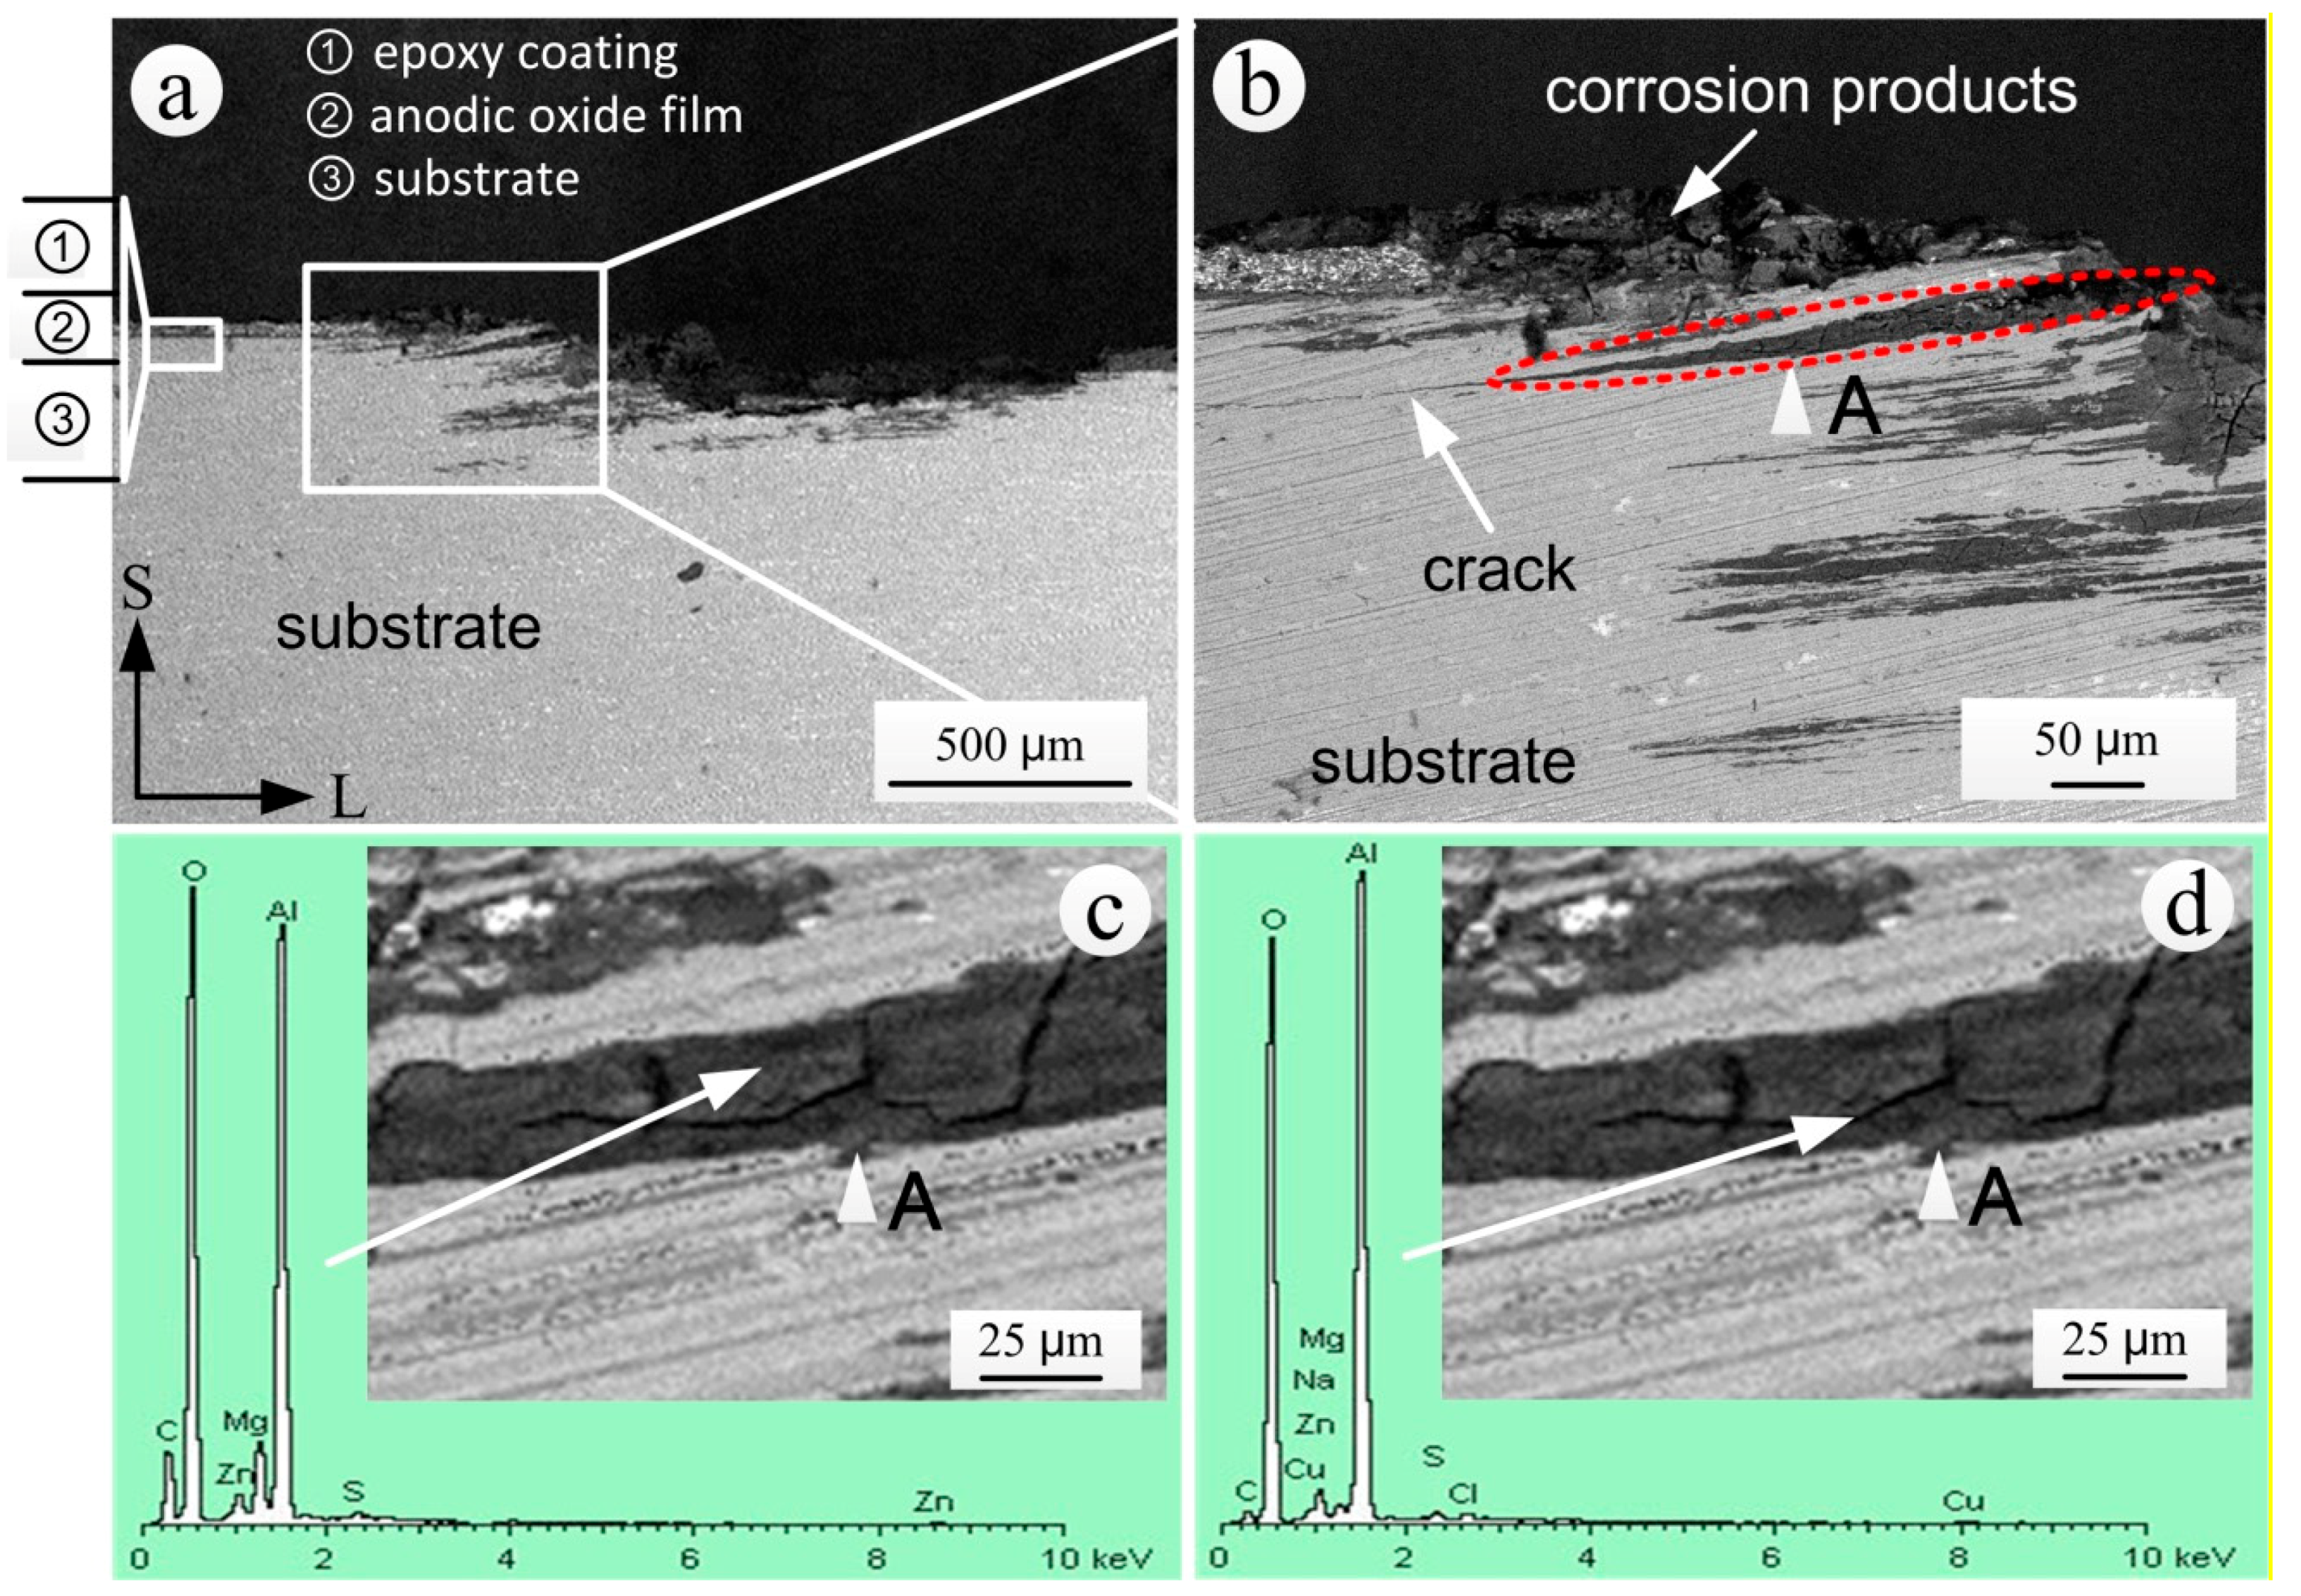
3.5.2. Propagation Characterization Analysis of Exfoliation Corrosion
4. Conclusions
- (1)
- After exposure for 20 years in the Wanning test sites, the epoxy coating had been partially destroyed, and the exfoliation corrosion had occurred on the extruded 7075-T6 aluminum alloy substrate. The remaining thicknesses of epoxy coatings for macroscopically intact coating areas followed a normal distribution and decreased linearly.
- (2)
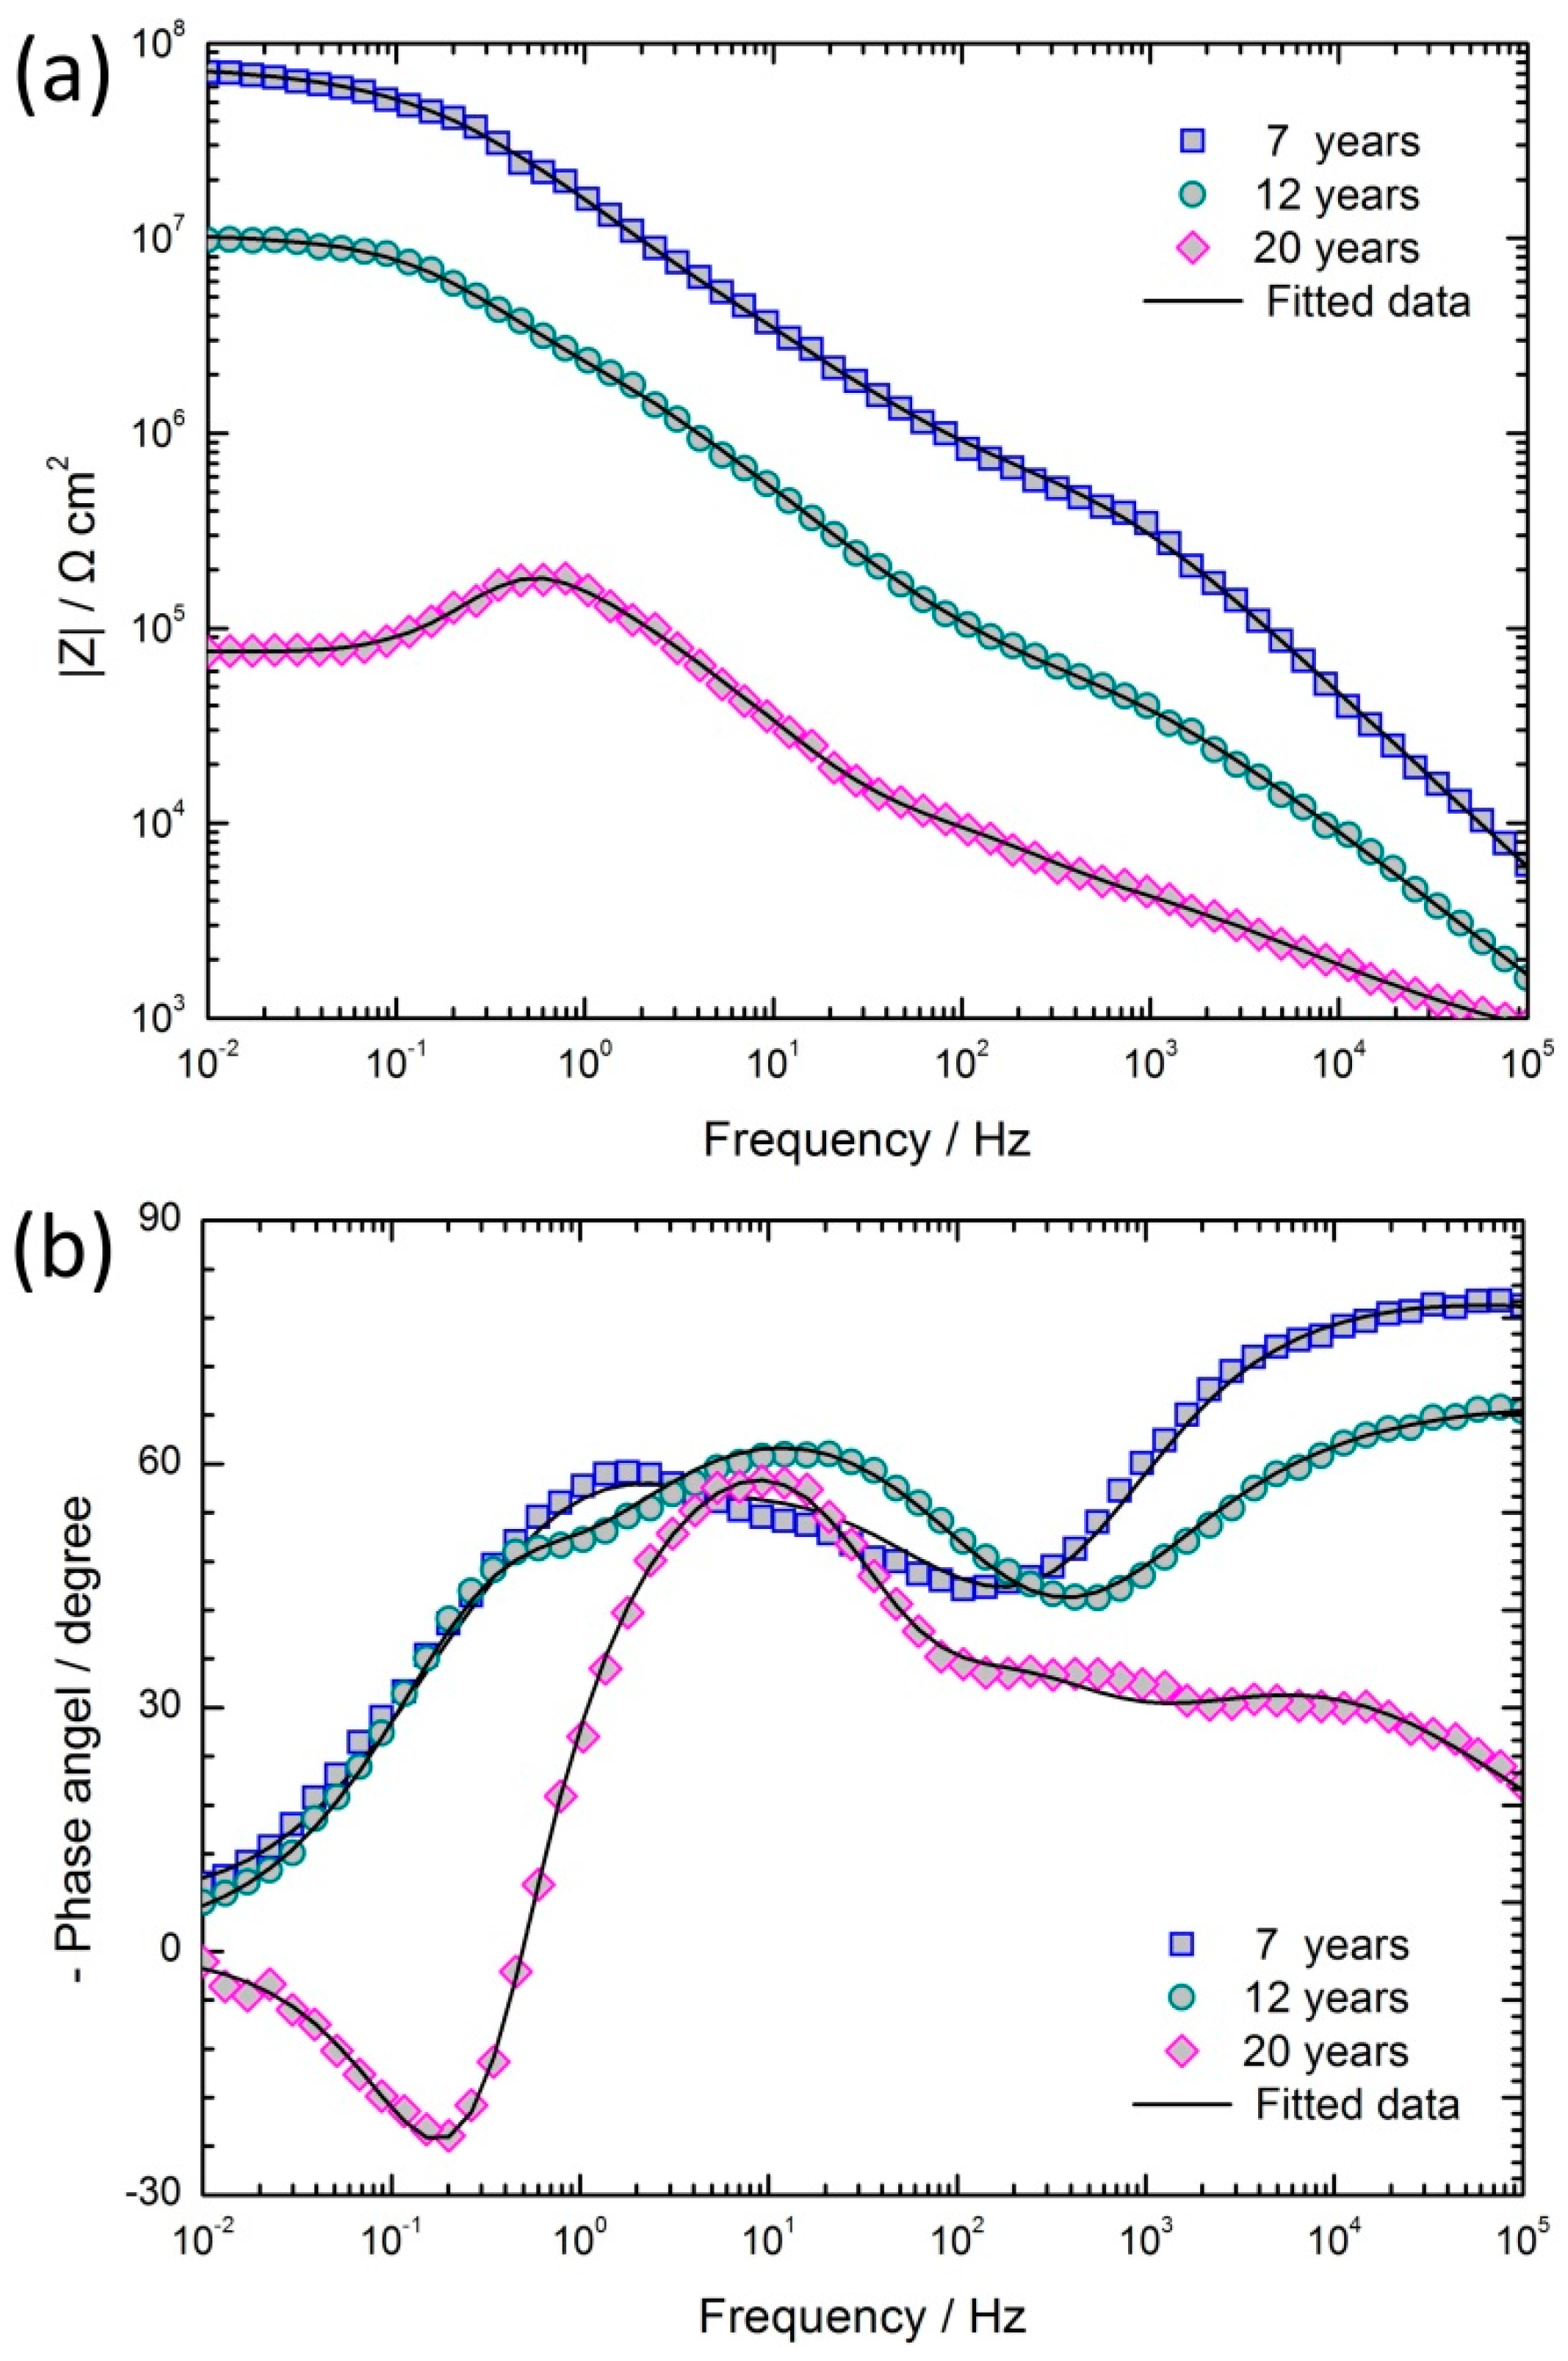
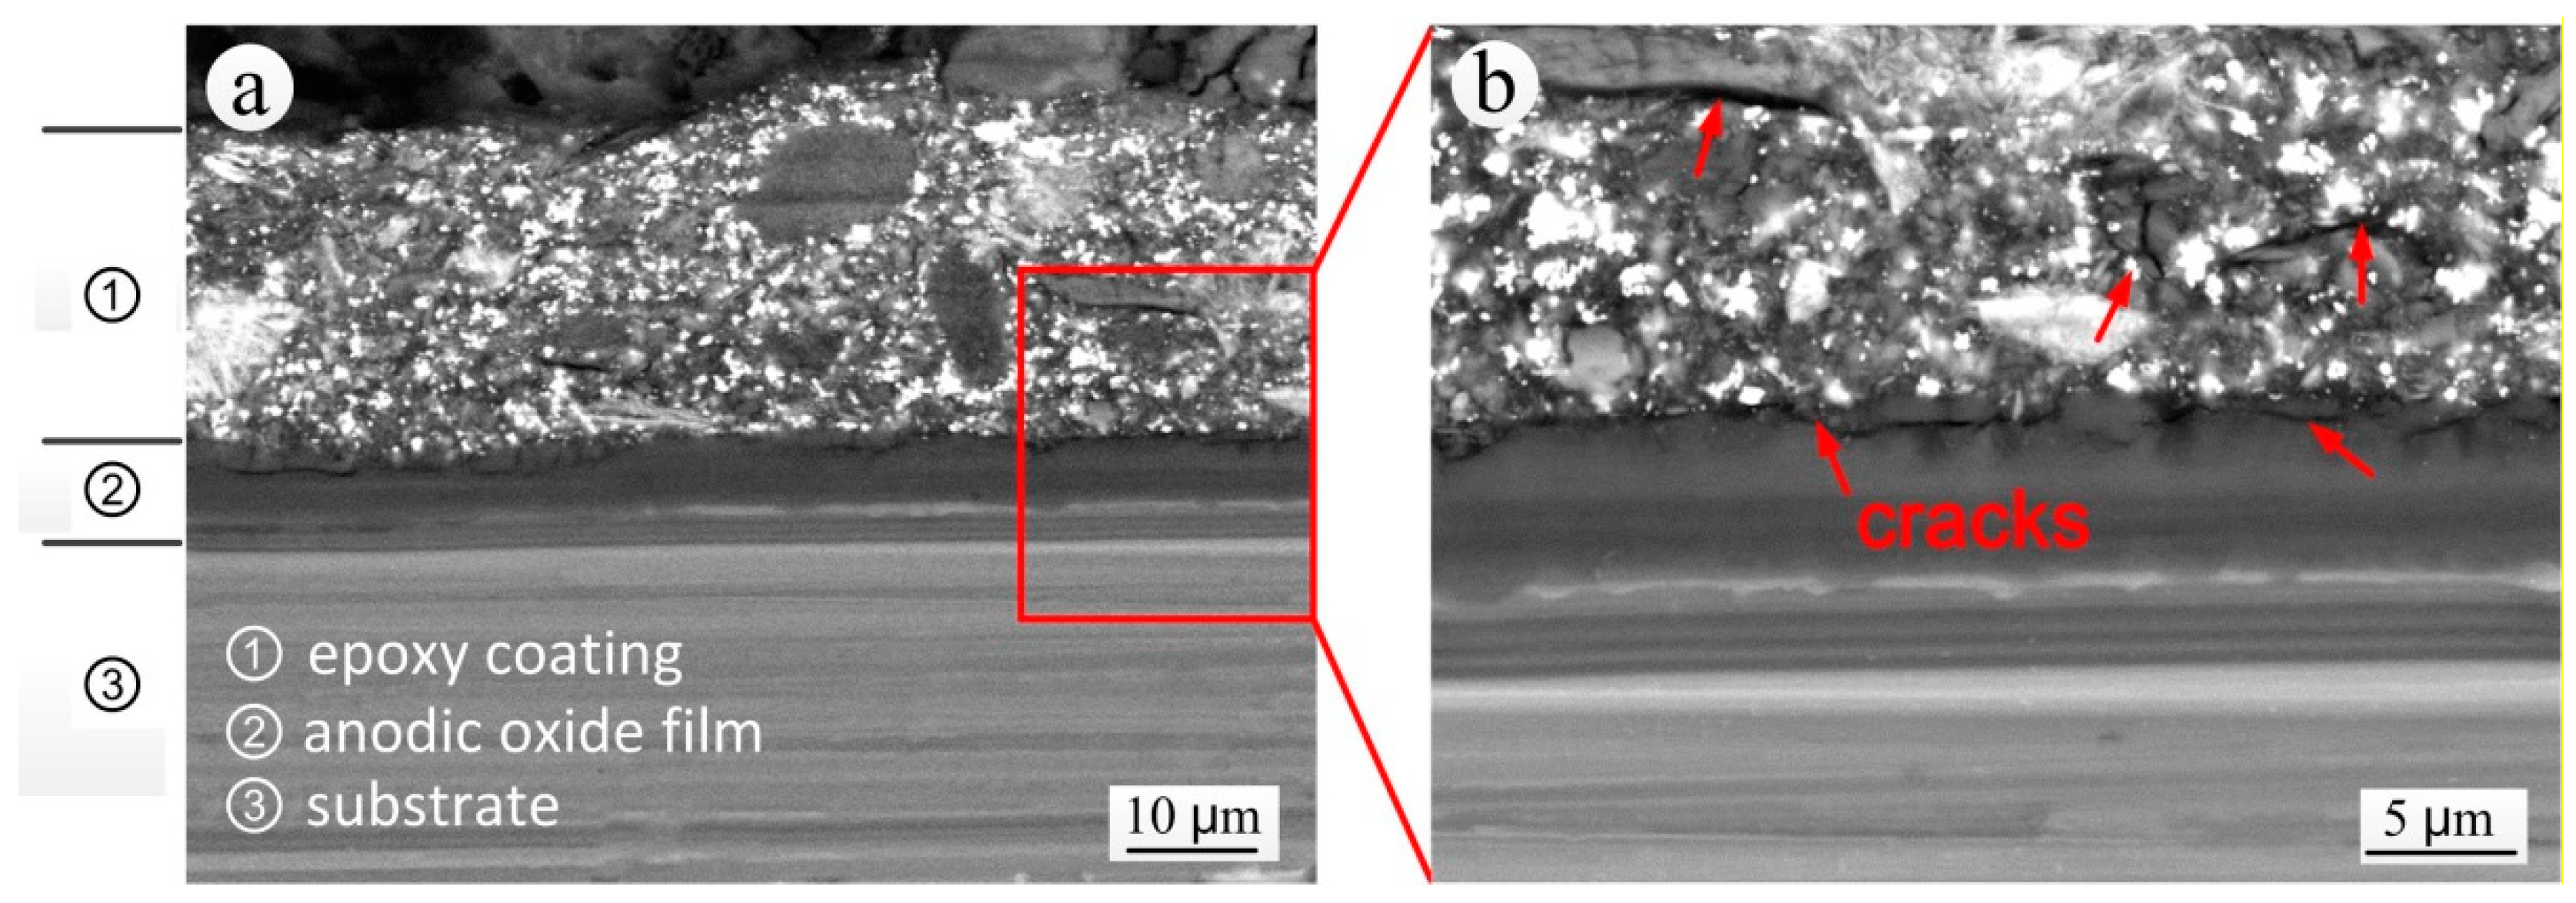
- The corrosion resistance of epoxy coatings decreased with the increase of exposure time. After 12 years of exposure, the coating still had a protective effect. After 20 years, although the coating was apparently intact, it had lost its protective characteristics and EIS results showed the occurrence of inductive characteristics. The reason was the formation of cracks between the local coating and the anodic oxide film and of cracks within the coating, which reduced the resistance of the coating to aggressive mediums.
- (3)
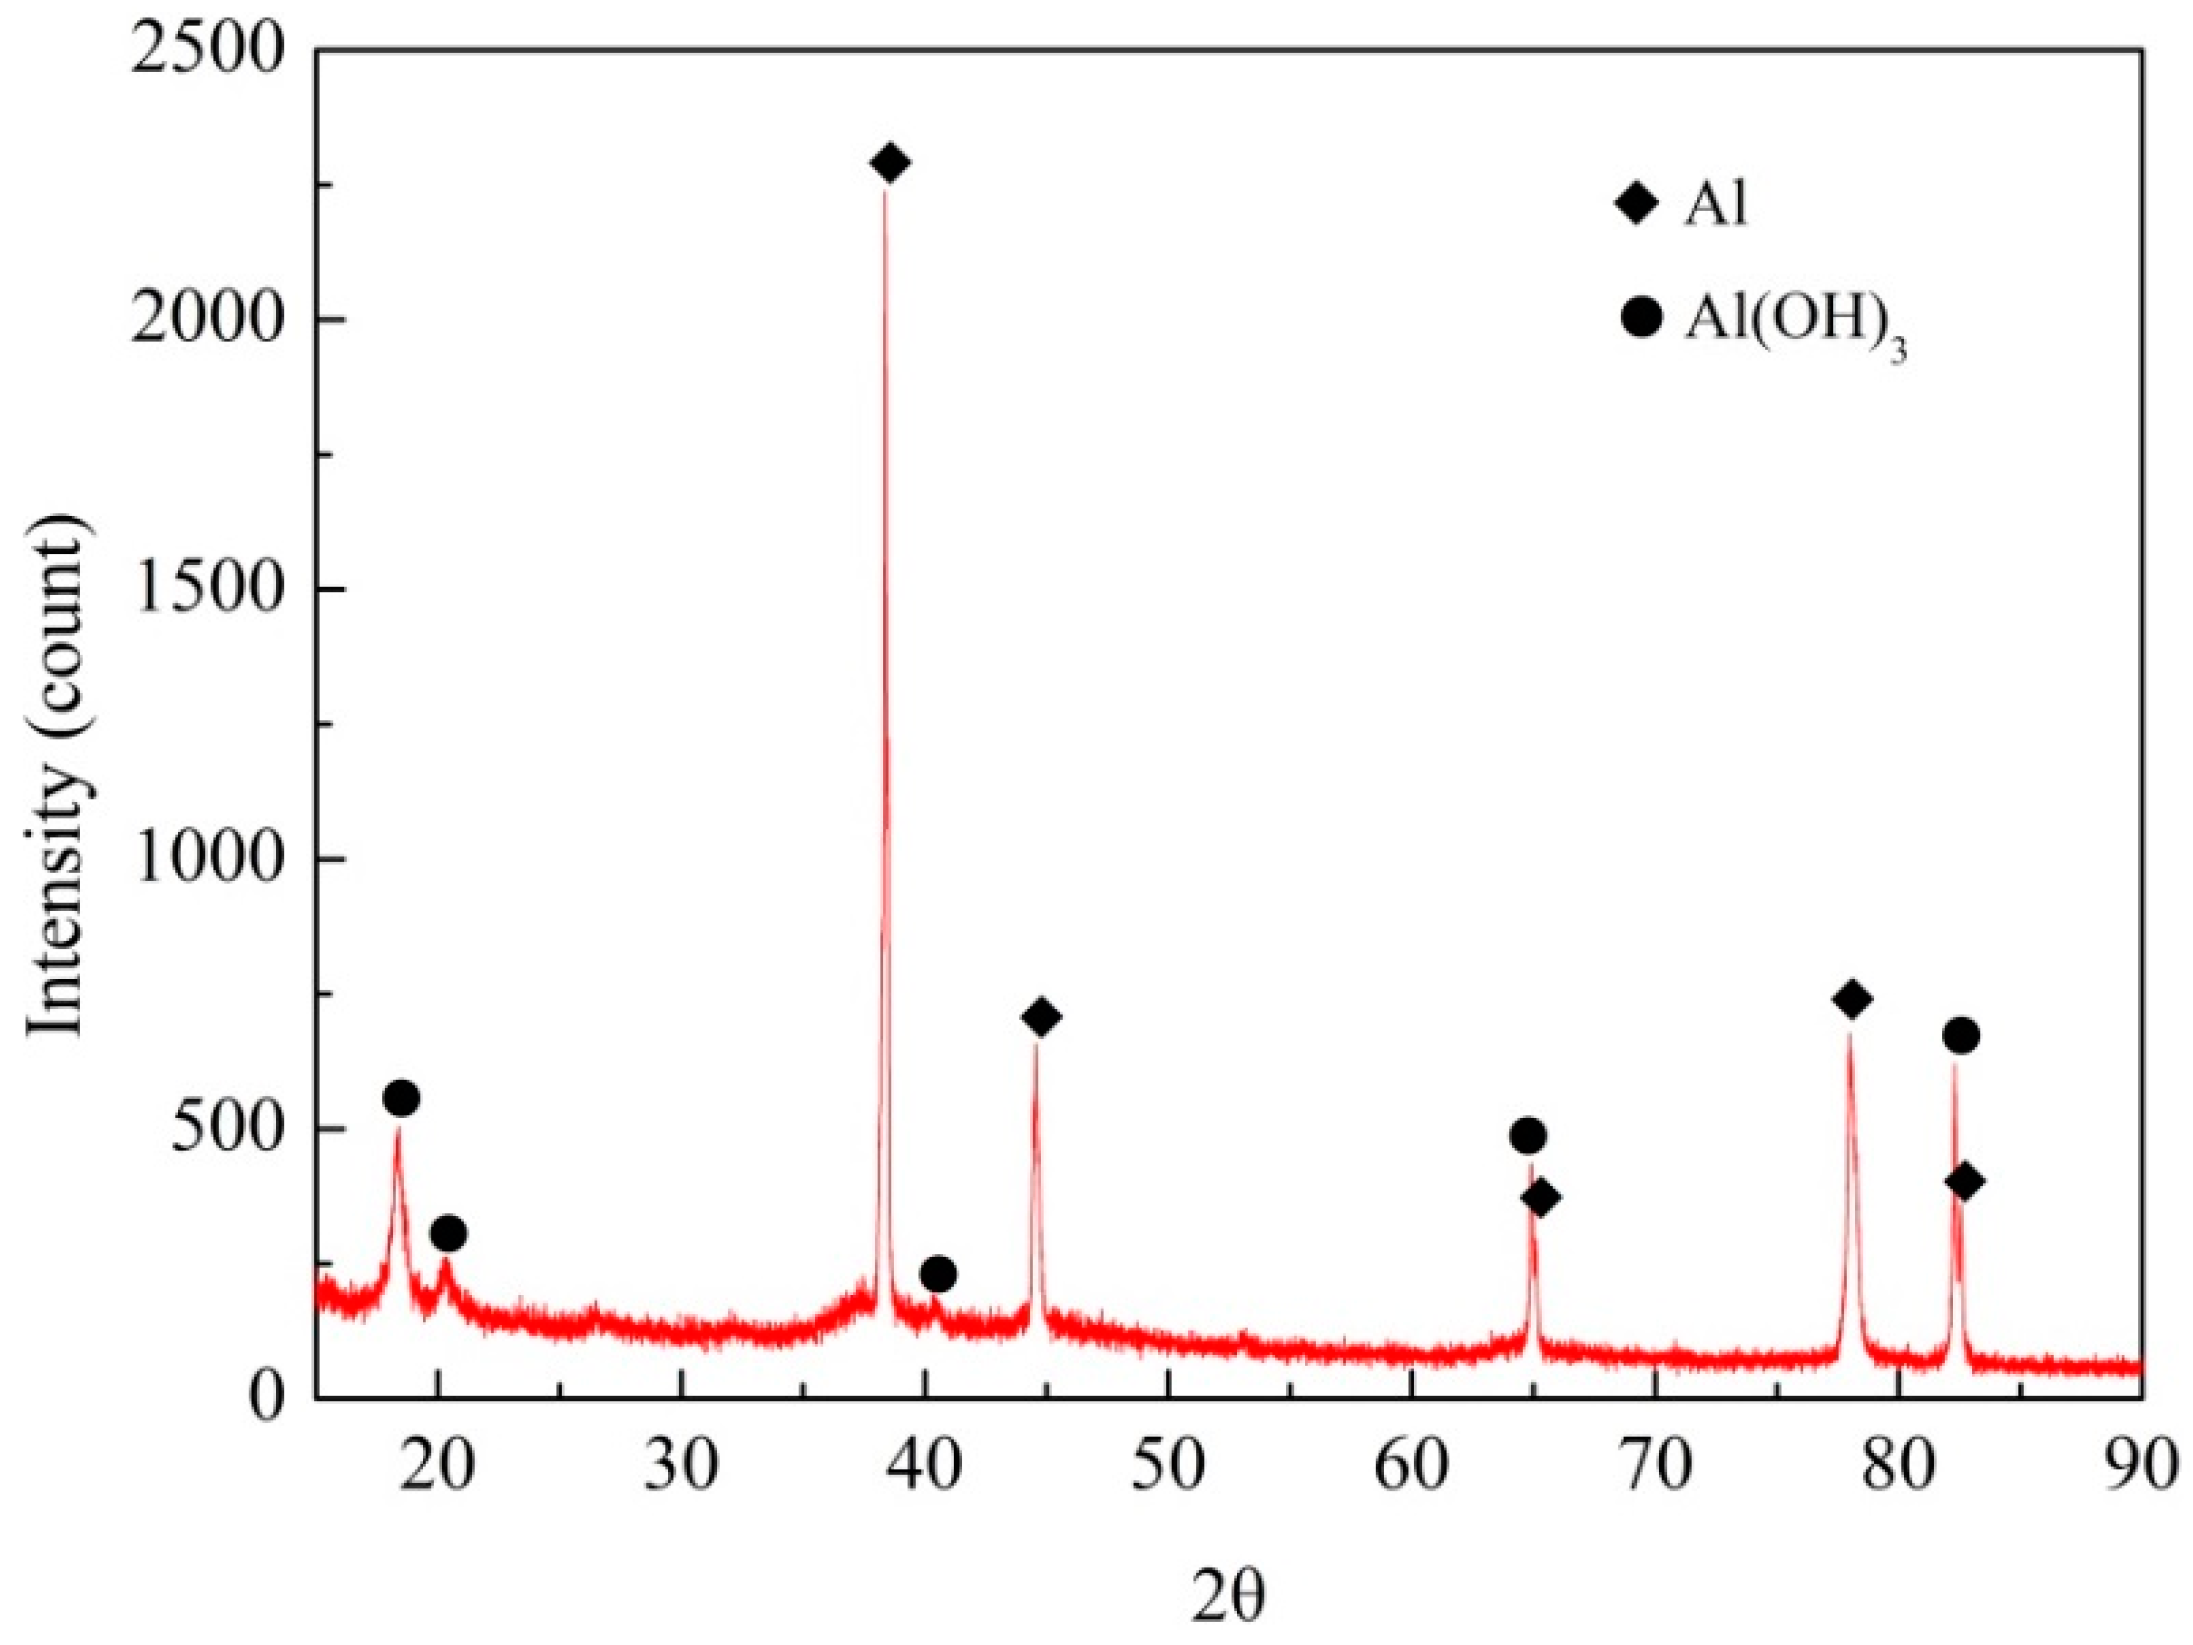
- The anodic oxide film under the epoxy coating bubbling area had been destroyed and the aluminum alloy substrate had also been corroded. The corrosion products in the interior of the coating bubbling area were mainly hydroxides of aluminum.
- (4)
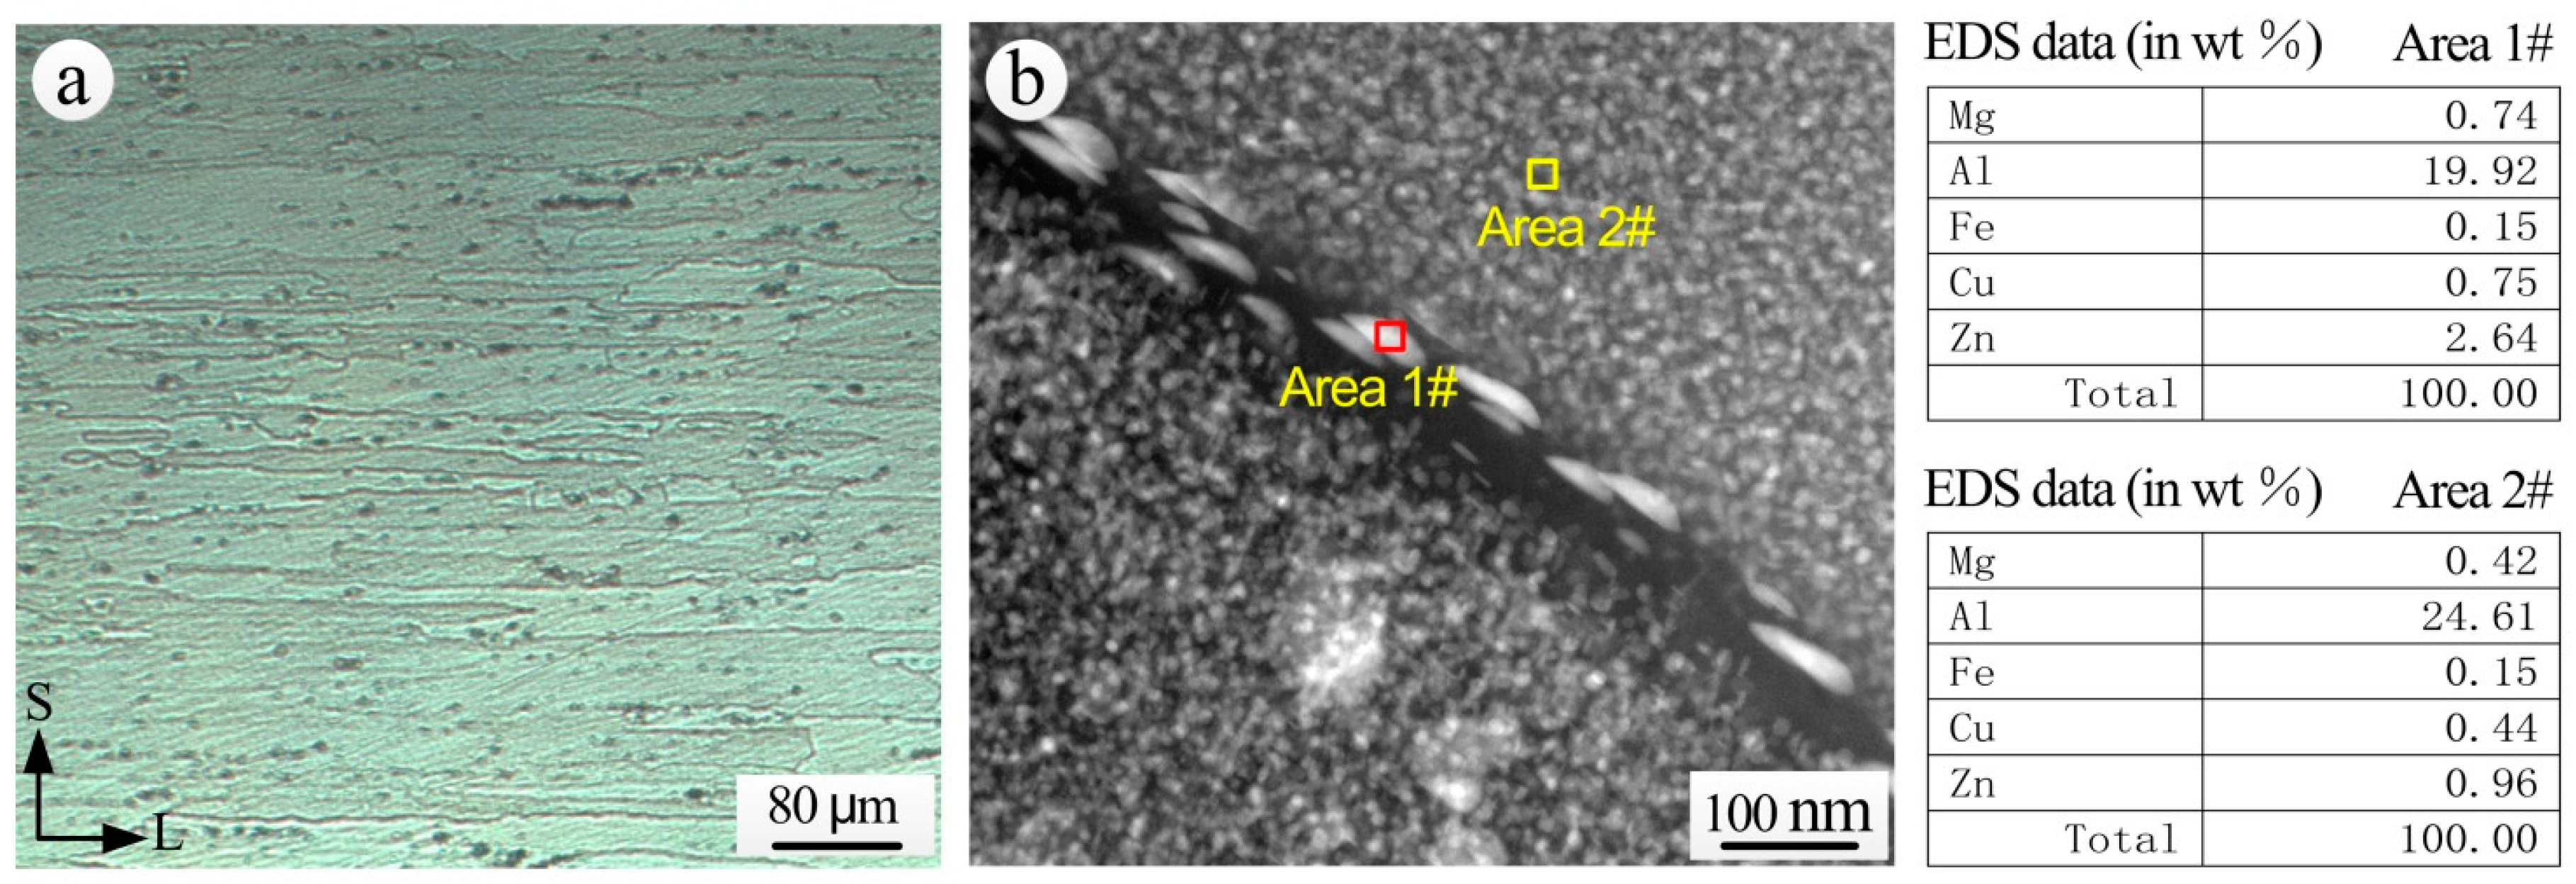
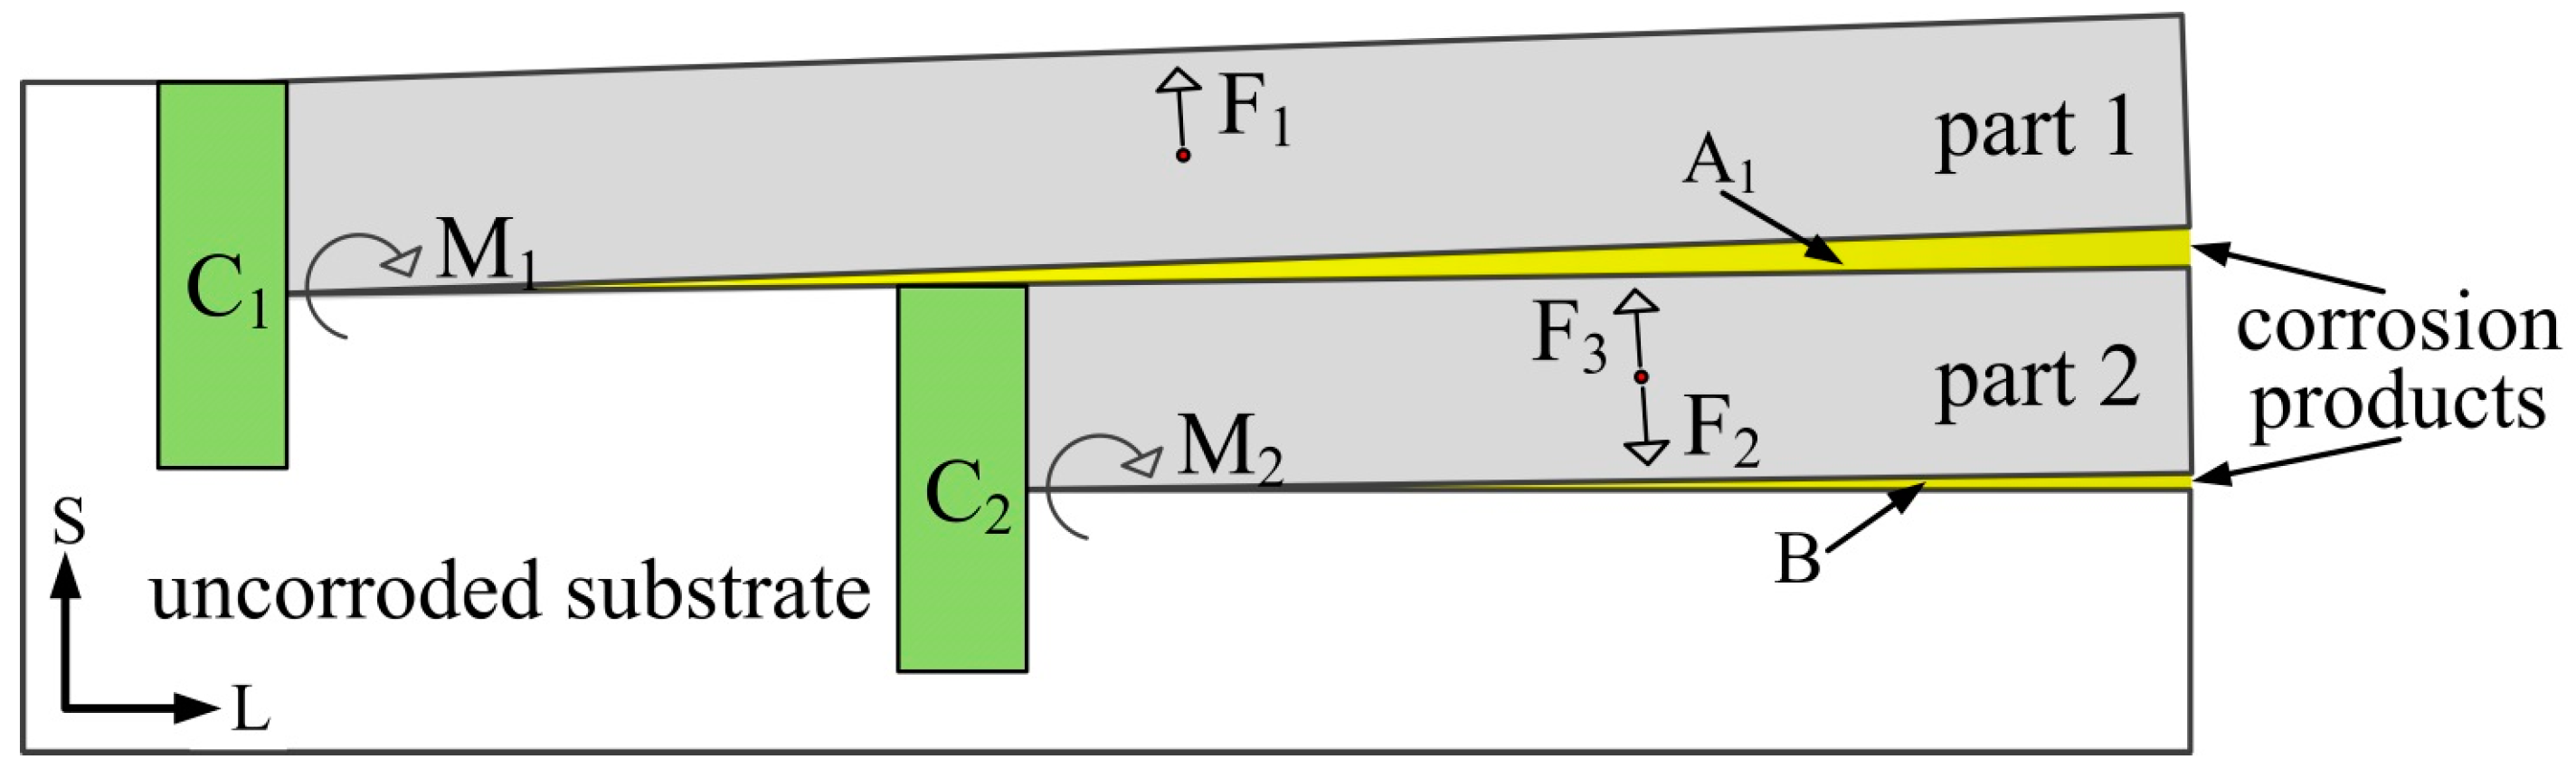
- As the continuous chain of η phase was distributed at the grain boundary, the extruded 7075-T6 aluminum alloy was sensitive to exfoliation corrosion. The propagation of exfoliation corrosion in the S-L section was along the direction of extrusion. Cracks between the lumps of corrosion products provided the channels for the transmission of corrosion mediums, which created conditions for the further propagation of corrosion. Moreover, the structures of the aluminum alloy on the upper side of the corrosion product area displayed a more evident exfoliation than the lower side.
Author Contributions
Acknowledgments
Conflicts of Interest
References
- Sun, S.Q.; Zheng, Q.F.; Li, D.F.; Hu, S.Q.; Wen, J.G. Exfoliation corrosion of extruded 2024-T4 in the coastal environments in China. Corros. Sci. 2011, 53, 2527–2538. [Google Scholar] [CrossRef]
- Ozcan, M.; Dehri, I.; Erbil, M. EIS study of the effect of high levels of SO2 on the corrosion of polyester-coated galvanised steel at different relative humidities. Prog. Org. Coat. 2002, 44, 279–285. [Google Scholar] [CrossRef]
- Mahdavian, M.; Attar, M.M. Evaluation of zinc phosphate and zinc chromate effectiveness via AC and DC methods. Prog. Org. Coat. 2005, 53, 191–194. [Google Scholar] [CrossRef]
- Farrier, L.M.; Szaruga, S.L. Sample preparation and characterization of artificially aged aircraft coatings for microstructural analysis. Mater. Charact. 2005, 55, 179–189. [Google Scholar] [CrossRef] [Green Version]
- Adams, R.M.; Fregert, S.; Gruvberger, B.; Maibach, H.I. Water solubility of zinc chromate primer paints used as antirust agents. Contact Dermat. 1976, 2, 357–358. [Google Scholar] [CrossRef]
- Hu, J.; Zhang, J.; Zhang, J.; Cao, C. Corrosion electrochemical characteristics of red iron oxide pigmented epoxy coatings on aluminum alloys. Corros. Sci. 2005, 47, 2607–2618. [Google Scholar] [CrossRef]
- Dehri, I.; Howard, R.L.; Lyon, S.B. Local electrochemical impedance at the cut-edge of coil-coated galvanized steel after corrosion testing. Corros. Sci. 1999, 41, 141–154. [Google Scholar] [CrossRef]
- Hinderliter, B.R.; Croll, S.G.; Tallman, D.E.; Su, Q.; Bierwagen, G.P. Interpretation of EIS data from accelerated exposure of coated metals based on modeling of coating physical properties. Electrochim. Acta 2006, 51, 4505–4515. [Google Scholar] [CrossRef]
- Darowicki, K.; Ślepski, P.; Szociński, M. Application of the dynamic EIS to investigation of transport within organic coatings. Prog. Org. Coat. 2005, 52, 306–310. [Google Scholar] [CrossRef]
- Guillaumin, V.; Mankowski, G. Localized corrosion of 2024 T351 aluminium alloy in chloride media. Corros. Sci. 1998, 41, 421–438. [Google Scholar] [CrossRef]
- Fadaee, H.; Javidi, M. Investigation on the corrosion behaviour and microstructure of 2024-T3 al alloy treated via plasma electrolytic oxidation. J. Alloys Compd. 2014, 604, 36–42. [Google Scholar] [CrossRef]
- Cheng, Y.L.; Zhang, Z.; Cao, F.H.; Li, J.F.; Zhang, J.Q.; Wang, J.M.; Cao, C.N. A study of the corrosion of aluminum alloy 2024-T3 under thin electrolyte layers. Corros. Sci. 2004, 46, 1649–1667. [Google Scholar] [CrossRef]
- Sun, Z.H.; Zhang, N.; Cai, J.P.; Liu, M.; Lu, F. Electrochemical impedance varieties of zinc yellow polypropylene coated aluminum alloy used in aircraft during the accelerated degradation test. Acta Aeronaut. Astronaut. Sin. 2008, 29, 746–751. [Google Scholar]
- Alexopoulos, N.D.; Dalakouras, C.J.; Skarvelis, P.; Kourkoulis, S.K. Accelerated corrosion exposure in ultra thin sheets of 2024 aircraft aluminium alloy for GLARE applications. Corros. Sci. 2012, 55, 289–300. [Google Scholar] [CrossRef]
- De la Fuente, D.; Castaño, J.G.; Morcillo, M. Long-term atmospheric corrosion of zinc. Corros. Sci. 2007, 49, 1420–1436. [Google Scholar] [CrossRef] [Green Version]
- Smith, B.S.; Duxbury, E.J.; Moore, B.T. Atmospheric Corrosivity of Defence Bases in Northern and Eastern Australia; DSTO Aeronautical and Maritime Research Laboratory: Melbourne, Australia, 1997; pp. 1–39.
- Sun, S.Q.; Zheng, Q.F.; Li, D.F.; Wen, J.G. Long-term atmospheric corrosion behaviour of aluminium alloys 2024 and 7075 in urban, coastal and industrial environments. Corros. Sci. 2009, 51, 719–727. [Google Scholar] [CrossRef]
- Katayama, H.; Kuroda, S. Long-term atmospheric corrosion properties of thermally sprayed Zn, Al and Zn-Al coatings exposed in a coastal area. Corros. Sci. 2013, 76, 35–41. [Google Scholar] [CrossRef]
- Zhu, X.M.; Zhou, X.J.; Wang, W.; Ji, F.Q.; Zhang, L.; Lin, Z.J.; Hu, Z.Z. Corrosion and protection of steel structures in atmospheric environment of petrochemical industry. Mater. Prot. 2013, 3, 022. [Google Scholar]
- Bano, H.; Mahmood, A.; Khan, M.I.; Kazmi, S.A. Spatial evaluation of preservability of mild steel by coal tar epoxy coatings via spectroscopic and microscopic techniques. Arab. J. Sci. Eng. 2014, 40, 117–124. [Google Scholar] [CrossRef]
- Huang, L.C.; Liu, H.C.; Gu, A.; Jiang, T.M.; Zhu, L.Q. Failure and corrosion of coating on aluminum alloy parts used on airplanes serving in coastal environment. Acta Aeronaut. Astronaut. Sin. 2009, 30, 1144–1149. [Google Scholar]
- McNaughtan, D.; Worsfold, M.; Robinson, M.J. Corrosion product force measurements in the study of exfoliation and stress corrosion cracking in high strength aluminium alloys. Corros. Sci. 2003, 45, 2377–2389. [Google Scholar] [CrossRef]
- Robinson, M.J. The role of wedging stresses in the exfoliation corrosion of high-strength aluminum-alloys. Corros. Sci. 1983, 23, 887–899. [Google Scholar] [CrossRef]
- Robinson, M.J.; Jackson, N.C. The influence of grain structure and intergranular corrosion rate on exfoliation and stress corrosion cracking of high strength Al-Cu-Mg alloys. Corros. Sci. 1999, 41, 1013–1028. [Google Scholar] [CrossRef]
- Zhao, Y.X.; Gao, Q.; Wang, J.N. An approach for determining an appropriate assumed distribution of fatigue life under limited data. Reliab. Eng. Syst. Saf. 2000, 67, 1–7. [Google Scholar] [CrossRef]
- Chen, C.Y. Fatigue and Fracture; Huazhong University of Science and Technology Press: Wuhan, China, 2002; pp. 52–62. [Google Scholar]
- Zhang, T.; He, Y.T.; Cui, R.H.; An, T. Long-term atmospheric corrosion of aluminum alloy 2024-T4 in a coastal environment. J. Mater. Eng. Perform. 2015, 24, 2764–2773. [Google Scholar] [CrossRef]
- Cao, C.N.; Zhang, J.Q. An Introduction to Electrochemical Impedance Spectroscopy; Science Press: Beijing, China, 2002. [Google Scholar]
- Su, J.X.; Bai, Y.; Guan, Q.F.; Zou, Y. Electrochemical impedance spectroscopy analysis of failure of aircraft surface coating. J. Chin. Soc. Corros. Prot. 2013, 33, 251–256. [Google Scholar]
- Zhang, J.T.; Hu, J.M.; Zhang, J.Q.; Cao, C.N. Electrochemical behaviors of corrosion of ly12 aluminum alloy/passivation film/epoxy coatings composite electrodes. Acta Metall. Sin. 2006, 42, 528–532. [Google Scholar]
- Zhang, G.A.; Xu, L.Y.; Cheng, Y.F. Investigation of erosion–corrosion of 3003 aluminum alloy in ethylene glycol–water solution by impingement jet system. Corros. Sci. 2009, 51, 283–290. [Google Scholar] [CrossRef]
- Guan, F.; Zhai, X.F.; Duan, J.Z.; Zhang, J.; Li, K.; Hou, B.R. Influence of sulfate-reducing bacteria on the corrosion behavior of 5052 aluminum alloy. Surf. Coat. Technol. 2017, 316, 171–179. [Google Scholar] [CrossRef]
- Yang, L.H.; Wan, Y.X.; Qin, Z.L.; Xu, Q.J.; Min, Y.L. Fabrication and corrosion resistance of a graphene-tin oxide composite film on aluminium alloy 6061. Corros. Sci. 2018, 130, 85–94. [Google Scholar] [CrossRef]
- Trdan, U.; Grum, J. SEM/EDS characterization of laser shock peening effect on localized corrosion of al alloy in a near natural chloride environment. Corros. Sci. 2014, 82, 328–338. [Google Scholar] [CrossRef]
- Al-Khaldi, T.A.; Lyon, S.B. The effect of interfacial chemistry on coating adhesion and performance: A mechanistic study using aminobutylphosphonic acid. Prog. Org. Coat. 2012, 75, 449–455. [Google Scholar] [CrossRef]
- Touzain, S.; Le Thu, Q.; Bonnet, G. Evaluation of thick organic coatings degradation in seawater using cathodic protection and thermally accelerated tests. Prog. Org. Coat. 2005, 52, 311–319. [Google Scholar] [CrossRef]
- Roy, D.; Simon, G.P.; Forsyth, M.; Mardel, J. Modification of thermoplastic coatings for improved cathodic disbondment performance on a steel substrate: A study on failure mechanisms. Int. J. Adhes. Adhes. 2002, 22, 395–403. [Google Scholar] [CrossRef]
- Pan, Y.; Zhang, S.P.; Zhou, J.L.; Li, X.G.; Wang, L.; Xiao, Y.D. Mechanisms and influencing factors involved in ageing of organic coatings in atmospheric environment. Paint Coat. Ind. 2010, 40, 68–72. [Google Scholar]
- Oosterbroek, M.; Lammers, R.J.; Vanderven, L.G.J.; Perera, D.Y. Crack formation and stress development in an organic coating. J. Coat. Technol. 1991, 63, 55–60. [Google Scholar]
- Yu, M.; Liu, J.H.; Li, S.M. Corrosion Protection and Detection Methods for Aeronautical Aluminum Alloy; Science Press: Beijing, China, 2017. [Google Scholar]
- Dong, C.F.; An, Y.H.; Li, X.G.; Sheng, H.; Xiao, K. Electrochemical performance of initial corrosion of 7A04 aluminium alloy in marine atmosphere. Chin. J. Nonferr. Met. 2009, 19, 346–352. [Google Scholar]
- Ravichandran, R.; Rajendran, N. Electrochemical behaviour of brass in artificial seawater: Effect of organic inhibitors. Appl. Surf. Sci. 2005, 241, 449–458. [Google Scholar] [CrossRef]
- Cai, B.; Li, J.F.; Jia, Z.Q.; Li, C.X.; Zheng, Y.P.; Cai, Z.Y. Mechanical properties and exfoliation behavior of 7150-RRA aluminum alloy retrogressed at 175 °C. Trans. Mater. Heat Treat. 2009, 30, 109–113. [Google Scholar]


| Element | Si | Fe | Cu | Mn | Mg | Cr | Zn | Ti | Al |
|---|---|---|---|---|---|---|---|---|---|
| Weight fraction (%) | 0.50 | 0.50 | 1.68 | 0.39 | 2.31 | 0.18 | 6.01 | 0.10 | Bal. |
| Environmental Characteristics | Average (Ranges) |
|---|---|
| Air temperature(°C) | 23.9 (31.4–17.8) |
| Relative humidity (%) | 87.6 (100.0–80.0) |
| Velocity of wind (m/s) | 2.4 |
| SO2 (mg/m3) | 0.0452 |
| NO2 (mg/m3) | 0.0020 |
| Cl− deposition rate (mg/(m2 d)) | 14.5875 |
| Years | Normal | Log-normal | Logistic | Weibull | Gumbel | ||||||||||
|---|---|---|---|---|---|---|---|---|---|---|---|---|---|---|---|
| μ | σ | r | μ | σ | r | μ | σ | r | σ | β | r | μ | σ | r | |
| 7 | 39.5 | 4.0 | 0.993 | 1.6 | 0 | 0.989 | 39.5 | 2.3 | 0.985 | 41.2 | 12.0 | 0.985 | 37.6 | 3.3 | −0.955 |
| 12 | 31.9 | 3.4 | 0.993 | 1.5 | 0 | 0.991 | 31.9 | 1.9 | 0.990 | 33.3 | 11.7 | 0.983 | 30.4 | 2.7 | −0.968 |
| 20 | 22.5 | 2.5 | 0.986 | 1.4 | 0.1 | 0.972 | 22.5 | 1.4 | 0.985 | 23.5 | 11.1 | 0.995 | 21.3 | 2.1 | −0.935 |
| Samples | Qc (F cm−2) | nc | Rc (Ω cm2) | Qf (F cm−2) | nf | Rf (Ω cm2) | Cdl (F cm−2) | Rt (Ω cm2) | Rl (Ω cm2) | L (H) | Chi-Square Value (χ2) |
|---|---|---|---|---|---|---|---|---|---|---|---|
| 7 years | 1.01 × 10⁻⁹ | 0.90 | 6.83 × 10⁵ | 1.24 × 10⁻⁸ | 0.74 | 2.41 × 10⁷ | 2.57 × 10⁻⁹ | 4.61 × 10⁷ | 2.466 × 10⁻³ | ||
| 12 years | 2.64 × 10⁻⁸ | 0.75 | 8.62 × 10⁴ | 4.61 × 10⁻⁸ | 0.81 | 4.95 × 10⁶ | 8.62 × 10⁻⁸ | 5.38 × 10⁶ | 1.066 × 10⁻³ | ||
| 20 years | 9.51 × 10⁻⁷ | 0.59 | 7.08 × 10³ | 2.10 × 10⁻⁷ | 0.89 | 1.41 × 10⁴ | 2.05 × 10⁻⁷ | 2.49 × 10⁵ | 6.99 × 10⁴ | 9.97 × 10⁴ | 1.134 × 10⁻³ |
© 2018 by the authors. Licensee MDPI, Basel, Switzerland. This article is an open access article distributed under the terms and conditions of the Creative Commons Attribution (CC BY) license (http://creativecommons.org/licenses/by/4.0/).
Share and Cite
Zhang, S.; He, Y.; Zhang, T.; Wang, G.; Du, X. Long-Term Atmospheric Corrosion Behavior of Epoxy Prime Coated Aluminum Alloy 7075-T6 in Coastal Environment. Materials 2018, 11, 965. https://doi.org/10.3390/ma11060965
Zhang S, He Y, Zhang T, Wang G, Du X. Long-Term Atmospheric Corrosion Behavior of Epoxy Prime Coated Aluminum Alloy 7075-T6 in Coastal Environment. Materials. 2018; 11(6):965. https://doi.org/10.3390/ma11060965
Chicago/Turabian StyleZhang, Sheng, Yuting He, Teng Zhang, Guirong Wang, and Xu Du. 2018. "Long-Term Atmospheric Corrosion Behavior of Epoxy Prime Coated Aluminum Alloy 7075-T6 in Coastal Environment" Materials 11, no. 6: 965. https://doi.org/10.3390/ma11060965
APA StyleZhang, S., He, Y., Zhang, T., Wang, G., & Du, X. (2018). Long-Term Atmospheric Corrosion Behavior of Epoxy Prime Coated Aluminum Alloy 7075-T6 in Coastal Environment. Materials, 11(6), 965. https://doi.org/10.3390/ma11060965