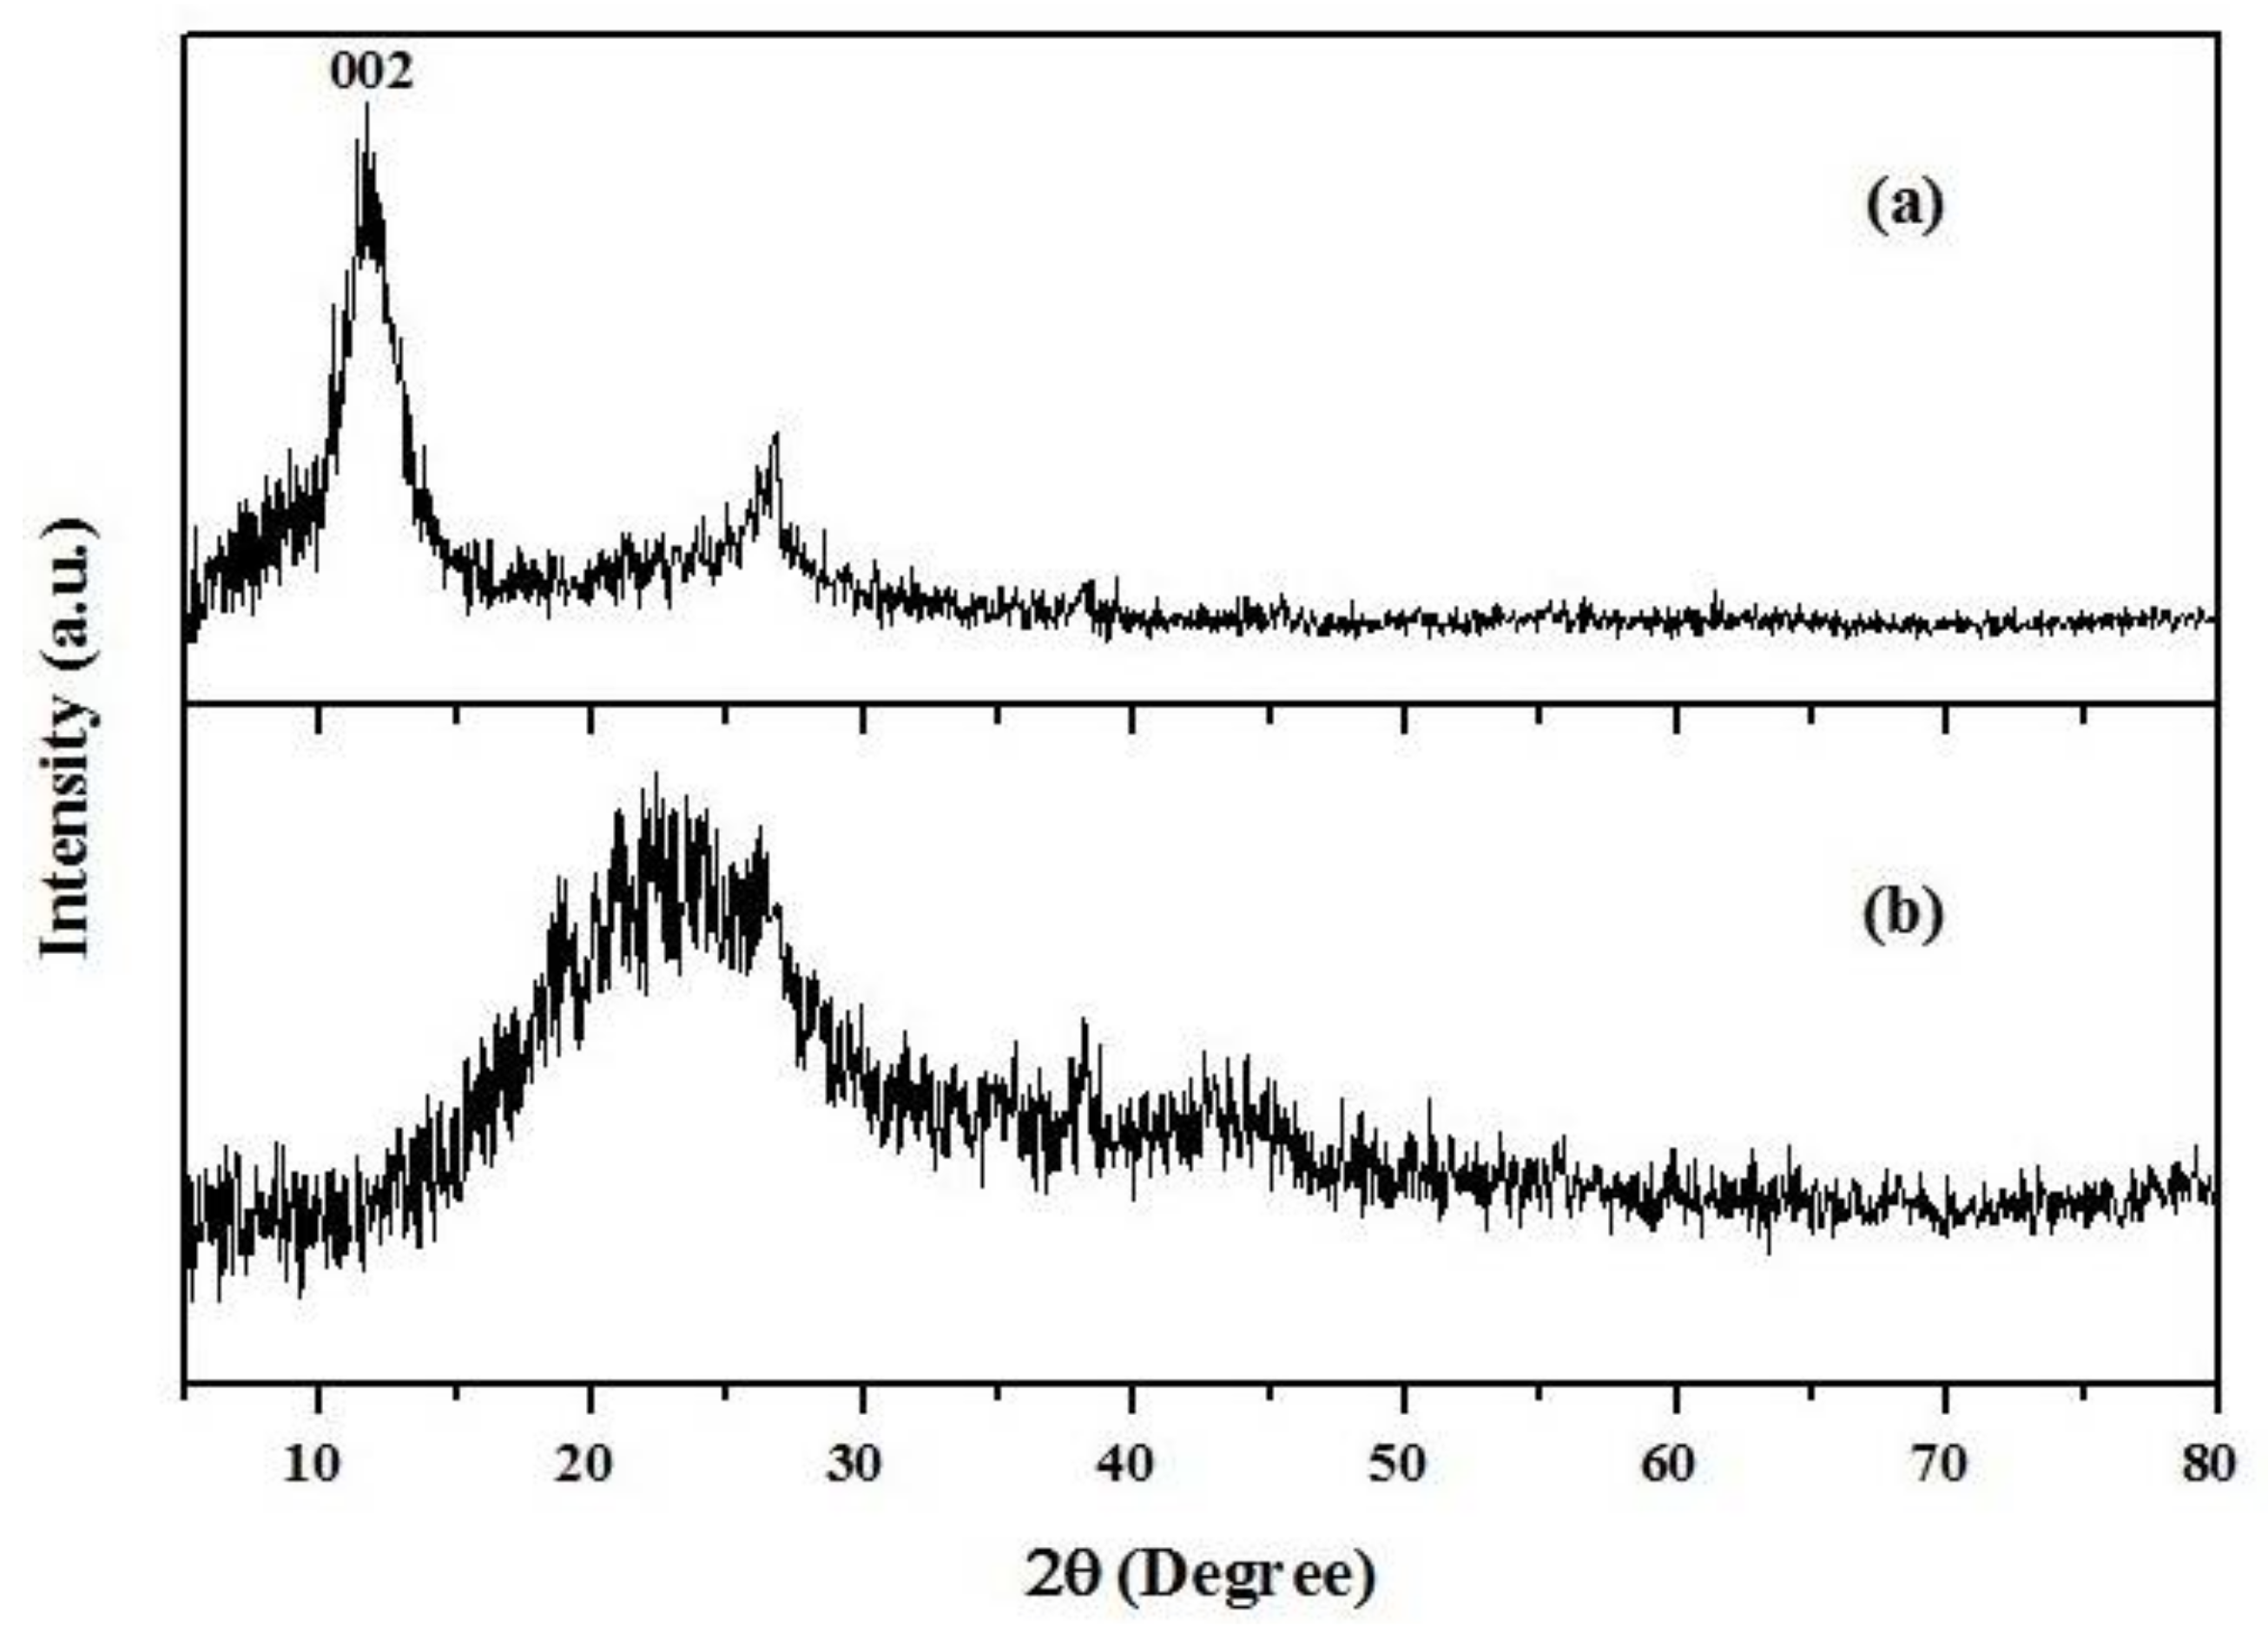
Figure 1.
XRD (X-ray diffraction) spectra of (a) graphene oxide (GO) and (b) graphene oxide/poly(amidoamine) (GO/PAMAM).
Figure 1.
XRD (X-ray diffraction) spectra of (a) graphene oxide (GO) and (b) graphene oxide/poly(amidoamine) (GO/PAMAM).
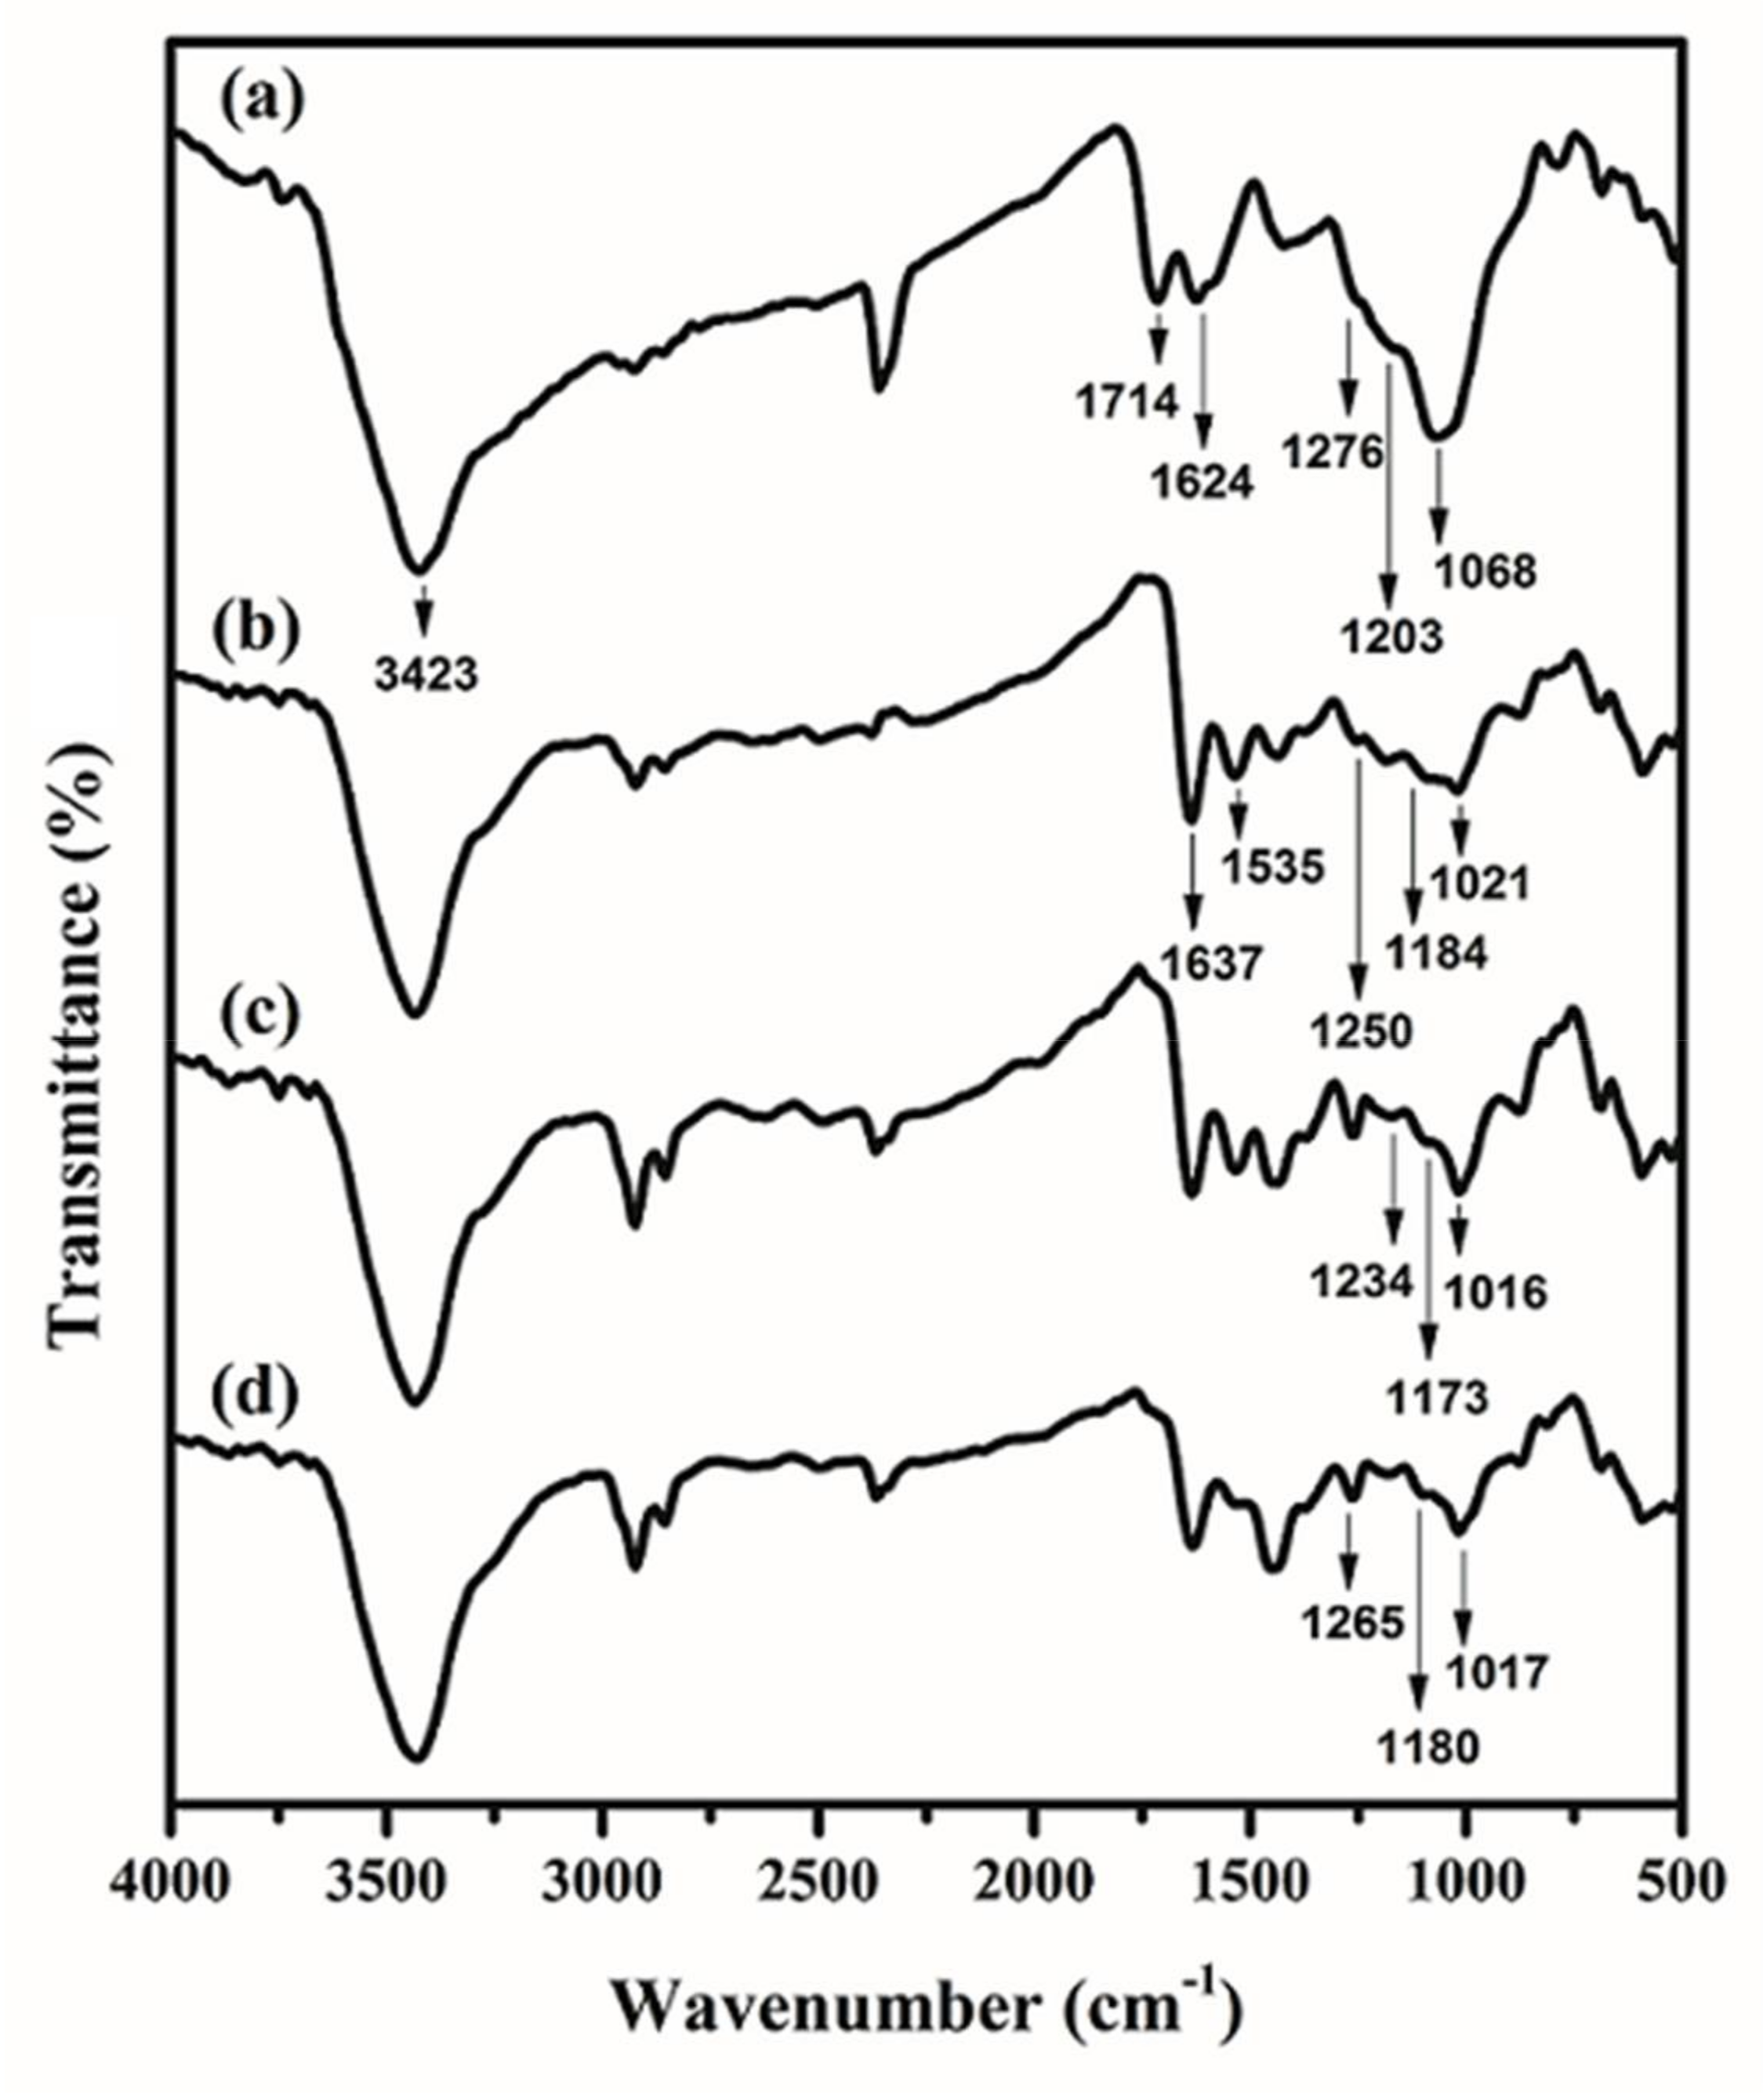
Figure 2.
FTIR spectra of (a) GO; (b) GO/PAMAM; (c) congo red (CR)-adsorbed GO/PAMAM; and, (d) GO/PAMAM at pH = 12.
Figure 2.
FTIR spectra of (a) GO; (b) GO/PAMAM; (c) congo red (CR)-adsorbed GO/PAMAM; and, (d) GO/PAMAM at pH = 12.
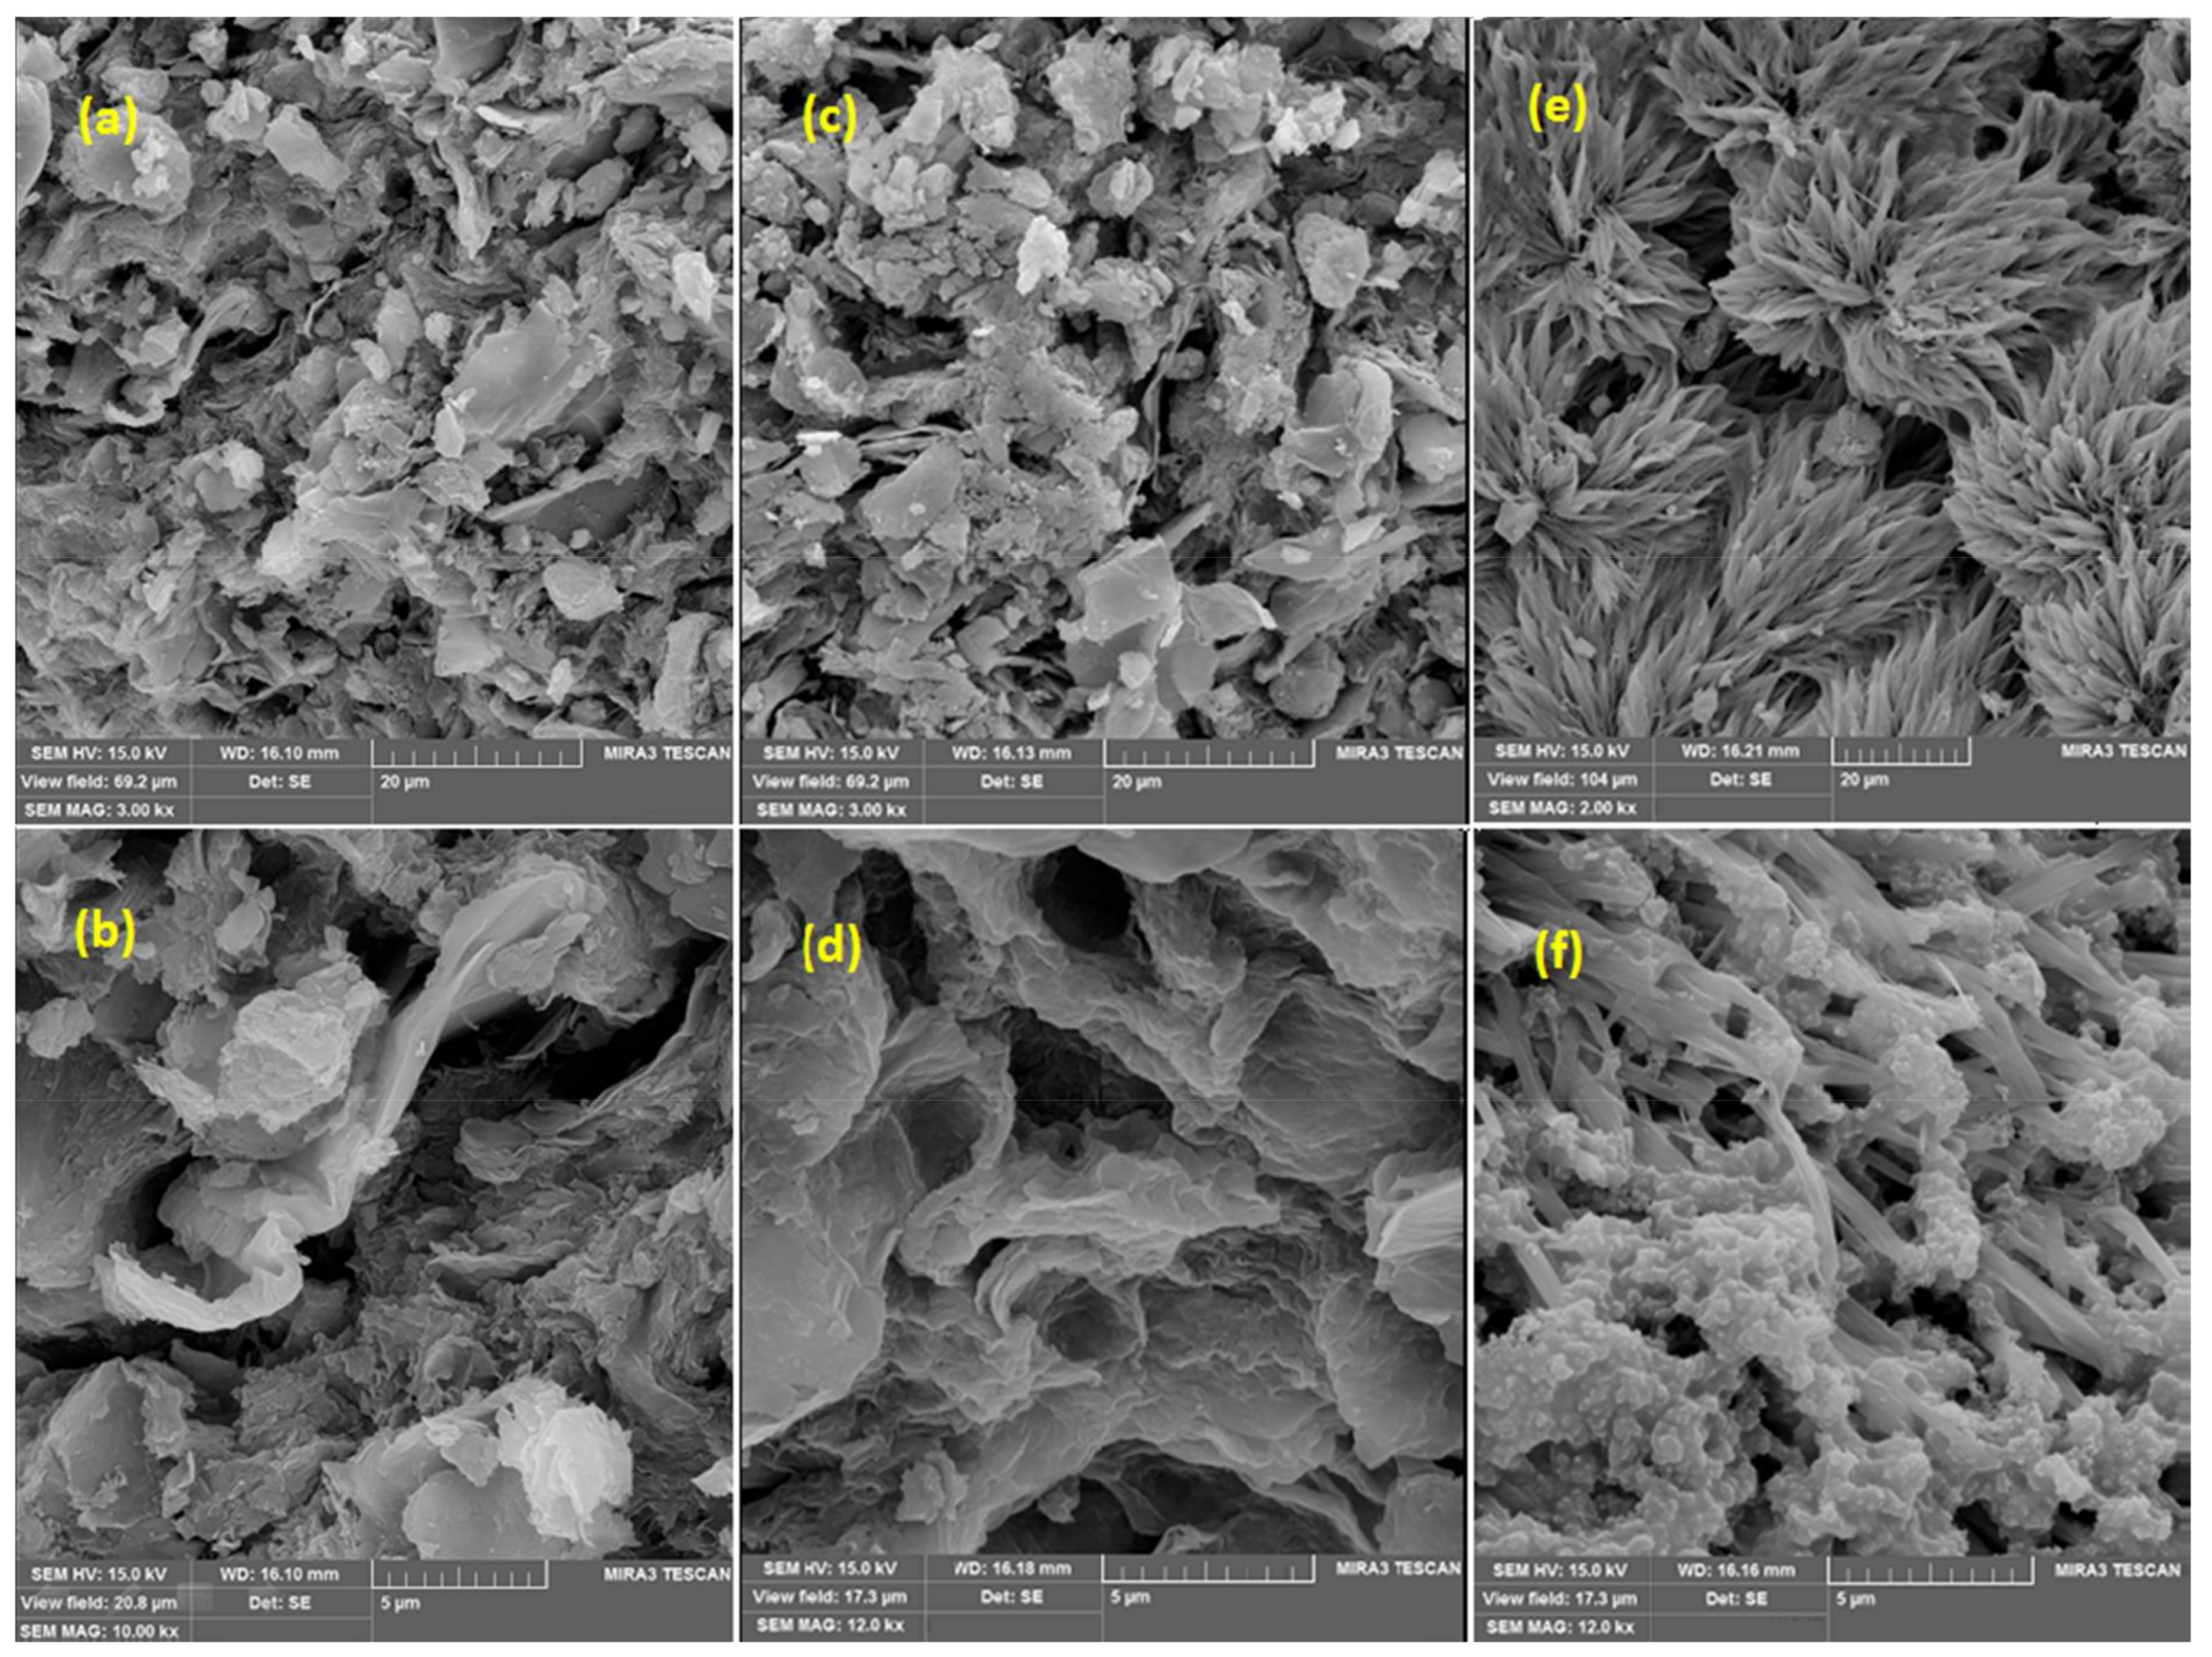
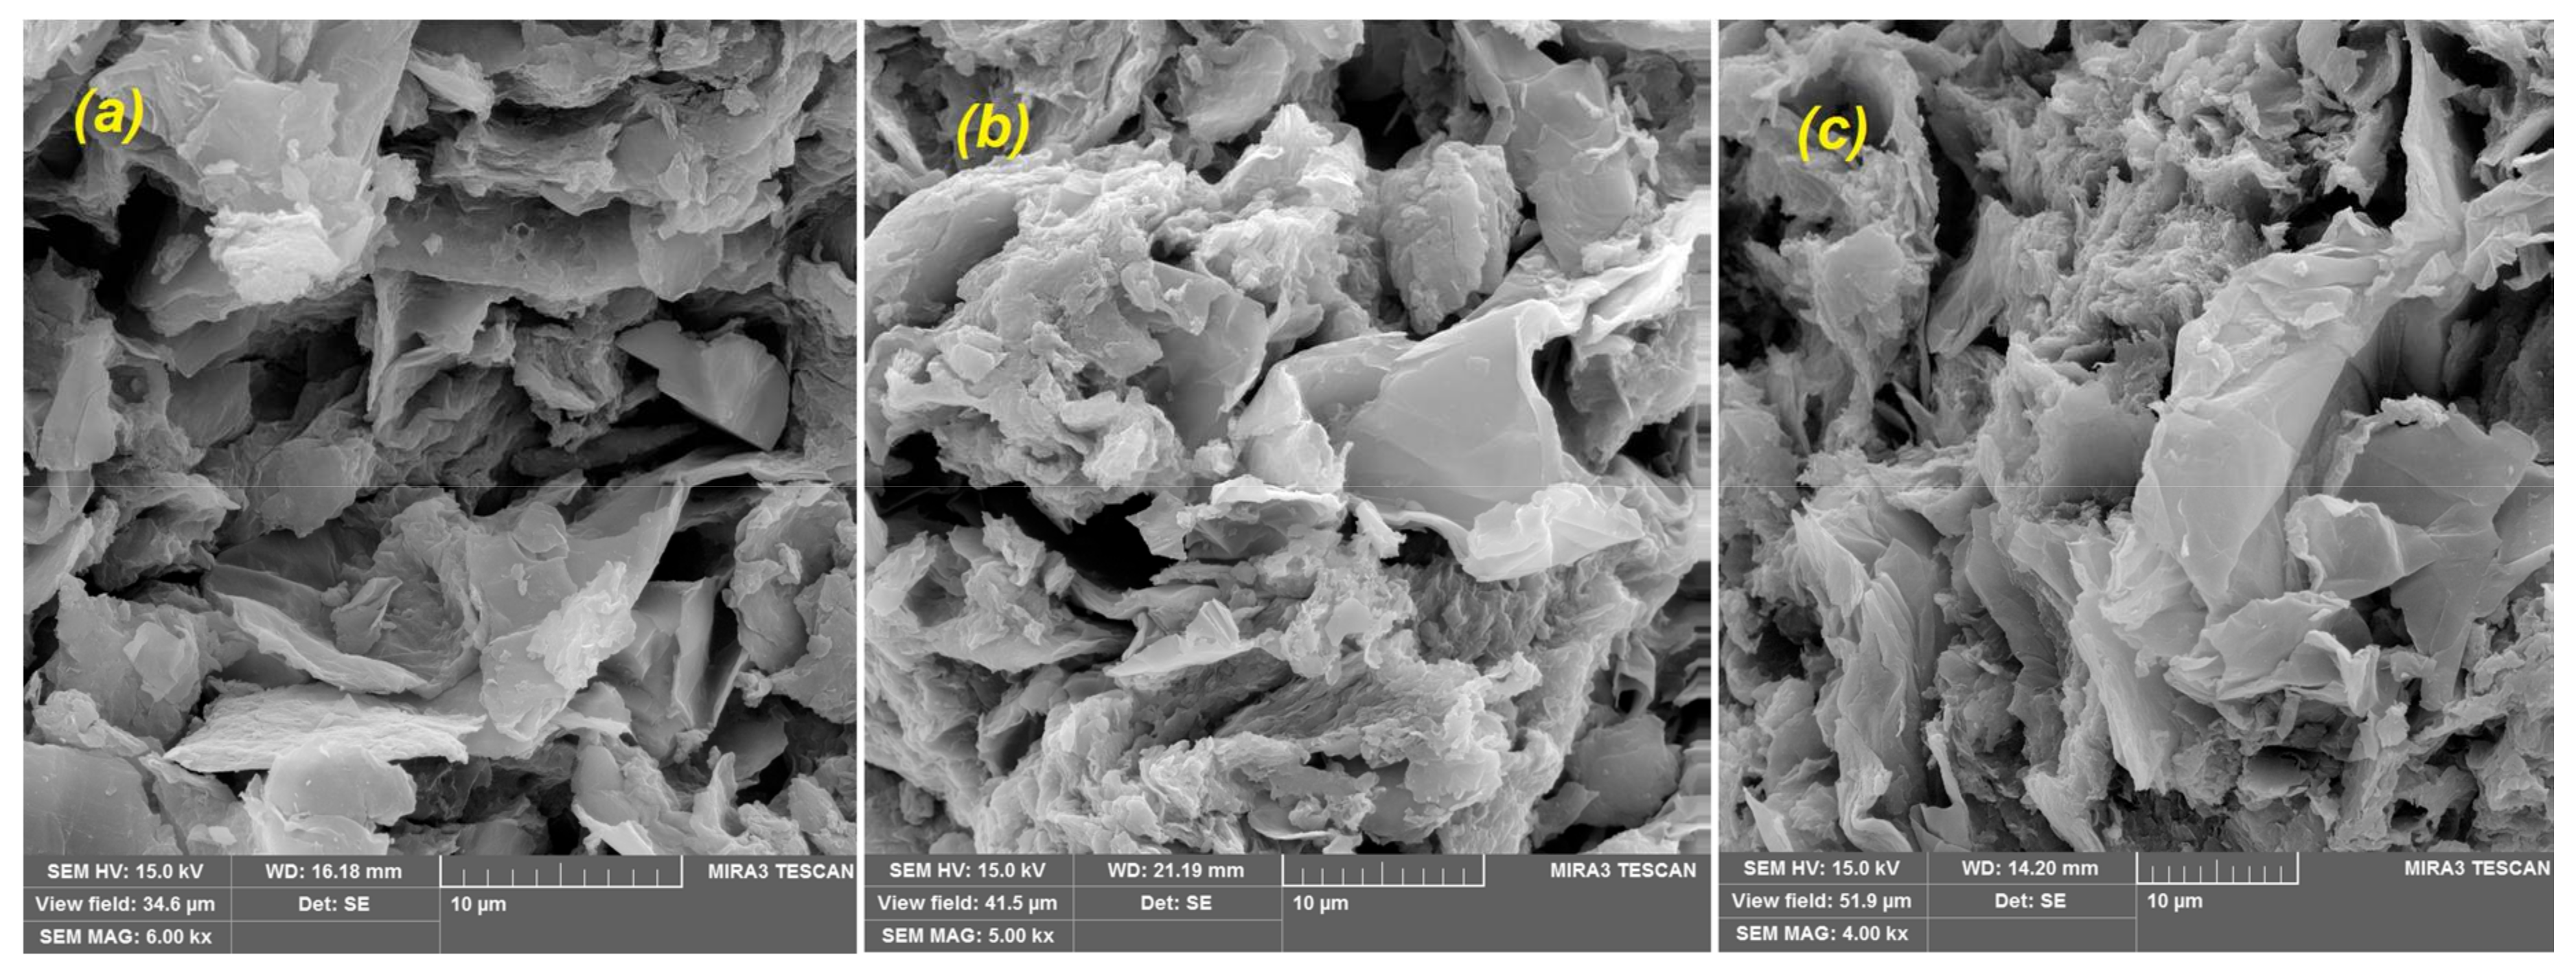
Figure 3.
SEM images of GO/PAMAM at magnifications of (a) ×3k and (b) ×10k; CR-adsorbed GO/PAMAM at magnifications of (c) ×3k and (d) ×12k and GO/PAMAM at pH = 12 at magnifications of (e) ×2k and (f) ×12k.
Figure 3.
SEM images of GO/PAMAM at magnifications of (a) ×3k and (b) ×10k; CR-adsorbed GO/PAMAM at magnifications of (c) ×3k and (d) ×12k and GO/PAMAM at pH = 12 at magnifications of (e) ×2k and (f) ×12k.
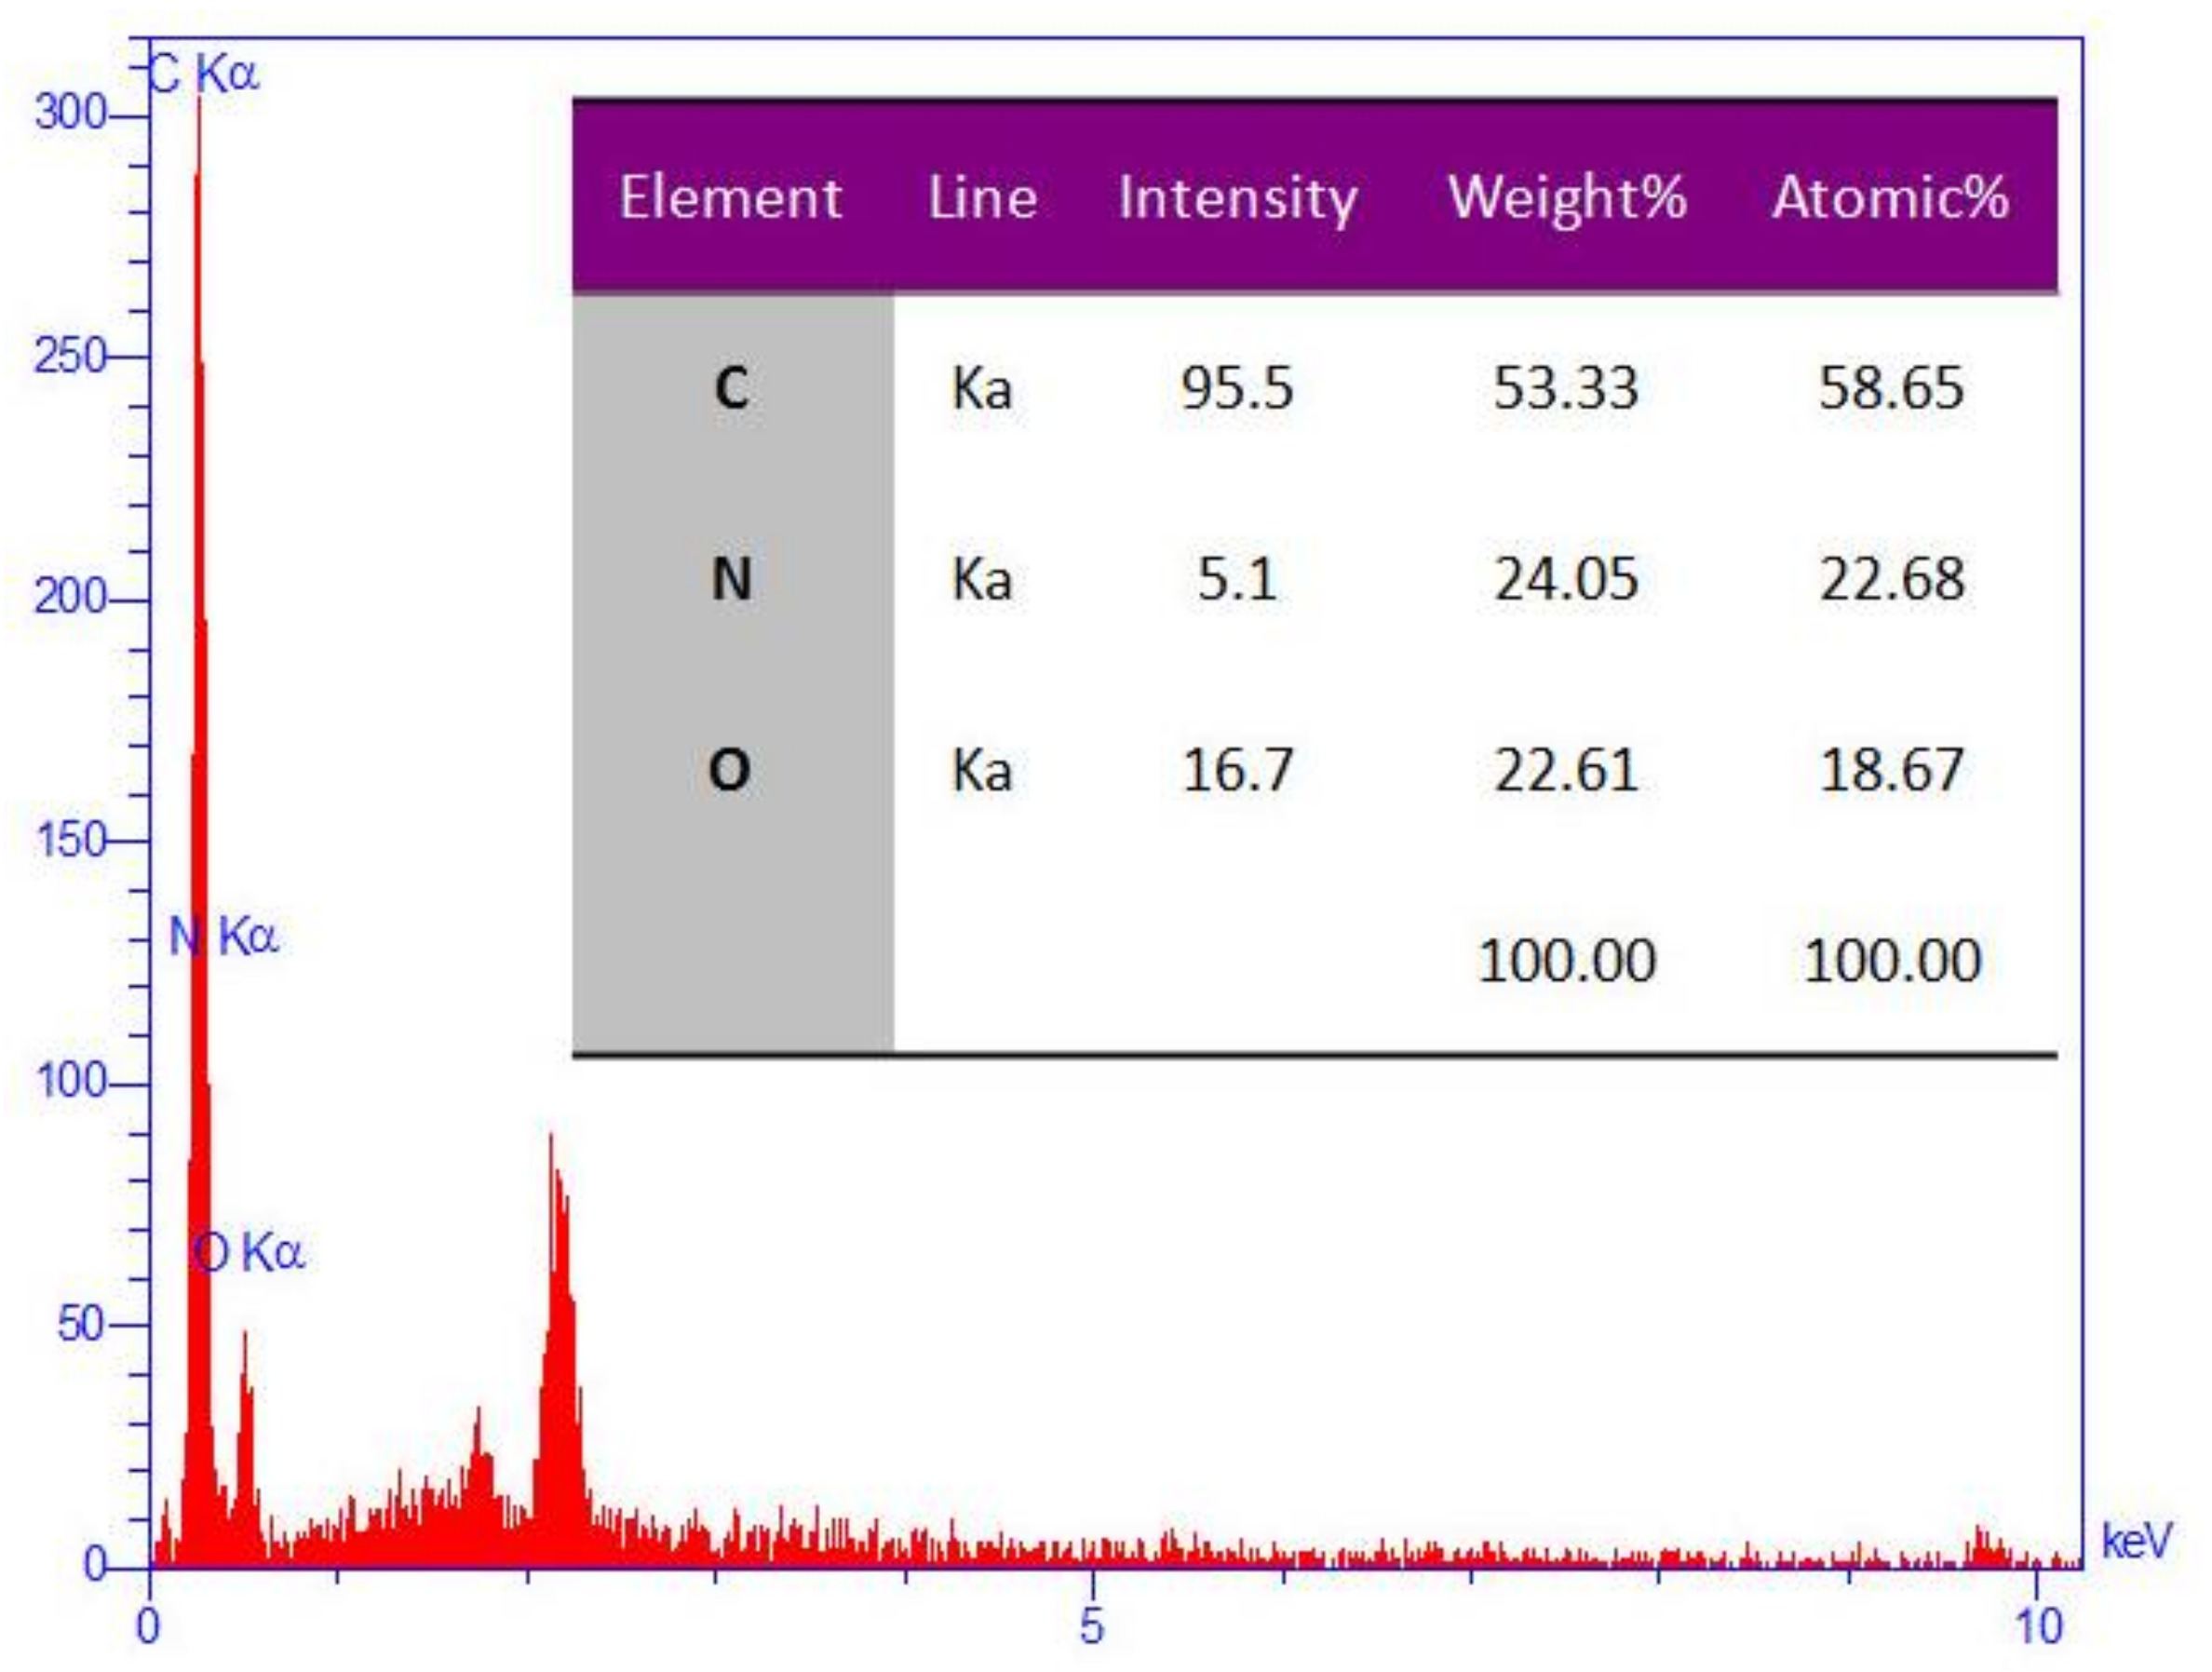
Figure 4.
The EDS (Energy-dispersive X-ray spectroscopy) analysis of GO/PAMAM.
Figure 4.
The EDS (Energy-dispersive X-ray spectroscopy) analysis of GO/PAMAM.
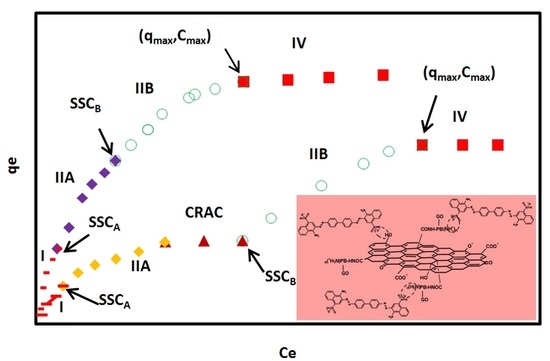
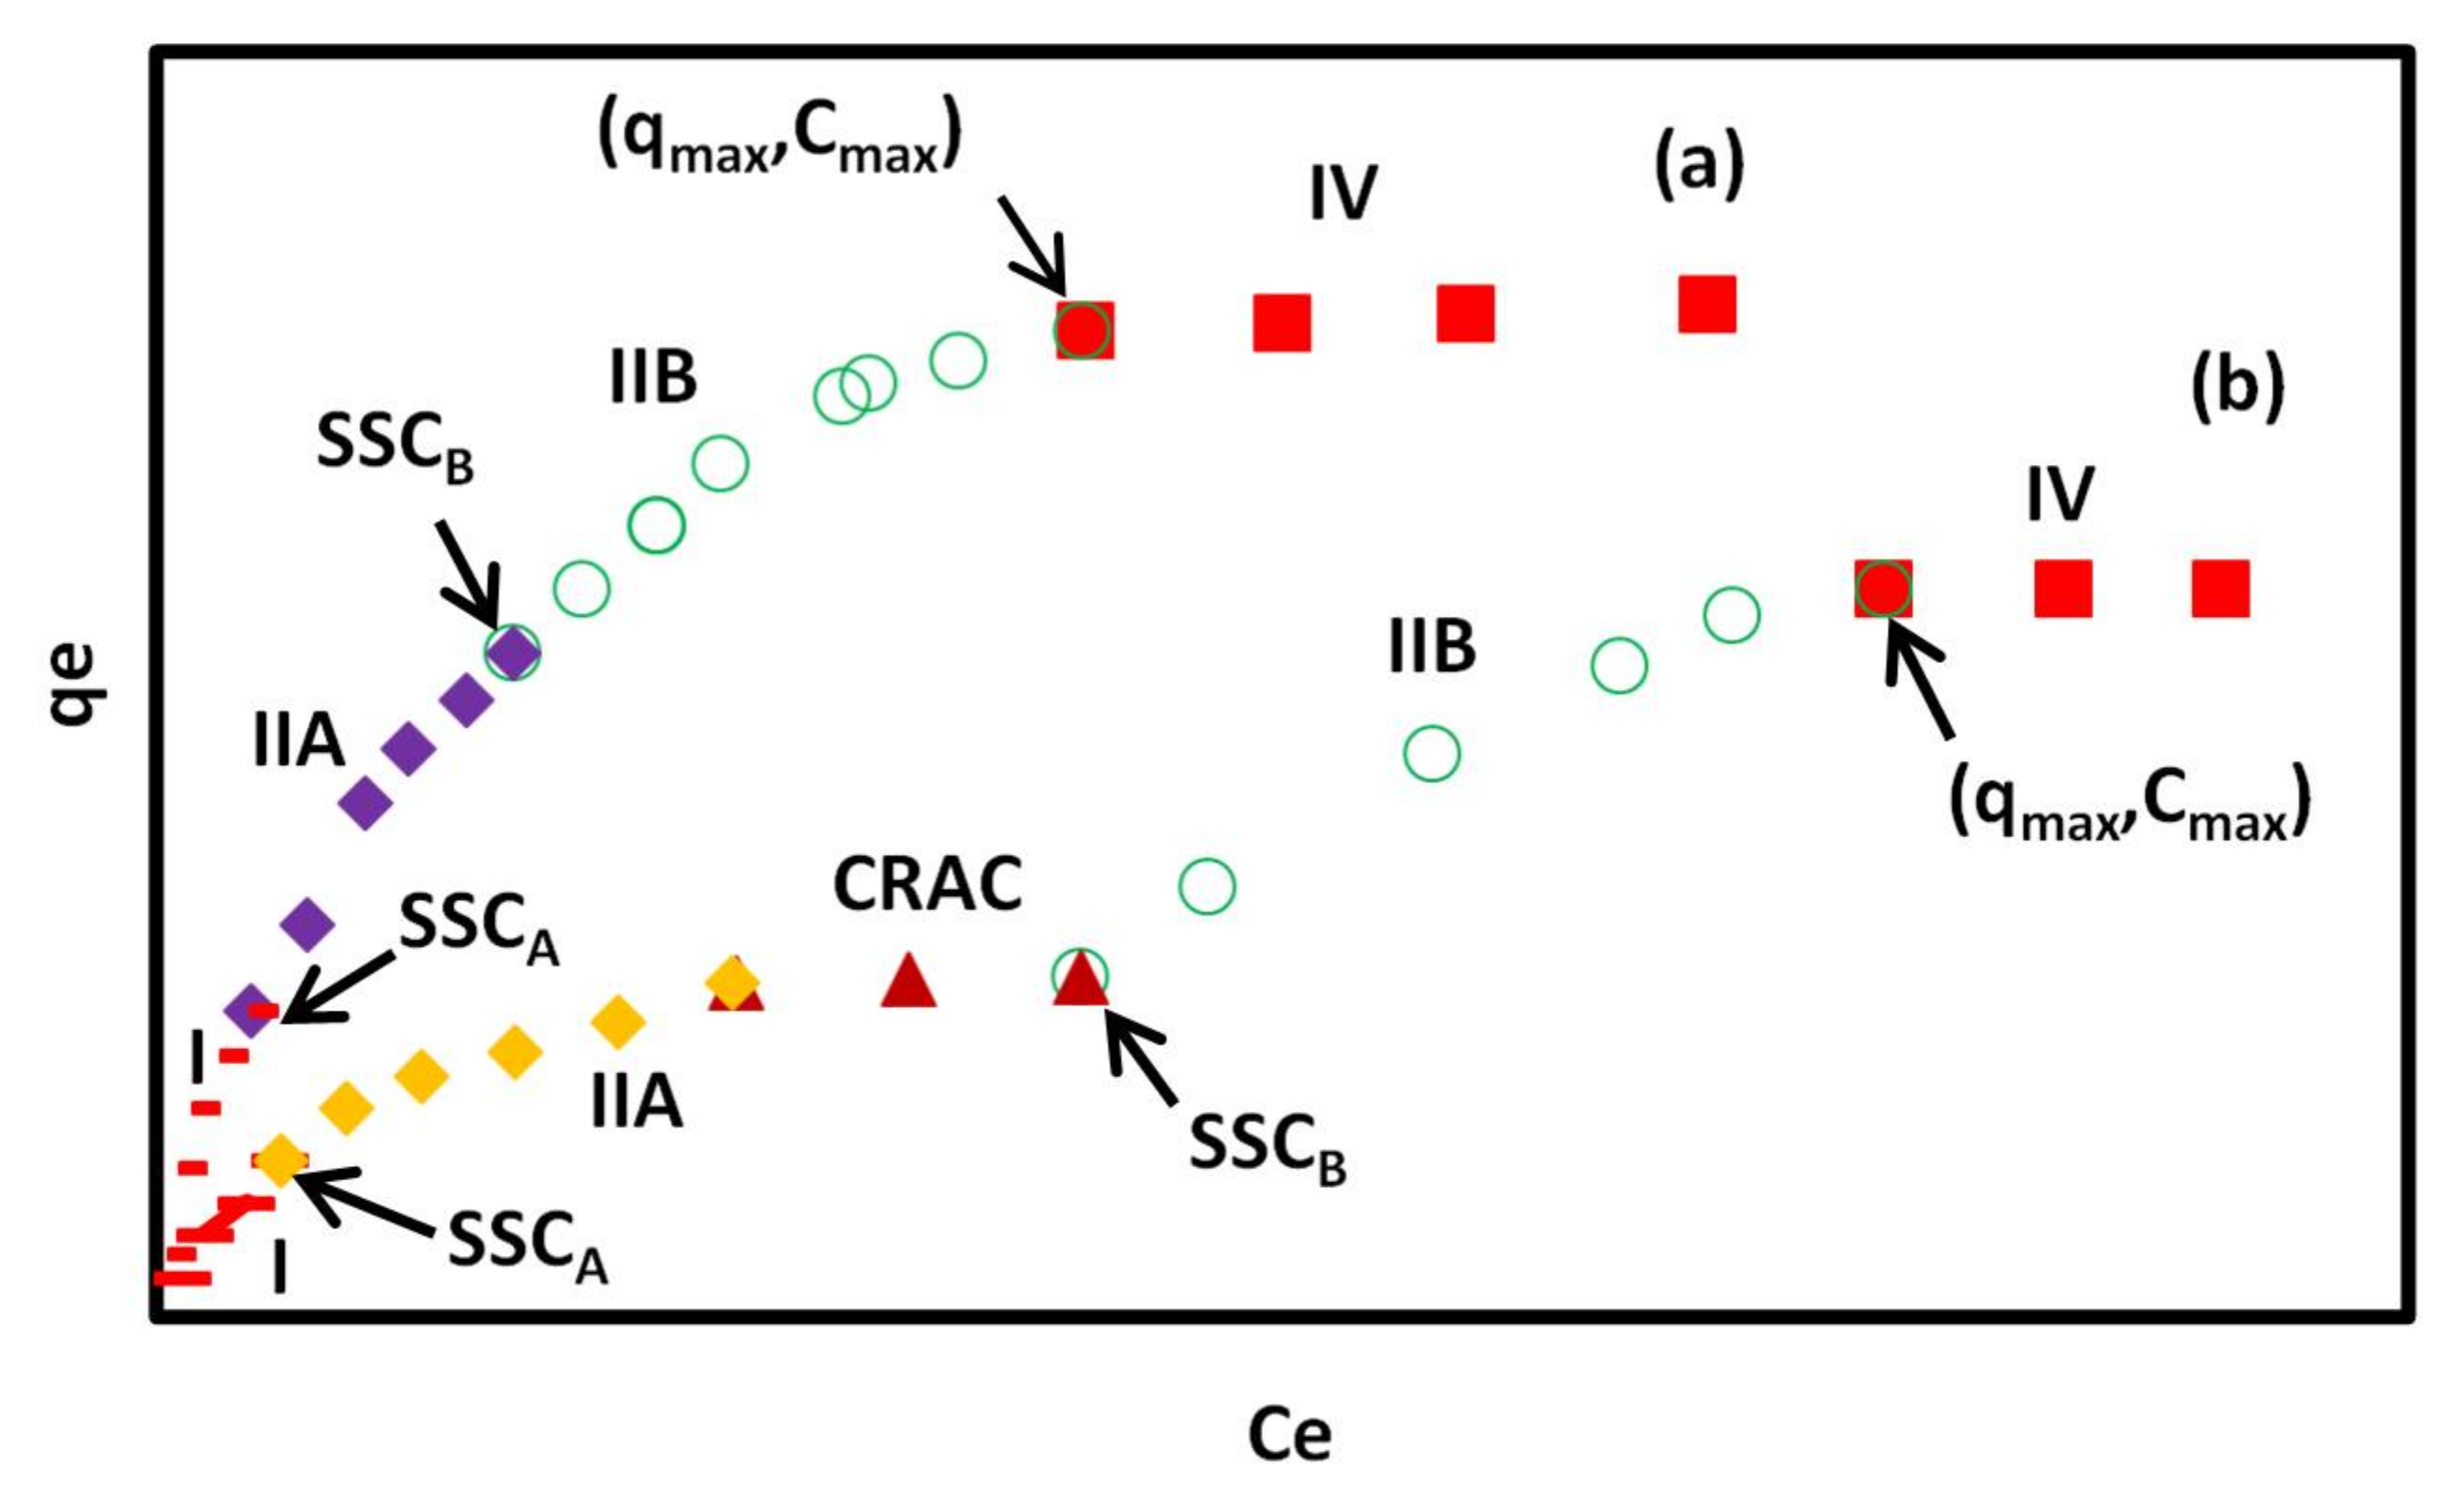
Figure 5.
Typical adsorption isotherms of CR on GO/PAMAM nanocomposite in (a) water and (b) alkaline solutions according to the ARIAN model. Symbols –, ♦, ○, ■ and ▲ show I, IIA, IIB, and IV regions and CRAC, respectively. CRAC is an abbreviation for “concentration range of leveling off between two successive adsorption isotherm curves”.
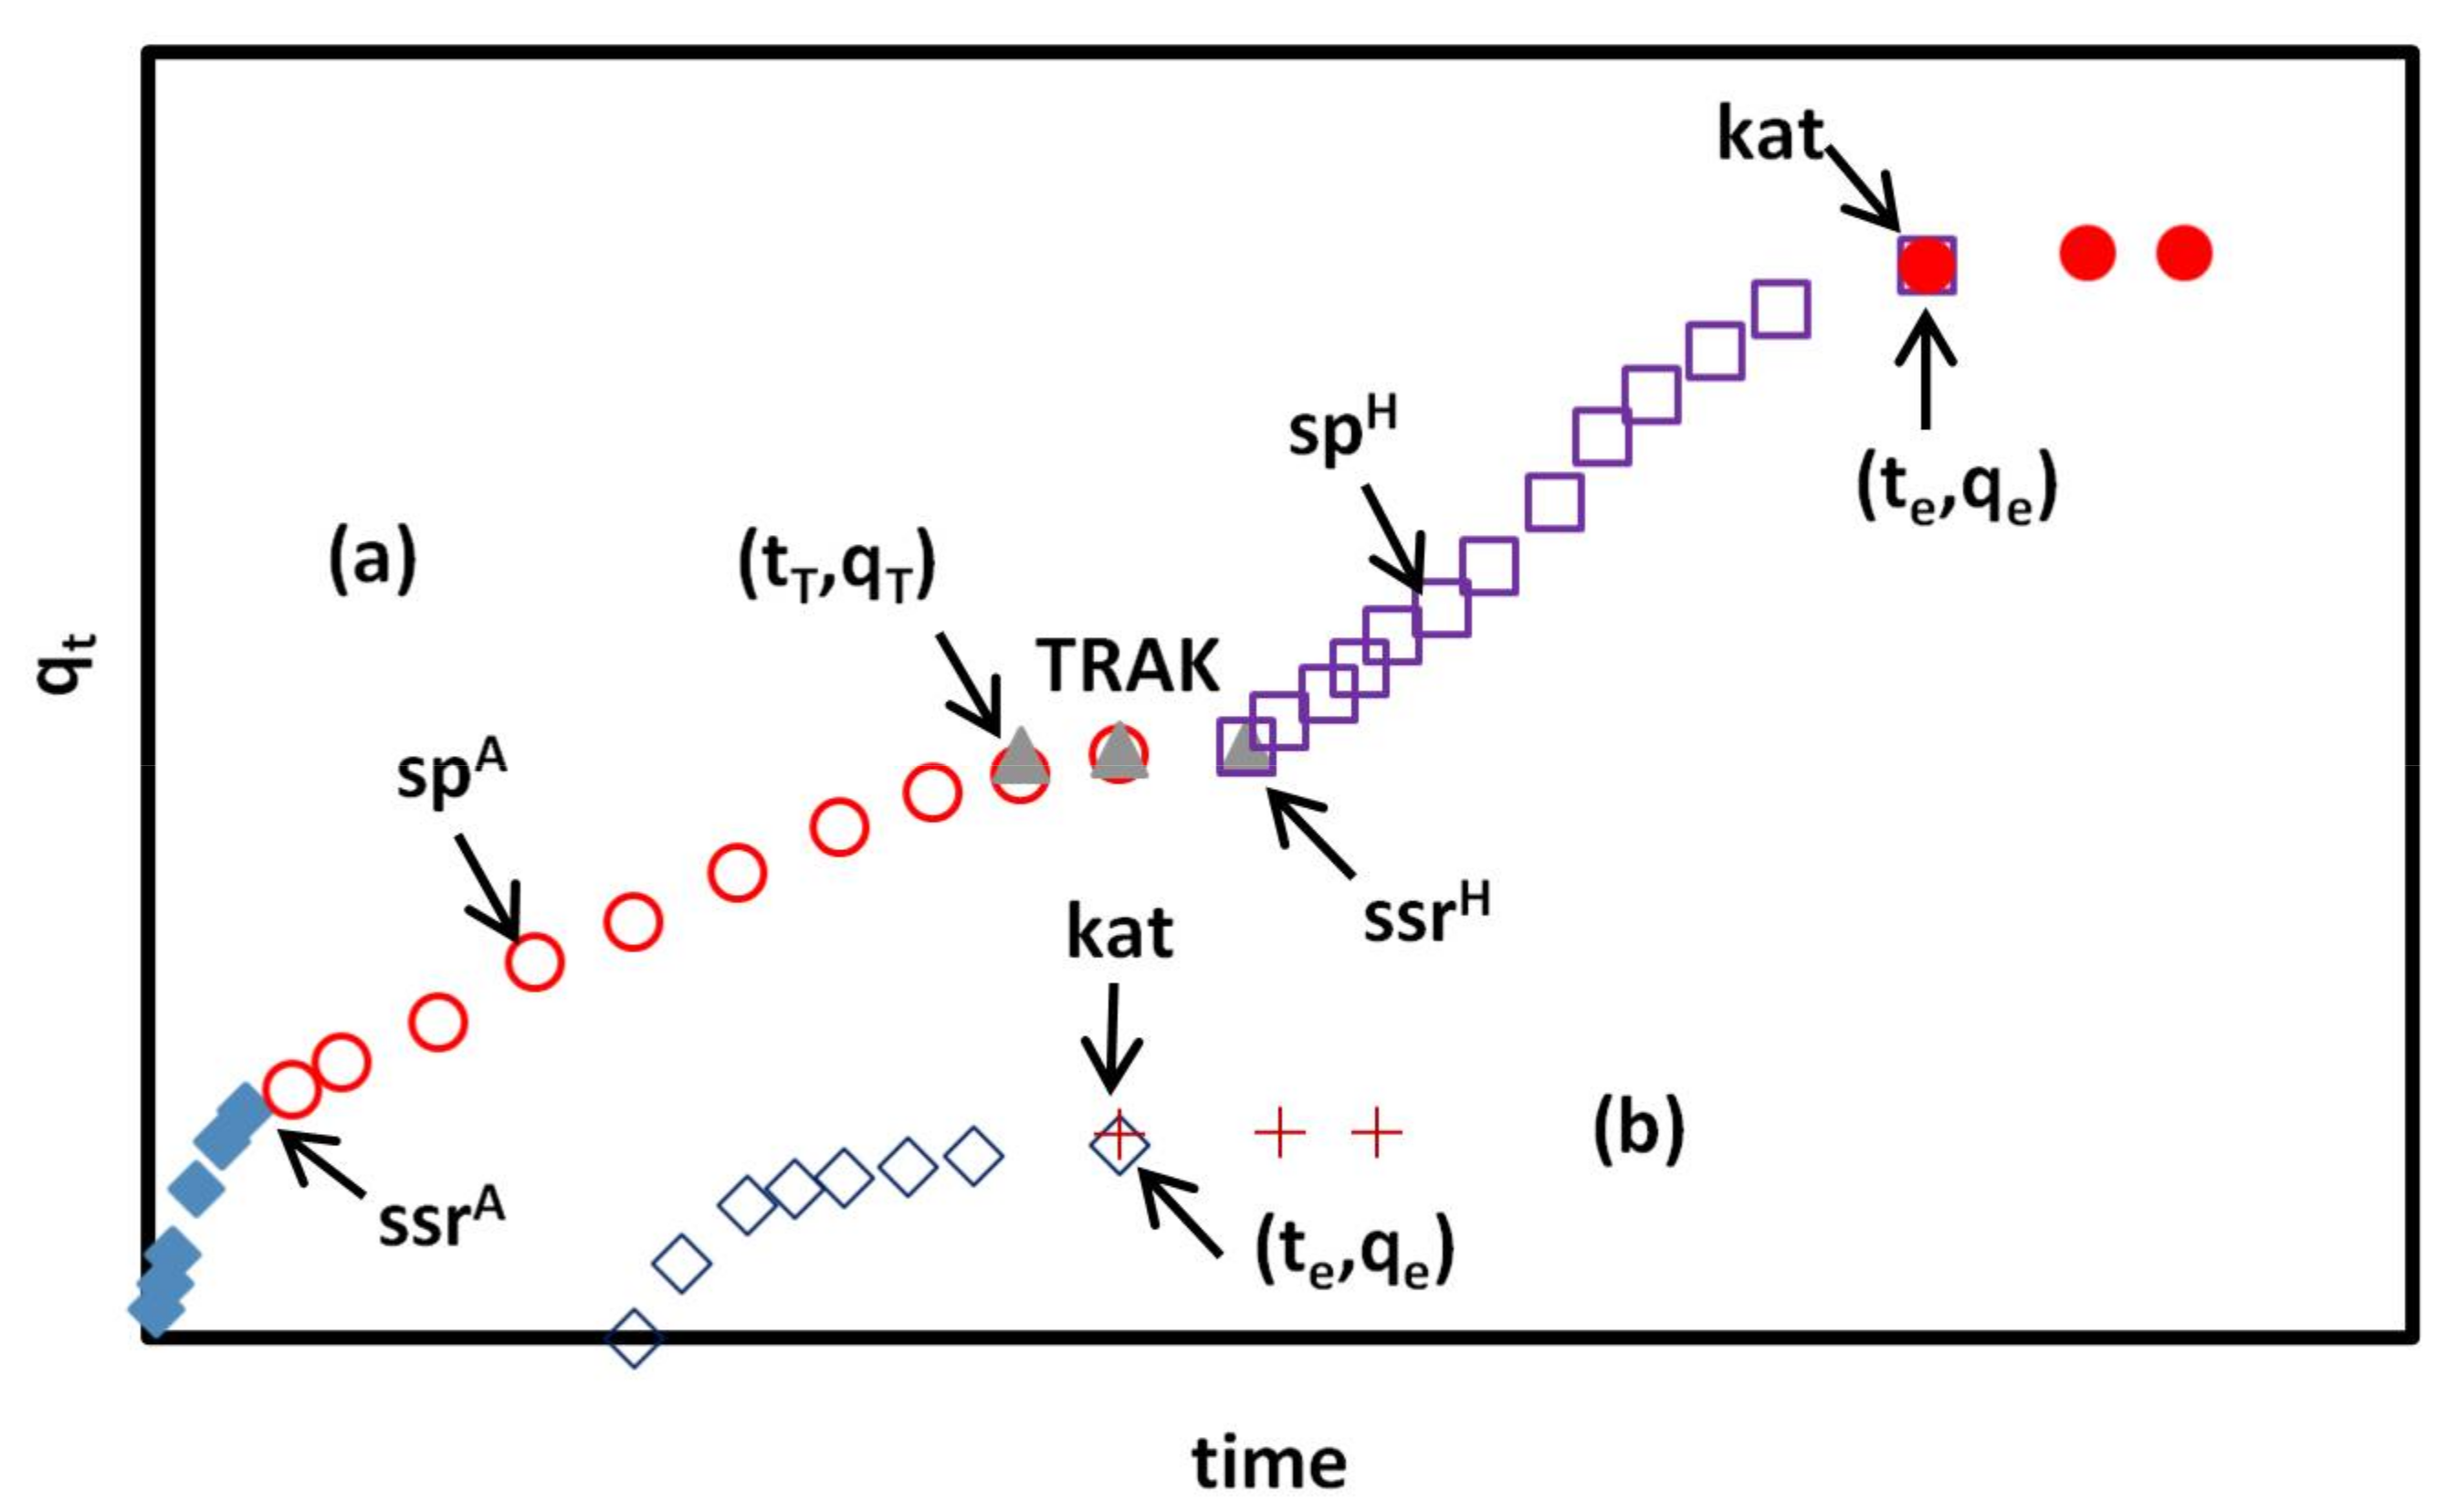
Figure 6.
(a) Typical bi-curve adsorption kinetic diagram of CR adsorption on GO/PAMAM in water and 0.1 M NaCl solutions according to the KASRA model. The first bi-regional kinetic curve ends at point and the second single-region kinetic curve starts from point. The superscripts of A, H, and NH refer to –NH3+, hydroxyl, and –NH2 sites, respectively. In alkaline solutions (except at pH = 13), the superscript H is replaced by NH; (b) At pH of 13, the diagram composes of a single-region curve, including only –NH2 sites. and symbols refer to sp points in the ISO equation. TRAK is an abbreviation for the “time range of interval between two successive adsorption kinetic curves”.
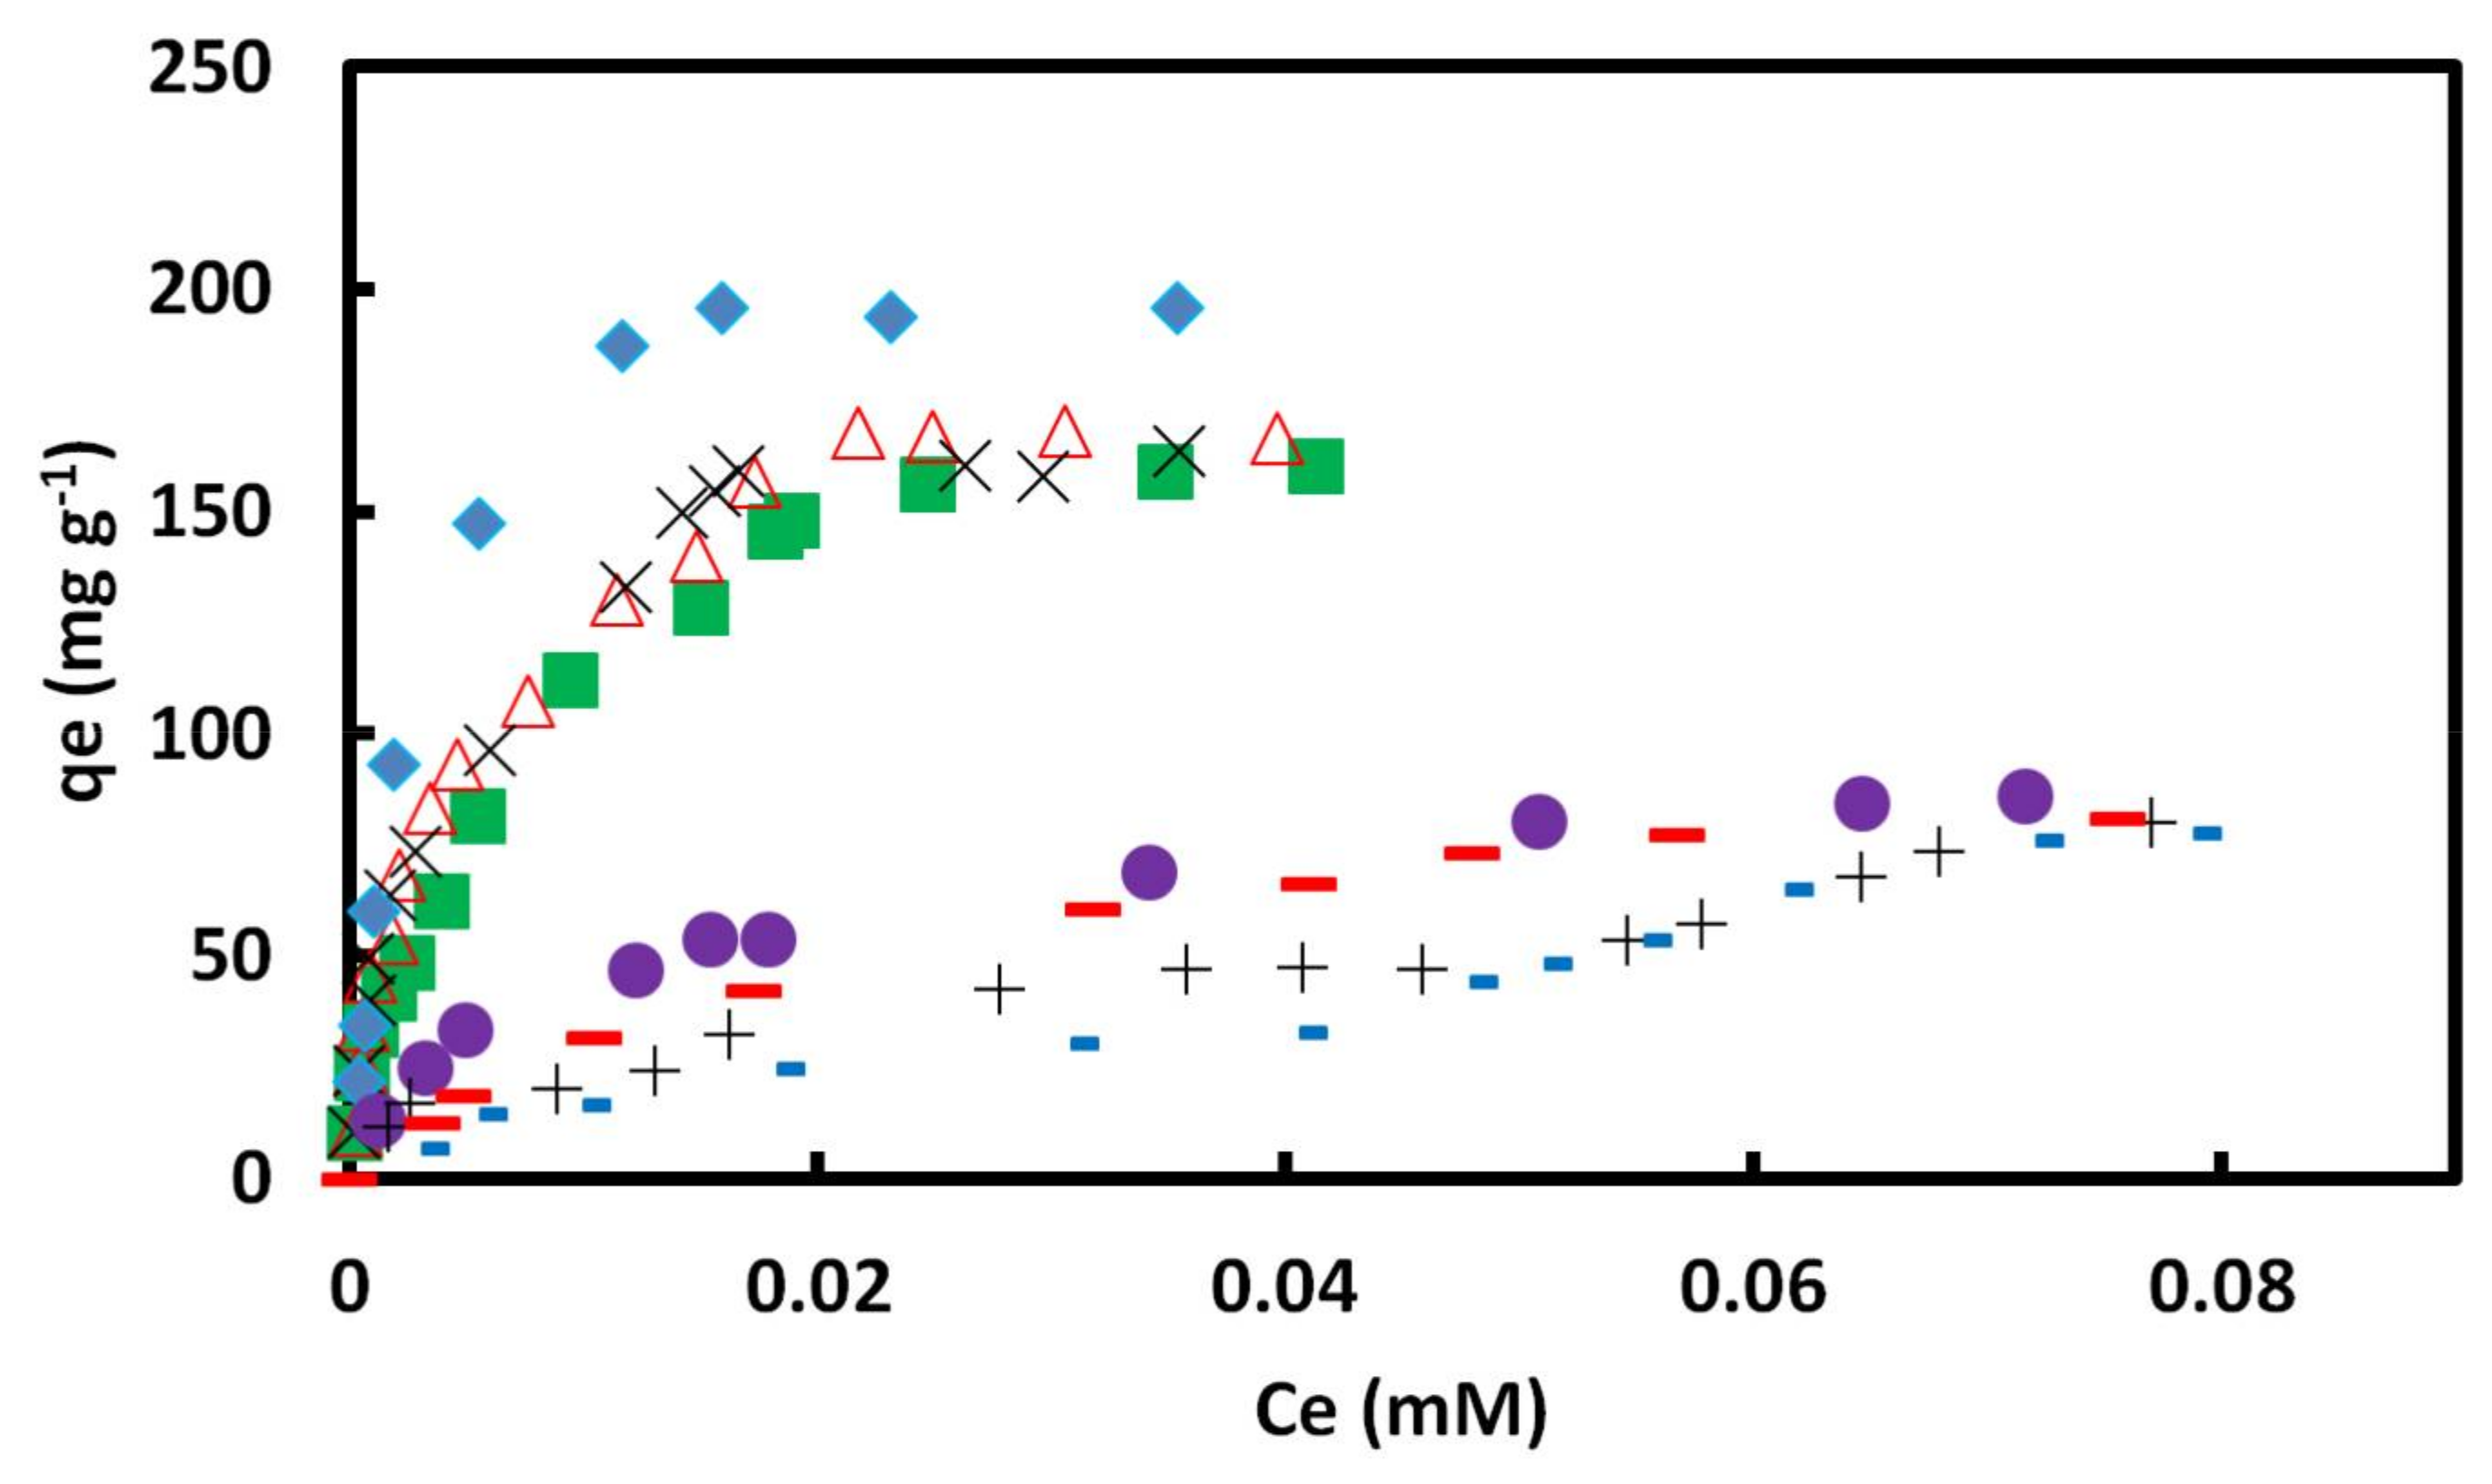
Figure 7.
versus for adsorption of CR on GO/PAMAM nanocompositefrom 0.05 mM CR at ■ 308, ∆ 318 and ×328 K in water and in ♦ 0.1 M NaCl, ● pH = 10, + pH = 11, − pH = 12 and ▬ pH = 13 solutions at 318 K.
Figure 7.
versus for adsorption of CR on GO/PAMAM nanocompositefrom 0.05 mM CR at ■ 308, ∆ 318 and ×328 K in water and in ♦ 0.1 M NaCl, ● pH = 10, + pH = 11, − pH = 12 and ▬ pH = 13 solutions at 318 K.
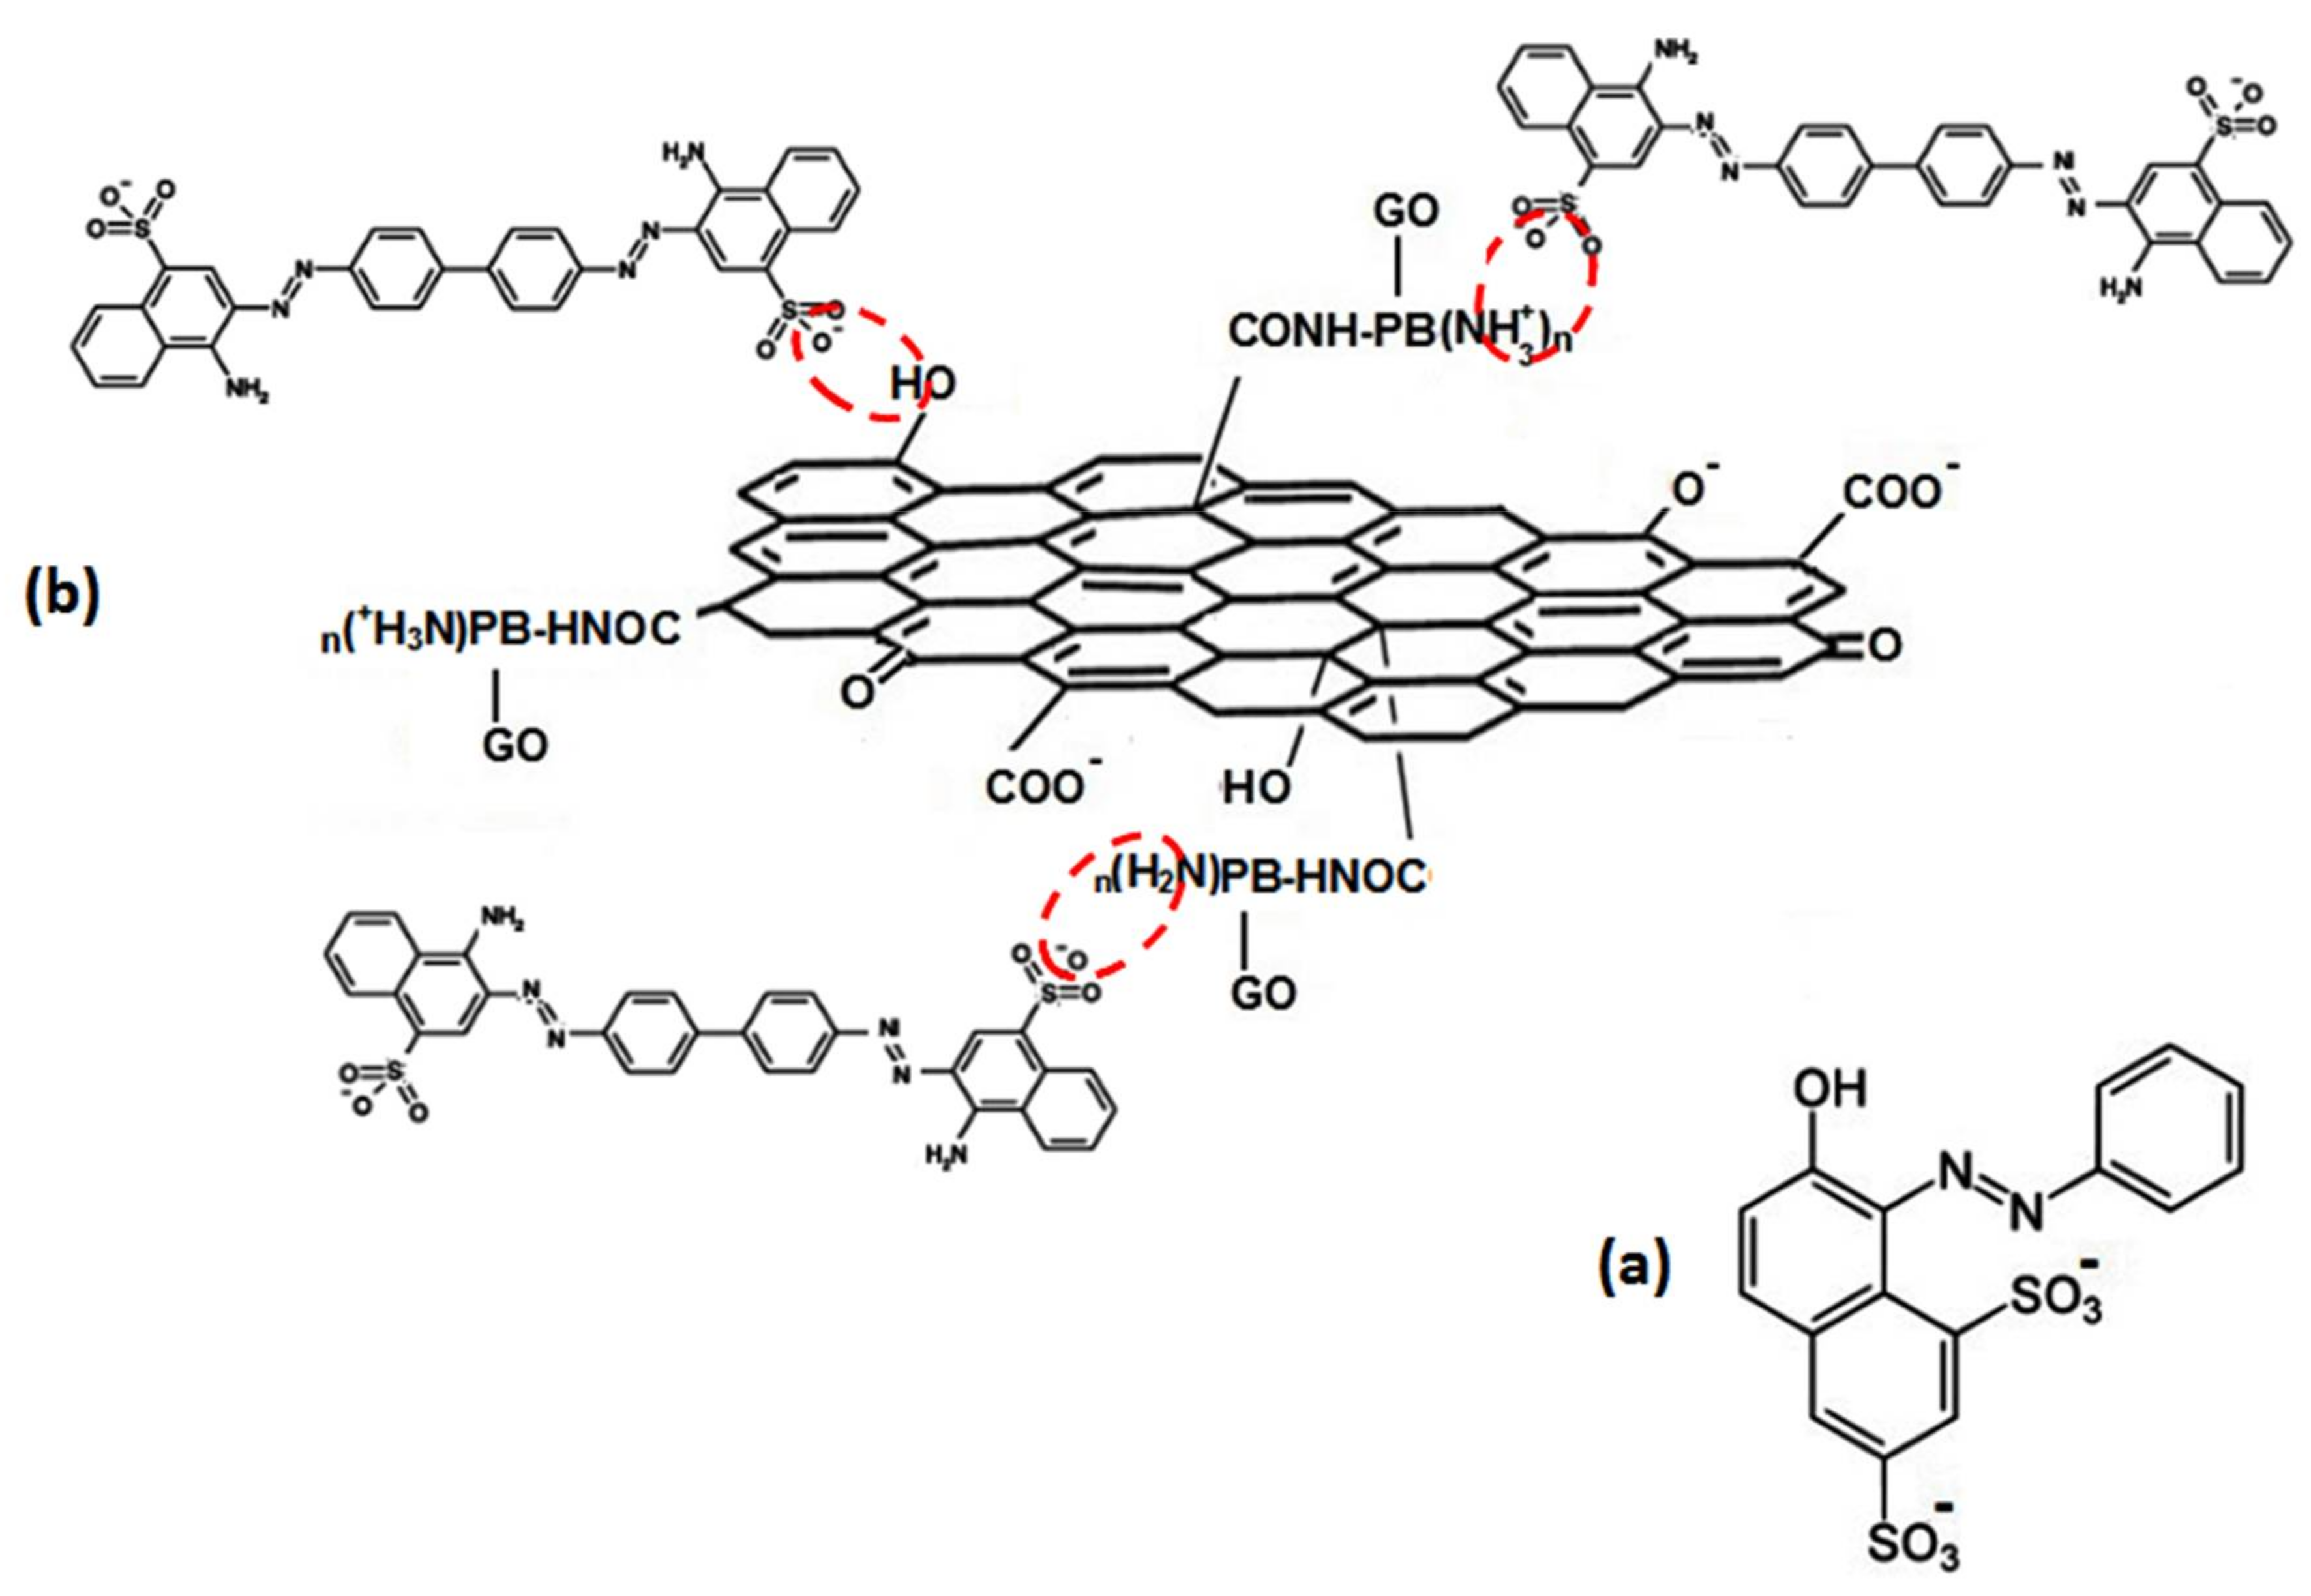
Figure 8.
(a) Orange G and (b) adsorption sites of GO/PAMAM to CR. PB is an abbreviation for PAMAM BODY.
Figure 8.
(a) Orange G and (b) adsorption sites of GO/PAMAM to CR. PB is an abbreviation for PAMAM BODY.
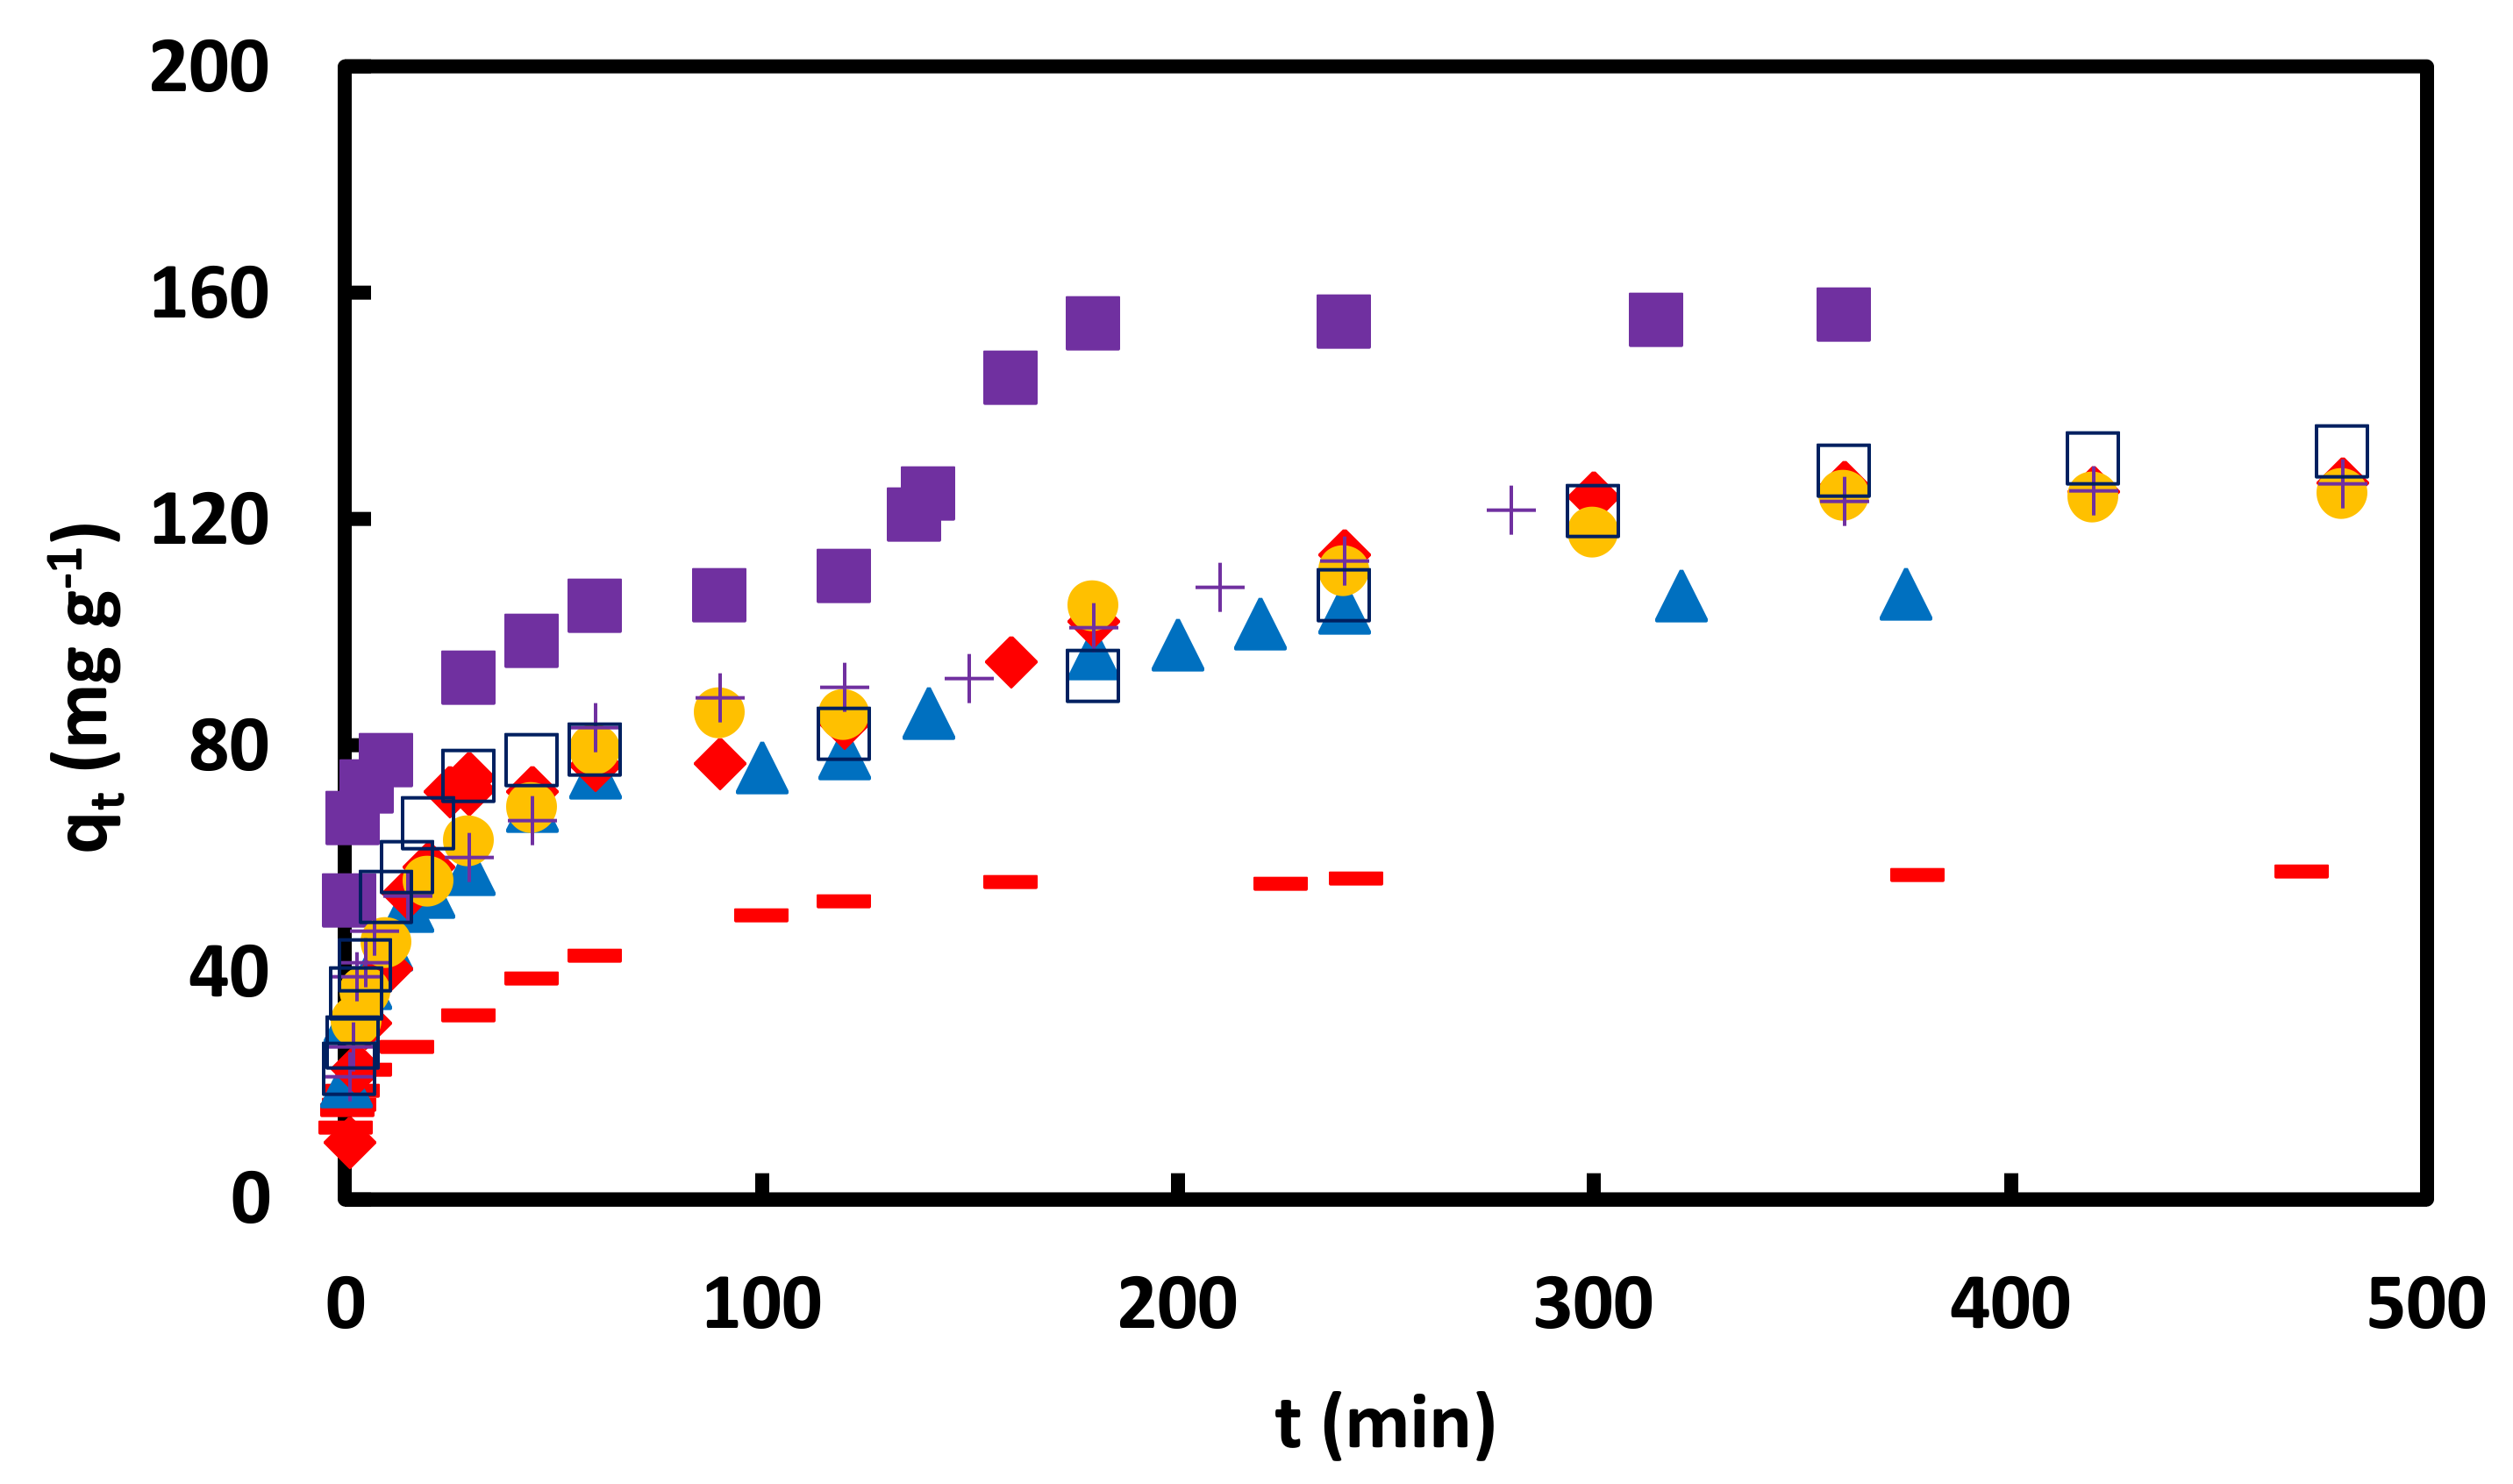
Figure 9.
versus t for adsorption of CR on GO/PAMAM nanocomposite in + water, − 0.1 M NaCl, ▬ pH = 10, ♦ pH = 11, □ pH = 12 and ▲ pH = 13 solutions in 0.05 mM CR and at 318 K and 100 rpm.
Figure 9.
versus t for adsorption of CR on GO/PAMAM nanocomposite in + water, − 0.1 M NaCl, ▬ pH = 10, ♦ pH = 11, □ pH = 12 and ▲ pH = 13 solutions in 0.05 mM CR and at 318 K and 100 rpm.
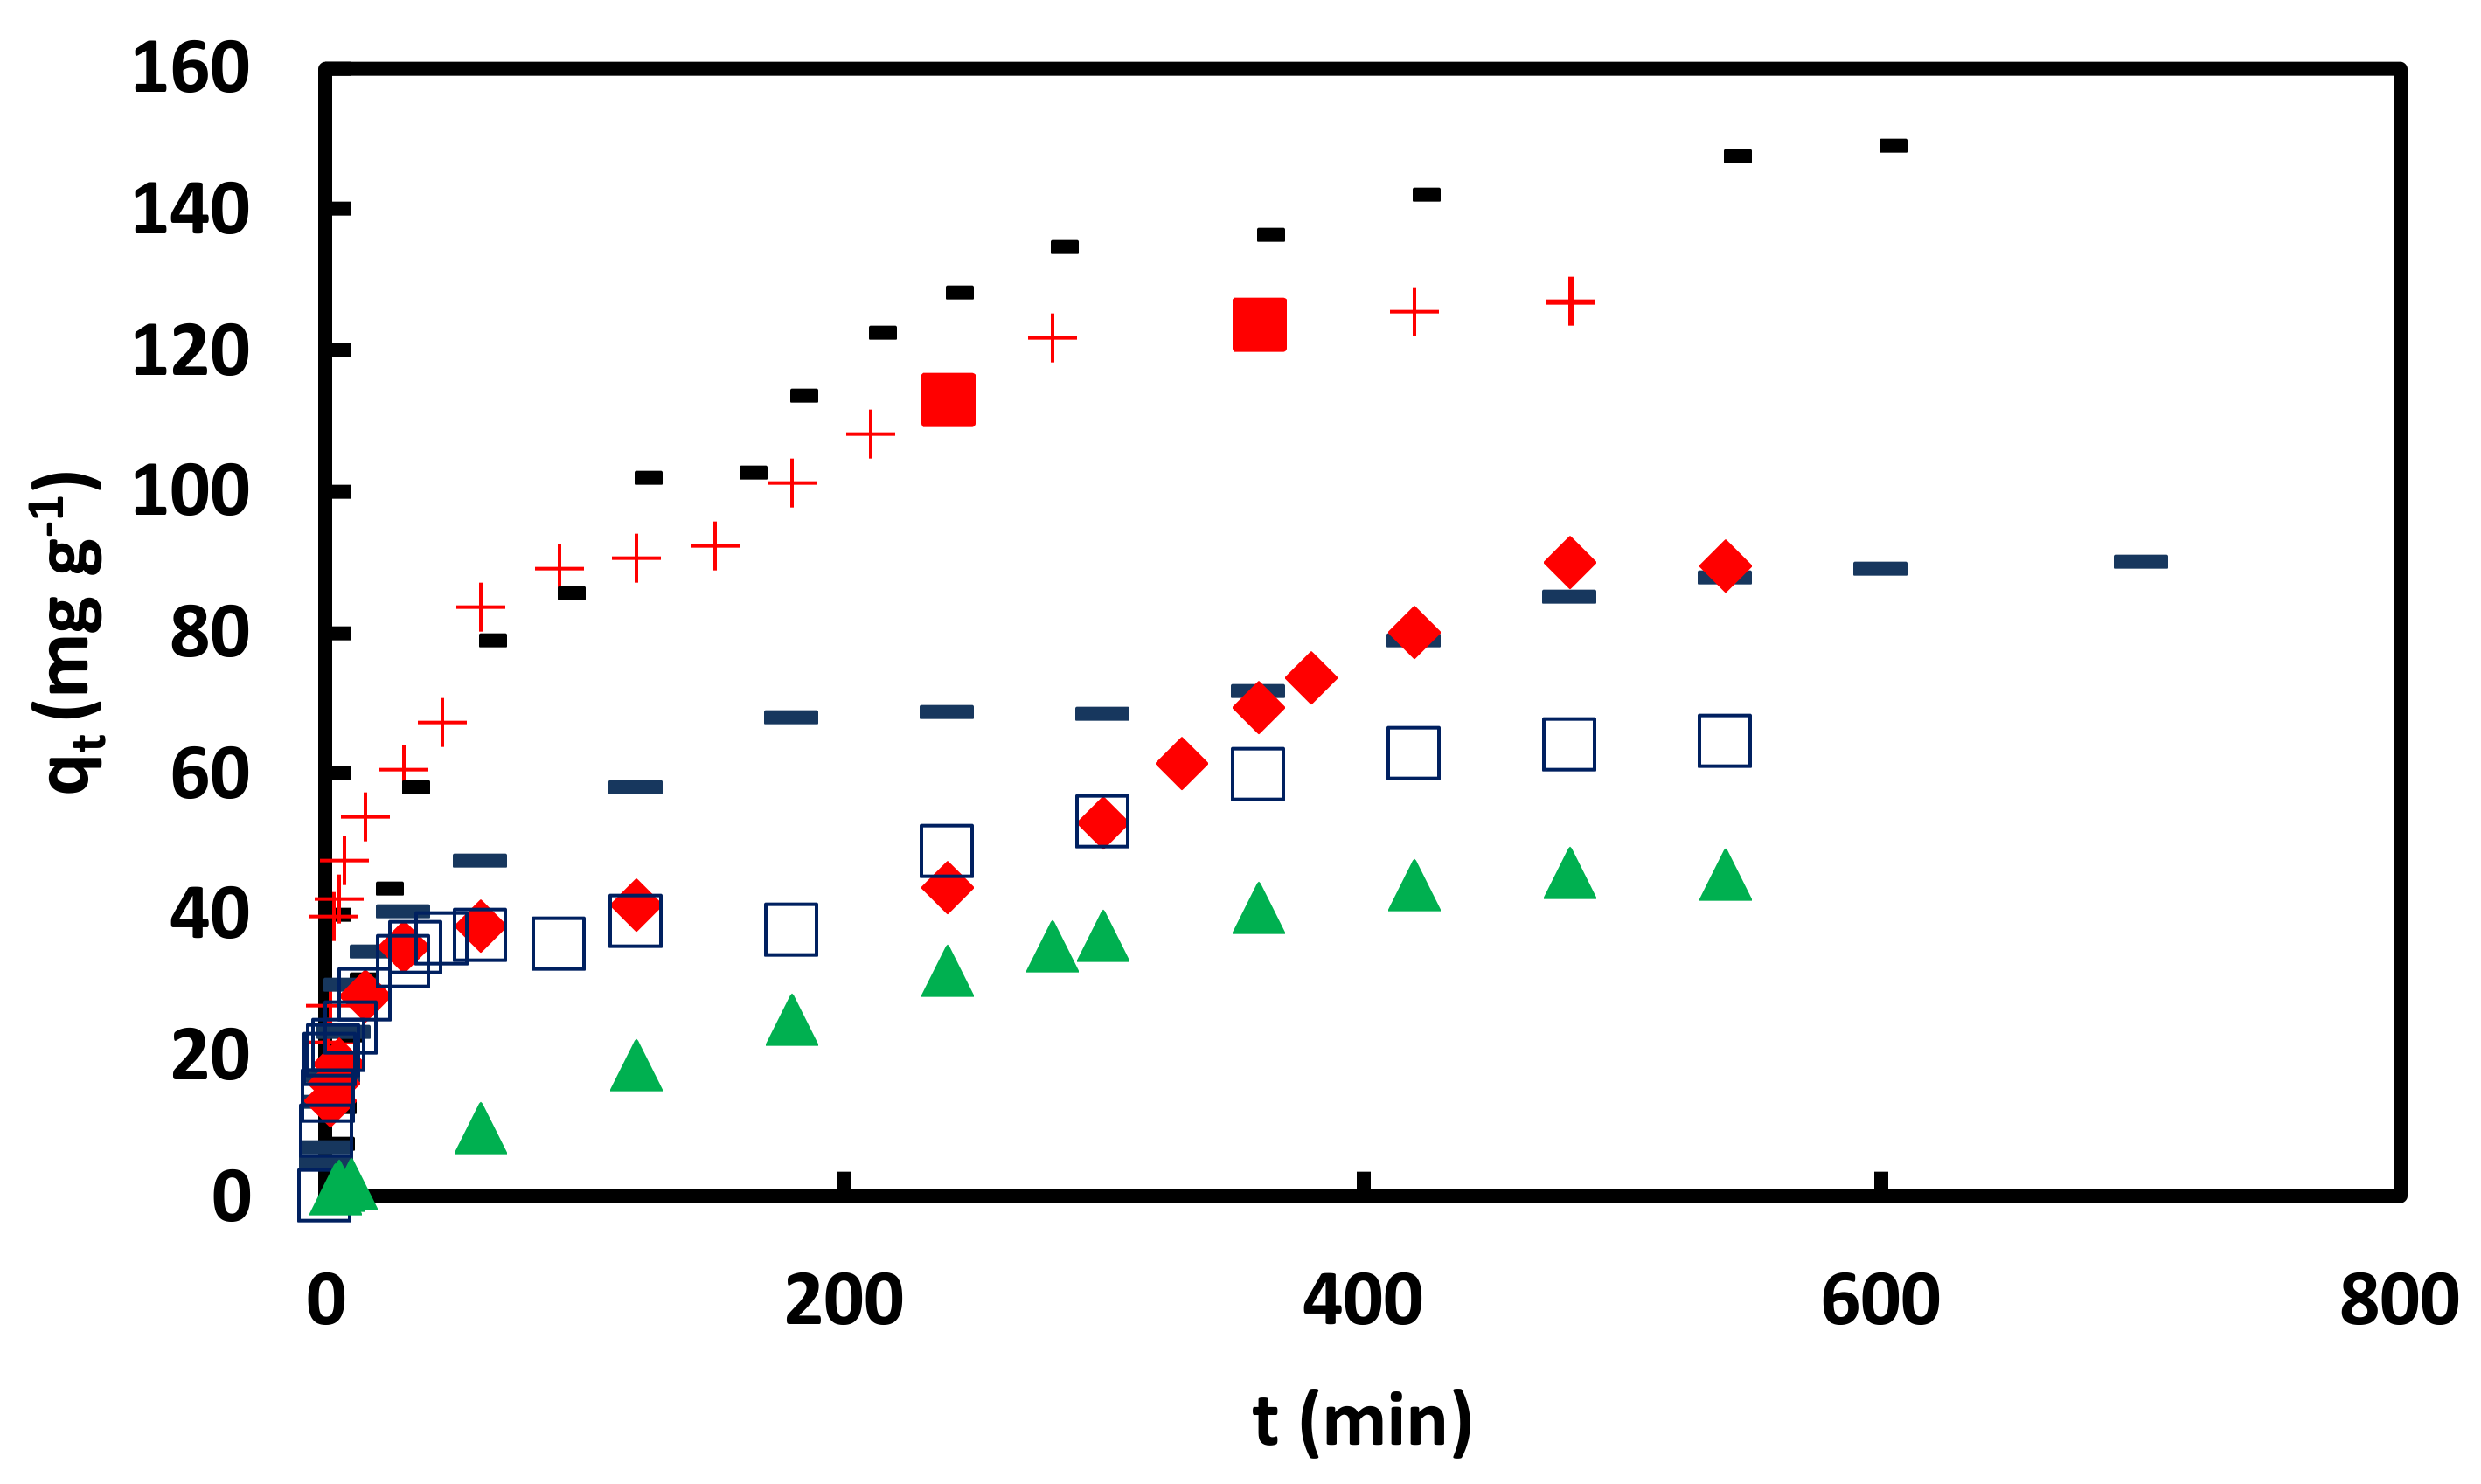
Figure 10.
versus t for adsorption of CR on GO/PAMAM nanocomposite in ▬ 0.02, ▲ 0.05 and ■ 0.09 mM CR at 308 K and 100 rpm; in 0.05 mM CR at ♦ 40, ● 70 and +100 rpm at 318 K and □ 0.05 mM CR at 328 K and 100 rpm.
Figure 10.
versus t for adsorption of CR on GO/PAMAM nanocomposite in ▬ 0.02, ▲ 0.05 and ■ 0.09 mM CR at 308 K and 100 rpm; in 0.05 mM CR at ♦ 40, ● 70 and +100 rpm at 318 K and □ 0.05 mM CR at 328 K and 100 rpm.
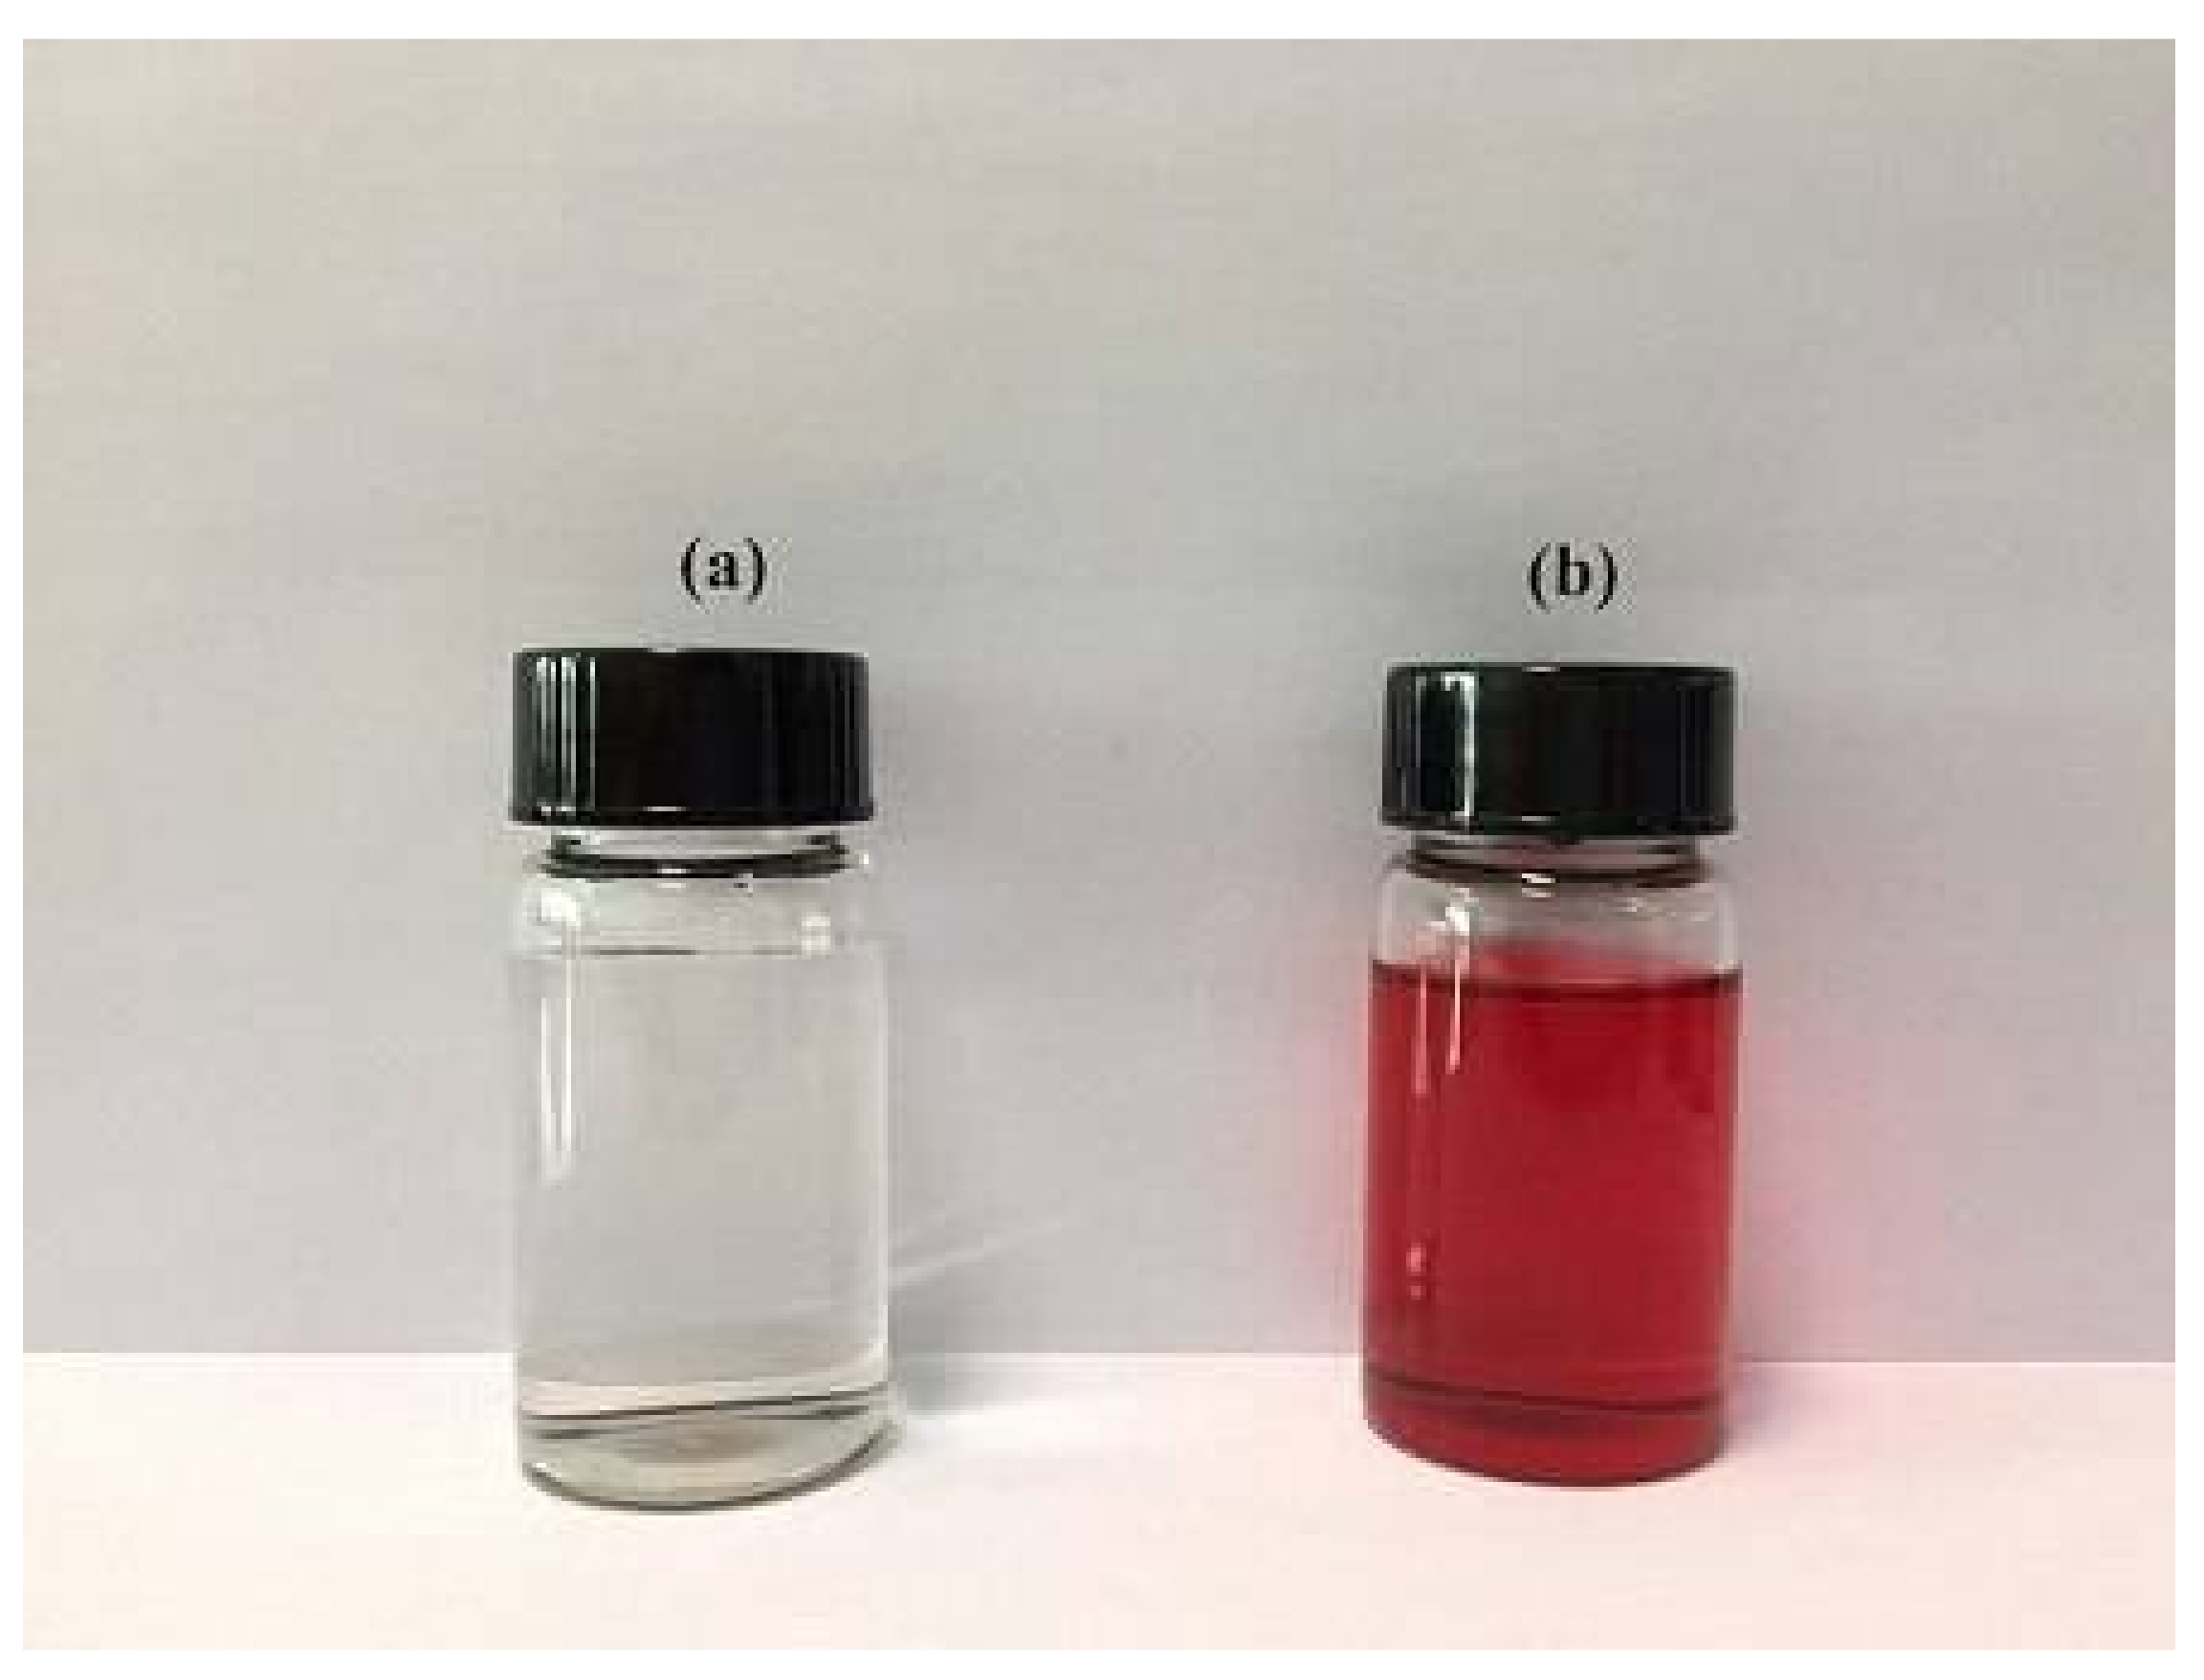
Figure 11.
Ethylenediamine (a) before and (b) after extraction of CR from the CR-adsorbed GO/PAMAM.
Figure 11.
Ethylenediamine (a) before and (b) after extraction of CR from the CR-adsorbed GO/PAMAM.
Figure 12.
SEM images of CR-adsorbed GO/PAMAM prepared by (a) fresh GO/PAMAM and (b) and (c) two times regenerated GO/PAMAM samples in water under different initial conditions. Samples (b) and (c) had adsorbed CR molecules in water and at pH of 13 before regeneration cycles, respectively.
Figure 12.
SEM images of CR-adsorbed GO/PAMAM prepared by (a) fresh GO/PAMAM and (b) and (c) two times regenerated GO/PAMAM samples in water under different initial conditions. Samples (b) and (c) had adsorbed CR molecules in water and at pH of 13 before regeneration cycles, respectively.
Table 1.
The and values and parameters that were obtained from the Henry’s law for the adsorption of CR on GO/PAMAM in water and 0.1 M NaCl solutions in region I at 308–328 K.
Table 1.
The and values and parameters that were obtained from the Henry’s law for the adsorption of CR on GO/PAMAM in water and 0.1 M NaCl solutions in region I at 308–328 K.
| Solvent | T | | Henry’s Law | | | |
|---|
| | (K) | A | K | R2 | (mM) | (mg·g−1) |
|---|
| Water | 308 | −0.461 | 4.08 × 10⁷ | 0.99 | 5.8 × 10⁻⁴ | 23.5 |
| 318 | −0.462 | 5.01 × 10⁷ | 0.98 | 5.4 × 10⁻⁴ | 25.1 |
| 328 | −0.745 | 6.20 × 10⁷ | 0.98 | 3.9 × 10⁻⁴ | 24.2 |
| 0.1 M NaCl | 318 | −0.365 | 5.39 × 10⁷ | 0.99 | 6.3 × 10⁻⁴ | 34.4 |
| pH = 10 | 318 | 1.36 | 7.43 × 10⁶ | 0.98 | 3.3 × 10⁻³ | 24.7 |
| pH = 11 | 318 | 0.17 | 6.61 × 10⁶ | 0.98 | 8.9 × 10⁻³ | 20.3 |
| pH = 12 | 318 | −0.34 | 2.57 × 10⁶ | 0.99 | 1.0 × 10⁻³ | 16.6 |
| pH = 13 | 318 | −0.22 | 3.74 × 10⁶ | 0.99 | 4.9 × 10⁻³ | 18.7 |
Table 2.
The and values and parameters that were obtained from the Temkin and Langmuir equations for the adsorption of CR on GO/PAMAM in water, 0.1 M NaCl, and alkaline solutions in section IIA at 308–328 K.
Table 2.
The and values and parameters that were obtained from the Temkin and Langmuir equations for the adsorption of CR on GO/PAMAM in water, 0.1 M NaCl, and alkaline solutions in section IIA at 308–328 K.
| Solvent | T | Temkin | Langmuir | CRAC | | |
|---|
| | (K) | | | R2 | | K | R2 | (105 M) | (mM) | (mg·g−1) |
|---|
| Water | 308 | 19.09 | 5.71 × 10⁶ | 0.98 | 71.0 | 8.77 × 10⁵ | 0.99 | - | 3.9 × 10⁻³ | 62.1 |
| 318 | 26.17 | 6.44 × 10⁶ | 0.97 | 98.0 | 1.07 × 10⁶ | 0.94 | - | 4.6 × 10⁻³ | 93.0 |
| 328 | 25.78 | 6.80 × 10⁶ | 0.98 | 125.0 | 6.36 × 10⁵ | 0.97 | - | 6.0 × 10⁻³ | 96.3 |
| 0.1 M NaCl | 318 | 53.1 | 2.99 × 10⁶ | 0.99 | 1158.7 | 4.95 × 10⁴ | 0.98 | - | 1.9 × 10⁻³ | 93.1 |
| pH = 10 | 318 | 17.65 | 1.27 × 10⁶ | 0.99 | 76.9 | 1.44 × 10⁵ | 0.99 | 1.5–2.5 | 2.5 × 10⁻² | 53.7 |
| pH = 11 | 318 | 19.27 | 3.09 × 10⁵ | 0.98 | 83.3 | 3.54 × 10⁴ | 0.98 | 3.6–4.5 | 4.5 × 10⁻² | 53.8 |
| pH = 12 | 318 | 11.56 | 4.32 × 10⁵ | 0.99 | 49.8 | 5.06 × 10⁴ | 0.99 | 3.1–4.1 | 4.8 × 10⁻² | 44.4 |
| pH = 13 | 318 | 24.27 | 3.86 × 10⁵ | 0.99 | 102.0 | 4.49 × 10⁴ | 0.99 | - | - | - |
Table 3.
The and values and parameters obtained from the Temkin and Langmuir equations for adsorption of CR on GO/PAMAM in section IIB in water, 0.1 M NaCl, and alkaline solutions at 308–328 K.
Table 3.
The and values and parameters obtained from the Temkin and Langmuir equations for adsorption of CR on GO/PAMAM in section IIB in water, 0.1 M NaCl, and alkaline solutions at 308–328 K.
| Solvent | T | Temkin | Langmuir | | |
|---|
| | (K) | | | R2 | | K | R2 | (mM) | (mg·g−1) |
|---|
| Water | 308 | 51.88 | 8.61 × 10⁵ | 0.99 | 224.0 | 9.92 × 10⁴ | 0.99 | 2.5 × 10⁻² | 155.9 |
| 318 | 49.0 | 1.33 × 10⁶ | 0.97 | 211.0 | 1.70 × 10⁵ | 0.99 | 2.2 × 10⁻² | 167.6 |
| 328 | 47.3 | 1.49 × 10⁶ | 0.97 | 240.0 | 1.16 × 10⁵ | 0.97 | 2.6 × 10⁻² | 160.2 |
| 0.1 M NaCl | 318 | 53.4 | 2.95 × 10⁶ | 0.99 | 233.0 | 3.46 × 10⁵ | 0.99 | 1.3 × 10⁻² | 198.0 |
| pH = 10 | 318 | 29.43 | 2.77 × 10⁵ | 0.97 | 142.9 | 2.33 × 10⁴ | 0.97 | 7.2 × 10⁻² | 85.9 |
| pH = 11 | 318 | 80.55 | 3.57 × 10⁴ | 0.98 | −268.8 | −3074 | 0.98 | 7.7 × 10⁻² | 80.1 |
| pH = 12 | 318 | 71.8 | 3.88 × 10⁴ | 0.98 | −275.5 | −29,510 | 0.97 | 7.9 × 10⁻² | 77.8 |
| pH = 13 | 318 | - | - | - | - | - | - | 7.6 × 10⁻² | 81.0 |
Table 4.
Relative magnitude of region I and sections IIA and IIB for adsorption of CR on GO/PAMAM in water, 0.1 M NaCl, and alkaline solutions at 308–328 K.
Table 4.
Relative magnitude of region I and sections IIA and IIB for adsorption of CR on GO/PAMAM in water, 0.1 M NaCl, and alkaline solutions at 308–328 K.
| Solvent | T (K) | First Region | Section IIA | Section IIB |
|---|
| Water | 308 | 0.15 | 0.25 | 0.60 |
| 318 | 0.15 | 0.41 | 0.44 |
| 328 | 0.15 | 0.45 | 0.40 |
| 0.1 M NaCl | 318 | 0.17 | 0.30 | 0.53 |
| pH = 10 | 318 | 0.29 | 0.33 | 0.38 |
| pH = 11 | 318 | 0.21 | 0.37 | 0.42 |
| pH = 12 | 318 | 0.19 | 0.23 | 0.58 |
| pH = 13 | 318 | 0.39 | 0.61 | - |
Table 5.
Coefficients of the KASRA equation for kinetics of CR adsorption on GO/PAMAM nanocomposite at different temperatures and in various shaking rates and initial CR concentrations.
Table 5.
Coefficients of the KASRA equation for kinetics of CR adsorption on GO/PAMAM nanocomposite at different temperatures and in various shaking rates and initial CR concentrations.
| Solvent | T | [CR]0 | rpm | KASRA Region 1 (1st Curve) | KASRA Region 2 (1st Curve) | KASRA Single Region (2nd Curve) |
|---|
| | (K) | (mM) | | A | B | C | R2 | A | B | C | R2 | A | B | C | R2 |
|---|
| Corresponding to: | ARIAN Region I (–NH3+ Site) | ARIAN Section IIA (–NH3+ Site) | ARIAN Section IIB (–OH Site) |
| Water | 308 | 0.02 | 100 | −17.51 | 34.35 | 0 | 0.99 | −0.002 | 0.515 | 19.65 | 0.99 | - | - | - | - |
| 308 | 0.05 | 100 | −18.78 | 51.16 | 0 | 0.98 | −0.008 | 1.150 | | 0.98 | −8 × 10⁻⁴ | 0.48 | 34.68 | 0.98 |
| 308 | 0.09 | 100 | −19.29 | 72.25 | 0 | 0.99 | −0.007 | 1.055 | 66.81 | 0.99 | −0.001 | 1.35 | −26.71 | 0.98 |
| 318 | 0.05 | 40 | −0.815 | 10.21 | 0.27 | 0.98 | −0.005 | 2.13 | 20.60 | 0.98 | −7 × 10⁻⁴ | 0.50 | 33.47 | 0.98 |
| 318 | 0.05 | 70 | −1.60 | 15.33 | 0 | 0.98 | −0.008 | 1.26 | 32.50 | 0.98 | −5 × 10⁻⁴ | 0.38 | 48.26 | 0.98 |
| 318 | 0.05 | 100 | −2.35 | 19.48 | 1.20 | 0.96 | −0.012 | 1.185 | 37.62 | 0.97 | −4 × 10⁻⁴ | 0.41 | 41.17 | 0.99 |
| 328 | 0.05 | 100 | −3.62 | 22.32 | 1.10 | 0.97 | −0.03 | 2.41 | 30.32 | 0.99 | −1 × 10⁻⁴ | 0.25 | 52.40 | 0.99 |
| 0.1 M NaCl | 318 | 0.05 | 100 | −0.58 | 7.35 | 0.59 | 0.98 | −0.005 | 1.26 | 19.69 | 0.98 | −7 × 10⁻⁴ | 0.56 | 34.89 | 0.96 |
| Corresponding to: | ARIAN Region I (–NH3+ Site) | ARIAN Section IIA (–NH3+ Site) | ARIAN Section IIB (–NH2 Site) |
| pH = 10 * | 318 | 0.05 | 100 | −4.78 | 17.86 | −0.20 | 0.99 | −0.011 | 1.21 | 15.46 | 0.97 | −3 × 10⁻⁴ | 0.36 | –20.02 | 0.99 |
| pH = 11 * | 318 | 0.05 | 100 | −5.16 | 18.31 | 0 | 0.97 | −0.010 | 1.11 | 13.47 | 0.99 | −8 × 10⁻⁵ | 0.26 | –14.6 | 0.99 |
| pH = 12 * | 318 | 0.05 | 100 | −4.29 | 0.19 | 0.25 | 0.99 | −0.008 | 0.79 | 17.50 | 0.99 | −3 × 10⁻⁴ | 0.265 | –0.56 | 0.99 |
| pH = 13 | 318 | 0.05 | 100 | mg g−1 at min and
mg g−1 at min | - | - | - | - | −2 × 10⁻⁴ | 0.17 | 0.29 | 0.96 |
Table 6.
Experimental , , , , and values and coefficients of the KASRA equation for kinetics of CR adsorption on GO/PAMAM at different temperatures and in various shaking rates and initial CR concentrations.
Table 6.
Experimental , , , , and values and coefficients of the KASRA equation for kinetics of CR adsorption on GO/PAMAM at different temperatures and in various shaking rates and initial CR concentrations.
| Solvent | T | [CR]0 | rpm | | KASRA Regions 1 and 2 (1st Curve) | KASRA Single Region (2nd Curve) |
|---|
| | (K) | (mM) | | | | | | | | | | |
|---|
| | | | Corresponding to: | ARIAN Region I and Section IIA (–NH3+ Site) | ARIAN Section IIB (–OH Site) |
| Water | 308 | 0.02 | 100 | (160, 56.2) | −35.02 | 34.35 | (2, 19.5) | −0.004 | 0.51 | - | - | - |
| | 308 | 0.05 | 100 | (240, 104.6) | −37.56 | 51.16 | (1, 32.4) | −0.016 | 1.18 | (140, 86.1) | −0.002 | 0.255 |
| | 308 | 0.09 | 100 | (180, 154.8) | −38.58 | 72.25 | (2, 67.3) | −0.014 | 1.03 | (120, 110.1) | −0.002 | 1.11 |
| | 318 | 0.05 | 40 | (360, 126.0) | −1.63 | 10.21 | (5, 31.1) | −0.010 | 2.09 | (120, 84.1) | −1.4 × 10⁻⁴ | 0.33 |
| | 318 | 0.05 | 70 | (360, 124.3) | −3.20 | 15.33 | (5, 36.7) | −0.016 | 1.18 | (120, 85.8) | −0.001 | 0.26 |
| | 318 | 0.05 | 100 | (360, 123.6) | −4.70 | 19.48 | (3, 39.7) | −0.024 | 1.11 | (150, 92.3) | −0.001 | 0.29 |
| | 328 | 0.05 | 100 | (360, 128.9) | −7.24 | 22.32 | (3, 36.6) | −0.060 | 2.23 | (120, 82.4) | −2 × 10⁻⁴ | 0.23 |
| 0.1M NaCl | 318 | 0.05 | 100 | (420, 142.2) | −1.16 | 7.35 | (5, 23.0) | −0.010 | 1.21 | (160, 102.8) | −1.4 × 10⁻⁴ | 0.56 |
| | | | Corresponding to: | ARIAN Region I and Section IIA (–NH3+ Site) | ARIAN Section IIB (–NH2 Site) |
| pH = 10 * | 318 | 0.05 | 100 | (600, 89.1) | −9.16 | 17.86 | (3, 17.1) | −0.02 | 1.14 | (360, 71.7) | −6.1 × 10⁻⁴ | 0.15 |
| pH = 11 * | 318 | 0.05 | 100 | (480, 90.0) | −10.32 | 18.31 | (3, 16.1) | −0.020 | 1.05 | (240, 44.0) | −1.6 × 10⁻⁴ | 0.22 |
| pH = 12 * | 318 | 0.05 | 100 | (480, 63, 9) | −8.56 | 0.19 | (5, 21.3) | −0.017 | 0.71 | (180, 37.8) | −5.4 × 10⁻⁴ | 0.17 |
| pH = 13 | 318 | 0.05 | 100 | (480, 46.0) | 0 | 0 | (4, 1.5) | 0 | 0 | (10, 1.9) | −4 × 10⁻⁴ | 0.16 |
Table 7.
Coefficients of the pore-diffusion equation for kinetics of CR adsorption on GO/PAMAM nanocomposite at different temperatures and in various shaking rates and initial CR concentrations.
Table 7.
Coefficients of the pore-diffusion equation for kinetics of CR adsorption on GO/PAMAM nanocomposite at different temperatures and in various shaking rates and initial CR concentrations.
| Solvent | T | [CR]0 | rpm | KASRA Regions 1 and 2 (1st Curve) | KASRA Single Region (2nd Curve) | TRAK |
|---|
| | (K) | (mM) | | | I | | | I | | | I | (min) |
|---|
| | | Corresponding to: | ARIAN Region I and Section IIA (–NH3+ Site) | ARIAN Section IIB (–OH Site) | |
| Water | 308 | 0.02 | 100 | 18.3 | −0.02 | (0.8, 15.6) | 3.6 | 13.8 | - | - | - | - |
| | 308 | 0.05 | 100 | 31.9 | −6.8 | (1, 32.4) | 6.4 | 25.3 | (140, 86.1) | 5.0 | 28.0 | 60–120 |
| | 308 | 0.09 | 100 | 34.7 | 18.3 | (2, 67.3) | 5.9 | 59.2 | (120, 110.1) | 4.0 | 41.5 | 60–120 |
| | 318 | 0.05 | 40 | 14.1 | −1.4 | (5, 31.1) | 12.2 | 1.5 | (120, 84.1) | 6.3 | 16.0 | 25–90 |
| | 318 | 0.05 | 70 | 16.9 | 0.44 | (5, 36.7) | 7.5 | 21.3 | (120, 105) | 3.2 | 61.2 | 90–120 |
| | 318 | 0.05 | 100 | 18.9 | 0.12 | (5, 42.2) | 6.2 | 29.1 | (150, 92.3) | 6.4 | 14.3 | 60–120 |
| | 328 | 0.05 | 100 | 20.7 | −0.21 | (3, 36.6) | 10.3 | 19.6 | (120, 82.4) | 6.1 | 13.4 | 45–120 |
| 0.1M NaCl | 318 | 0.05 | 100 | 7.3 | −0.1 | (1, 7.4) | 9.4 | 1.3 | (120, 102.0) | 6.2 | 31.1 | 120–160 |
| | | Corresponding to: | ARIAN Region I and Section IIA (–NH3+ Site) | ARIAN Section IIB (–NH2 Site) | |
| pH = 10 * | 318 | 0.05 | 100 | 12.75 | −0.85 | (3, 17.1) | 5.0 | 11.0 | (360, 71.7) | 3.8 | −0.3 | 180–360 |
| pH = 11 * | 318 | 0.05 | 100 | 11.6 | 0.34 | (3, 16.1) | 5.3 | 7.2 | (240, 44.0) | 7.4 | −72.2 | 120–240 |
| pH = 12 * | 318 | 0.05 | 100 | 13.8 | −0.05 | (5, 21.3) | 3.5 | 13.7 | (180, 37.8) | 3.5 | −7.4 | 45–180 |
| pH = 13 | 318 | 0.05 | 100 | 0 | 0 | - | 0 | 0 | (10, 1.9) | 2.6 | −8.2 | - |
Table 8.
Coefficients of region 1 and region 2 (parts 2a and 2b) of the ISO equation for kinetics of CR adsorption on the –NH3+ (first available) sites of GO/PAMAM (on the first kinetic curve) at 308–328 K.
Table 8.
Coefficients of region 1 and region 2 (parts 2a and 2b) of the ISO equation for kinetics of CR adsorption on the –NH3+ (first available) sites of GO/PAMAM (on the first kinetic curve) at 308–328 K.
| Solvent | T | [CR]0 | rpm | | | | | | |
|---|
| | (K) | (mM) | Corresponding to ARIAN Region I and Section IIA (–NH3+ Site) |
|---|
| Water | 308 | 0.02 | 100 | 2322 | (5, 23.0) | 2063 | (60, 43.2) | 4642 | (3.9 × 10⁻³, 160, 56.2) |
| | 308 | 0.05 | 100 | 1550 | (5, 38.3) | 848 | (30, 58.5) | 2155 | (2.8 × 10⁻², 60, 75.6) |
| | 308 | 0.09 | 100 | 1402 | (5, 73.0) | 534 | (30, 92.2) | 768 | (6.0 × 10⁻², 60, 105.0) |
| | 318 | 0.05 | 40 | 2352 | (5, 31.1) | 1500 | (15, 54.1) | 3170 | (2.9 × 10⁻², 25, 72.0) |
| | 318 | 0.05 | 70 | 1277 | (10, 45.4) | 639 | (45, 69.2) | 2315 | (2.5 × 10⁻², 90, 85.9) |
| | 318 | 0.05 | 100 | 2486 | (7, 47.7) | 389 | (45, 67.3) | 3419 | (2.6 × 10⁻², 90, 89.0) |
| | 328 | 0.05 | 100 | 2594 | (5, 41.4) | 2406 | (20, 66.6) | 5150 | (2.7 × 10⁻², 45, 77.6) |
| 0.1 M NaCl | 318 | 0.05 | 100 | 1661 | (5, 23.0) | 779 | (60, 79.0) | 260 | (1.9 × 10⁻², 120, 102) |
| * pH = 10 | 318 | 0.05 | 100 | Table 9 | (3, 17.1) | 421 | (30, 40.5) | 263 | (3.8 × 10⁻², 180, 67.9) |
| * pH = 11 | 318 | 0.05 | 100 | Table 9 | (3, 16.1) | 1053 | (30, 35.6) | 605 | (3.8 × 10⁻², 120, 41.5) |
| * pH = 12 | 318 | 0.05 | 100 | Table 9 | (5, 21.3) | 1778 | (30, 33.4) | 3557 | (3.9 × 10⁻², 45, 36.6) |
| pH = 13 | 318 | 0.05 | 100 | 0 | - | 0 | - | 0 | (4.9 × 10⁻², 10, 1.9) |
Table 9.
Coefficients of region 1 of the ISO equation for kinetics of CR adsorption on the –NH
3+ (first available) sites of GO/PAMAM (on the first kinetic curve) at different pH values (from
Table 8).
Table 9.
Coefficients of region 1 of the ISO equation for kinetics of CR adsorption on the –NH
3+ (first available) sites of GO/PAMAM (on the first kinetic curve) at different pH values (from
Table 8).
| Solvent | T | [CR]0 | rpm | | | TRAK | |
|---|
| | (K) | (mM) | Corresponding to ARIAN Region I (–NH3+ Site) |
|---|
| pH = 10 | 318 | 0.05 | 100 | 4.9 × 10⁴ | (3.8 × 10⁻², 2, 17.1) | 2–3 | (3, 17.1) |
| pH = 11 | 318 | 0.05 | 100 | 1.6 × 10⁵ | (4.5 × 10⁻², 2, 16) | 2–3 | (3, 16.1) |
| pH = 12 | 318 | 0.05 | 100 | 1.1 × 10⁵ | (4.5 × 10⁻², 2, 19.4) | 2–5 | (5, 21.3) |
Table 10.
Coefficients of region 2 (part 2a and 2b) of the ISO equation for kinetics of CR adsorption on the hydroxyl or –NH2 sites of GO/PAMAM (on the second kinetic curve) at 308–328 K.
Table 10.
Coefficients of region 2 (part 2a and 2b) of the ISO equation for kinetics of CR adsorption on the hydroxyl or –NH2 sites of GO/PAMAM (on the second kinetic curve) at 308–328 K.
| Solvent | T | [CR]0 | rpm | | | | | |
| | (K) | (mM) | | Corresponding to ARIAN Section IIB (–OH Site) |
| Water | 308 | 0.02 | 100 | - | - | - | - | - |
| | 308 | 0.05 | 100 | (120, 78.8) | 758 | (200, 98.0) | 2221 | (1.9 × 10⁻², 240, 104.6) |
| | 308 | 0.09 | 100 | (120, 110.1) | 230 | (140, 124.7) | 1255 | (4.8 × 10⁻², 180, 154.8) |
| | 318 | 0.05 | 40 | (120, 84.1) | 616 | (240, 113.8) | 5890 | (1.5 × 10⁻², 360, 126.0) |
| | 318 | 0.05 | 70 | (120, 85.8) | 480 | (240, 111.0) | 686 | (1.5 × 10⁻², 360, 124.3) |
| | 318 | 0.05 | 100 | (150, 92.3) | 307 | (240, 113.1) | 493 | (1.6 × 10⁻², 360, 123.6) |
| | 328 | 0.05 | 100 | (120, 82.4) | 154 | (240, 106.8) | 1231 | (1.3 × 10⁻², 360, 128.9) |
| 0.1M NaCl | 318 | 0.05 | 100 | (100, 102.8) | 327 | (210, 122.6) | 980 | (9.2 × 10⁻³, 420, 142.2) |
| Solvent | T | [CR]0 | rpm | | | | | |
| | (K) | (mM) | | Corresponding to ARIAN Section IIB (–NH2 Site) |
| pH = 10 | 318 | 0.05 | 100 | (360, 71.7) | 346 | (480, 85.1) | 692 | (2.89 × 10⁻², 600, 89.1) |
| pH = 11 | 318 | 0.05 | 100 | (240, 44.0) | 324 | (420, 80.1) | 407 | (2.2 × 10⁻², 480, 90.0) |
| pH = 12 | 318 | 0.05 | 100 | (180, 37.8) | 275 | (360, 59.9) | 744 | (3.2 × 10⁻², 480, 63.9) |
| pH = 13 | 318 | 0.05 | 100 | (10, 19) | 109 | (240, 32.2) | 190 | (3.7 × 10⁻², 480, 46.0) |

