1. Introduction
Aluminium cast alloys generally feature a proper relation of fatigue strength to density in terms of lightweight design. Furthermore, their excellent castability enables the manufacturing of rather complex geometries [
1,
2]. Hence, aluminium cast components are quite commonly used for demanding production parts, as in the case of automotive engines or electric drivetrain components. However, the manufacturing process itself implicates heterogeneous material properties due to varying local feeding and cooling rates. Additionally, the local cooling rate significantly influences the microstructural properties, such as the secondary dendrite arm spacing (DAS) [
3]. Preliminary studies reveal that the local microstructure correlates well with the fatigue life [
4,
5,
6]. The major influence is given by the statistical distribution of defects and their spatial extent, as exemplified in [
7,
8,
9]. It has been shown that the local microstructure represented by the dendrite arm spacing value correlates well with the statistical size and distribution of inhomogeneities (e.g., micropores) [
10]. In order to enhance the survival probabilities of crucial cast components, it is therefore inevitable to consider local pore size distributions in the fatigue design process. Preliminary studies revealed that the statistical distribution of fatigue-initiating defect sizes in cast parts can be described well by extreme value statistics such as the generalized extreme value (GEV) distribution and extreme value distribution of type one [
11,
12,
13,
14]. The latter is also referred to as Gumbel distribution and facilitates the assessment of maximum extreme values of the distribution—see Equation (
1) [
15]. If minimal values have to be taken into account, the inverse formulation can be applied:
with
being the probability density function, its course is defined by the distribution parameters
and
, also called location and scale parameters. Tiryakioglu proposed a methodology to link the finite fatigue life with the cumulative distribution function of crack-initiating defect sizes [
16,
17]. By invoking the Paris–Erdoǵan law for stable crack growth, a proper relationship between the probability of failure
and micropore size distribution can be established—see Equation (
2) [
18]:
Hereby,
and
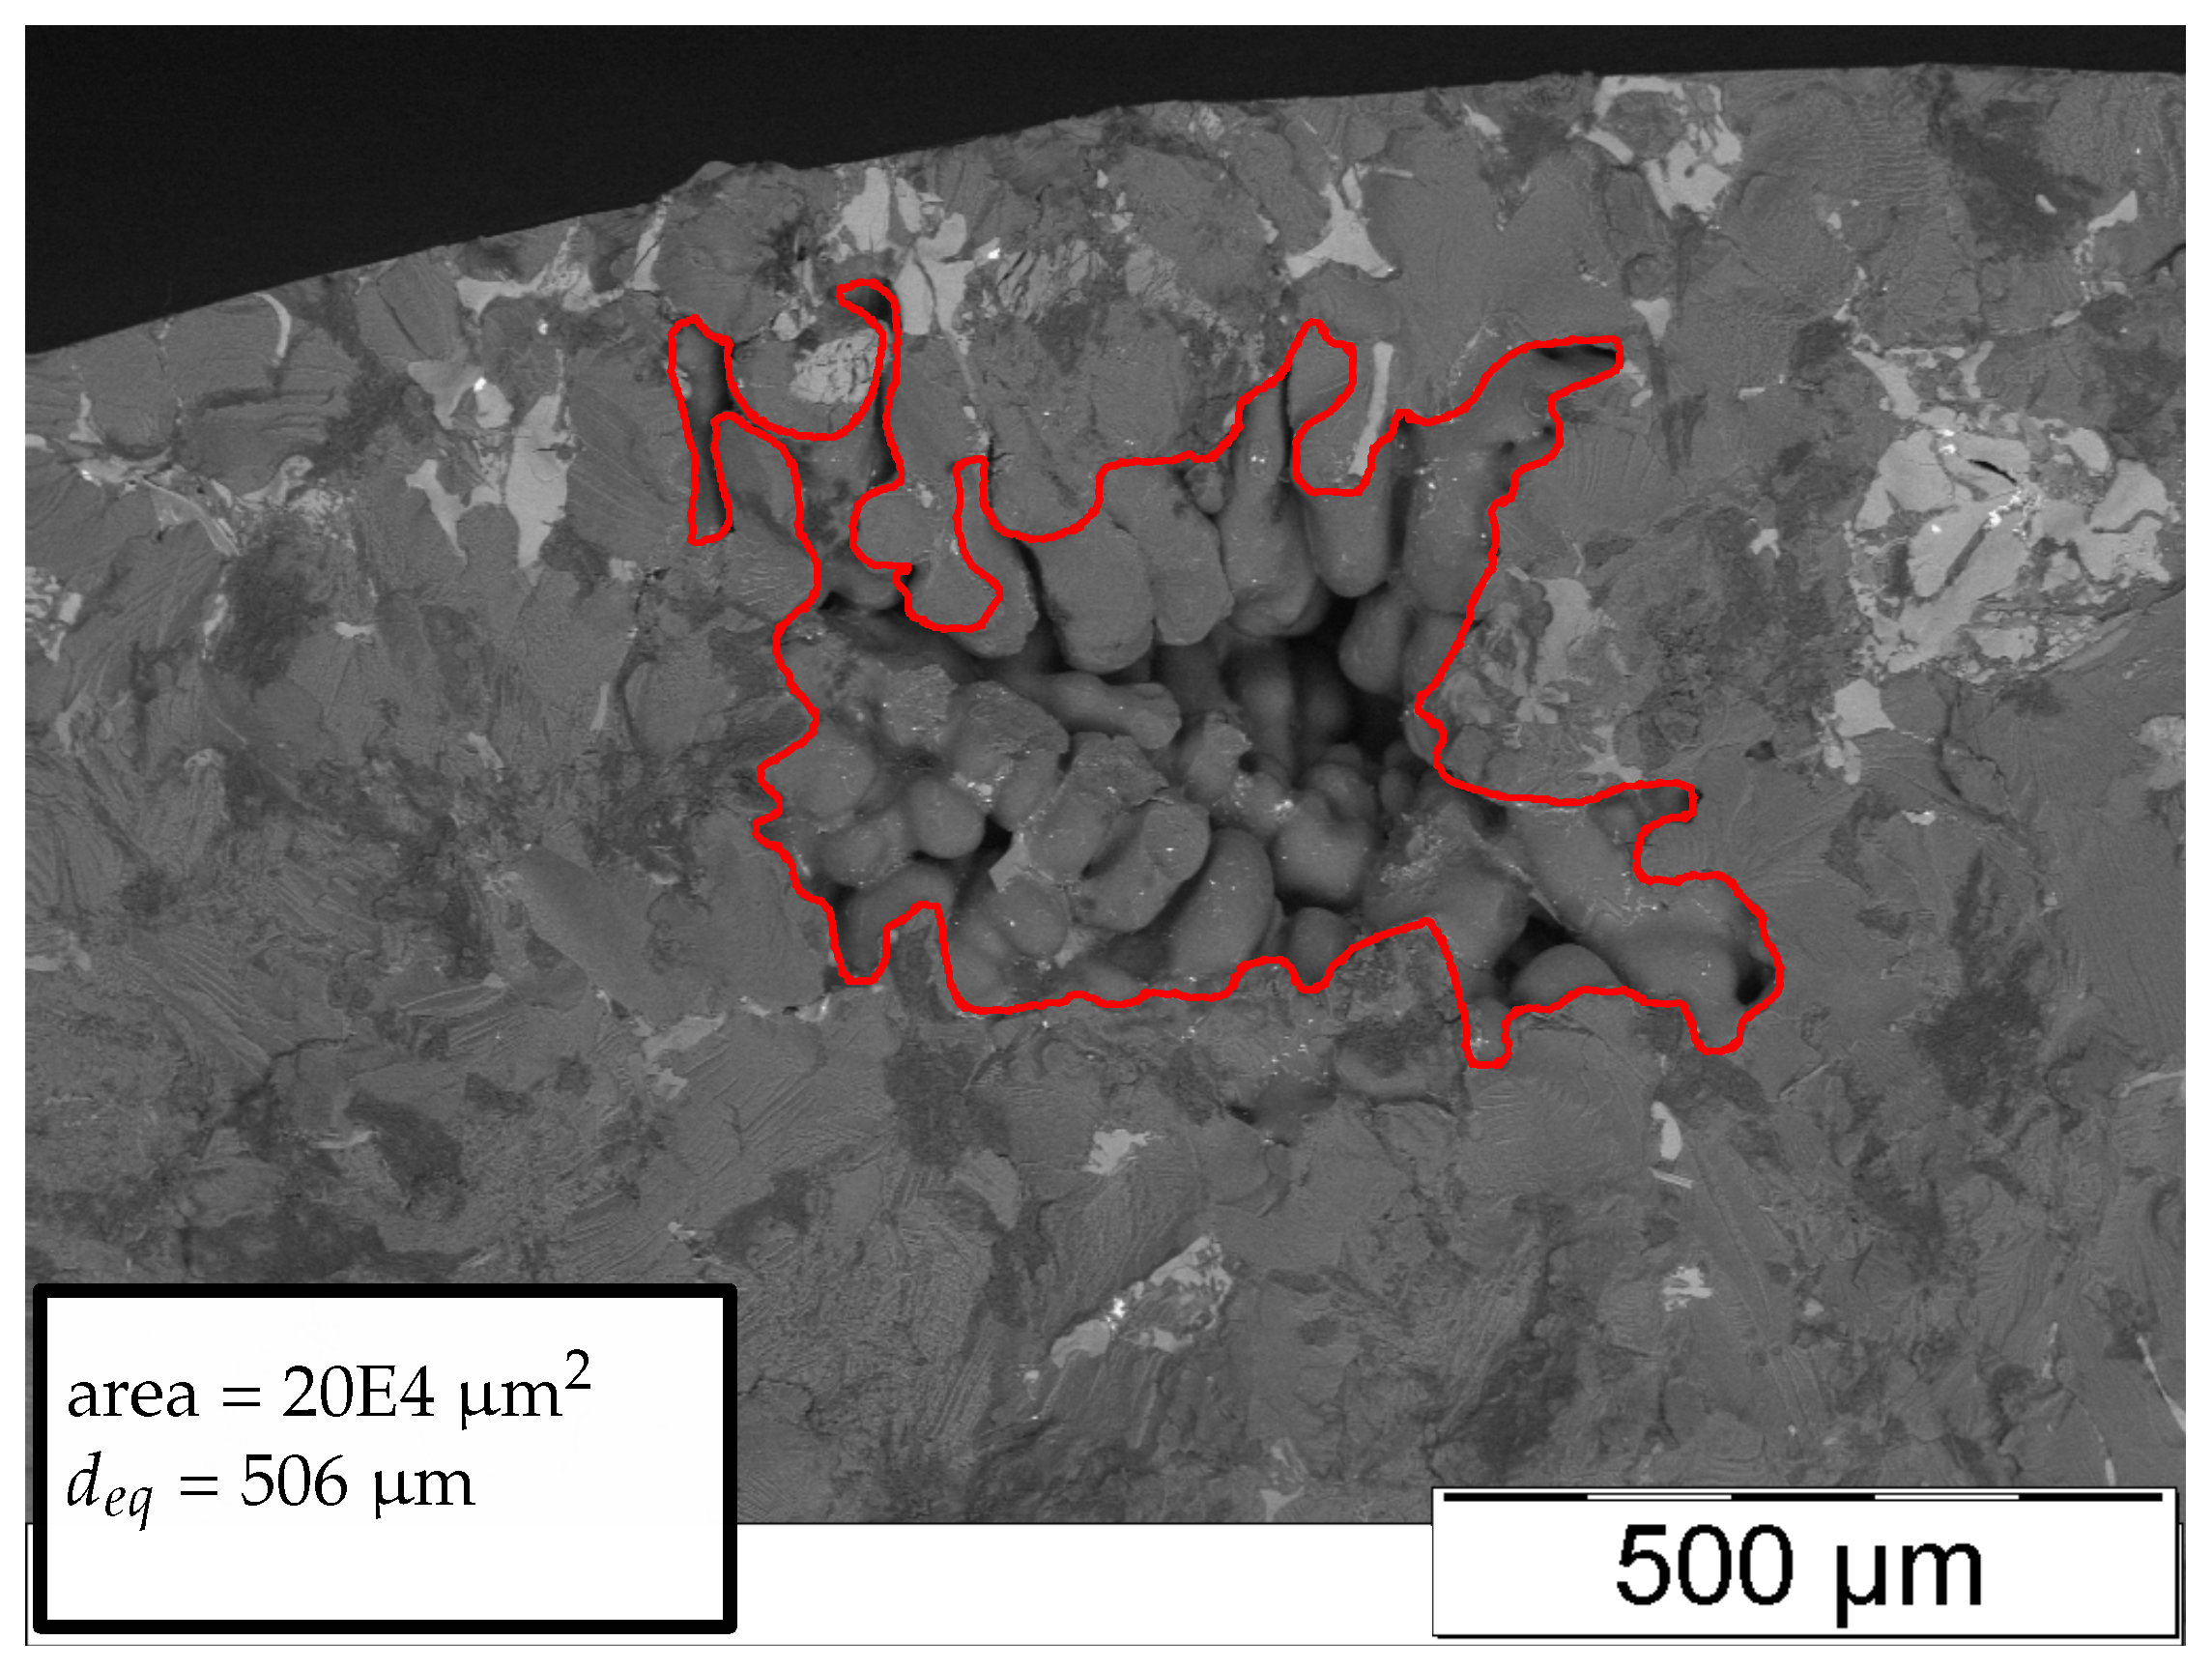
are the location and scale parameters of the Gumbel distribution of fracture initiating micropore sizes, represented by the equivalent circle diameter of the very defects
, which can be evaluated based on the measured crack-initiating defect size area utilising Equation (
3). Furthermore, Tiryakioglu’s model takes into account the load cycles until failure
and until crack initiation
, the load stress amplitude
, the crack propagation slope m and the offset parameter B. Nevertheless, due to the fact that this approach is based on the Paris–Erdoǵan law for stable crack growth, it is not valid for fatigue strength assessment in the long-life regime:
This methodology turned out to be well suited for assessing the finite-life of defect based fatigue failures [
19]. Further information on this approach is given in [
16]. Hence, the micropore sizes have to be subsequently investigated after fatigue testing by analysing the fracture surfaces, either by means of digital or scanning electron microscopy (SEM). One non-destructive methodology is the investigation of intrinsic flaws by X-ray computed tomography (XCT) scans [
20]. This technology supports the three-dimensional assessment of inhomogeneities, in terms of their often complex shapes, orientations, and locations. Preliminary studies propose the number of load cycles until crack initiation
is determined by the amount of cycles until fracture. The correlation factor is judged to be between 0.3 and 0.4 by [
21]. Another micro-cell model to estimate
is introduced in [
22]. The authors of [
23] propose the initiation lifetime to be significantly dependent on the microstructure, represented by the DAS and also of the very local stress condition near the flaw. With
and
being constants of the crack initiation model, the nominal stress amplitude
is amplified by a local stress concentration factor
(see Equation (
4)).
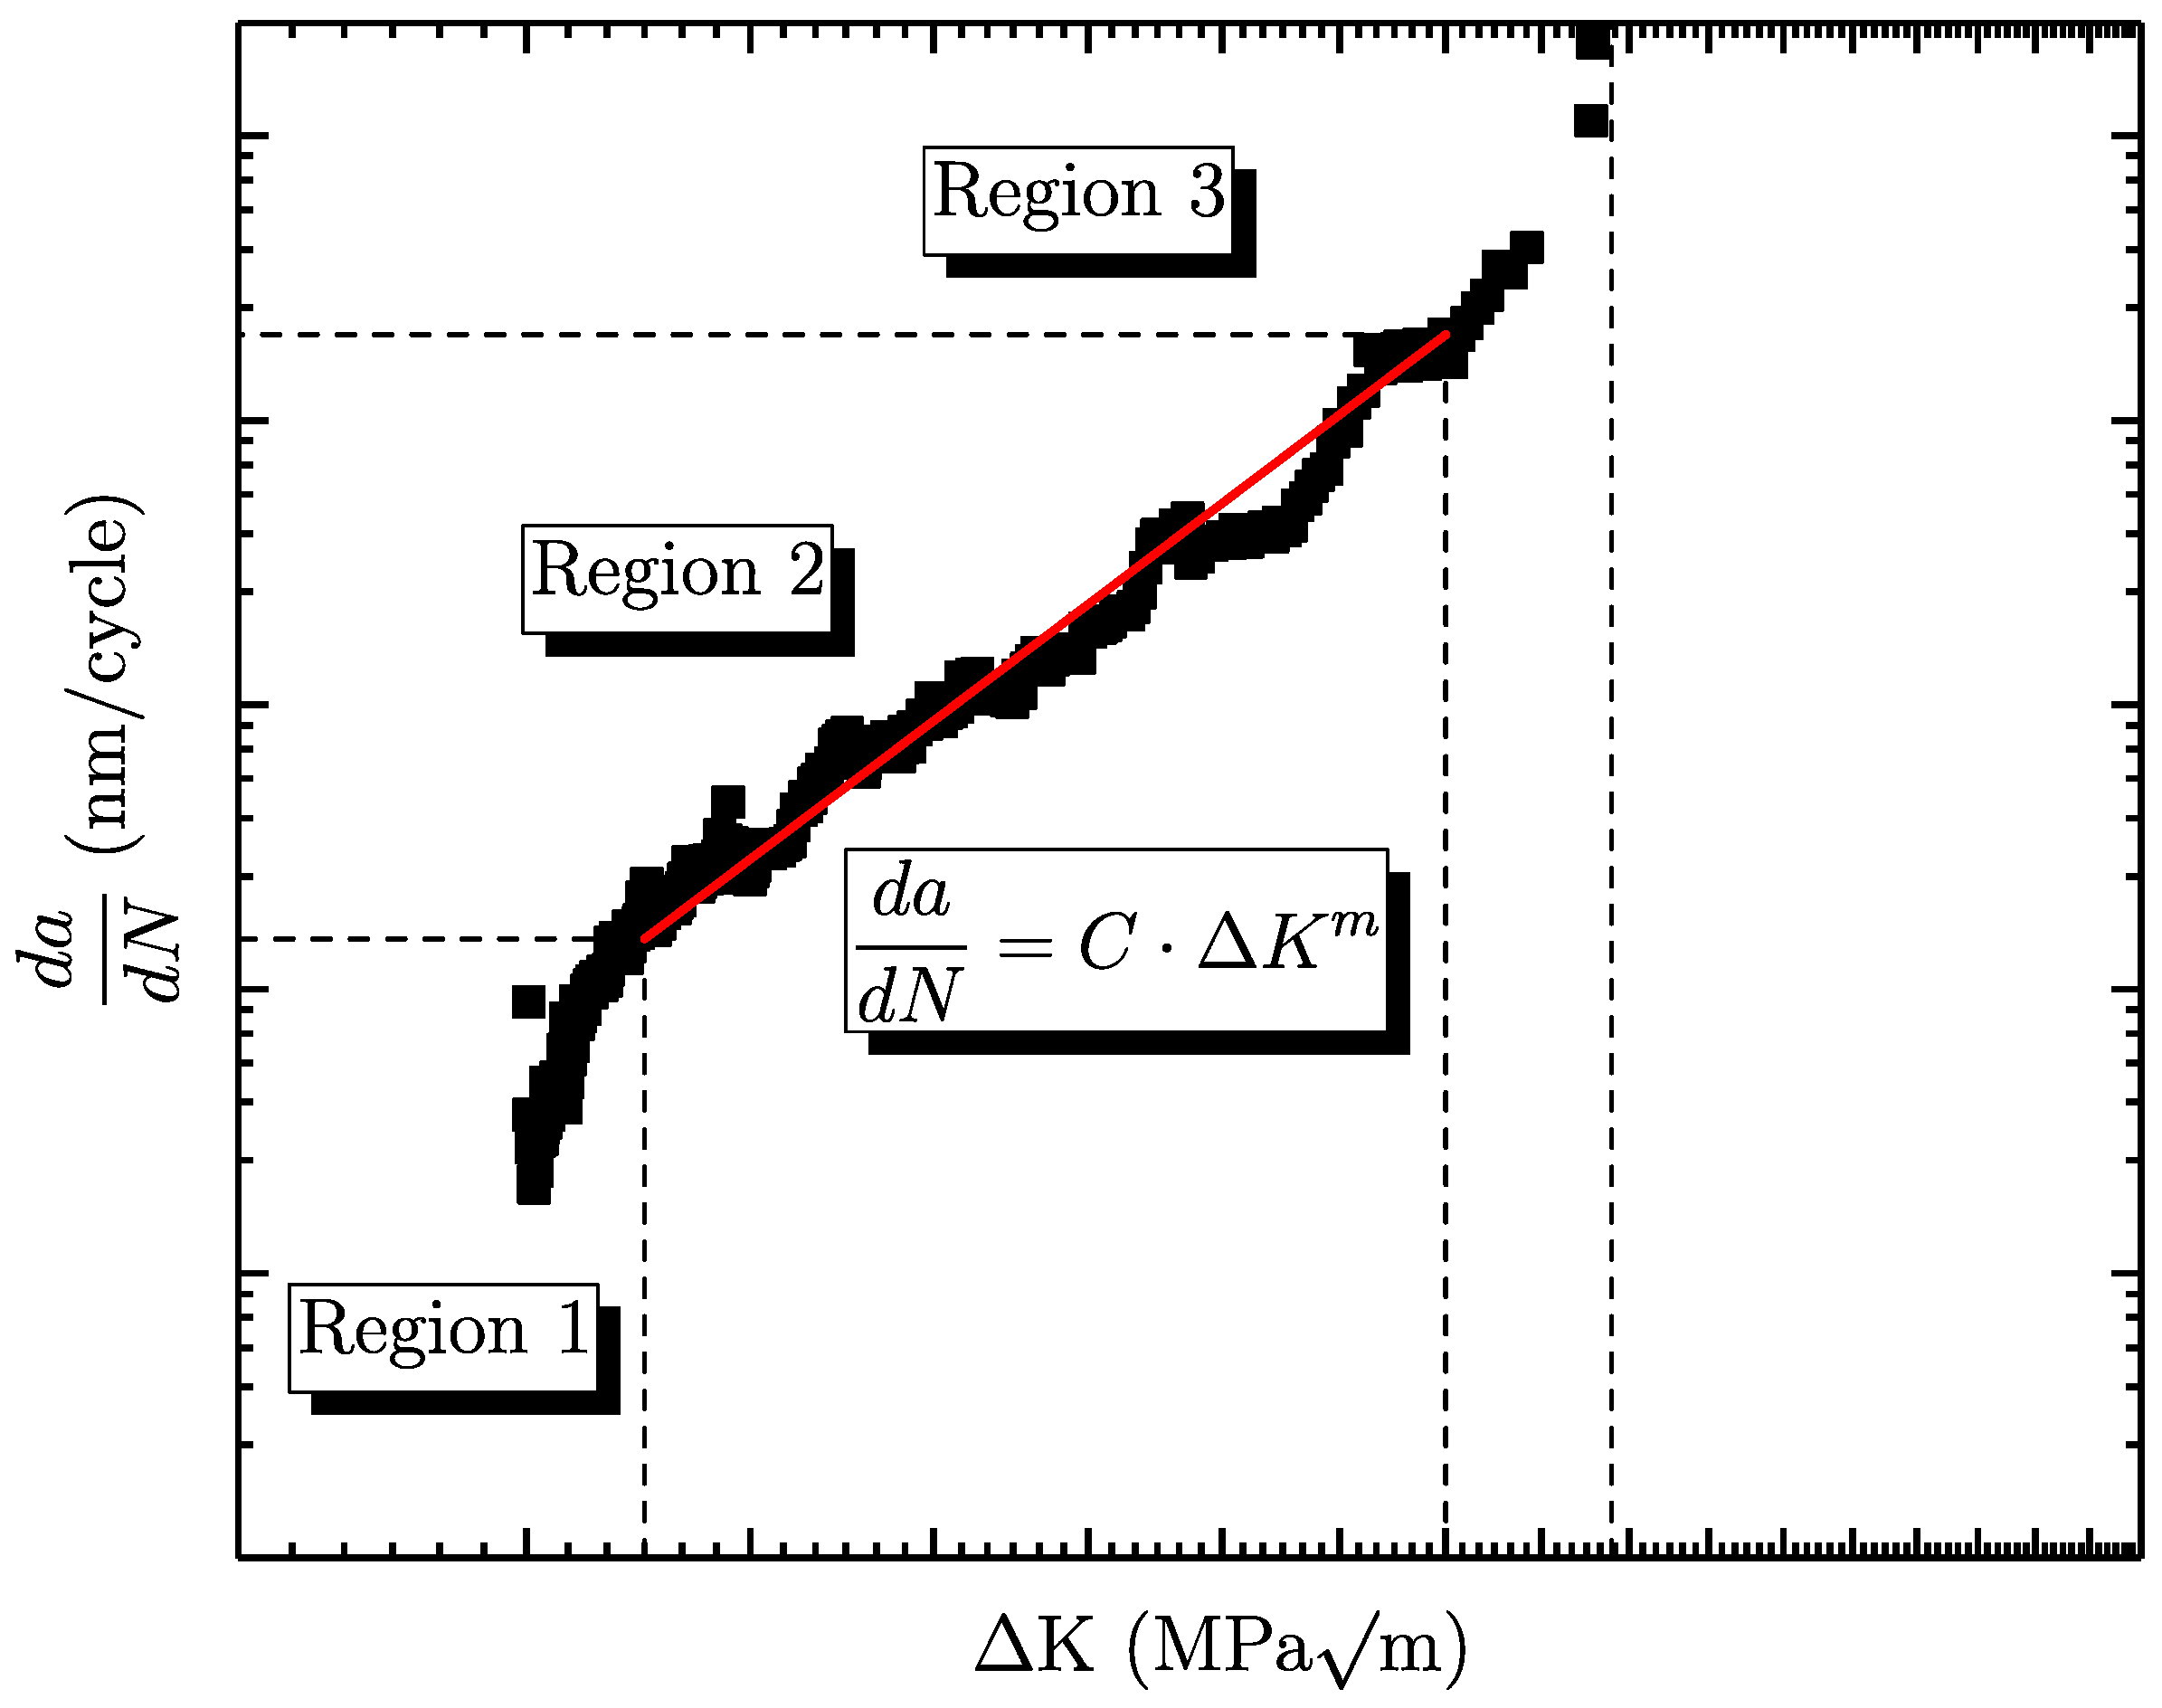
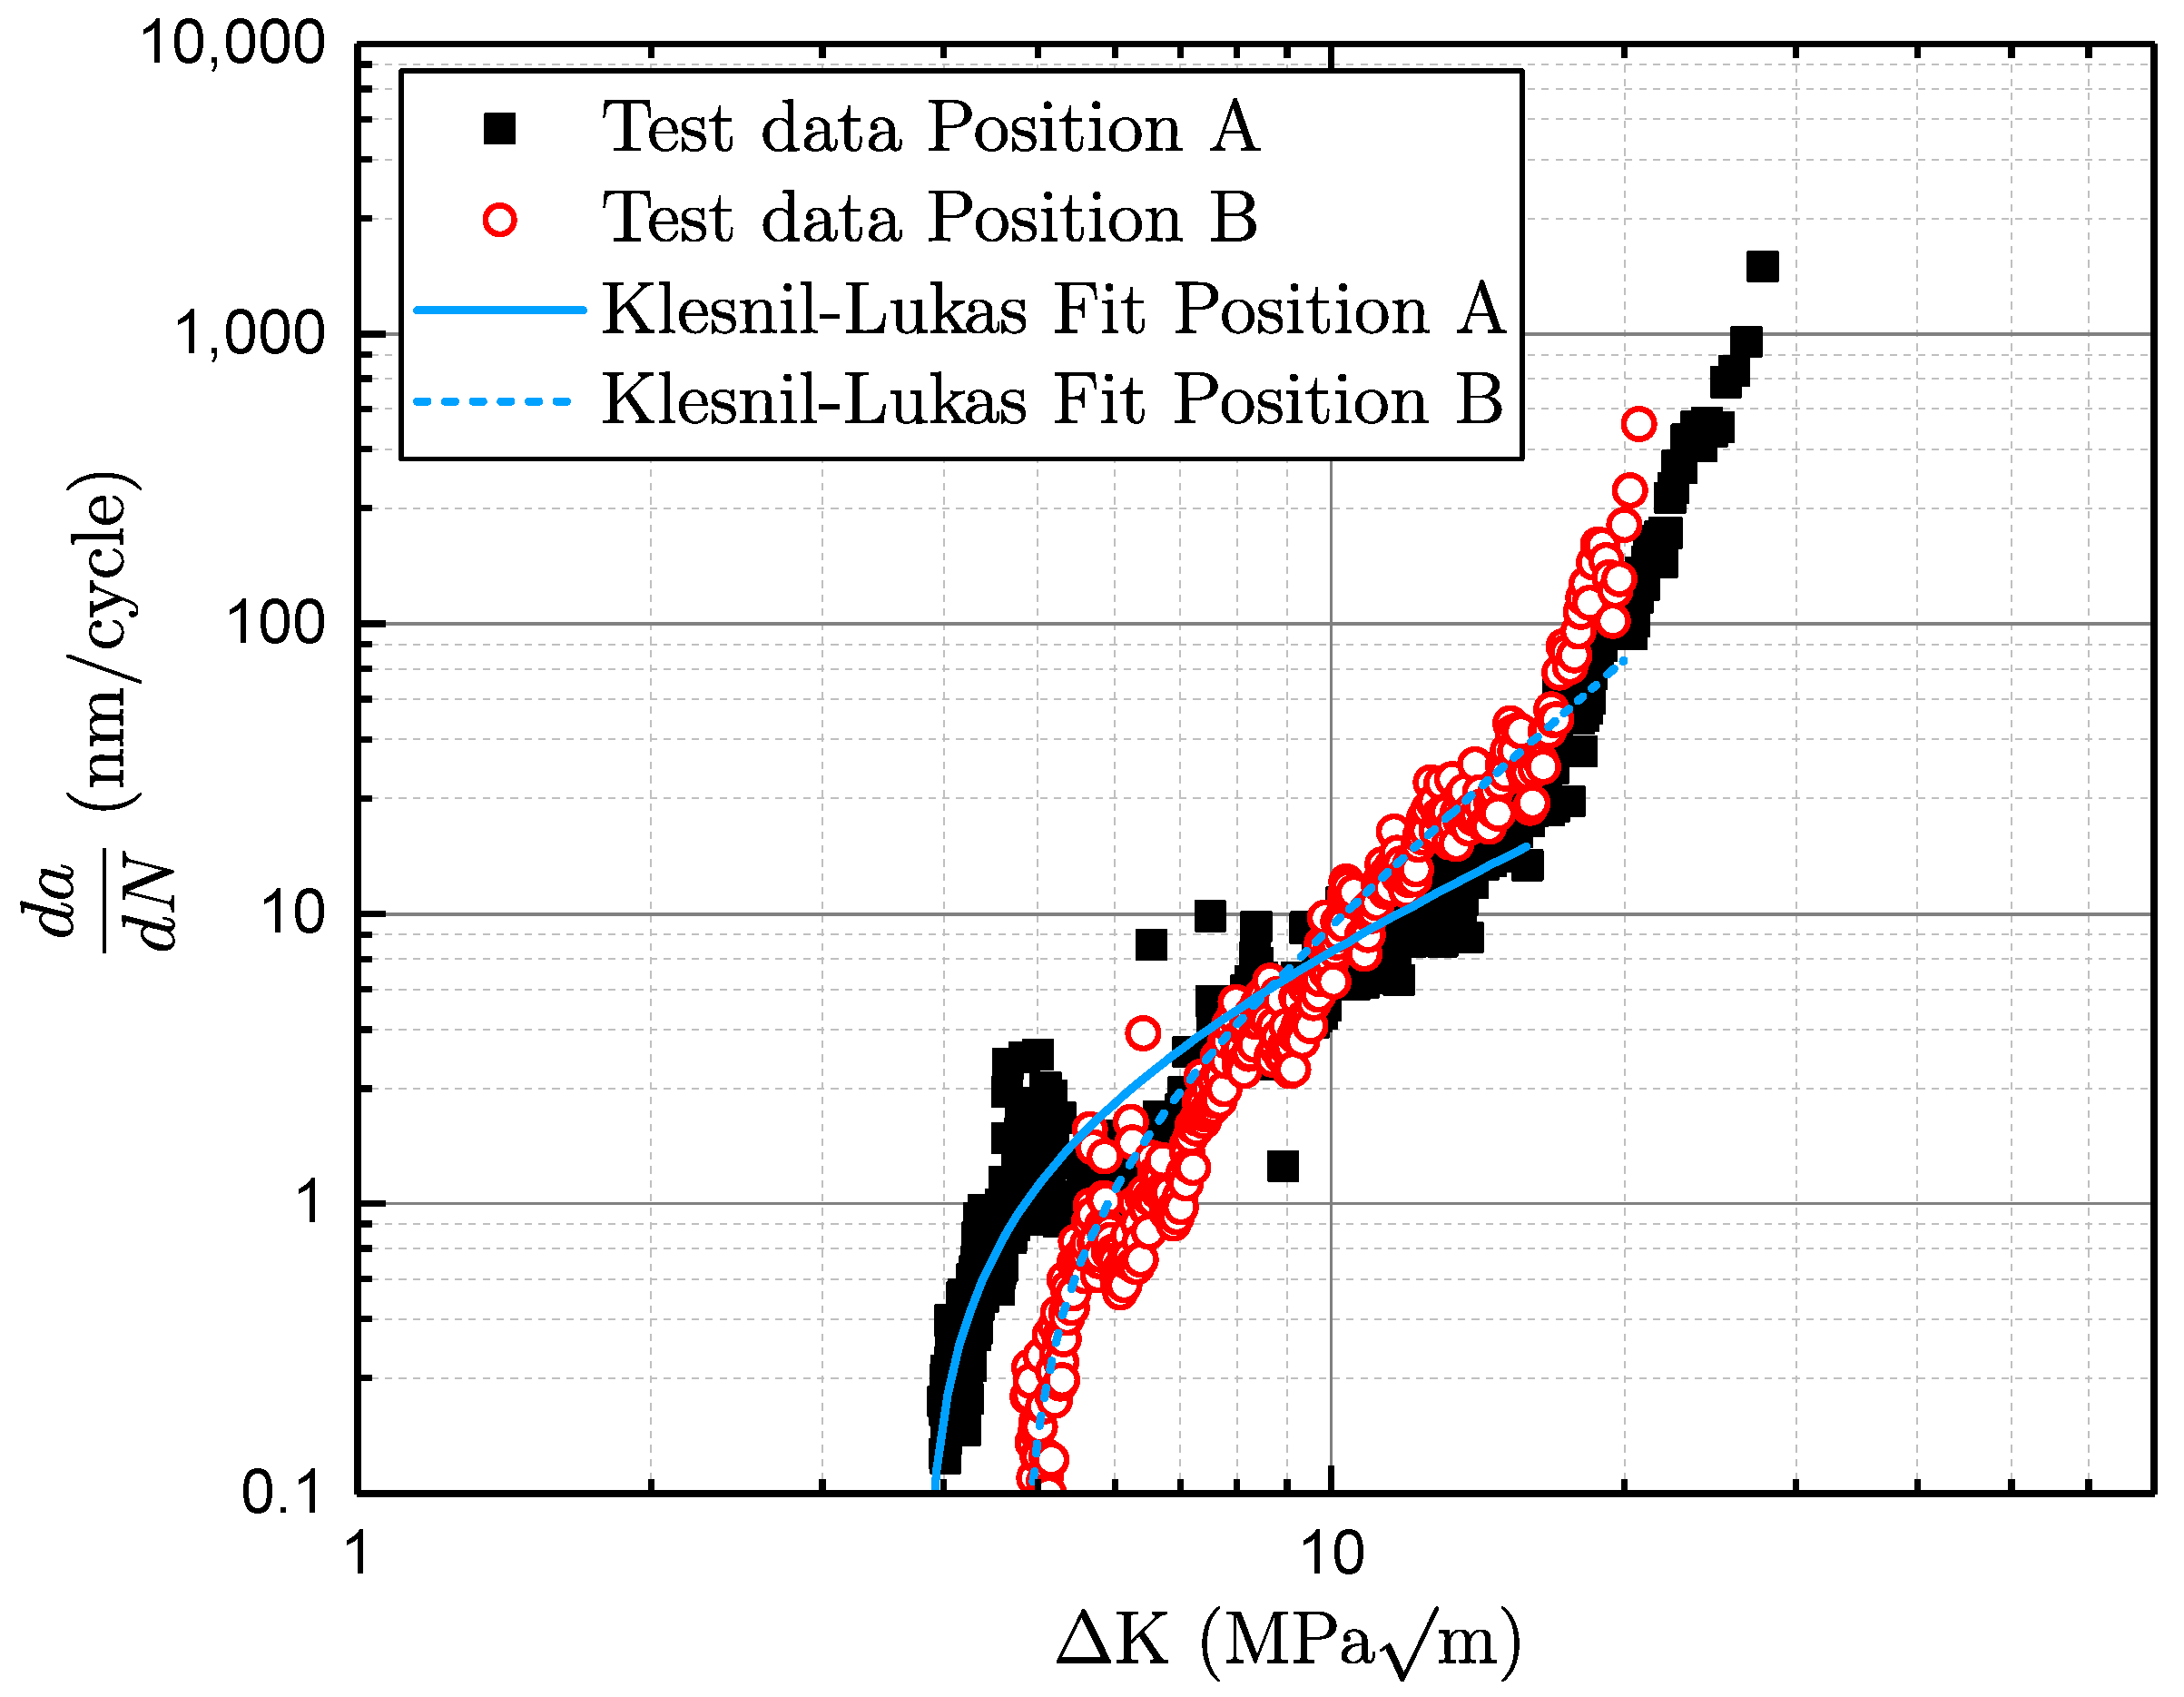
Different approaches can be used to characterise the fatigue crack growth. By plotting the crack growth per load cycle against the cyclic stress intensity factor, the typical S-shaped da/dN curve is obtained, as can be seen in
Figure 1. The graph can be divided into three major regions. Region 1 is located on the left-hand side, characterising the short cracks and the transition to the long-crack area, where crack closure is built up. Preliminary studies investigated the impact of different microstructures on short and long crack growth (see [
24]). It was found that the microstructure significantly impacts the long crack propagation, whereas the corresponding short crack values showed no major dependency. On the right-hand side of
Figure 1, the zone of unstable crack growth, region 3, exists where the stress intensity increases towards the critical value
, as burst failure. Between these two boundaries, there is the area of stable crack growth, labelled as region 2. The most common model to characterise stable fatigue crack growth was presented by Paris–Erdoǵan [
18] (see Equation (
5)):
with
C being a material-dependent coefficient,
the stress intensity range and
m the slope of crack propagation. Klesnil and Lukas extended this approach including the long crack threshold
[
25]. This model is capable of assessing the crack propagation curve in the regions 1 and 2 (see Equation (
6)):
An elaborated approach to characterise all three regions of the crack propagation curve is given by Forman/Mettu, usually denoted as the NASGRO approach [
26,
27] (see Equation (
7)). The crack opening function is in formula
f,
n is the slope of the crack propagation,
R the load stress ratio, and
q and
p constants describe the rounded transition between the crack growth regions:
To assess the fatigue strength in the long-life region
, either Murakami’s
concept or the Kitagawa–Takahashi diagram with its modifications of El-Haddad and Chapetti are commonly applied [
28,
29,
30,
31,
32]. Murakami’s approach is based on the coefficient
depending on the defect location and the constant
, depending on the investigated material (see Equation (
8)). The coefficient
is proposed to be 1.56 for interior subsurface defects, and 1.43 for surface defects [
33]. Hence, surface intersecting defects are considered to be more fatigue-sensitive, even in the presence of larger interior defects, which is in line with preliminary studies [
34,
35]. Additionally, the Vickers hardness (HV) of the assessed material is used as a base material strength parameter [
36,
37].
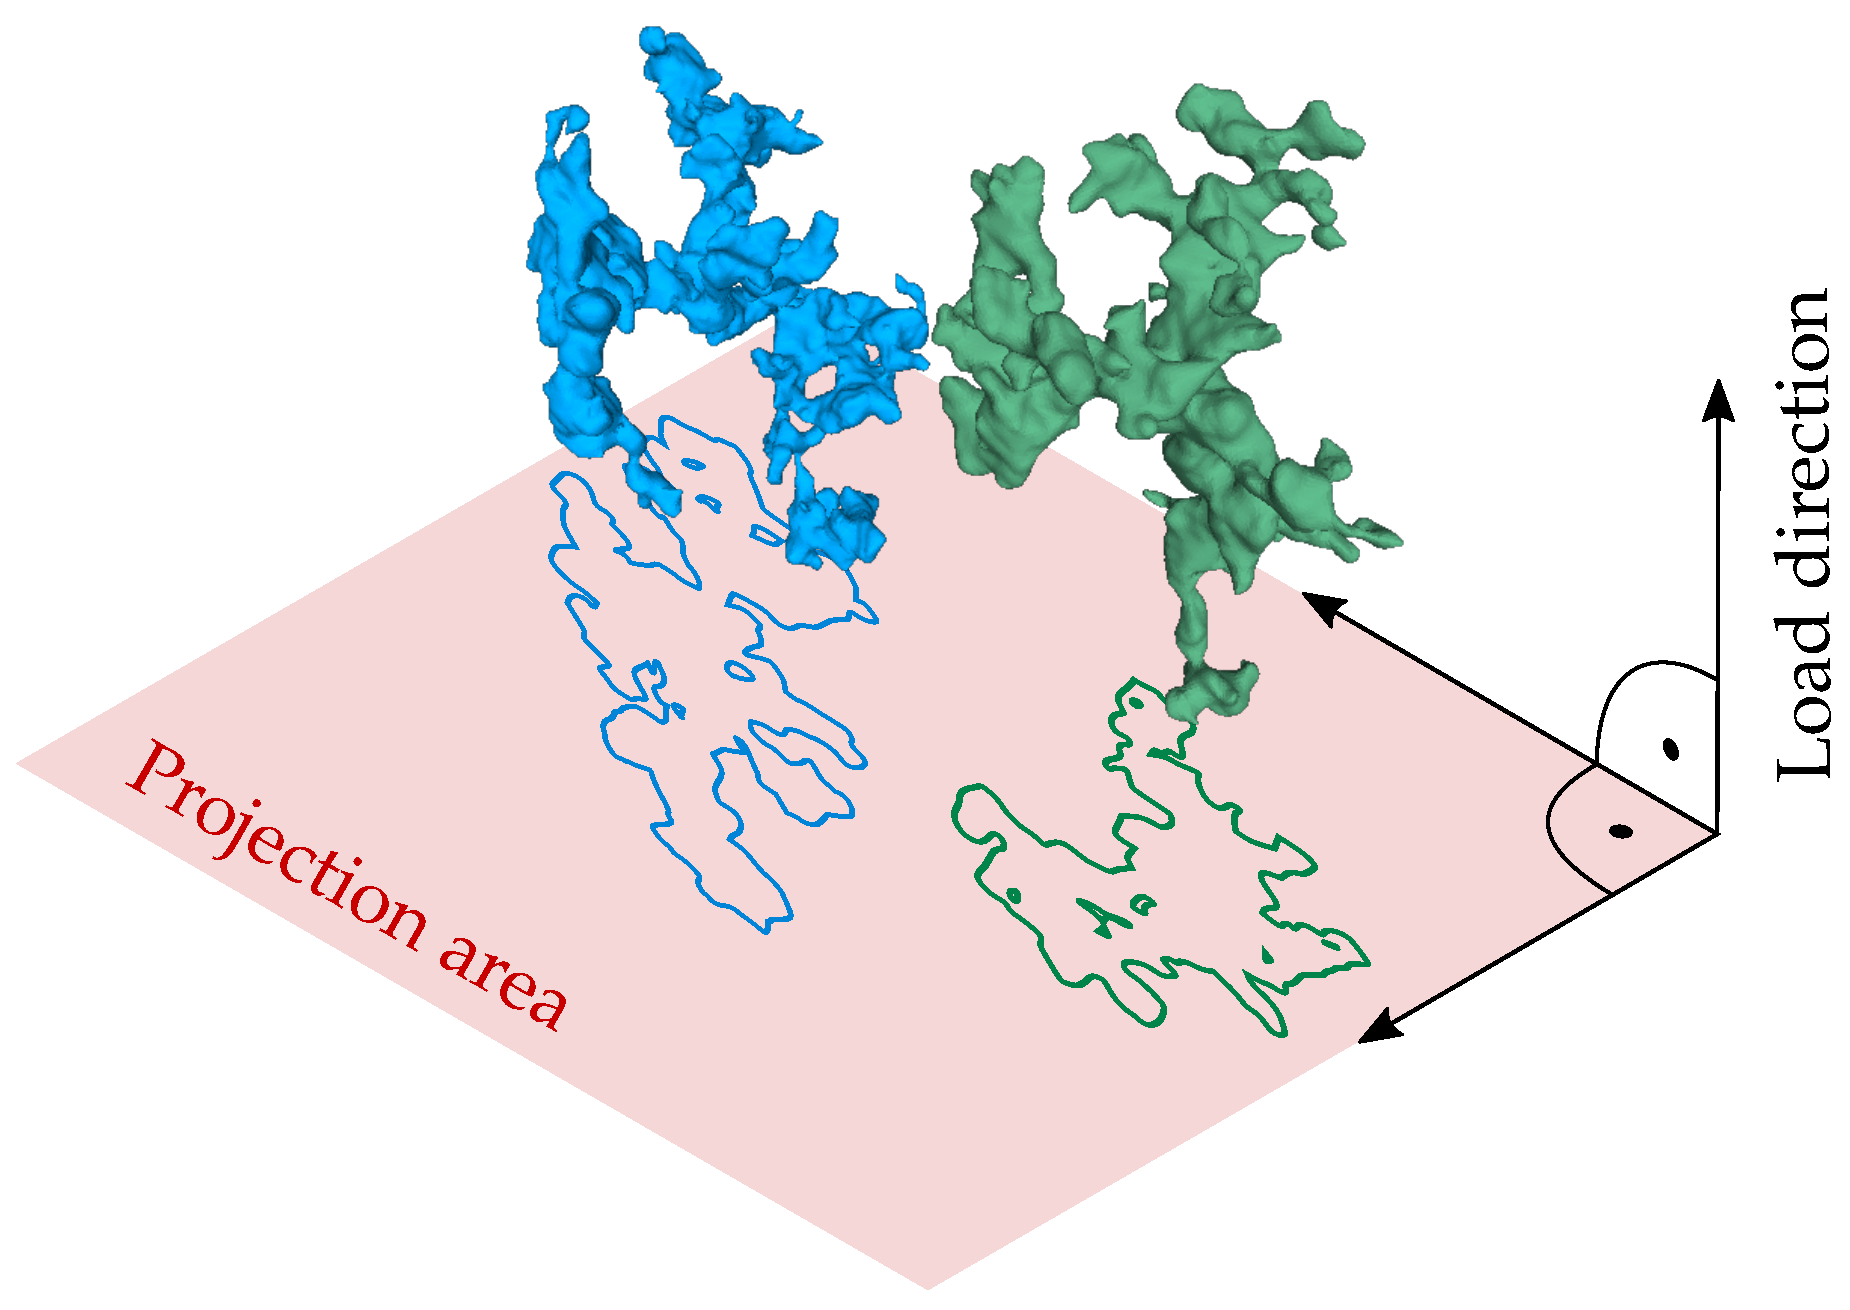
Applying this model, the alternating long-life fatigue resistance
is estimated at a total number of ten million cycles and is greatly affected by the effective micropore area. The defect size is evaluated as the projected flaw area perpendicular to the direction of the maximum principal normal stress [
29]. On the one hand, preliminary studies [
38] reveal a proper conformance with Murakami’s empirical approach, but the present model does not invoke the defect size distribution itself. As presented in preliminary studies [
39,
40,
41,
42], the statistical distribution of flaw sizes can be evaluated by non-destructive investigation of the defect population, such as X-ray computed tomography scanning. However, the statistical distribution of the most extreme values evaluated from the XCT does not always represent the distribution of fatigue fracture initiating defects, due to the fact that cracks may initiate at the surface near heterogeneities even in the presence of larger flaws within the bulk volume (see [
43,
44,
45]). Thus, the flaw size as a sole valuation parameter is not applicable. By weighting heterogeneities with additional geometry factors, depending on their location, size and orientation [
46], a much more reliable distribution of fatigue critical defect sizes can be assessed. Another study [
47] reveals the relationship between the porosity, the microstructure and the ductile fracture behaviour, invoking image-based finite element analysis. Therefore, the authors in [
47] observed the microstructure in an aluminium alloy by means of XCT, revealing a hydrogen-pore mechanism induced fracture, as strain localizes at extrinsic and intrinsic inhomogeneities. Tenkamp et al. [
48] proposed a methodology to correlate defect sizes with the fatigue strength, invoking Kitagawa–Takahashi diagrams [
49]. Hereby, the authors in [
48] investigated the critical defect sizes by means of XCT scans. Afterwards, the initial crack length was estimated as the average of the
fraction of the largest evaluated equivalent pore diameter, which was revealed to meet the fractography results well. However, the application of the distribution of flaw sizes for fatigue assessment has still not yet reached its full potential. Existing defect based models just correlate the fatigue strength with the fatigue fracture initiating size of the very tested specimen. As the presented model is based on the distribution of the holistic sample location itself, the corresponding fatigue strength can be assessed statistically. Moreover, the approach in this work enables a statistical fatigue strength assessment which can be realised even early on in the design process by estimation of the defect distribution either by means of XCT scans or deduced by simulation of local cooling conditions. Hence, this paper scientifically contributes with the following research tasks:
Experimental investigation of the impact of local defect population on the fatigue behaviour of Al-Si-Cu cast alloys.
Estimation of crack initiation lifetime based on experimental analysis using in situ XCT scans.
Extension of the fatigue lifetime model by Tiryakioglu [
12] to additionally assess the fatigue strength in the long-life region.
2. Materials and Methods
The investigated material is a commonly used aluminium alloy EN AC-46200 with T6 heat treatment. The specimens are extracted from one batch of a gravity casted characteristic automotive part at two different locations, referred to as position A and position B. The nominal chemical composition of the investigated material is given in
Table 1. Further information on the sampling positions is provided in a preceding study (see [
19]). The T6 heat-treatment is separated into three stages and is known to significantly enhance mechanical properties, in terms of ductility and strength [
50]. At first, the components are solution treated at high temperatures, in order to force the dissolution of Cu-rich intermetallic phases, since
Cu intermetallics dissolve at an exposure time of 30 min at an operating temperature of 510
C [
51]. Thus, a homogeneous microstructure can be obtained after solidification. Secondly, the parts are quenched, usually at room temperature. Finally, the components are age hardened for maximal strength. This heat-treatment is also referred to as complete ageing [
52]. The impact of T6 heat-treatment on the dendrite arm spacing, quasi-static properties and fatigue strength is given in [
53,
54].
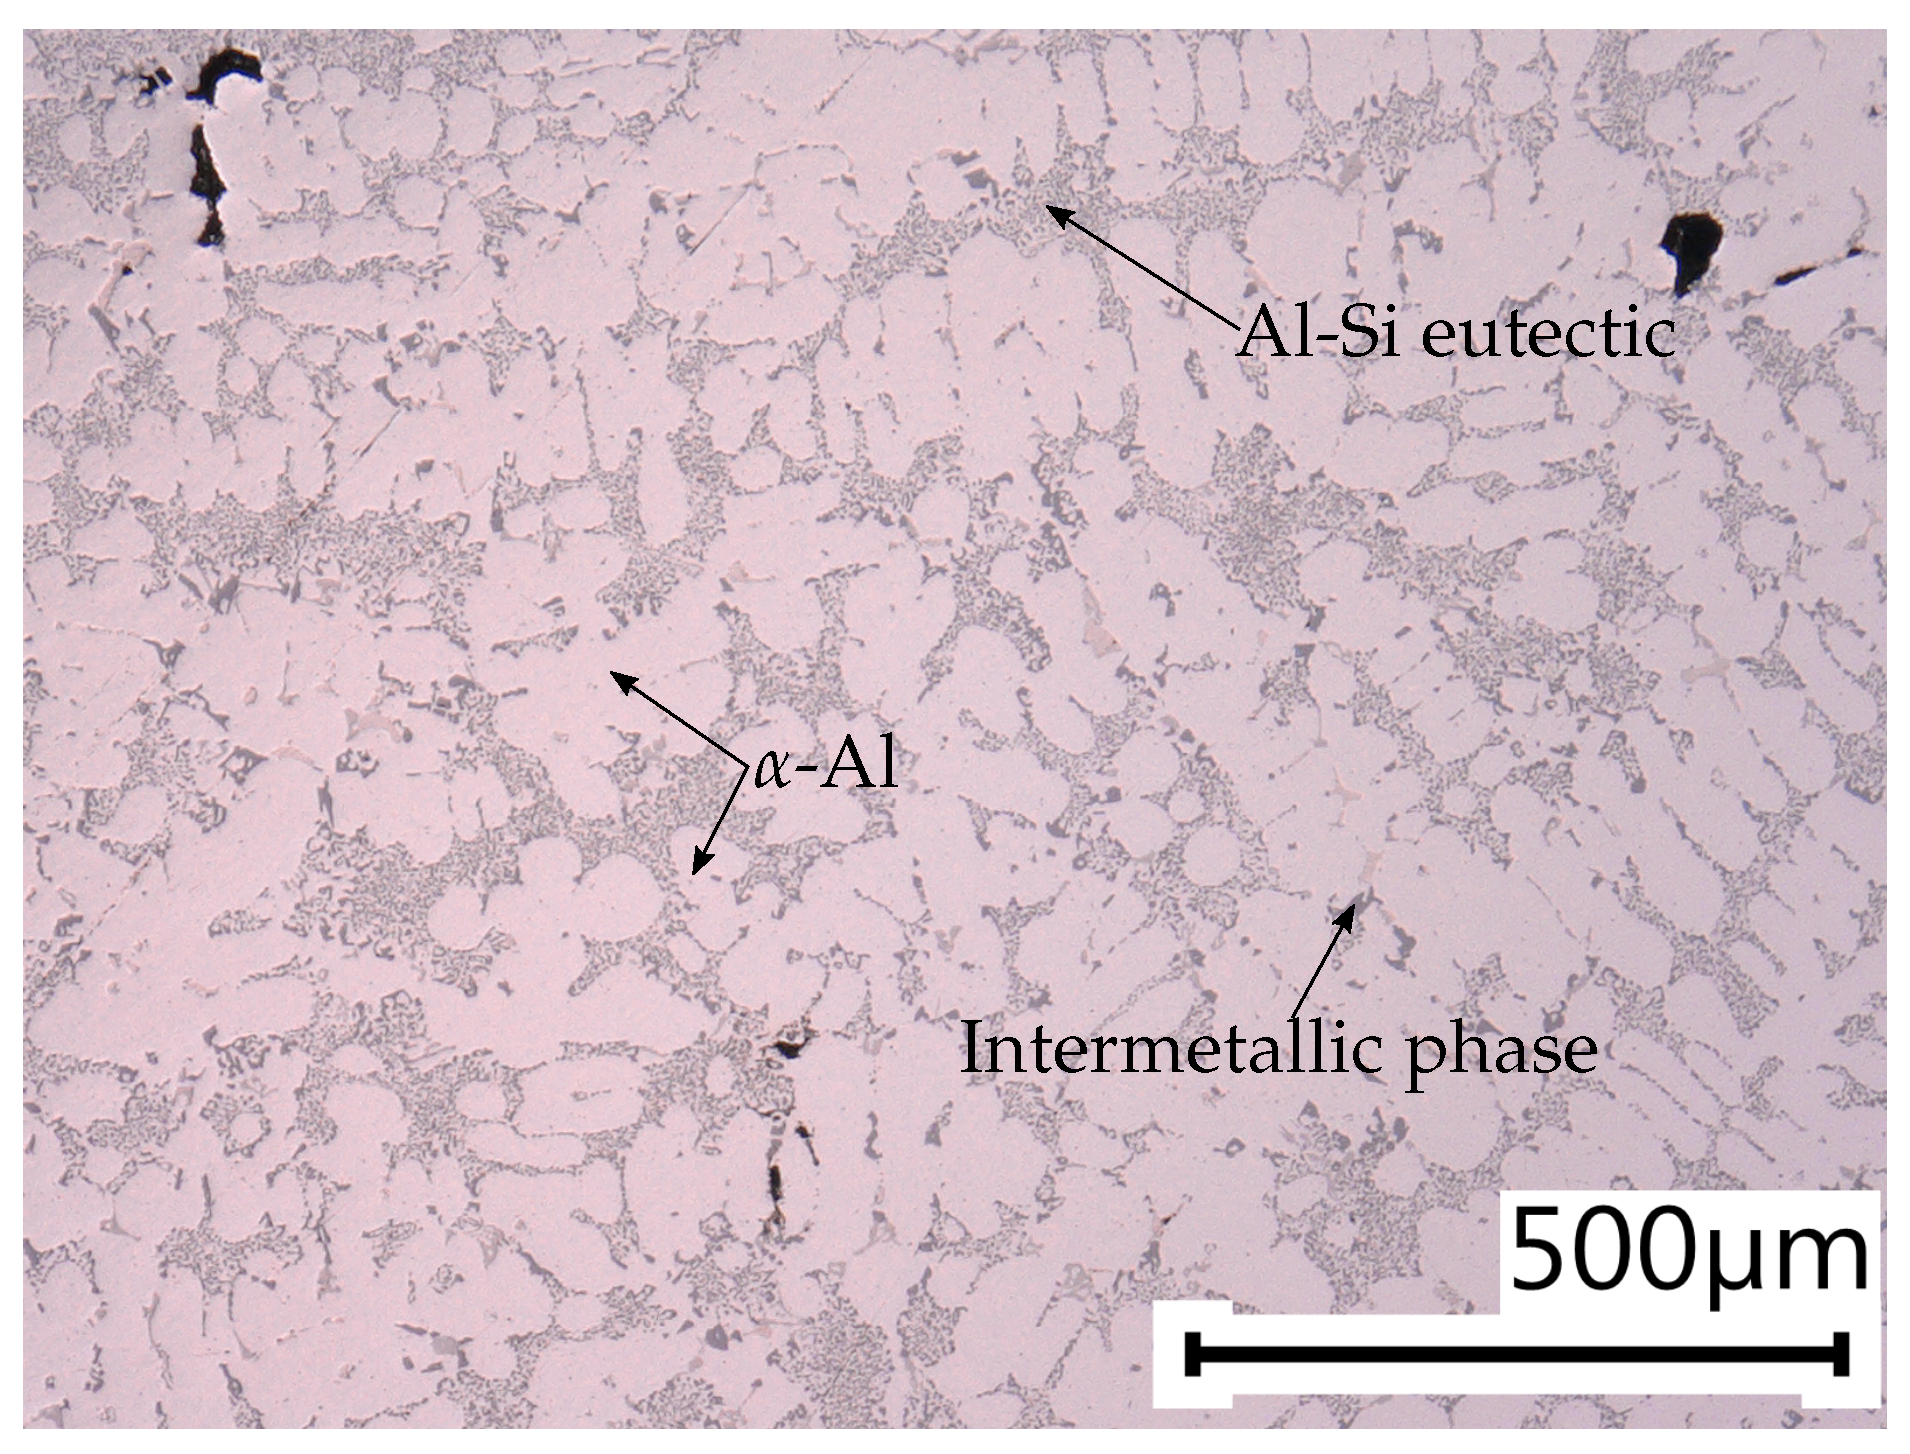
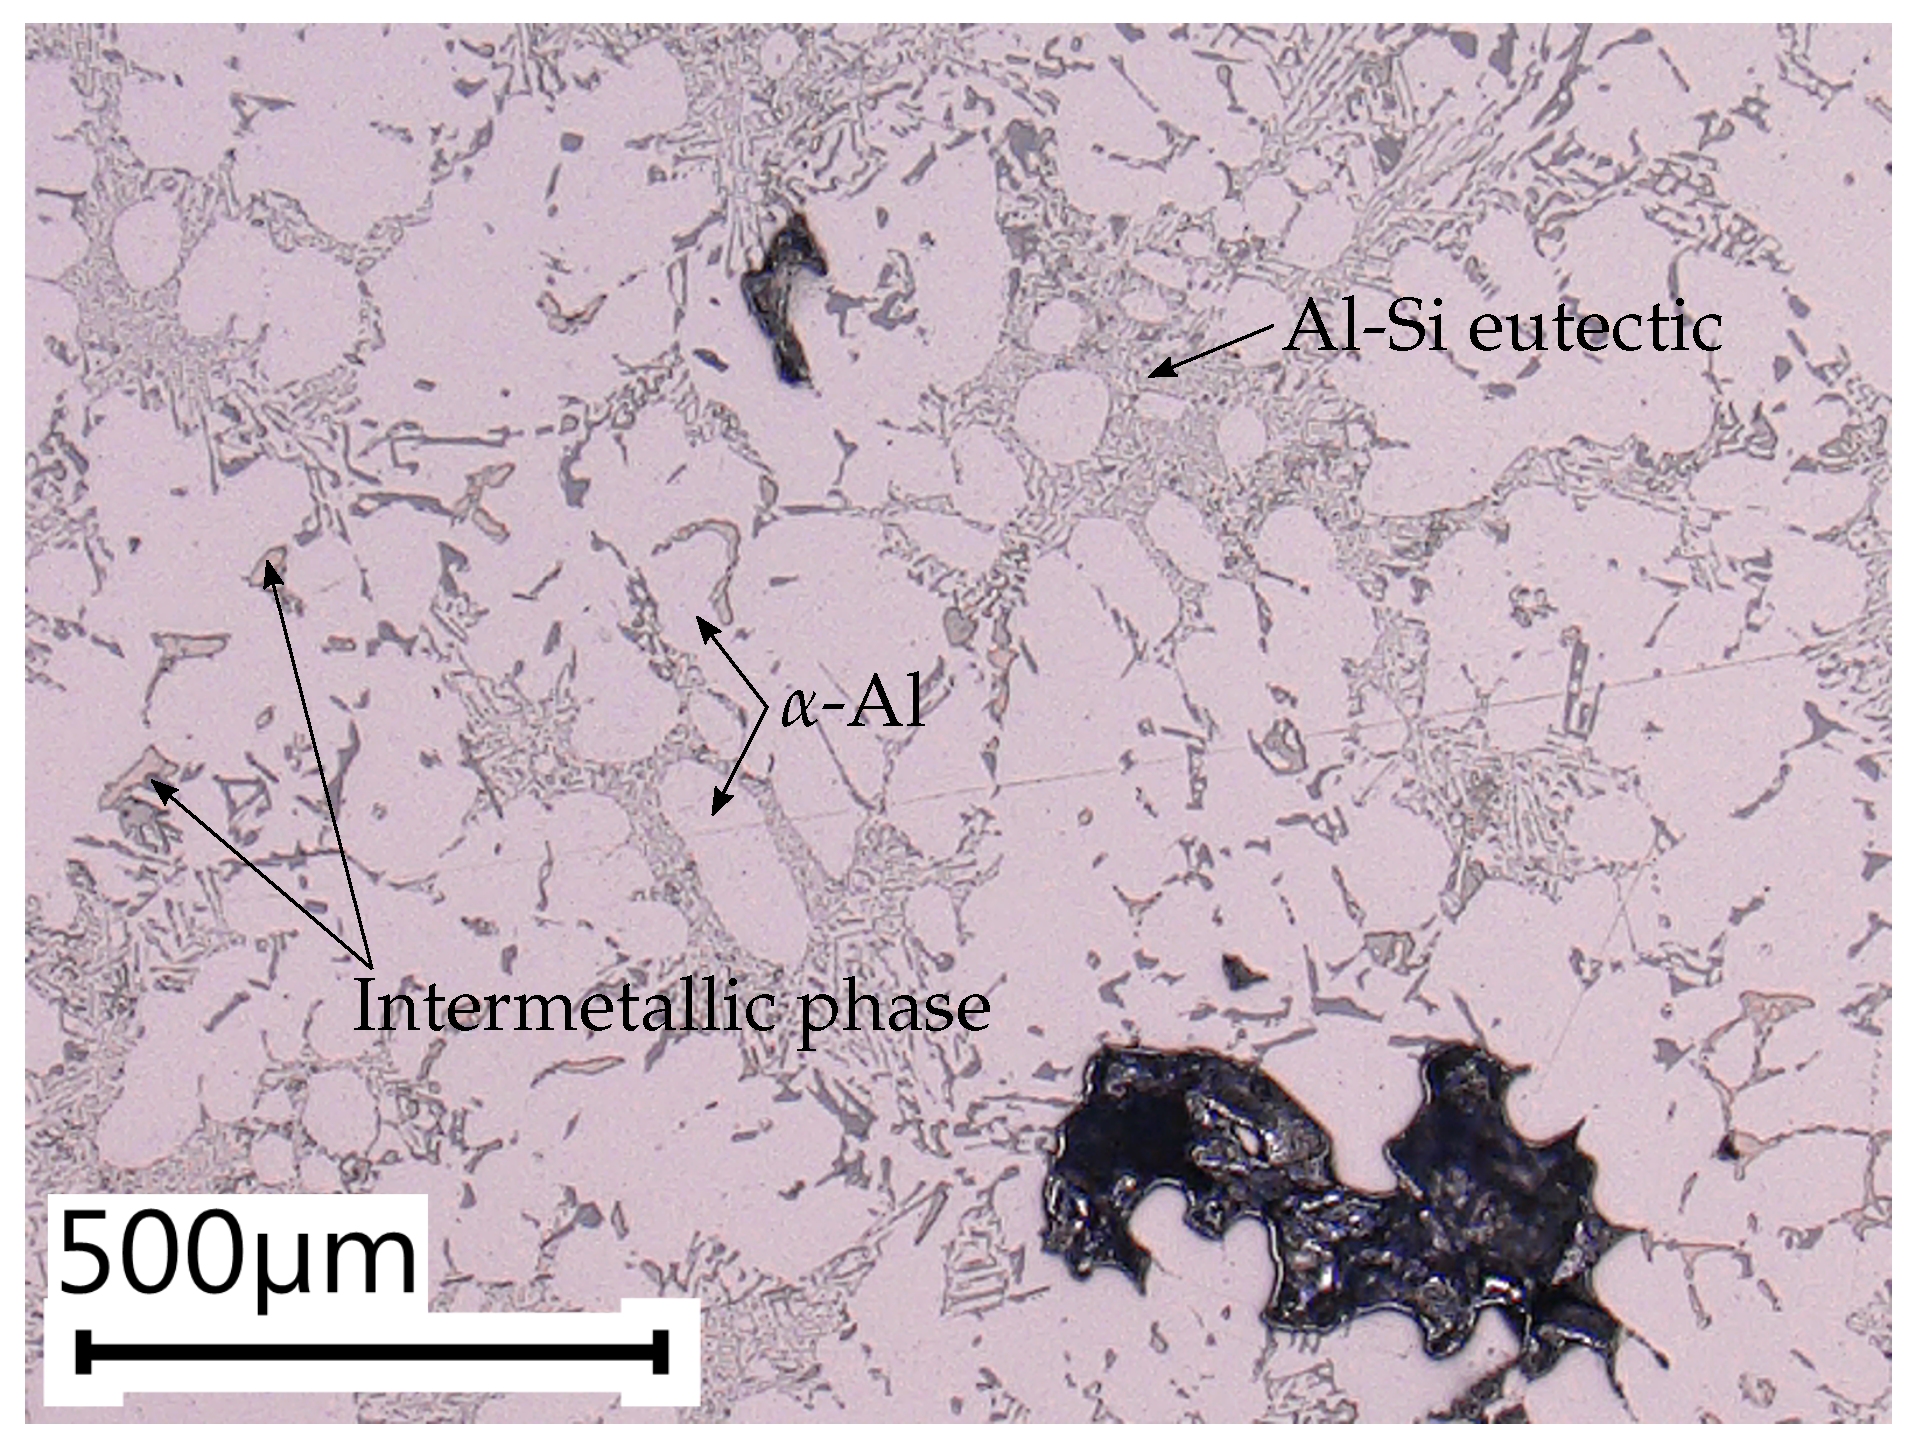
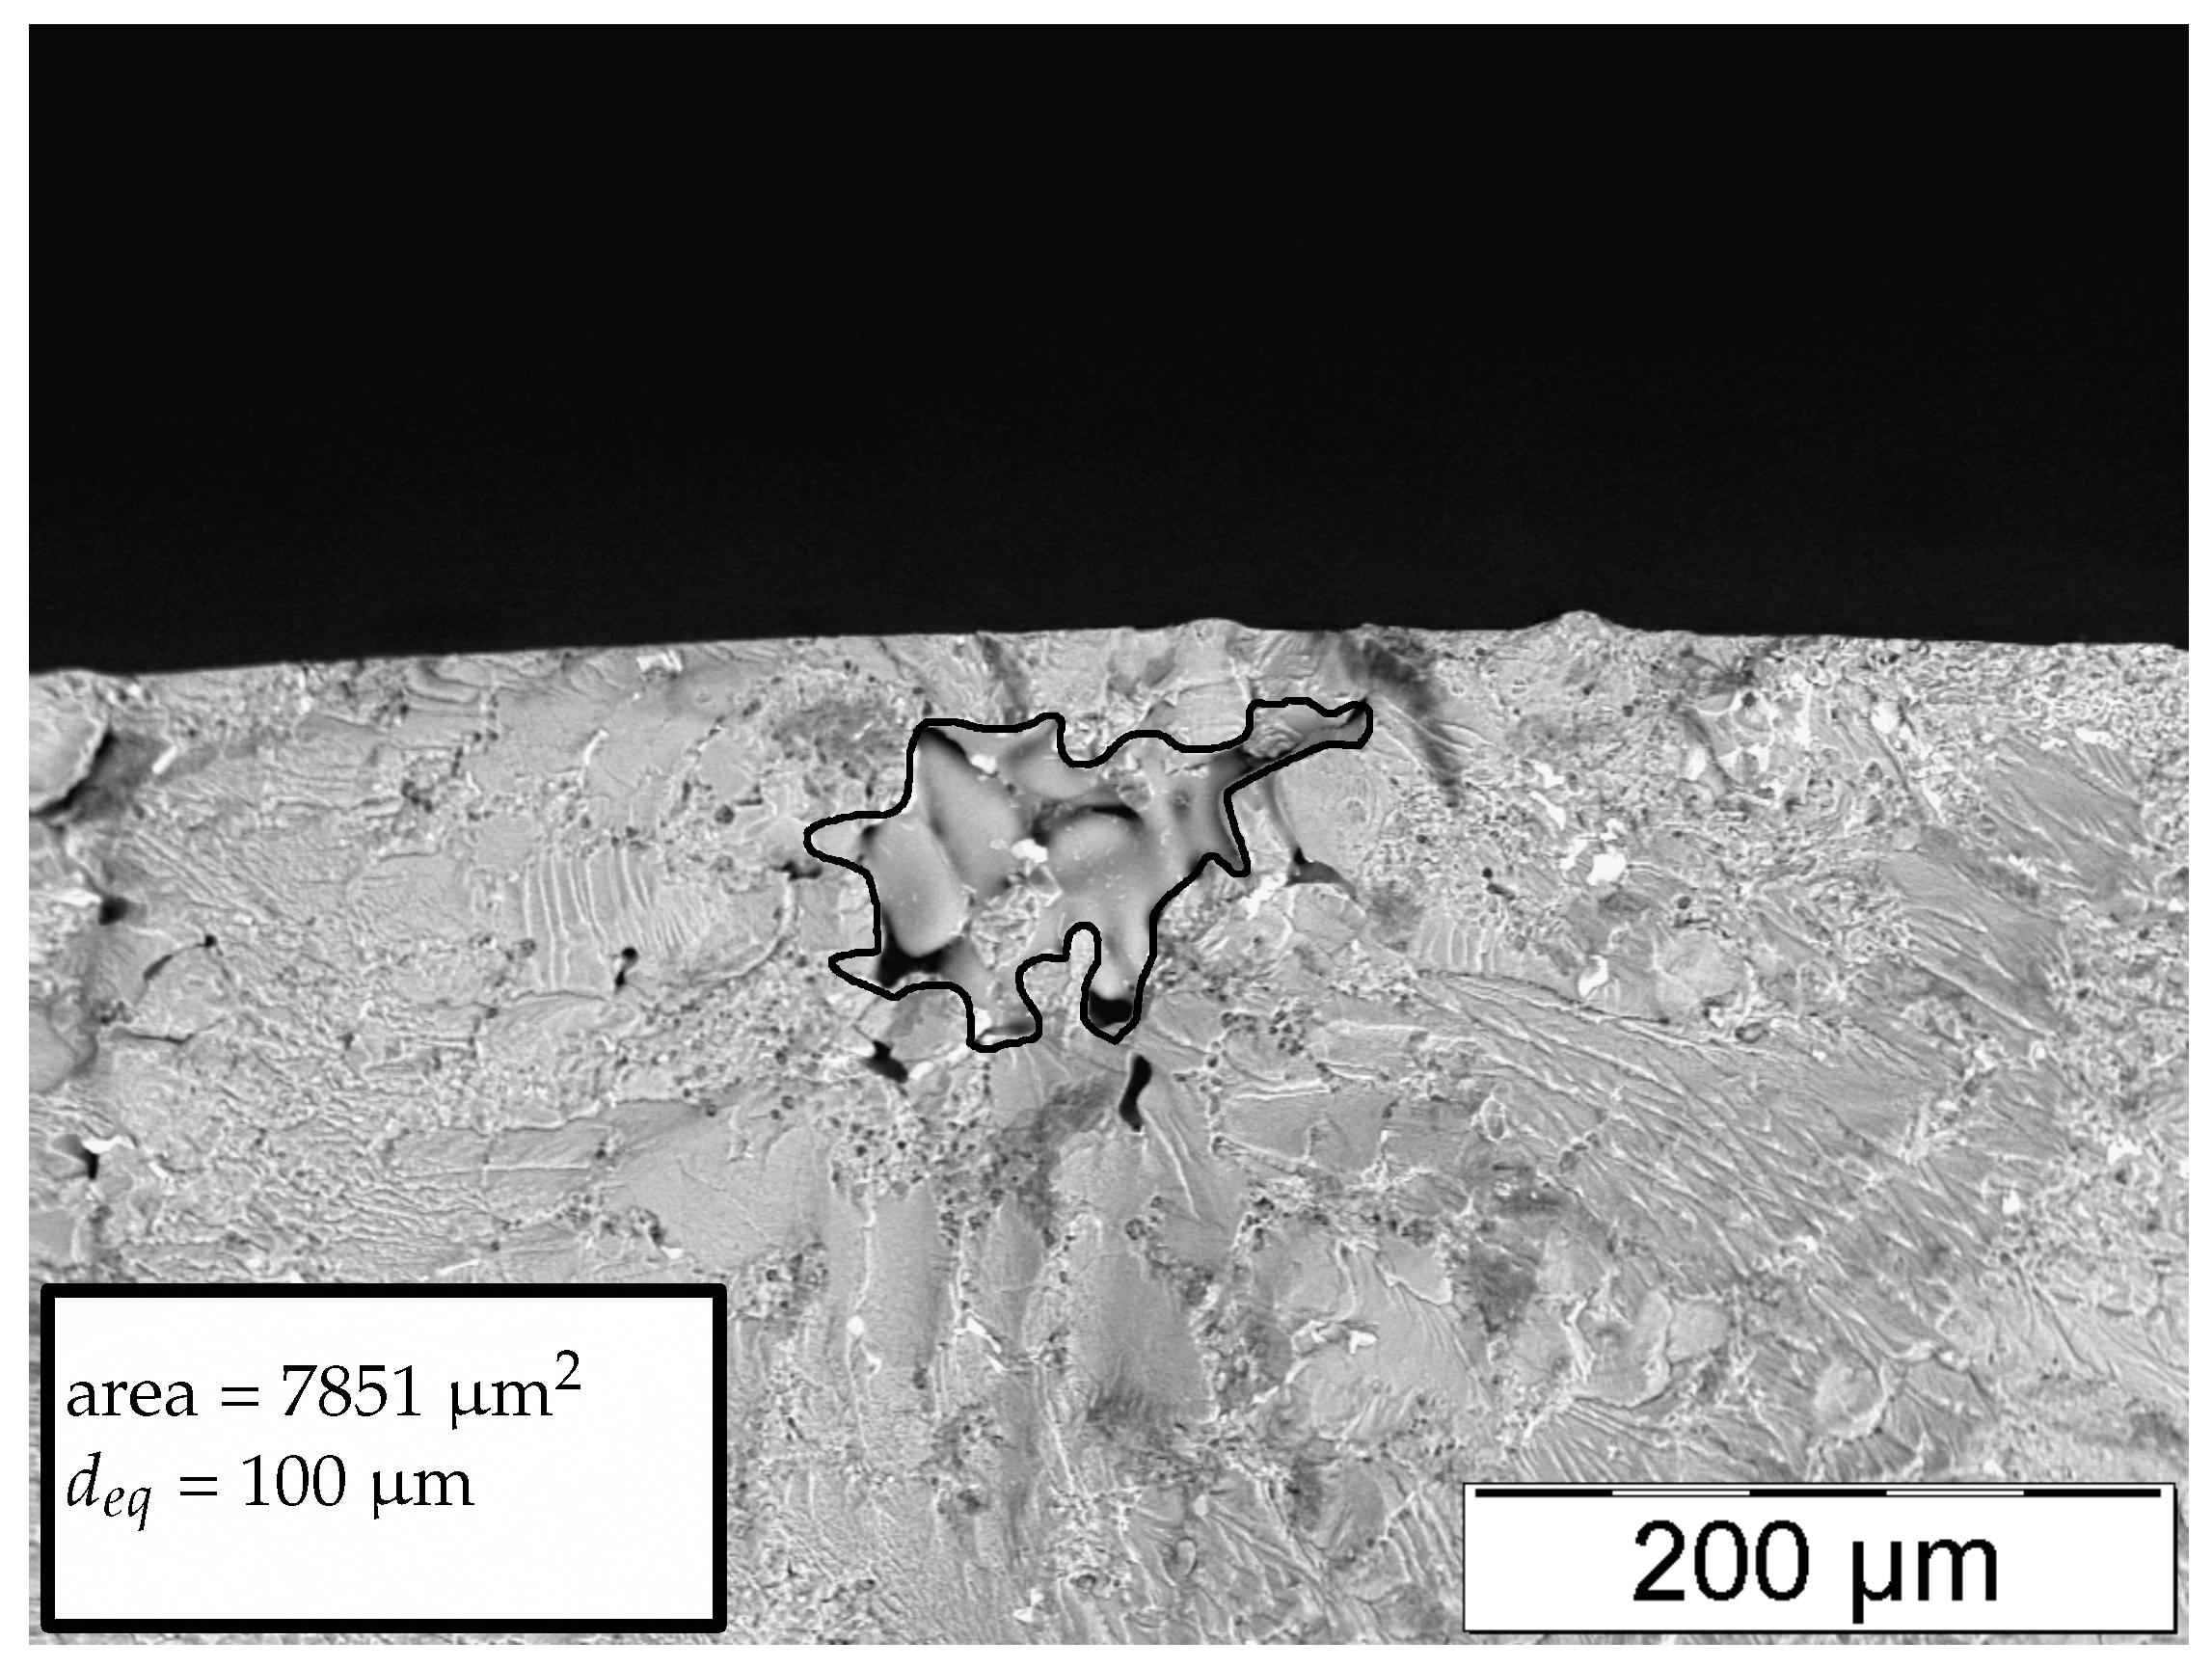
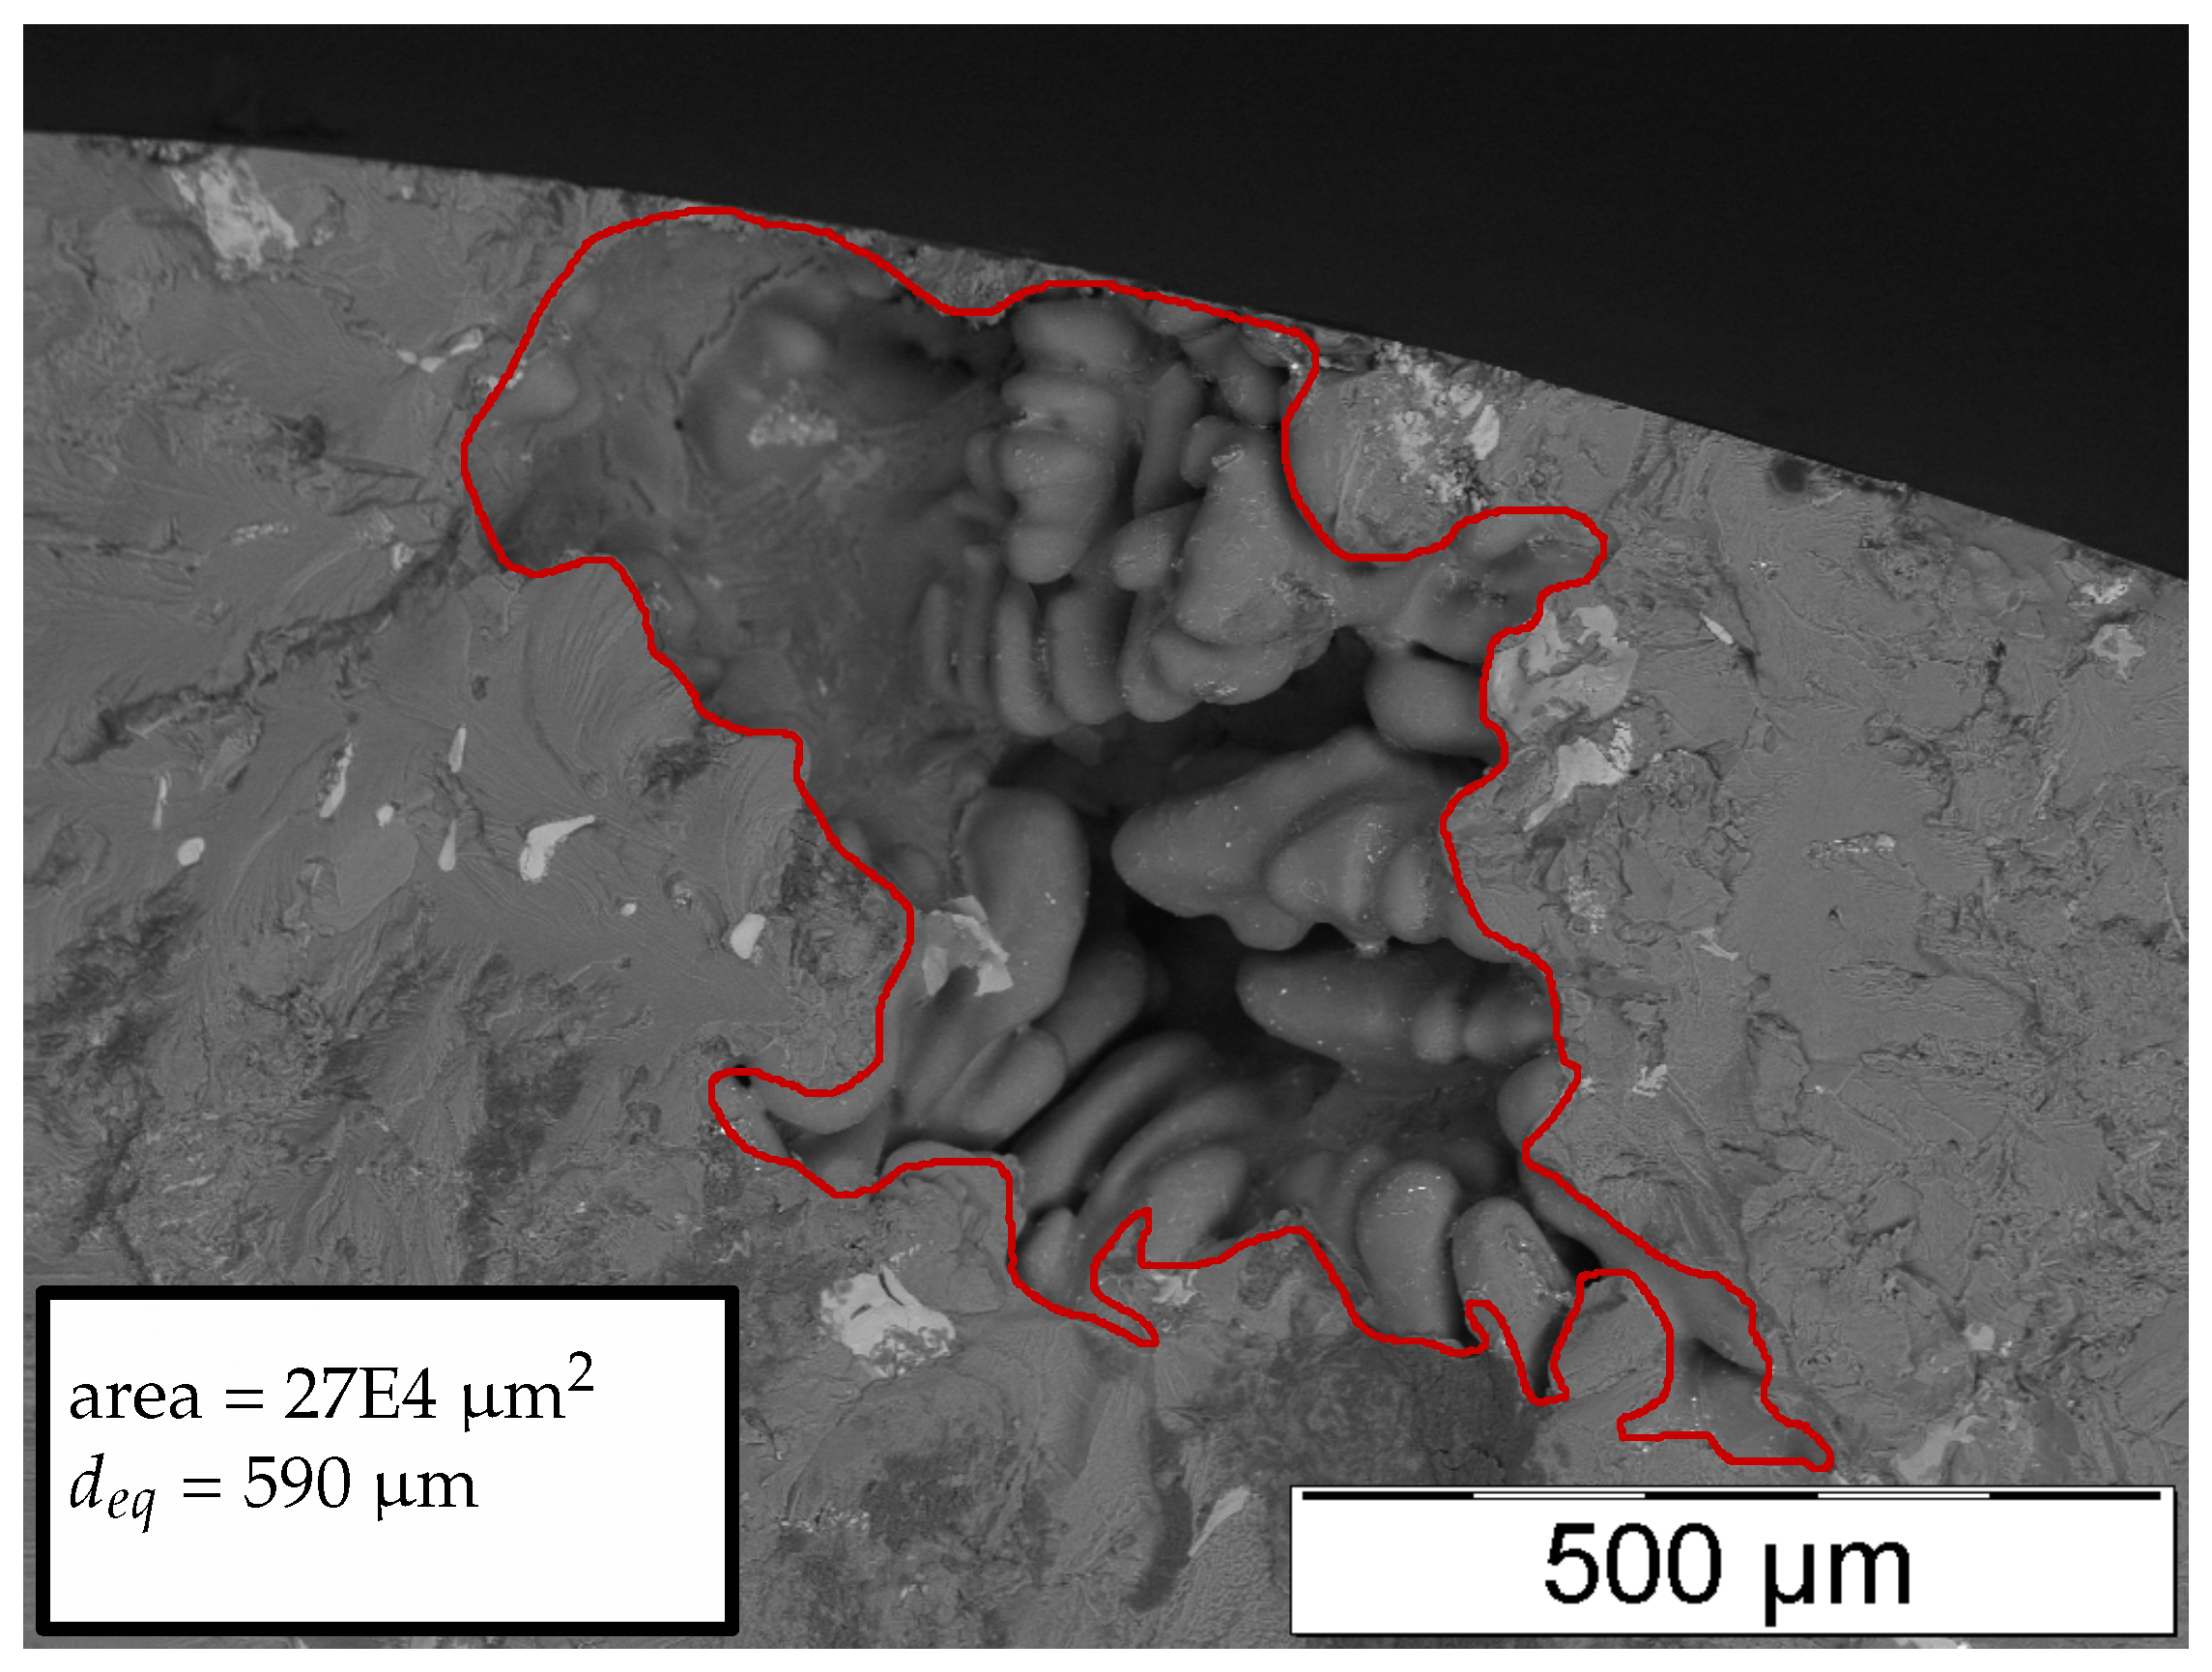
In addition, the sample microstructures are investigated by means of extensive metallographical analysis. Due to the significantly varying local cooling rates, the sampling positions greatly differ in terms of microstructural properties. Hence, the different specimen conditions inherit significantly different defect populations, as the spatial extent of micropores correlates well with the local dendrite arm spacing (DAS). The DAS in the testing region of position A is estimated to be 26.40 ± 1.51 m, where the DAS in position B is significantly greater with 53.26 ± 3.17 m.
In
Figure 2 and
Figure 3, the local microstructures at the specimen locations A and B are displayed. As stated before, the local DAS in position B is more than two times the DAS value of specimen position A. Hence, the probability of larger defects is significantly enhanced in position B, which goes in line with results of previous studies [
38,
55] as well as with the subsequent fractographic analysis.
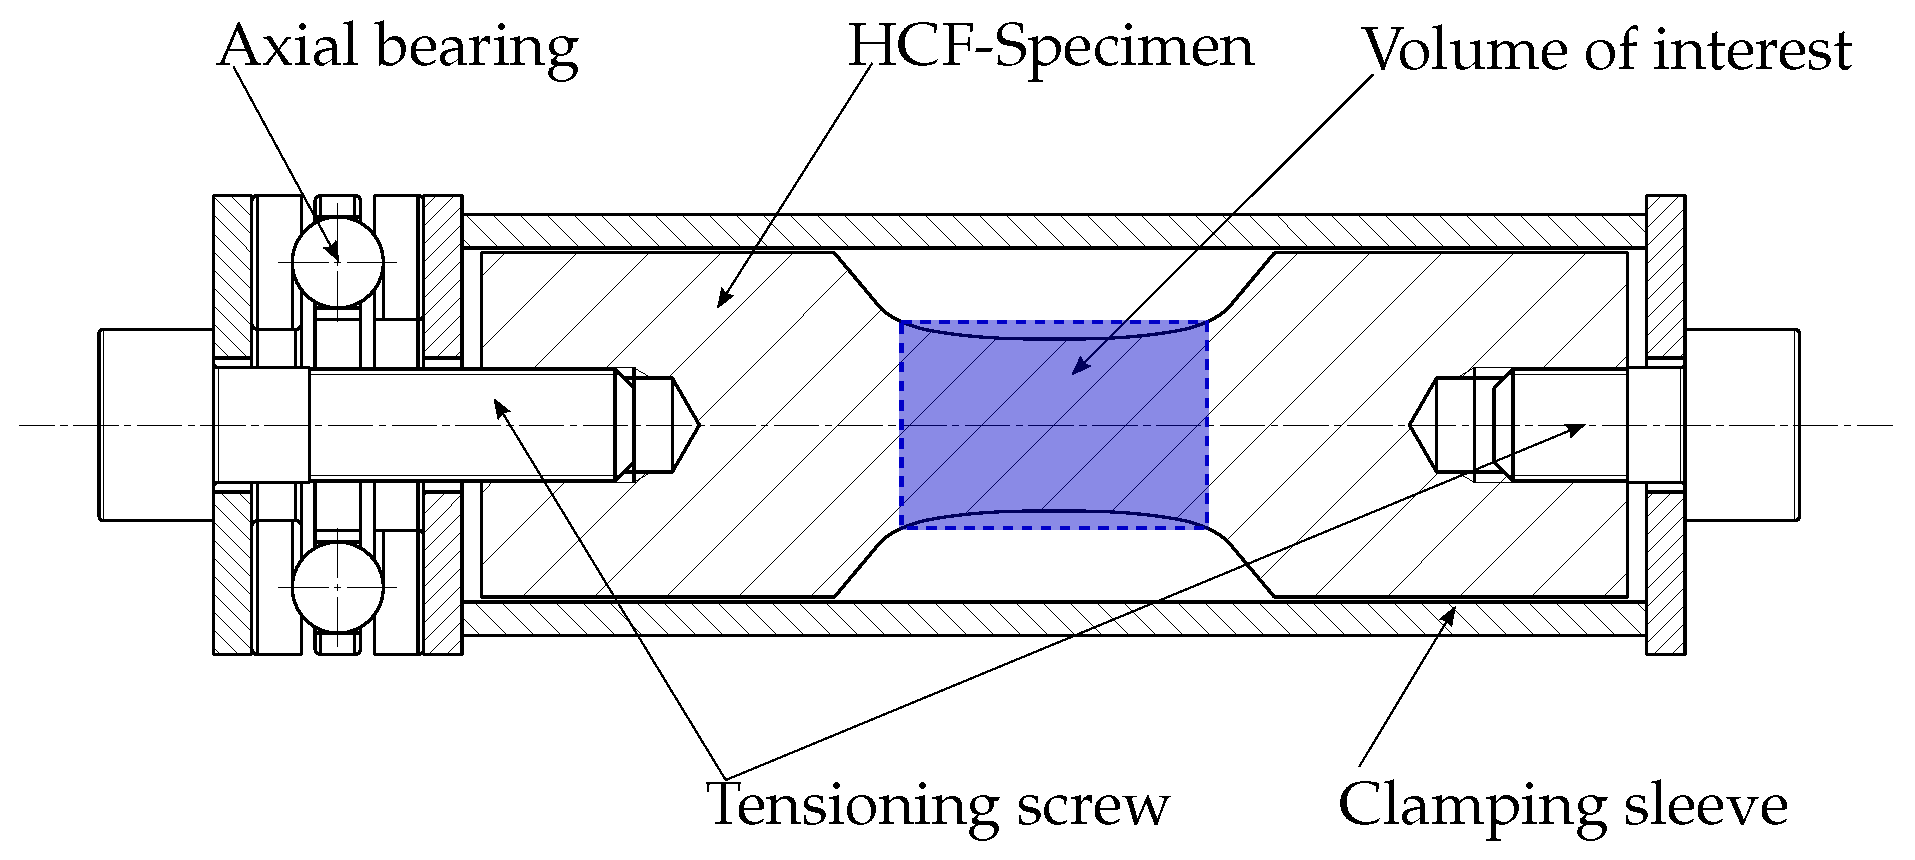
The tensile test specimen geometry is depicted in
Figure 4, respectively. In order to statistically evaluate the fatigue strength and the quasi-static properties, each test series contains a minimum of 15 HCF, 3 SENB, 3 tensile and 3 metallographic specimen. To reduce any roughness based effects such as micro-notches [
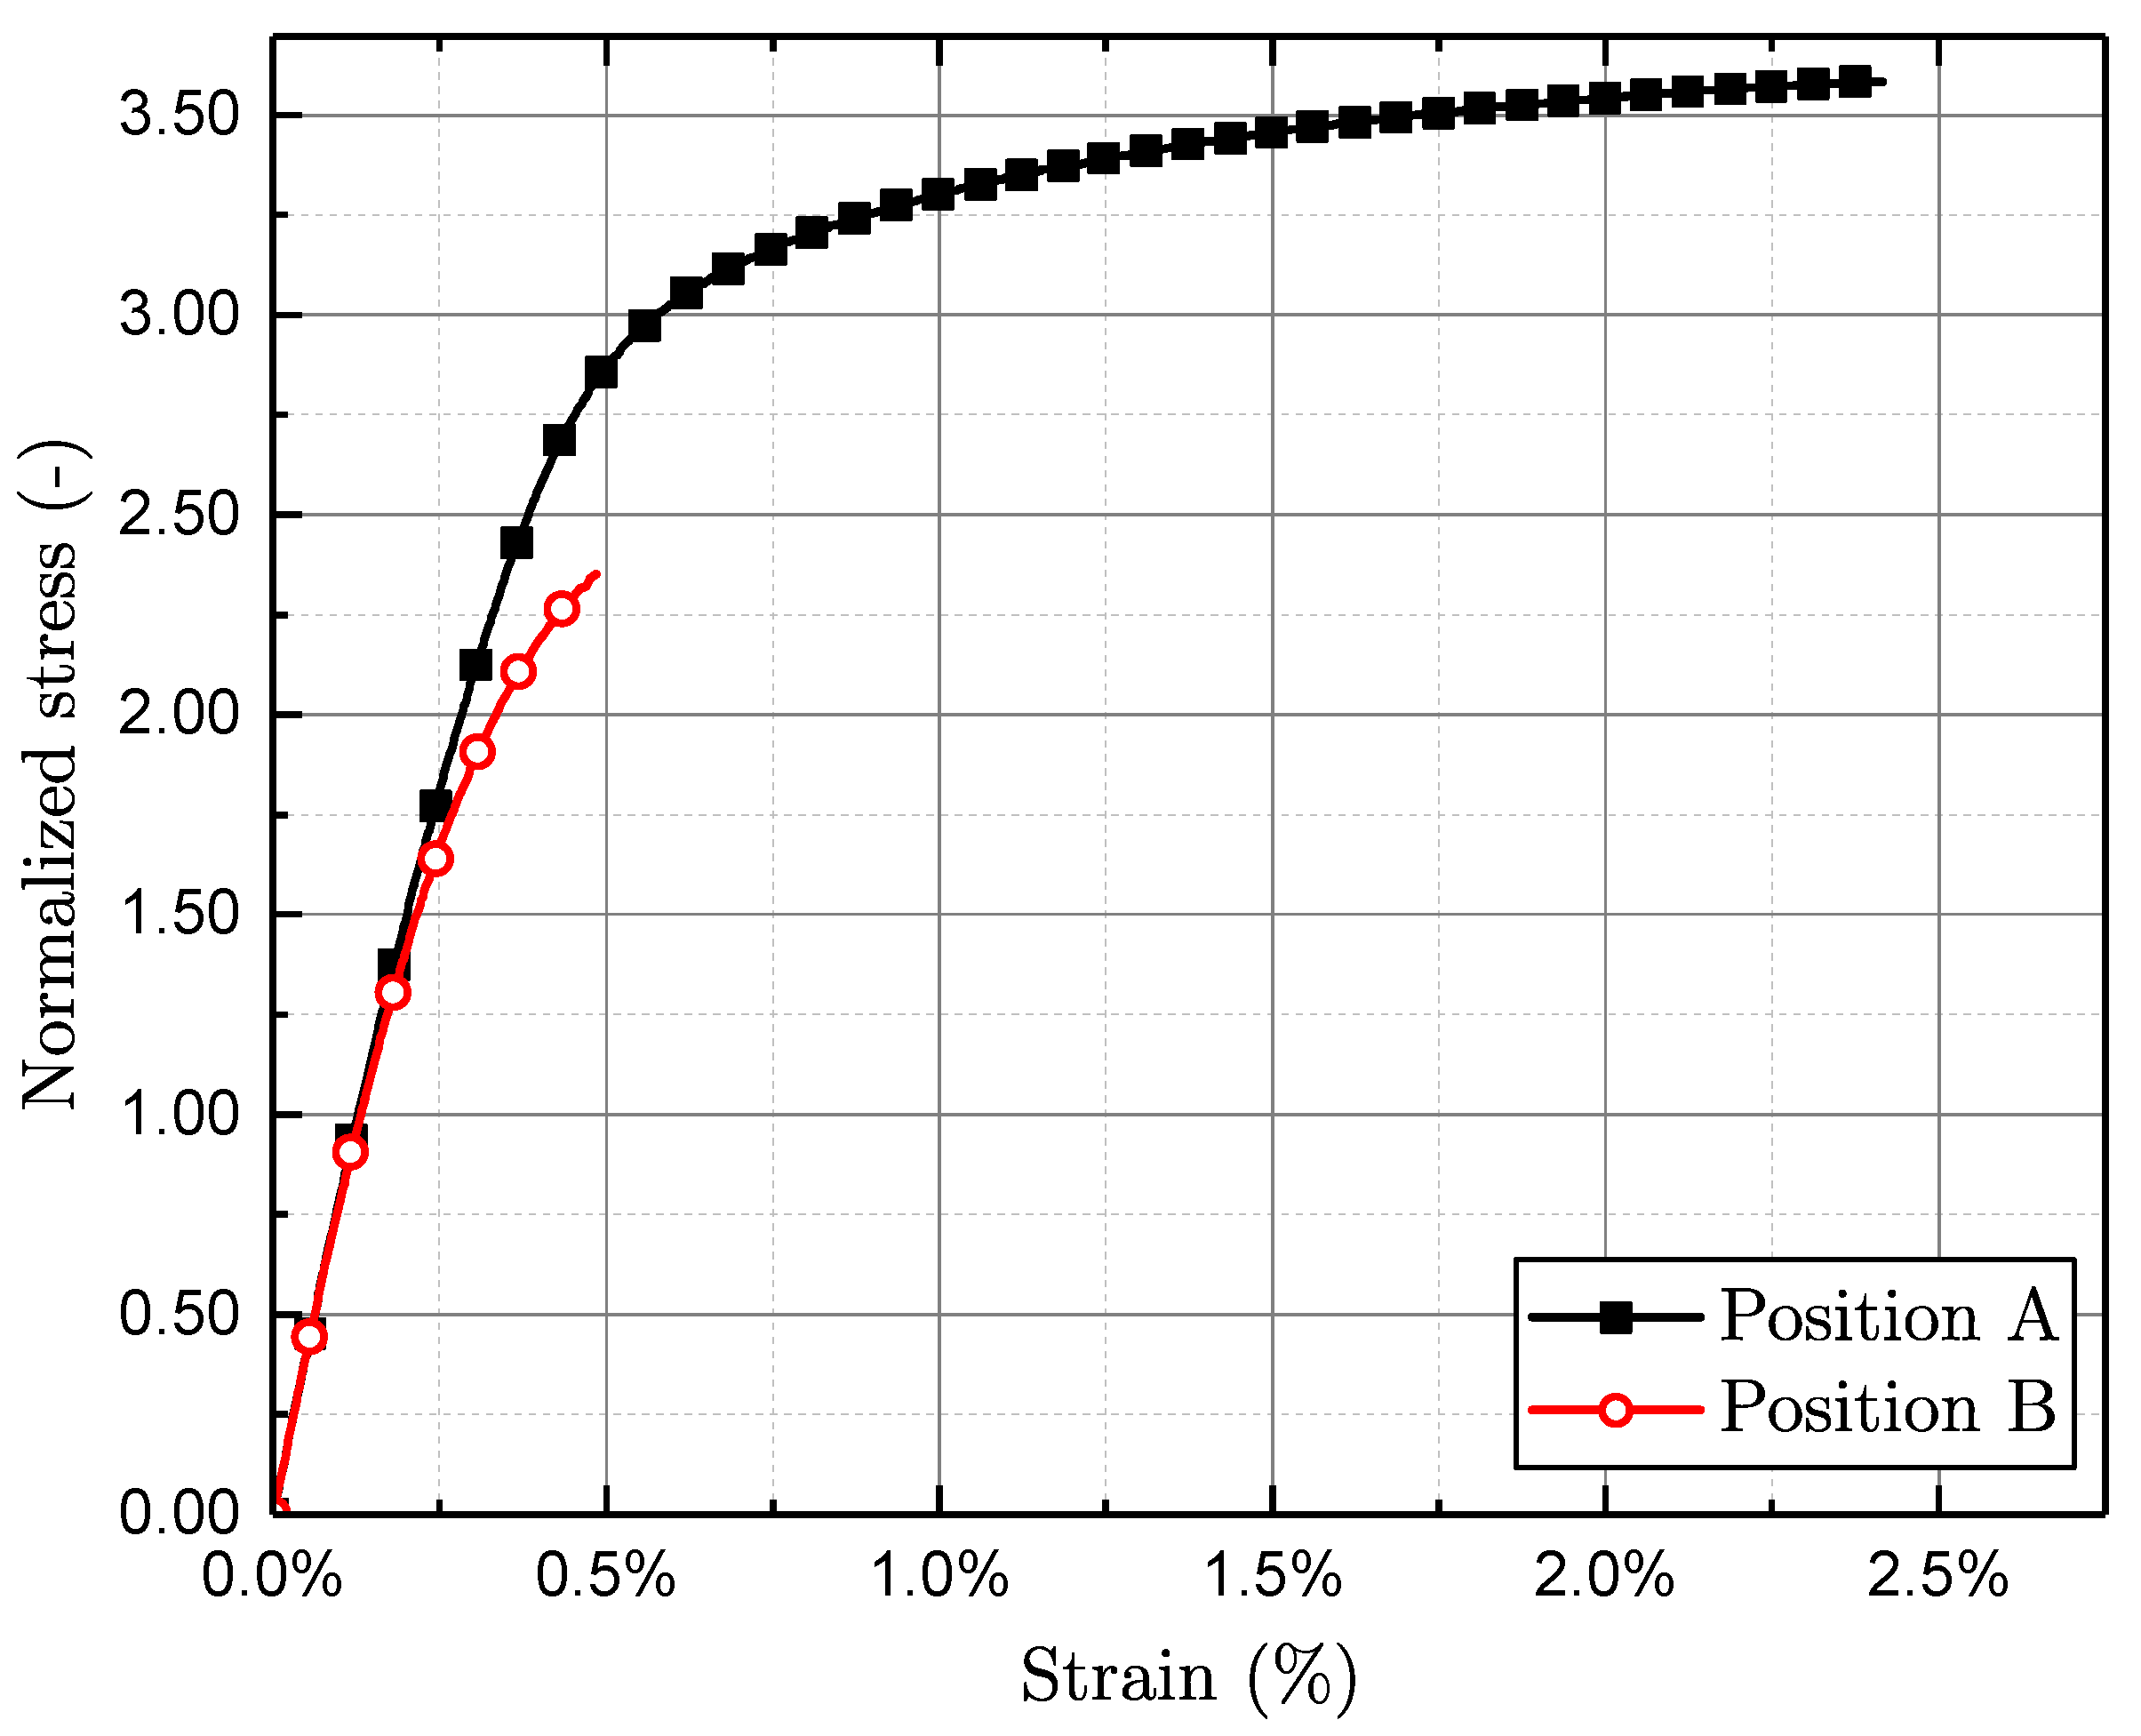
56], every single specimen is polished prior to the testing. The tensile specimens are tested at a hydraulic Instron Schenk hydraulic strain-controlled system (Darmstadt, Germany) with a strain rate of
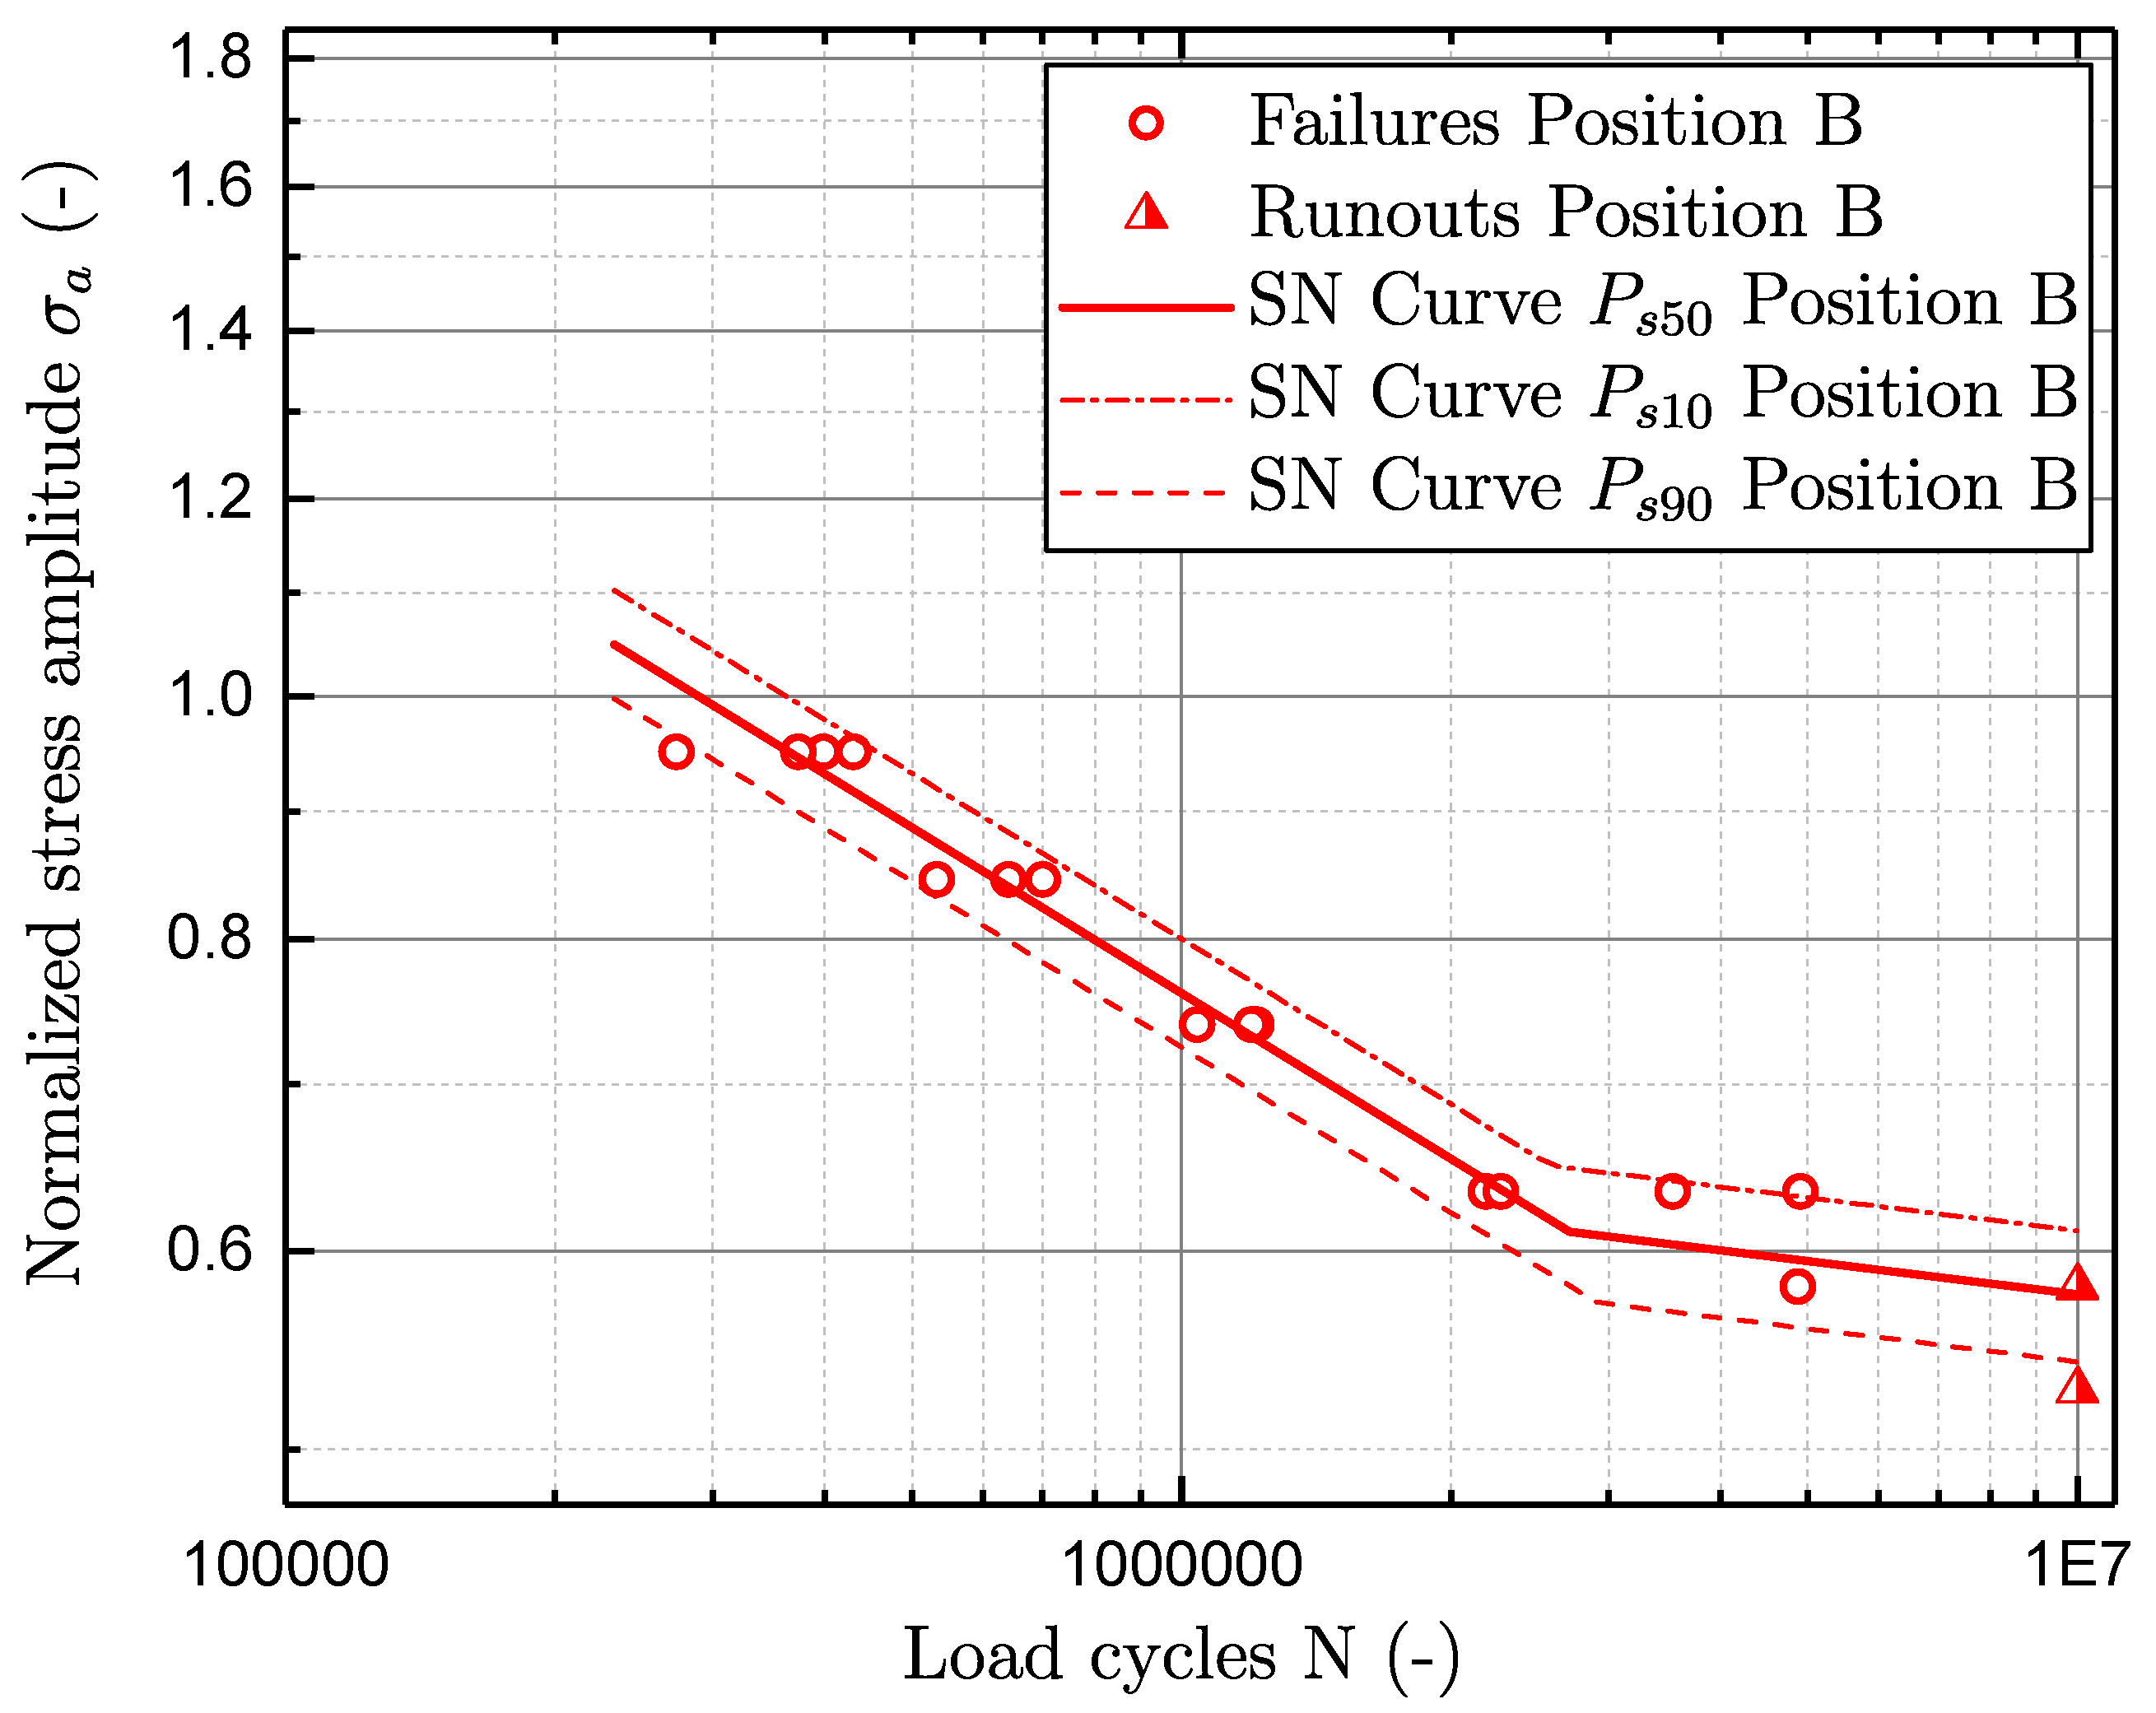
1/s, utilising an extensometer. The fatigue tests are conducted at different specimen locations, utilising a Rumul electro-magnetic resonance testing machine (Neuhausen am Rheinfall, Switzerland). The testing frequency is about 108 Hz. Specimens are tested until burst failure, respectively a total runout number of load cycles of 1E7. The tests are executed at room temperature with an alternating tension/compression load at a load stress ratio of
R = −1. The crack propagation tests are conducted at a Rumul electro-magnetic resonance bending test machine and incremental load growth at a load stress ratio of
R = −1, in line with fatigue tests. The X-ray computed tomography investigations are carried out by a Phoenix/X-ray Nanotom 180 (Gelsenkirchen, Germany) and a voxel-size of just 5.5
m.
4. Discussion
The presented fatigue approach is valid in the first and second crack propagation regime due to the implemented crack propagation model of Klesnil–Lukas. Therefore, not only the endurable stress amplitude in the finite-lifetime region, but also within the long-life region can be estimated. A defect correlated failure is mandatory in order to evaluate the spatial extent of the initiation crack . By implementation of the statistical pore size distribution, the probabilities of failure and survival can be utilised. Furthermore, in situ computed tomography investigations proposed that the number of cycles for crack initiation is almost negligible for the investigated material.
In line with existing defect-based fatigue strength approaches, the upper lifetime boundary of the model has to be evaluated, since the fatigue strength of even defect-free material will be limited by other influencing factors, such as intrinsic heterogeneities. Thus, future work will focus on the assessment of near-defect-free material, which will be accomplished by applying a hot isostatic pressed (HIP) post treatment.
Another research topic is the correlation between the statistical distribution of XCT evaluated pore sizes and the distribution of fatigue fracture initiating ones. Ongoing work proposes functions to weight the non-destructively evaluated defect population with numerically estimated geometry factors, such that the most critical flaws will not be assessed only by their size but also by their spatial orientation, shape and location in terms of minimal surface distances. Another interesting approach is proposed by the authors in [
48] which takes the mean value of the evaluated
fraction of extremal pore sizes from XCT-scanning into account, which will be compared to subsequent studies.
As soon as the non-destructively investigated defect population properly meets the distribution of fatigue fracture initiating flaw sizes, the presented approach in this study can be invoked to get the defect correlated fatigue strength behaviour. Finally, the in situ computed tomography investigations will be extended in order to evaluate the crack initiation at local material inhomogeneities in detail.

 ,
, 


