Electrochemically Treated TiO2 for Enhanced Performance in Aqueous Al-Ion Batteries


Energy Technology Research Group, University of Southampton, Southampton SO17 1BJ, UK
*
Author to whom correspondence should be addressed.
Materials 2018, 11(11), 2090; https://doi.org/10.3390/ma11112090
Submission received: 27 September 2018
/
Revised: 15 October 2018
/
Accepted: 23 October 2018
/
Published: 25 October 2018
(This article belongs to the Special Issue Advanced Materials for Aluminium-ion Battery)
Abstract
:The potential for low cost, environmentally friendly and high rate energy storage has led to the study of anatase-TiO2 as an electrode material in aqueous Al3+ electrolytes. This paper describes the improved performance from an electrochemically treated composite TiO2 electrode for use in aqueous Al-ion batteries. After application of the cathodic electrochemical treatment in 1 mol/dm3 KOH, Mott–Schottky analysis showed the treated electrode as having an increased electron density and an altered open circuit potential, which remained stable throughout cycling. The cathodic treatment also resulted in a change in colour of TiO2. Treated-TiO2 demonstrated improved capacity, coulombic efficiency and stability when galvanostatically cycled in 1 mol·dm−3AlCl3/1 mol·dm−3 KCl. A treated-TiO2 electrode produced a capacity of 15.3 mA·h·g−1 with 99.95% coulombic efficiency at the high specific current of 10 A/g. Additionally, X-ray diffraction, scanning electron microscopy and X-ray photoelectron spectroscopy were employed to elucidate the origin of this improved performance.
1. Introduction
Aqueous intercalation batteries are being explored as potentially cheap, safe, non-toxic and high power energy storage devices [1,2,3,4]. Aqueous Al-ion batteries may provide a promising chemistry due to the low cost and high abundance of aluminium [5,6]. Anatase-TiO2 is one of only a few negative insertion electrode materials shown to function in aqueous electrolytes and has shown some promising performance characteristics with regard to power capability in aqueous aluminium containing electrolytes [6,7,8,9,10,11]. Previous publications have attributed charge storage to the reduction of Ti4+ to Ti3+ with the concomitant intercalation of Al3+ [6,7,9,10], though surface charge storage via a capacitive or psuedocapacitive mechanism cannot be ruled out. Nevertheless, charge storage has been shown to be due to the presence of Al3+ and not H+, K+ or Na+ in aqueous chloride electrolytes [5,11]. Other insertion materials with a suitably negative potential range in aqueous electrolytes, excluding those based on lithium salts, are limited to Nasicon titanium phosphates and vanadium oxides, while activated carbon has also been employed as a capacitive negative electrode [12,13,14,15]. NaTi2(PO4)3, for use as a negative electrode in aqueous Na-ion, seems to be promising. A capacity of 60 mA·h·g−1 at 2.66 A/g was measured by Hang et al. [16]. The possibility of using a dual-ion electrolyte to construct a full cell, where separate cations are reversibly inserted into the negative and positive electrodes, has been demonstrated, opening the possibility of using a variety of electrode combinations [5,17,18,19]. Therefore, TiO2 in aqueous Al3+-containing electrolytes provides an opportunity for creating aqueous cells with high working voltages. However, to date there has been limited discussion of the low coulombic efficiency of anatase TiO2 in aqueous aluminium salt electrolytes, especially during initial cycles. This is an important point for the electrode to be considered for use in full, two electrode battery cells. Furthermore, methods to improve the performance of TiO2 in aqueous aluminium electrolytes have generally focused on nanostructures such as nanospheres, nanotube arrays or the addition of graphene flakes [6,8,10]. A relatively high capacity of ca. 150 mA·h·g−1 was measured from TiO2 nanospheres at the low specific current of 50.25 mA/g, while a graphene-TiO2 electrode produced a discharge capacity of ca. 20 mA·h·g−1 at a high current of 6.25 A/g. However, the coulombic efficiency of these TiO2 structures is low, with the coulombic efficiency of graphene incorporated TiO2 being approximately 50%.
Doped TiO2 could provide a method to incorporate Ti3+ to improve the electrodes’ ionic and electronic conductivity whilst potentially improving insertion kinetics of Al3+. However, only He et al. have described the potential of doped TiO2 via their synthesis of black nanoleaves [7]. Their method of solution plasma processing is not yet well understood and may not be feasible for producing large quantities of material; as such, alternative methods of doping are important to help verify the effect of doping on TiO2 electrodes and its application in aqueous batteries [20,21].
Other methods of TiO2 doping have been widely explored for use in other applications such as photocatalytic hydrogen production, environmental pollutant removal or supercapacitor electrodes [22]. It is with alternative applications in mind that various methods of doping have been proposed. Doped TiO2 nanostructures have been prepared via high temperature (> 500 °C) treatments in H2, Ar and N2 atmospheres [23,24,25,26]. The electrochemical reduction method used has been previously reported as a safe and facile method of producing reduced (self-doped) TiO2. Electrochemically doped TiO2 nanotube arrays has shown improved electrochemical performance as aqueous supercapacitor current collectors, while self-doped TiO2 nano structures have demonstrated improved photocatalytic activity for water splitting [27,28]. Here, we report that this safe, facile and repeatable reduction treatment can be applied to composite TiO2 electrodes in order to improve their performance as a negative electrode in aqueous AlCl3 electrolyte, demonstrating high rate capability and stability during cycling. Significantly, doping of TiO2 is demonstrated to be an important factor for improving coulombic efficiency and initial cycling stability in aqueous electrolyte.
2. Materials and Methods
Composite TiO2 electrodes were manufactured through combining TiO2 nanopowder (87.5 wt%), Vulcan XC-72 carbon black (5 wt%), Nafion binder (7.5 wt%) and additional propanol (approximately 3 g for every 1 g of powder). The resulting ink was mixed using a Silverson high speed shear mixer for 30 min at 5000 rpm, then sonicated for a further 20 min. TiO2 was purchased from US-nano and had a nominal particle size of 5 nm. The resulting ink was then coated onto a carbon polymer current collector, which was used because of its electrochemical stability in acidic electrolytes and for being more cost effective than other metal current collectors, such as titanium or platinum foils and meshes. Electrodes were allowed to dry in ambient conditions overnight, resulting in 23–24 mg of active electrode covering an area of 7 cm−2, where the electrode covered 1 cm × 3.5 cm of both sides of the current collector.
Electrochemical experiments were carried out in 3-electrode cells using a saturated calomel reference (SCE) electrode and copper-hexacyanoferrate as a reversible counter electrode. The electrolyte used was 1 mol·dm−3 AlCl3/1 mol·dm−3 KCl. The electrochemical treatment process consisted of holding electrodes at −1.40 V vs. SCE in 1 mol·dm−3 KOH for 15 min, which was repeated ten times with a 3 min open circuit potential (OCP) between repeats. No obvious bubbling or H2 evolution was visible during chronoamperometry. Electrodes were left in the KOH electrolyte for several hours before being washed, in de-ionised water, and transferred into a 3-electrode cell with a AlCl3/KCl electrolyte. Galvanostatic cycling and electrochemical impedance spectroscopy were performed on a Solartron 1470E battery analyser. Electrochemical impedance spectroscopy (EIS) was performed to produce both Mott–Schottky and Nyquist plots. For Mott–Schottky analysis, EIS was performed using a 10 mV perturbation between 10 kHz and 10 Hz at DC bias potentials between 0.4 V and −0.7 V vs. SCE. For the Nyquist plots, EIS was performed on electrodes in partially charged states, achieved by applying a 100 mA/g charge current to −0.8 V and −0.9 V, holding the electrodes at these potentials for 120 s, then performing measurements at OCP. These measurements were performed between 0.1–10 kHz using a 10 mV perturbation around the OCP.
X-ray diffraction (XRD) was carried out using a Bruker D2 phaser with Cu Kα radiation (average wavelength = 1.5418 Å). Data points were collected in the 2θ range 15° to 75° with a 0.0202572° increment and 0.4 s time step. Scanning electron microscope (SEM) images were obtained using a JSM 6500F field emission electron microscope, which was operated at 15.0 kV and a working distance of 13.7 mm.
3. Results
3.1. Electrode Characterisation
The cathodic electrochemical treatment was carried out via a chronoamperometry performed on composite TiO2 electrodes. A potential of −1.40 V vs. SCE was applied to the electrode in 1 mol·dm−3 KOH in an attempt to partially reduce the TiO2 active material. The potential was stepped from 0.0 V vs. SCE to −1.40 V vs. SCE and held for 15 min. Figure 1a shows the resulting specific current vs. time profile. A cathodic current response of ca. 2.5 A/g decreases rapidly to ca. 0.10 A/g after 3 s and to less than 0.05 A/g after 7.8 s. Between minutes 6 and 8, the measured current is less than 0.04 A/g as shown by the inset of Figure 1a. The same electrochemical reduction protocol was also applied to electrodes without carbon black conductive additive. Figure 1b gives the XRD patterns from a TiO2 and treated-TiO2 electrode. Both show the characteristic anatase pattern with no difference between the two, suggesting a lack of bulk structural change to the TiO2 electrodes.
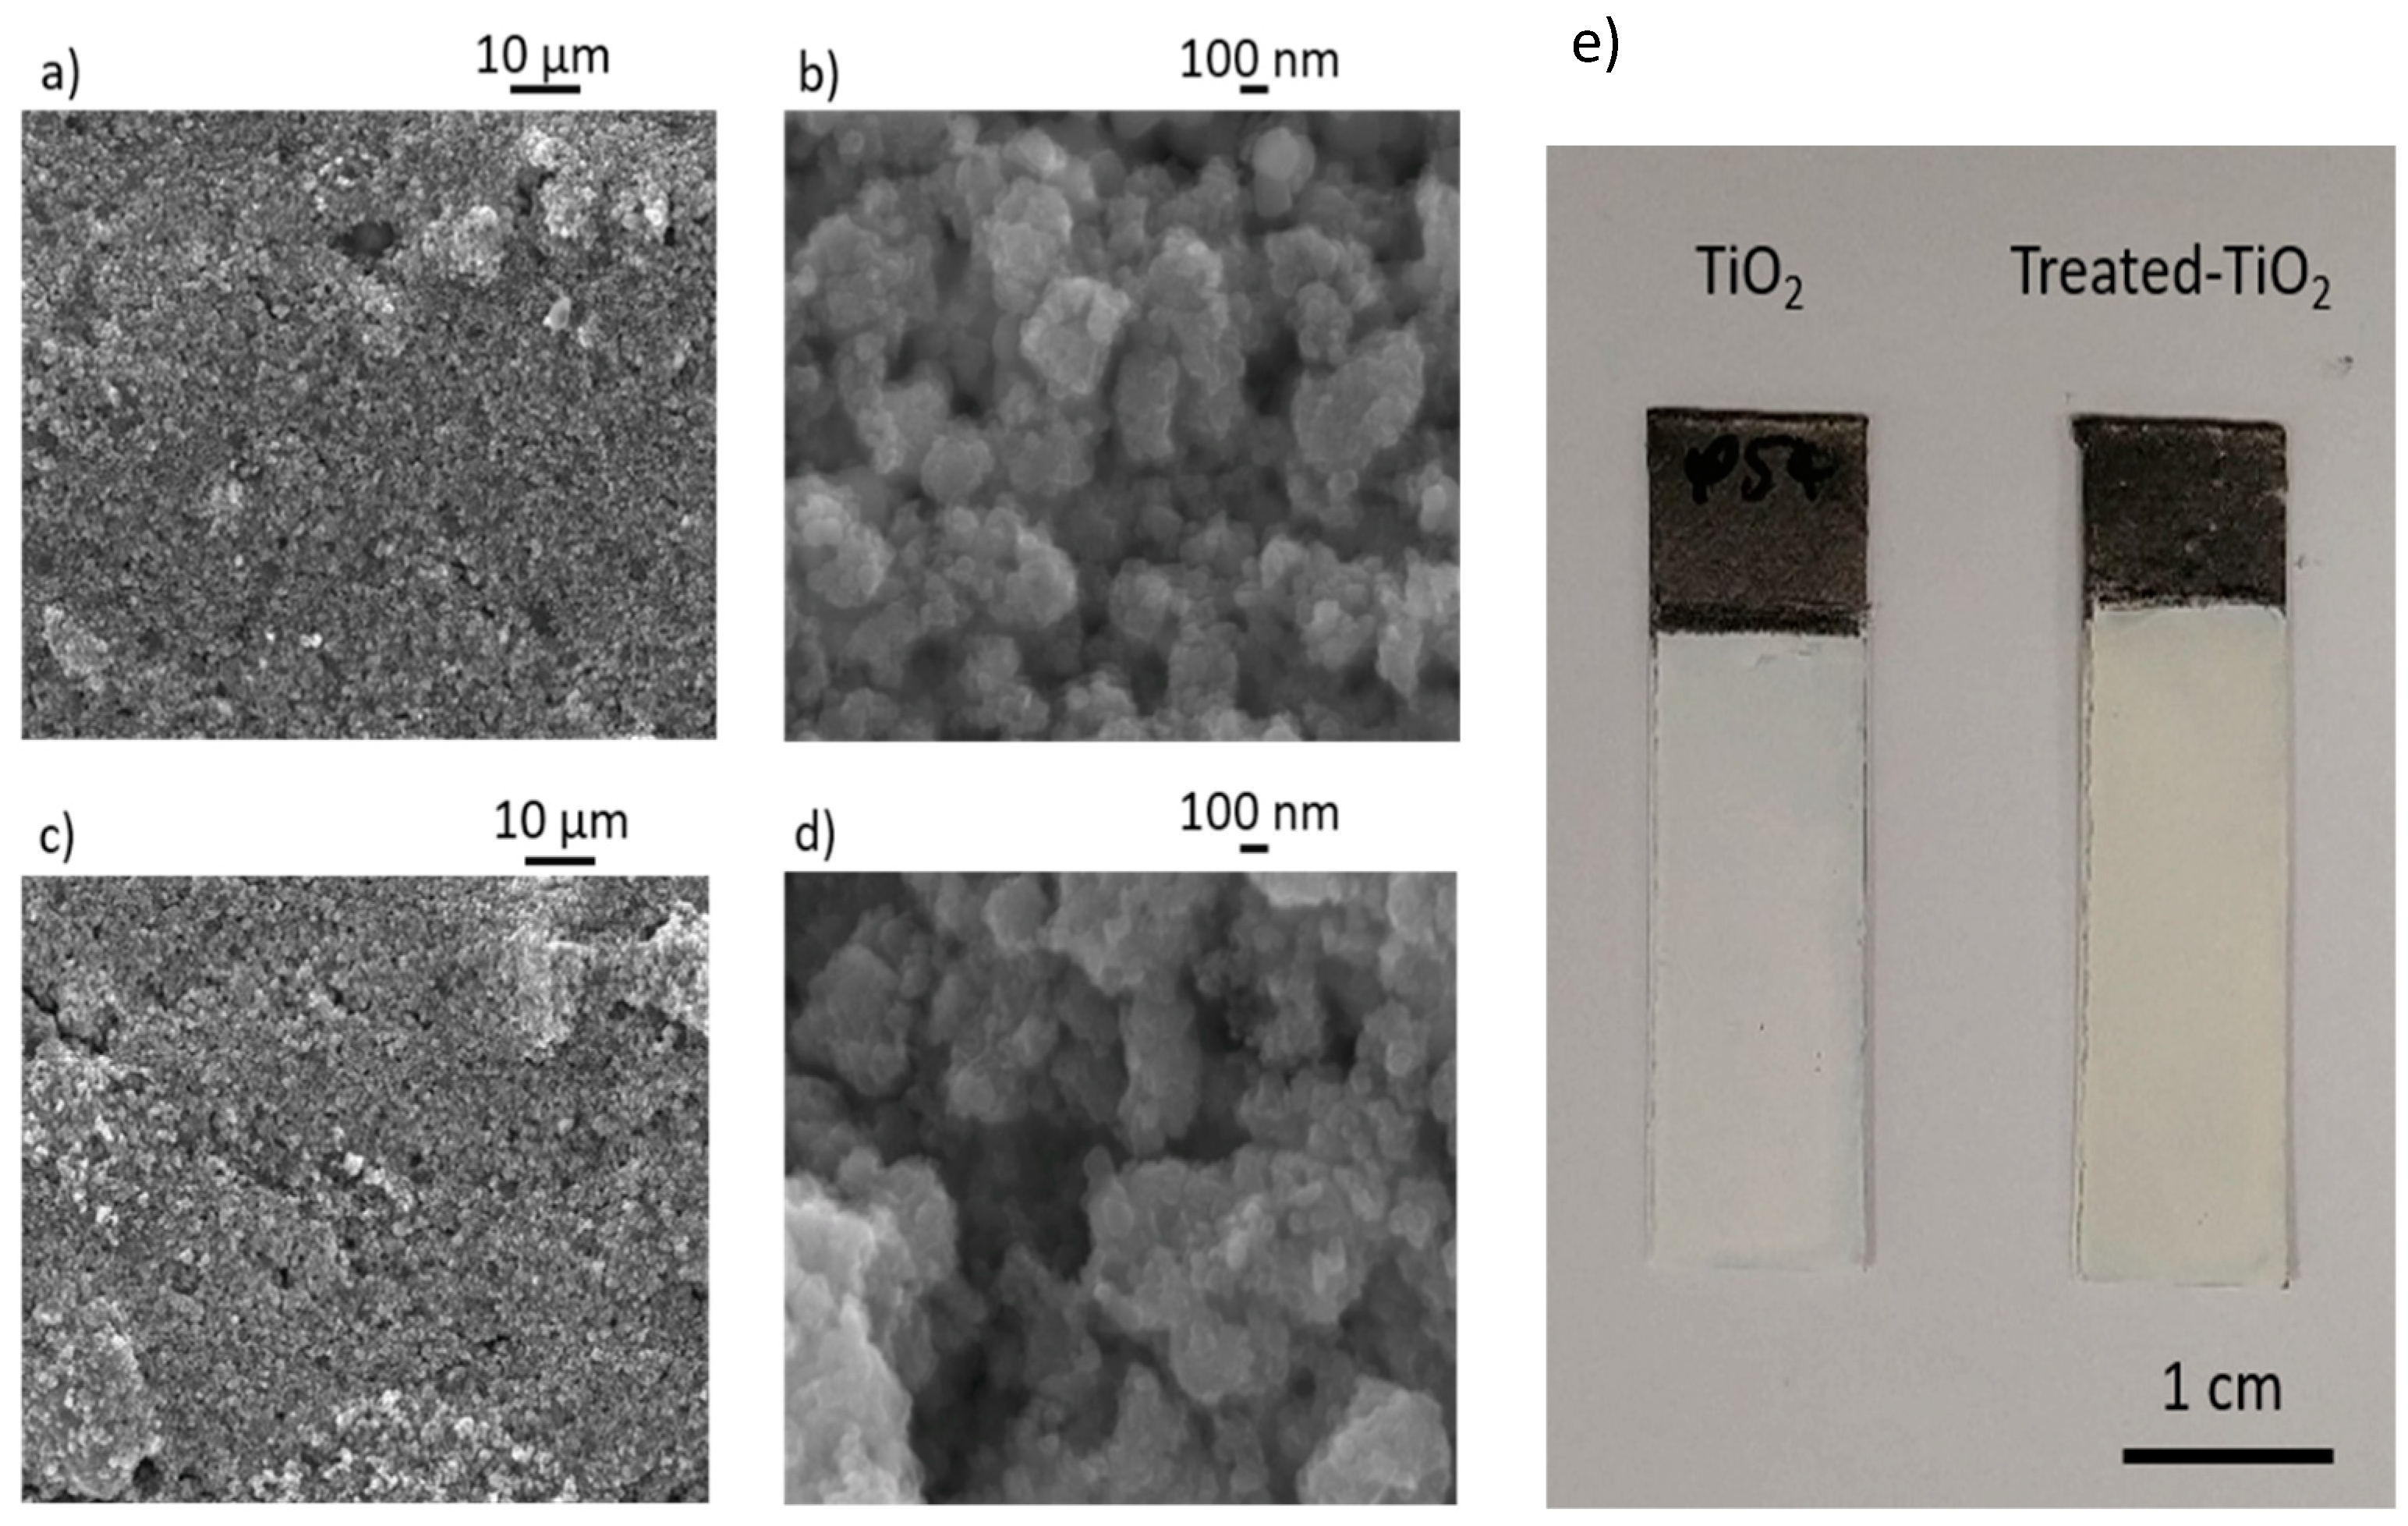
Figure 2a,b show SEM images of an as-manufactured TiO2 electrode, at 1000× and 40000× magnification, with Figure 2c–d giving images from treated-TiO2. At 1000× magnification, both electrodes show an even coating of active material, though larger agglomerations can also be seen. At 40000× magnification, individual particle agglomerations can be observed, though resolution of individual particles cannot be seen due to the small nominal TiO2 particle size of approximately 5 nm. No significant change can be observed in the structure of the electrodes, suggesting that any change in electrode performance was not due to particle flocculation or minor electrode cracking, which could have increased surface area or improved electrode wettability. Figure 2d shows photographic images of an as-manufactured (left) and electrochemically treated-TiO2 (right) electrode following the chronoamperometry shown in Figure 1a. Following treatment, the previously white TiO2 electrode can be seen to change colour to pale-yellow. This would be consistent with the introduction of Ti3+ and a change in the band gap of TiO2 [22,29]. Despite previous self-doped TiO2 nanotube arrays developing a blue colour [30], a yellow colour has also been shown to occur when TiO2 has undergone hydrogenation [31,32], hydrothermal treatment [33] or N2 doping [34].
X-ray photoelectron spectroscopy was performed on the samples shown in Figure 2e to investigate the surface states of untreated (TiO2) and electrochemically treated TiO2 (treated-TiO2) electrodes. Figure 3 gives the Ti 2p spectra of TiO2 (a) and treated-TiO2 (b) electrodes. No detectable difference can be observed between the samples. This could indicate that Ti3+ states exist within the bulk rather than the surface. However, given that measurements were performed ex-situ, it is more likely that any Ti3+ formation, from the electrochemical reduction treatment, is followed by re-oxidation in air. Ti 2p3/2 peaks are located at 459.40 and 458.71 eV for TiO2 and treated-TiO2 respectively, while Ti 2p1/2 peaks are located at 465.15 and 464.46 eV. Unexpectedly, the presence of inorganic Ti-oxyfluoride < 1%, was detected in both samples, which may arise during ink preparation, but could alternatively arise from low level X-ray degradation of the binder within the ink.
Figure 4 shows Mott–Schottky plots produced from EIS measurements performed at DC bias potentials between 0.4 V and −0.7 V vs. SCE, in 1 mol·dm−3 AlCl3/1 mol·dm−3 KCl. Figure 4a compares a TiO2 and treated-TiO2 electrode at a frequency of 5 kHz. Capacitance values were calculated via Equation (1), where C = capacitance, f = frequency and Z″ = imaginary impedance part. The positive and linear gradient produced by the as-manufactured TiO2 electrode, between approximately −0.45 V and −0.3 V vs. SCE, is indicative of an n-type semi-conductor and has an approximate gradient of 0.0748 [35,36]. The reduction in C−2 from the treated-TiO2 electrode suggests an increase in the number of donors (i.e., electrons) according to Equation 1, where C = capacitance, A = area, Nd = number of donors, e = electronic charge, V = applied potential, VFB = flat band potential, k = Boltzmann’s constant and T = absolute temperature [35].
Figure 4b shows an expanded view of the response from treated-TiO2 and also shows the response at frequencies of 2 kHz and 10 kHz. The Mott–Schottky plot is again indicative of an n-type semi-conductor. The gradient of the linear portion of the plot, between −0.46 and −0.56 V vs. SCE, is approximately 6.25 × 10⁻⁵. This is 3 orders of magnitude lower than the approximate gradient found in the as-manufactured TiO2 electrode at the same frequency, providing clearer evidence that the electrochemical treatment resulted in an increase in the electron donor number. The number of donors, Nd, was not estimated since the electrochemically active surface area was not known. Nevertheless, the cathodic electrochemical treatment resulted in an increase in the number of donors (electrons) and a shift of the VFB to a more negative potential. Both these criteria would be expected from an introduction of Ti3+ or oxygen vacancies into TiO2, as expected from the cathodic treatment at −1.4 V vs. SCE in 1 mol·dm−3 KOH.
3.2. Electrochemical Performance
To determine variations in electrode performance, 10 galvanostatic cycles were performed at each of the specific currents of 0.2, 0.5, 1.0, 2.0, 4.0, 6.0 and 8.0 A/g. Treated-TiO2 was then also cycled at 10.0 A/g. Figure 5a,b shows the discharge capacity and coulombic efficiency against the cycle number at the given specific currents. During the initial 10 cycles, the discharge capacity of both electrodes increases before stabilising during subsequent cycling, while it can be seen that the improved performance from treated-TiO2 becomes most obvious at higher specific currents. Figure 5b shows how the coulombic efficiency requires a greater number of cycles before stabilising. After 30 cycles, coulombic efficiency is relatively stable at a given specific current for both electrodes. To better show differences in performance, Figure 5c,d shows the discharge capacity and coulombic efficiency of the two electrodes as a function of specific current. The data points for Figure 5c,d were taken between cycle 60 and 160, shown in Figure 5a,b, using the 10th cycle from each specific current to ensure that a stable response had been reached. Figure 5c shows the discharge capacity of TiO2, at 0.2 A·g−1 to be 25.3 mA·h·g−1, which is actually marginally higher than the 23.8 mA·h·g−1 measured from the treated-TiO2. However, the improved performance of treated-TiO2 becomes obvious at higher specific currents. At 2 A/g, the discharge capacities of TiO2 and treated-TiO2 are 15.9 mA·h·g−1 and 21.3 mA·h·g−1 respectively. At 8 A/g, the TiO2 electrode can produce a capacity of only 3.2 mA·h·g−1 while a capacity of 15.3 mA·h·g−1 was measured from treated-TiO2 at the higher specific current of 10 A/g, clearly showing superior rate capability. The coulombic efficiency of treated-TiO2 was measured to be 81.4% and 91.8% at 0.2 A/g and 0.5 A/g, respectively. This is higher than a coulombic efficiency of 75.9% and 85.0% for the TiO2 electrode. Above specific currents of 1.0 A/g, the coulombic efficiency of both electrodes are roughly similar, increasing from approximately 98% to > 99.95% at 8.0 A/g.
Figure 6 gives the voltage profiles, at 1 A/g, of the same treated−TiO2 (a) and TiO2 (b) electrodes during the 1st, 10th and 60th cycle. For treated-TiO2, a 1st cycle discharge capacity of 22.5 mA·h·g−1 was measured, corresponding to a coulombic efficiency of 81.7%. This increased to 24.2 mA·h·g−1 at a coulombic efficiency of 94.44% by the 10th cycle with a discharge capacity and coulombic efficiency of 23.1 mA·h·g−1 and 96.2% measured during the 60th cycle. For the untreated TiO2 electrode, an initial discharge capacity of 16.6 mA·h·g−1 was measured with a coulombic efficiency of 70.30%. Discharge capacity and coulombic efficiency were measured as 20.1 mA·h·g−1 and 83.4% during the 10th cycle and 21.4 mA·h·g−1 and 94.0% by the 60th cycle. The increased discharge capacity and coulombic efficiency from the treated-TiO2 electrode during initial cycling would be a particularly important consideration for full cell construction.
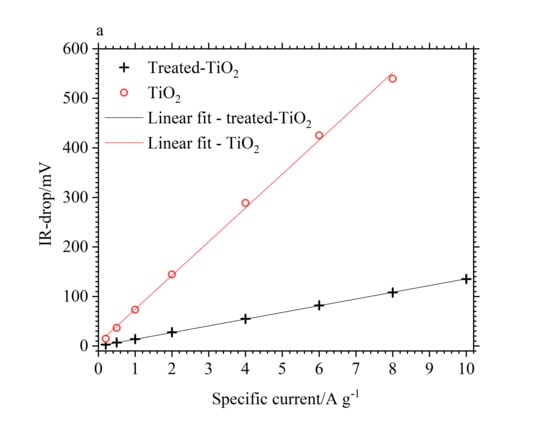
The IR-drop, between charge and discharge, was also observed to be lower for the treated-TiO2 electrode throughout the cycling regime, resulting in a lower equivalent series resistance (ESR) for the electrochemically treated electrode. This can be seen in Figure 7a. Both electrodes follow a linear increase in IR-drop with increasing specific current as represented by the linear fits with x and y intercepts of 0. The difference between the treated-TiO2 and TiO2 electrodes is 11.7 mV at 0.2 A/g, increasing linearly to 116.5 mV at 2 A/g. At 10.0 A/g, the IR-drop from treated-TiO2 is 135.2 mV, while the IR-drop from TiO2 at 8.0 A/g is 539.3 mV. The gradient of the linear fits were used to determine an ESR of 0.562 Ω for treated-TiO2 and 2.843 Ω for untreated TiO2. This suggests a significant improvement in the conductivity of TiO2, a reasonable conclusion from the introduction of Ti3+ expected from the electrochemical reduction process, which would decrease the band gap and thus improve conductivity. Electrodes were 23 and 24 mg for the treated and pristine electrodes respectively, both covering an area of 7.0 cm−2 such that differences in electrode impedance arising from differences in mass loading or electrode thickness can be reasonably neglected.
The effect of the treatment was further characterised with the use of electrochemical impedance spectroscopy (EIS). TiO2 and treated-TiO2 electrodes were left at open circuit potential (OCP) for 1 h before being subject to EIS protocols. Measurements were performed between 0.1 Hz–10 kHz with a 20 mV perturbation. Electrodes were analysed in partially charged states by applying a 100 mA/g charge current to −0.8 V and −0.9 V, holding the electrodes at these potentials for 120 s then performing measurements at OCP. Potentials of 0.8 V and 0.9 V vs. SCE correspond to states-of-charge of approximately 20% and 50%, respectively. Figure 7b gives the Nyquist plot of a pristine and electrochemically treated TiO2 electrode at OCP after charging to −0.8 V or −0.9 V For both electrodes, the Nyquist plots follow a ca. 45° impedance, starting at 0.13 Ω on the real x-axis for treated-TiO2 and 0.17 Ω for TiO2 due to the series resistance arising from the electrolyte and electrode. This 45° line curves up to > 45° at a frequency of approximately 2 Hz for the treated electrode and at approximately 1 Hz for the as-manufactured electrode. The characteristic semi-circle present for many insertion battery electrodes is not immediately obvious, suggesting either a rapid charge-transfer or a very small charge-transfer resistance; this suggests that charge storage is diffusion limited. The > 45° slope present at mid to low frequencies further suggest the possibility of capacitive behaviour from the electrodes [28], though the plateau observed during galvanostatic cycling indicates a faradaic mechanism being responsible for charge capacity. The lower length of the segment in the high to mid frequency region, of treated-TiO2 compared to untreated TiO2, suggests a lower impedance. This could be assigned to a lower charge transfer resistance if the high frequency region is represented by a depressed semi-circle with a smaller radius. Alternatively, the ca. 45° line may represent a Warburg impedance, which can describe the transport of ions through electrode pores [37].
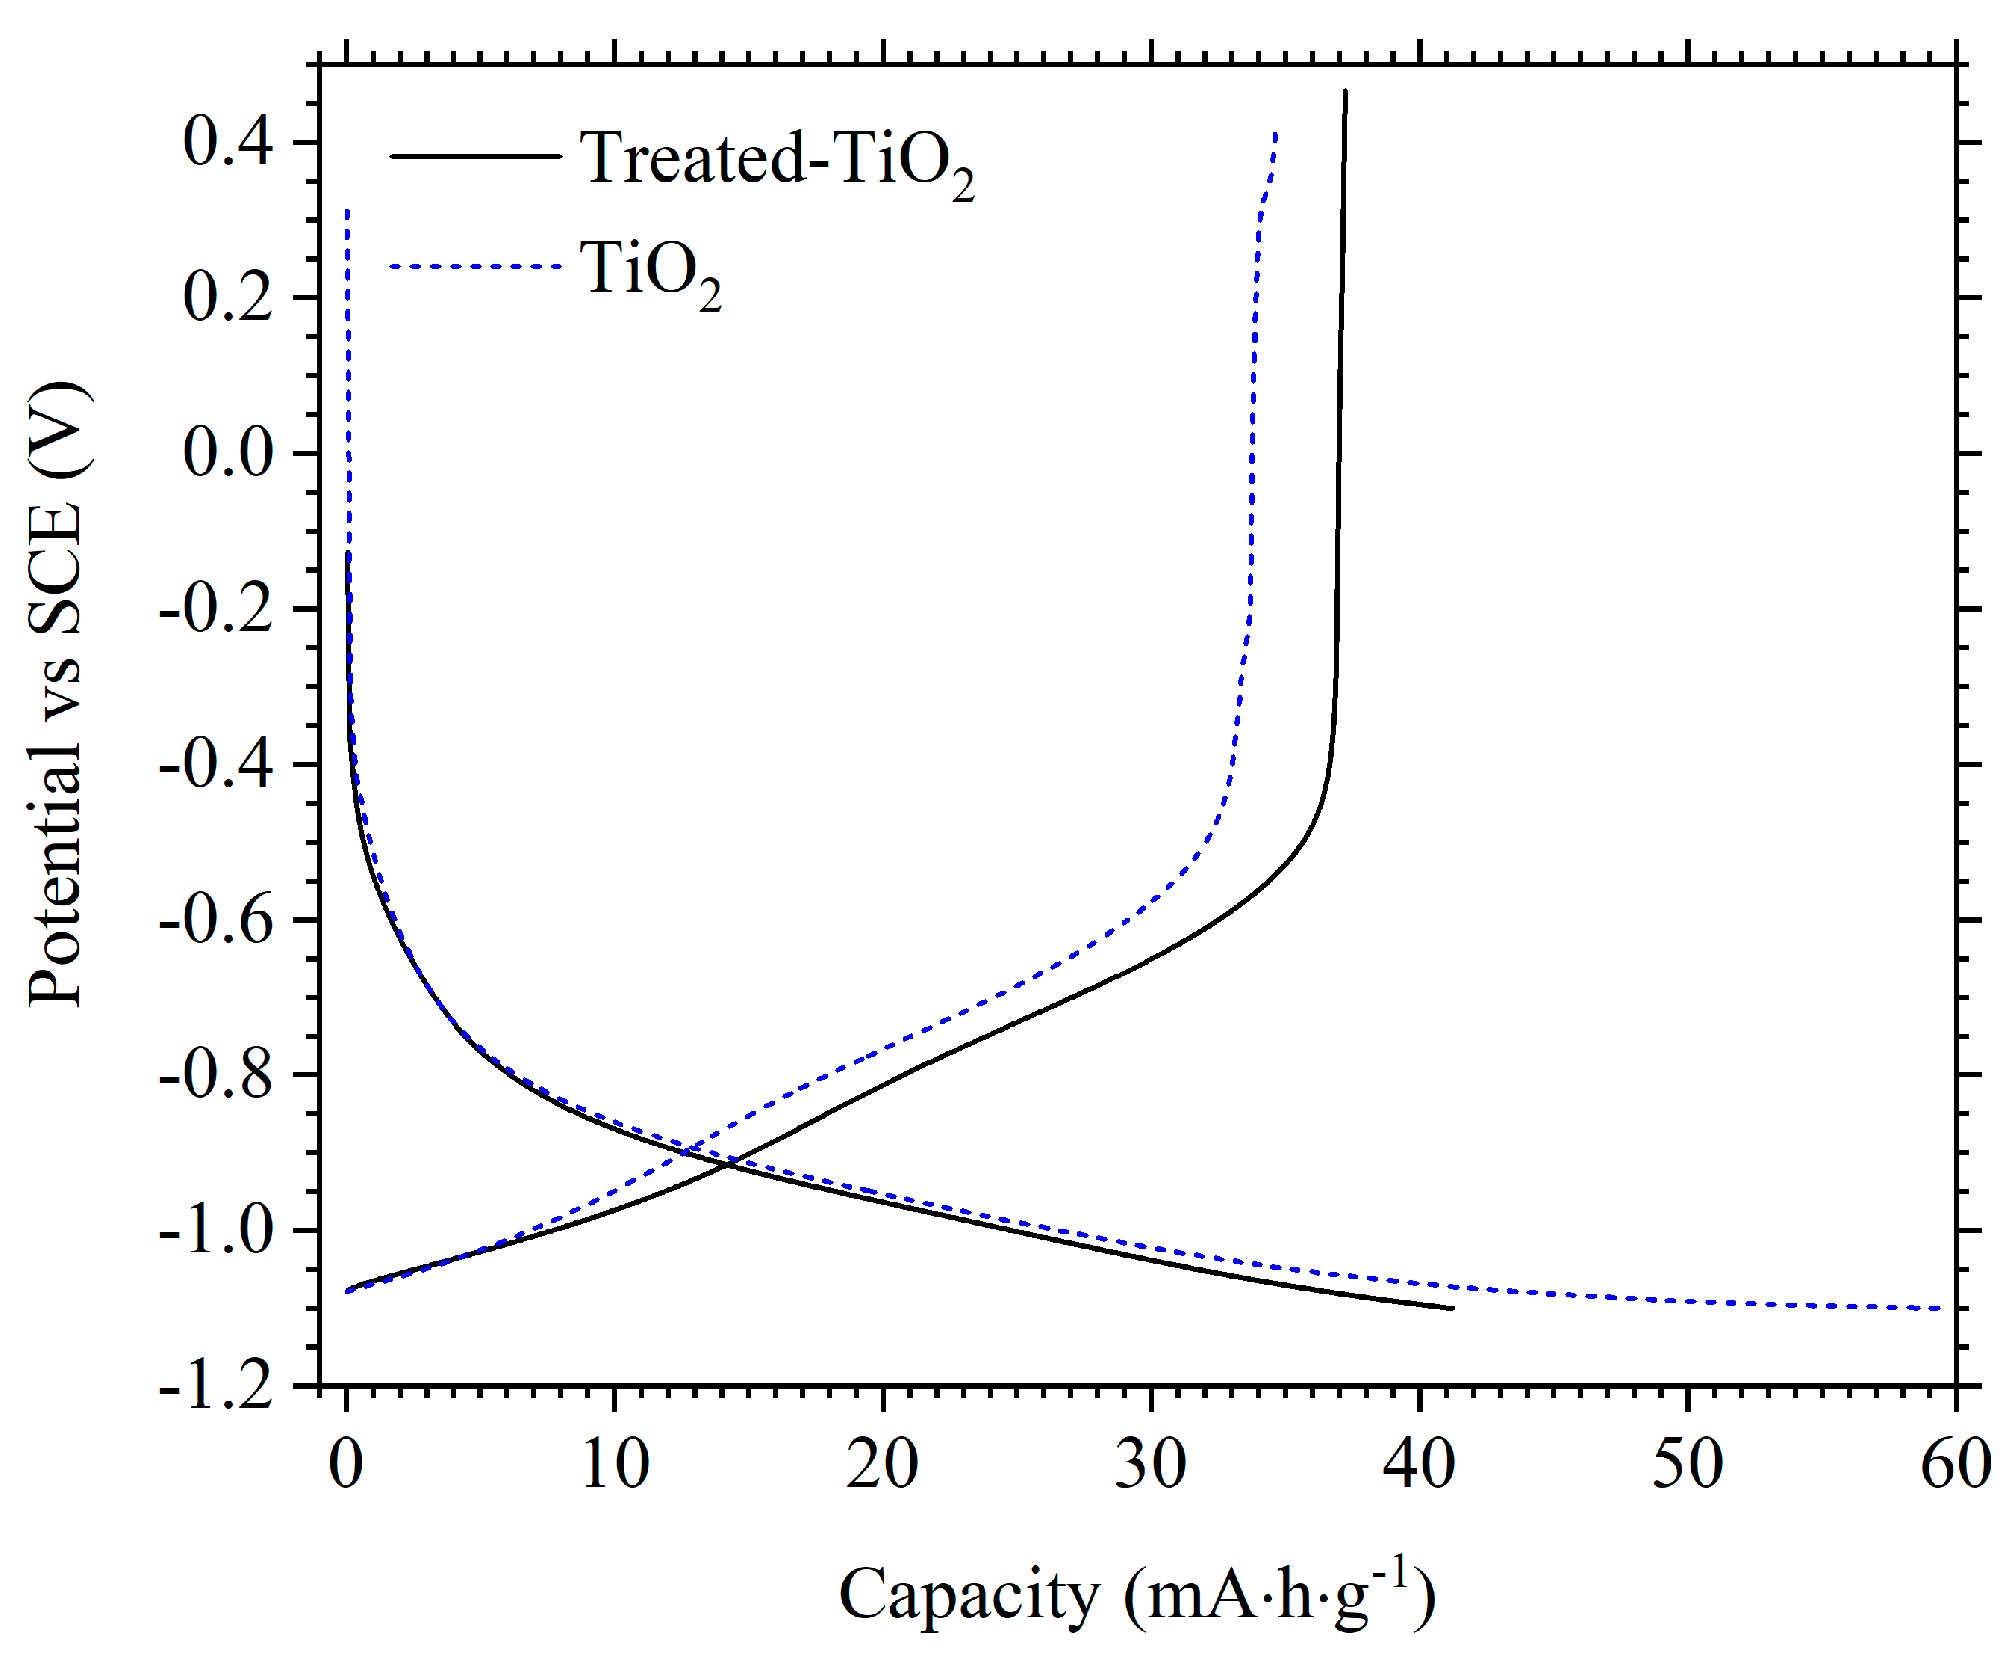
Furthermore, TiO2 and treated-TiO2 were cycled to −1.1 V vs SCE. Figure 8 shows the voltage profile of TiO2 and treated-TiO2 cycled at 1 A/g to −1.1 V. An increase in discharge capacity is measured from both electrodes: 34.6 mA·h·g−1 and 37.2 mA·h·g−1 for TiO2 and treated-TiO2 respectively. However, there is a considerable decrease in coulombic efficiency from TiO2, measured at only 58.0% compared to 85.0% when cycled to −1.0 V at 1 A/g. In contrast, coulombic efficiency is only marginally lower for treated-TiO2 at 90.3% compared to 90.9% when cycled to −1.0 V. This further demonstrates the drastic improvement provided by the electrochemical reduction treatment.
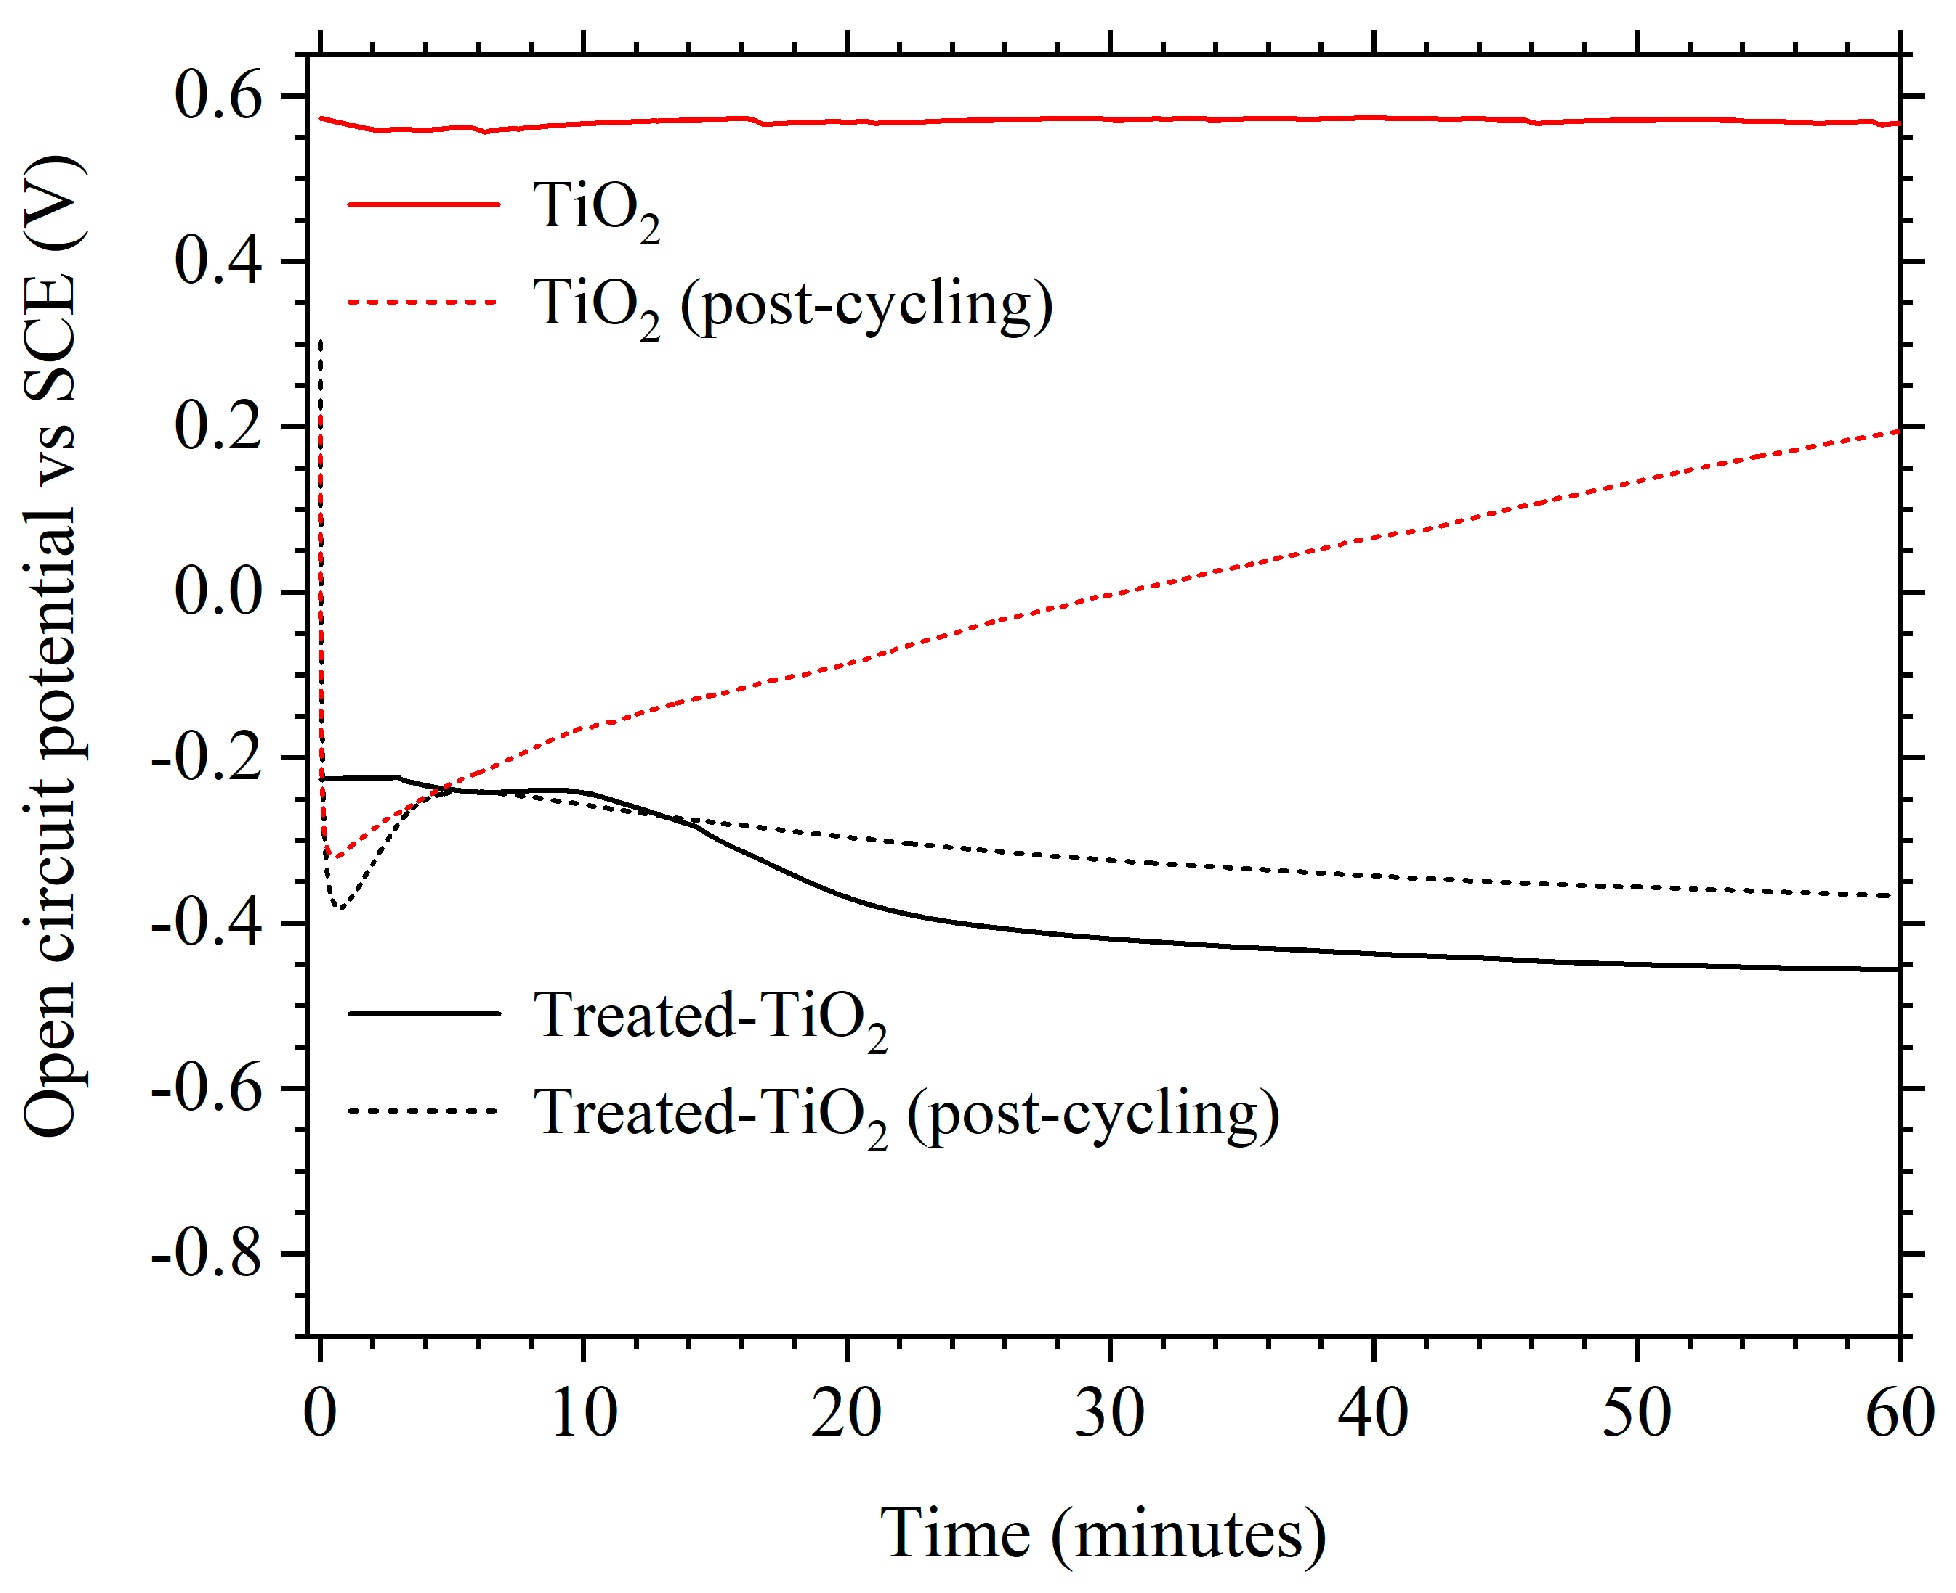
It was also observed that the OCP of treated-TiO2 was altered compared to TiO2, both before and after cycling. Figure 9 shows that before cycling, treated-TiO2 has an OCP of approximately −0.425 V vs. SCE with the OCP of TiO2 being approximately 0.58 V. Post-cycling, the OCP of treated-TiO2 after 1 h is relatively stable at approximately −0.38 V, with TiO2 being at 0.2 V and still increasing after 1 h at OCP. This implies a change in the equilibrium potential and therefore a change in the concentration of some species within the electrode, which could be the incorporation of Ti3+ due to the electrochemical treatment. It cannot be ruled out that the electrochemical reduction process improves performance through factors such as improved electrode wetting or enhanced surface area, though the lack of structural changes observed via SEM imaging and XRD suggest otherwise. However, while XPS showed that there was no measurable change in oxidation state, the observed colour change, different OCP values and Mott-Schottky plots suggest a change in the band gap and charge carrier density of TiO2, which would be consistent with the introduction of Ti3+. This change in OCP also remains stable in the electrolyte and during cycling.
4. Conclusions
Electrochemically treated TiO2 electrodes were prepared through a potentiostatic hold at −1.4 V vs. SCE, in 1 mol·dm−3 KOH. The colour change of a TiO2 electrode from white to pale yellow suggests the introduction of Ti3+, though this could not be confirmed with XPS measurements. However, a Mott–Schottky plot showed treated-TiO2 to have a greater electron donor number, which would be the expected result from the introduction of Ti3+ or oxygen vacancies. The electrochemical reduction protocol was shown to improve capacity, coulombic efficiency and stability during the first 60 galvanostatic cycles. Conductivity also drastically improved, observed via EIS and analysis of the IR-drop between charge and discharge cycles. It is demonstrated that the electrochemical treatment described can improve the performance of composite TiO2 electrodes for use in aqueous Al-ion batteries and could also be applied to titanium oxide electrodes in other metal-ion batteries. A discharge capacity of 15.3 mA·h·g−1 was possible from treated-TiO2 at 10 A/g—the highest specific current recorded from TiO2 in aqueous Al3+ electrolyte and a higher specific current than recorded from NaTi2(PO4)3 in aqueous Na-ion cells. The observed improvements to coulombic efficiency and stability during the first 10 cycles are particularly important for use in full cells, but still requires further improvements and understanding. Cycling a separate treated-TiO2 electrode at 1 A/g allowed for a capacity of 37.2 mA·h·g−1 at 90.3% coulombic efficiency, where an as-manufactured TiO2 electrode produced 34.6 mA·h·g−1 at a much lower coulombic efficiency of 58.0%, further demonstrating the improved stability from the electrochemically treated TiO2 electrodes. This work also highlights the importance of TiO2 doping for improved electrode performance in high-rate, aqueous electrolyte batteries.
Author Contributions
A.H. conceived the research, collected and analysed the data and drafted the article. R.M., A.C. and R.G., A.W. reviewed and revised the article.
Funding
Research was supported through two grants: “EPSRC Centre for Doctoral Training in Energy Storage and its Applications” EP/L016818/1 and “Horizon 2020 ALION” No. 646286.
Acknowledgments
The authors thank Alan J Paul, Len Hazell and Clare Carson at Lucideon UK Ltd. for performing XPS measurements and analysis.
Conflicts of Interest
The authors declare no conflict of interest.
References
- Wang, Y.; Feng, Z.; Laul, D.; Zhu, W.; Provencher, M.; Trudeau, M.L.; Guerfi, A.; Zaghib, K. Ultra-low cost and highly stable hydrated FePO4 anodes for aqueous sodium-ion battery. J. Power Sources 2018, 374, 211–216. [Google Scholar] [CrossRef]
- Li, W.; Dahn, J.R.; Wainwright, D.S. Rechargeable Lithium Batteries with Aqueous Electrolytes. Science 1994, 264, 1115–1118. [Google Scholar] [CrossRef] [PubMed]
- Kim, H.; Hong, J.; Park, K.-Y.; Kim, H.; Kim, S.-W.; Kang, K. Aqueous Rechargeable Li and Na Ion Batteries. Chem. Rev. 2014, 114, 11788–11827. [Google Scholar] [CrossRef] [PubMed]
- Wang, L.-P.; Wang, P.-F.; Wang, T.-S.; Yin, Y.-X.; Guo, Y.-G.; Wang, C.-R. Prussian blue nanocubes as cathode materials for aqueous Na-Zn hybrid batteries. J. Power Sources 2017, 355, 18–22. [Google Scholar] [CrossRef]
- Holland, A.; Mckerracher, R.D.; Cruden, A.; Wills, R.G.A. An aluminium battery operating with an aqueous electrolyte. J. Appl. Electrochem. 2018, 48, 243–250. [Google Scholar] [CrossRef] [Green Version]
- Kazazi, M.; Abdollahi, P.; Mirzaei-Moghadam, M. High surface area TiO2 nanospheres as a high-rate anode material for aqueous aluminium-ion batteries. Solid State Ion. 2017, 300, 32–37. [Google Scholar] [CrossRef]
- He, Y.J.; Peng, J.F.; Chu, W.; Li, Y.Z.; Tong, D.G. Black mesoporous anatase TiO2 nanoleaves: A high capacity and high rate anode for aqueous Al-ion batteries. J. Mater. Chem. A 2014, 2, 1721–1731. [Google Scholar] [CrossRef]
- Lahan, H.; Boruah, R.; Hazarika, A.; Das, S.K. Anatase TiO2 as an Anode Material for Rechargeable Aqueous Aluminum-Ion Batteries: Remarkable Graphene Induced Aluminum Ion Storage Phenomenon. J. Phys. Chem. C 2017, 121, 26241–26249. [Google Scholar] [CrossRef]
- Liu, Y.; Sang, S.; Wu, Q.; Lu, Z.; Liu, K.; Liu, H. The electrochemical behavior of Cl− assisted Al3+ insertion into titanium dioxide nanotube arrays in aqueous solution for aluminum ion batteries. Electrochim. Acta 2014, 143, 340–346. [Google Scholar] [CrossRef]
- Liu, S.; Hu, J.J.; Yan, N.F.; Pan, G.L.; Li, G.R.; Gao, X.P. Aluminum storage behavior of anatase TiO2 nanotube arrays in aqueous solution for aluminum ion batteries. Energy Environ. Sci. 2012, 5, 9743–9746. [Google Scholar] [CrossRef]
- Holland, A.W.; McKerracher, R.; Cruden, A.; Wills, R.G.A. TiO2 nanopowder as a high rate, long cycle life electrode in aqueous aluminium electrolyte. Mater. Today Energy 2018, 10, 208–213. [Google Scholar] [CrossRef]
- Wang, H.; Zhang, T.; Chen, C.; Ling, M.; Lin, Z.; Zhang, S.; Pan, F.; Liang, C. High-performance aqueous symmetric sodium-ion battery using NASICON-structured Na2VTi(PO4)3. Nano Res. 2018, 11, 490–498. [Google Scholar] [CrossRef]
- Deng, C.; Zhang, S.; Dong, Z.; Shang, Y. 1D nanostructured sodium vanadium oxide as a novel anode material for aqueous sodium ion batteries. Nano Energy 2014, 4, 49–55. [Google Scholar] [CrossRef]
- Whitacre, J.F.; Wiley, T.; Shanbhag, S.; Wenzhuo, Y.; Mohamed, A.; Chun, S.E.; Weber, E.; Blackwood, D.; Lynch-Bell, E.; Gulakowski, J.; et al. An aqueous electrolyte, sodium ion functional, large format energy storage device for stationary applications. J. Power Sources 2012, 213, 255–264. [Google Scholar] [CrossRef]
- Zhang, B.H.; Liu, Y.; Chang, Z.; Yang, Y.Q.; Wen, Z.B.; Wu, Y.P.; Holze, R. Nanowire Na0.35MnO2 from a hydrothermal method as a cathode material for aqueous asymmetric supercapacitors. J. Power Sources 2014, 253, 98–103. [Google Scholar] [CrossRef]
- Gang, P.; Ping, N.; Changzhou, Y.; Laifa, S.; Xiaogang, Z.; Jiajia, Z.; Bing, D. Enhanced Performance of Aqueous Sodium-Ion Batteries Using Electrodes Based on the NaTi2(PO4)3/MWNTs–Na0.44MnO2 System. Energy Technol. 2014, 2, 705–712. [Google Scholar]
- Liang, C.; Leyuan, Z.; Xufeng, Z.; Zhaoping, L. Aqueous Batteries Based on Mixed Monovalence Metal Ions: A New Battery Family. ChemSusChem 2014, 7, 2295–2302. [Google Scholar]
- Yao, H.-R.; You, Y.; Yin, Y.-X.; Wan, L.-J.; Guo, Y.-G. Rechargeable dual-metal-ion batteries for advanced energy storage. Phys. Chem. Chem. Phys. 2016, 18, 9326–9333. [Google Scholar] [CrossRef] [PubMed]
- Lu, K.; Song, B.; Zhang, J.; Ma, H. A rechargeable Na-Zn hybrid aqueous battery fabricated with nickel hexacyanoferrate and nanostructured zinc. J. Power Sources 2016, 321, 257–263. [Google Scholar] [CrossRef]
- Takai, O. Solution plasma processing (SPP). Pure Appl. Chem. 2008, 80, 2003. [Google Scholar] [CrossRef]
- Pitchaimuthu, S.; Honda, K.; Suzuki, S.; Naito, A.; Suzuki, N.; Katsumata, K.-I.; Nakata, K.; Ishida, N.; Kitamura, N.; Idemoto, Y.; et al. Solution Plasma Process-Derived Defect-Induced Heterophase Anatase/Brookite TiO2 Nanocrystals for Enhanced Gaseous Photocatalytic Performance. ACS Omega 2018, 3, 898–905. [Google Scholar] [CrossRef]
- Chen, X.; Liu, L.; Huang, F. Black titanium dioxide (TiO2) nanomaterials. Chem. Soc. Rev. 2015, 44, 1861–1885. [Google Scholar] [CrossRef] [PubMed]
- Lu, X.; Wang, G.; Zhai, T.; Yu, M.; Gan, J.; Tong, Y.; Li, Y. Hydrogenated TiO2 Nanotube Arrays for Supercapacitors. Nano Lett. 2012, 12, 1690–1696. [Google Scholar] [CrossRef] [PubMed]
- Qiu, J.; Li, S.; Gray, E.; Liu, H.; Gu, Q.-F.; Sun, C.; Lai, C.; Zhao, H.; Zhang, S. Hydrogenation Synthesis of Blue TiO2 for High-Performance Lithium-Ion Batteries. J. Phys. Chem. C 2014, 118, 8824–8830. [Google Scholar] [CrossRef]
- Shin, J.-Y.; Joo, J.H.; Samuelis, D.; Maier, J. Oxygen-Deficient TiO2−δ Nanoparticles via Hydrogen Reduction for High Rate Capability Lithium Batteries. Chem. Mater. 2012, 24, 543–551. [Google Scholar] [CrossRef]
- He, H.; Yang, K.; Wang, N.; Luo, F.; Chen, H. Hydrogenated TiO2 film for enhancing photovoltaic properties of solar cells and self-sensitized effect. J. Appl. Phys. 2013, 114, 213505. [Google Scholar] [CrossRef]
- Song, J.; Zheng, M.; Yuan, X.; Li, Q.; Wang, F.; Ma, L.; You, Y.; Liu, S.; Liu, P.; Jiang, D.; et al. Electrochemically induced Ti3+ self-doping of TiO2 nanotube arrays for improved photoelectrochemical water splitting. J. Mater. Sci. 2017, 52, 6976–6986. [Google Scholar] [CrossRef]
- Zhou, H.; Zhang, Y. Electrochemically Self-Doped TiO2 Nanotube Arrays for Supercapacitors. J. Phys. Chem. C 2014, 118, 5626–5636. [Google Scholar] [CrossRef]
- Nah, Y.-C.; Paramasivam, I.; Schmuki, P. Doped TiO2 and TiO2 Nanotubes: Synthesis and Applications. ChemPhysChem 2010, 11, 2698–2713. [Google Scholar] [CrossRef] [PubMed]
- Zhou, Y.; Chen, C.; Wang, N.; Li, Y.; Ding, H. Stable Ti3+ Self-Doped Anatase-Rutile Mixed TiO2 with Enhanced Visible Light Utilization and Durability. J. Phys. Chem. C 2016, 120, 6116–6124. [Google Scholar] [CrossRef]
- Lu, H.; Zhao, B.; Pan, R.; Yao, J.; Qiu, J.; Luo, L.; Liu, Y. Safe and facile hydrogenation of commercial Degussa P25 at room temperature with enhanced photocatalytic activity. RSC Adv. 2014, 4, 1128–1132. [Google Scholar] [CrossRef]
- Leshuk, T.; Parviz, R.; Everett, P.; Krishnakumar, H.; Varin, R.A.; Gu, F. Photocatalytic Activity of Hydrogenated TiO2. ACS Appl. Mater. Interfaces 2013, 5, 1892–1895. [Google Scholar] [CrossRef] [PubMed]
- Ren, R.; Wen, Z.; Cui, S.; Hou, Y.; Guo, X.; Chen, J. Controllable Synthesis and Tunable Photocatalytic Properties of Ti3+-doped TiO2. Sci. Rep. 2015, 5, 10714. [Google Scholar] [CrossRef] [PubMed]
- Wang, W.; Ni, Y.; Lu, C.; Xu, Z. Hydrogenation temperature related inner structures and visible-light-driven photocatalysis of N–F co-doped TiO2 nanosheets. Appl. Surf. Sci. 2014, 290, 125–130. [Google Scholar] [CrossRef]
- Gelderman, K.; Lee, L.; Donne, S.W. Flat-Band Potential of a Semiconductor: Using the Mott–Schottky Equation. J. Chem. Educ. 2007, 84, 685. [Google Scholar] [CrossRef]
- Sellers, M.C.K.; Seebauer, E.G. Measurement method for carrier concentration in TiO2 via the Mott–Schottky approach. Thin Solid Films 2011, 519, 2103–2110. [Google Scholar] [CrossRef]
- Yadav, P.; Pandey, K.; Bhatt, P.; Tripathi, B.; Pandey, M.K.; Kumar, M. Probing the electrochemical properties of TiO2/graphene composite by cyclic voltammetry and impedance spectroscopy. Mater. Sci. Eng. B 2016, 206, 22–29. [Google Scholar] [CrossRef]
Figure 1.
(a) Electrochemical reduction of TiO2 in 1 mol/dm3 KOH through a potentiostatic hold at −1.4 V vs. saturated calomel reference electrode (SCE); (b) XRD pattern from a TiO2 (bottom) and treated-TiO2 electrode (top).
Figure 1.
(a) Electrochemical reduction of TiO2 in 1 mol/dm3 KOH through a potentiostatic hold at −1.4 V vs. saturated calomel reference electrode (SCE); (b) XRD pattern from a TiO2 (bottom) and treated-TiO2 electrode (top).
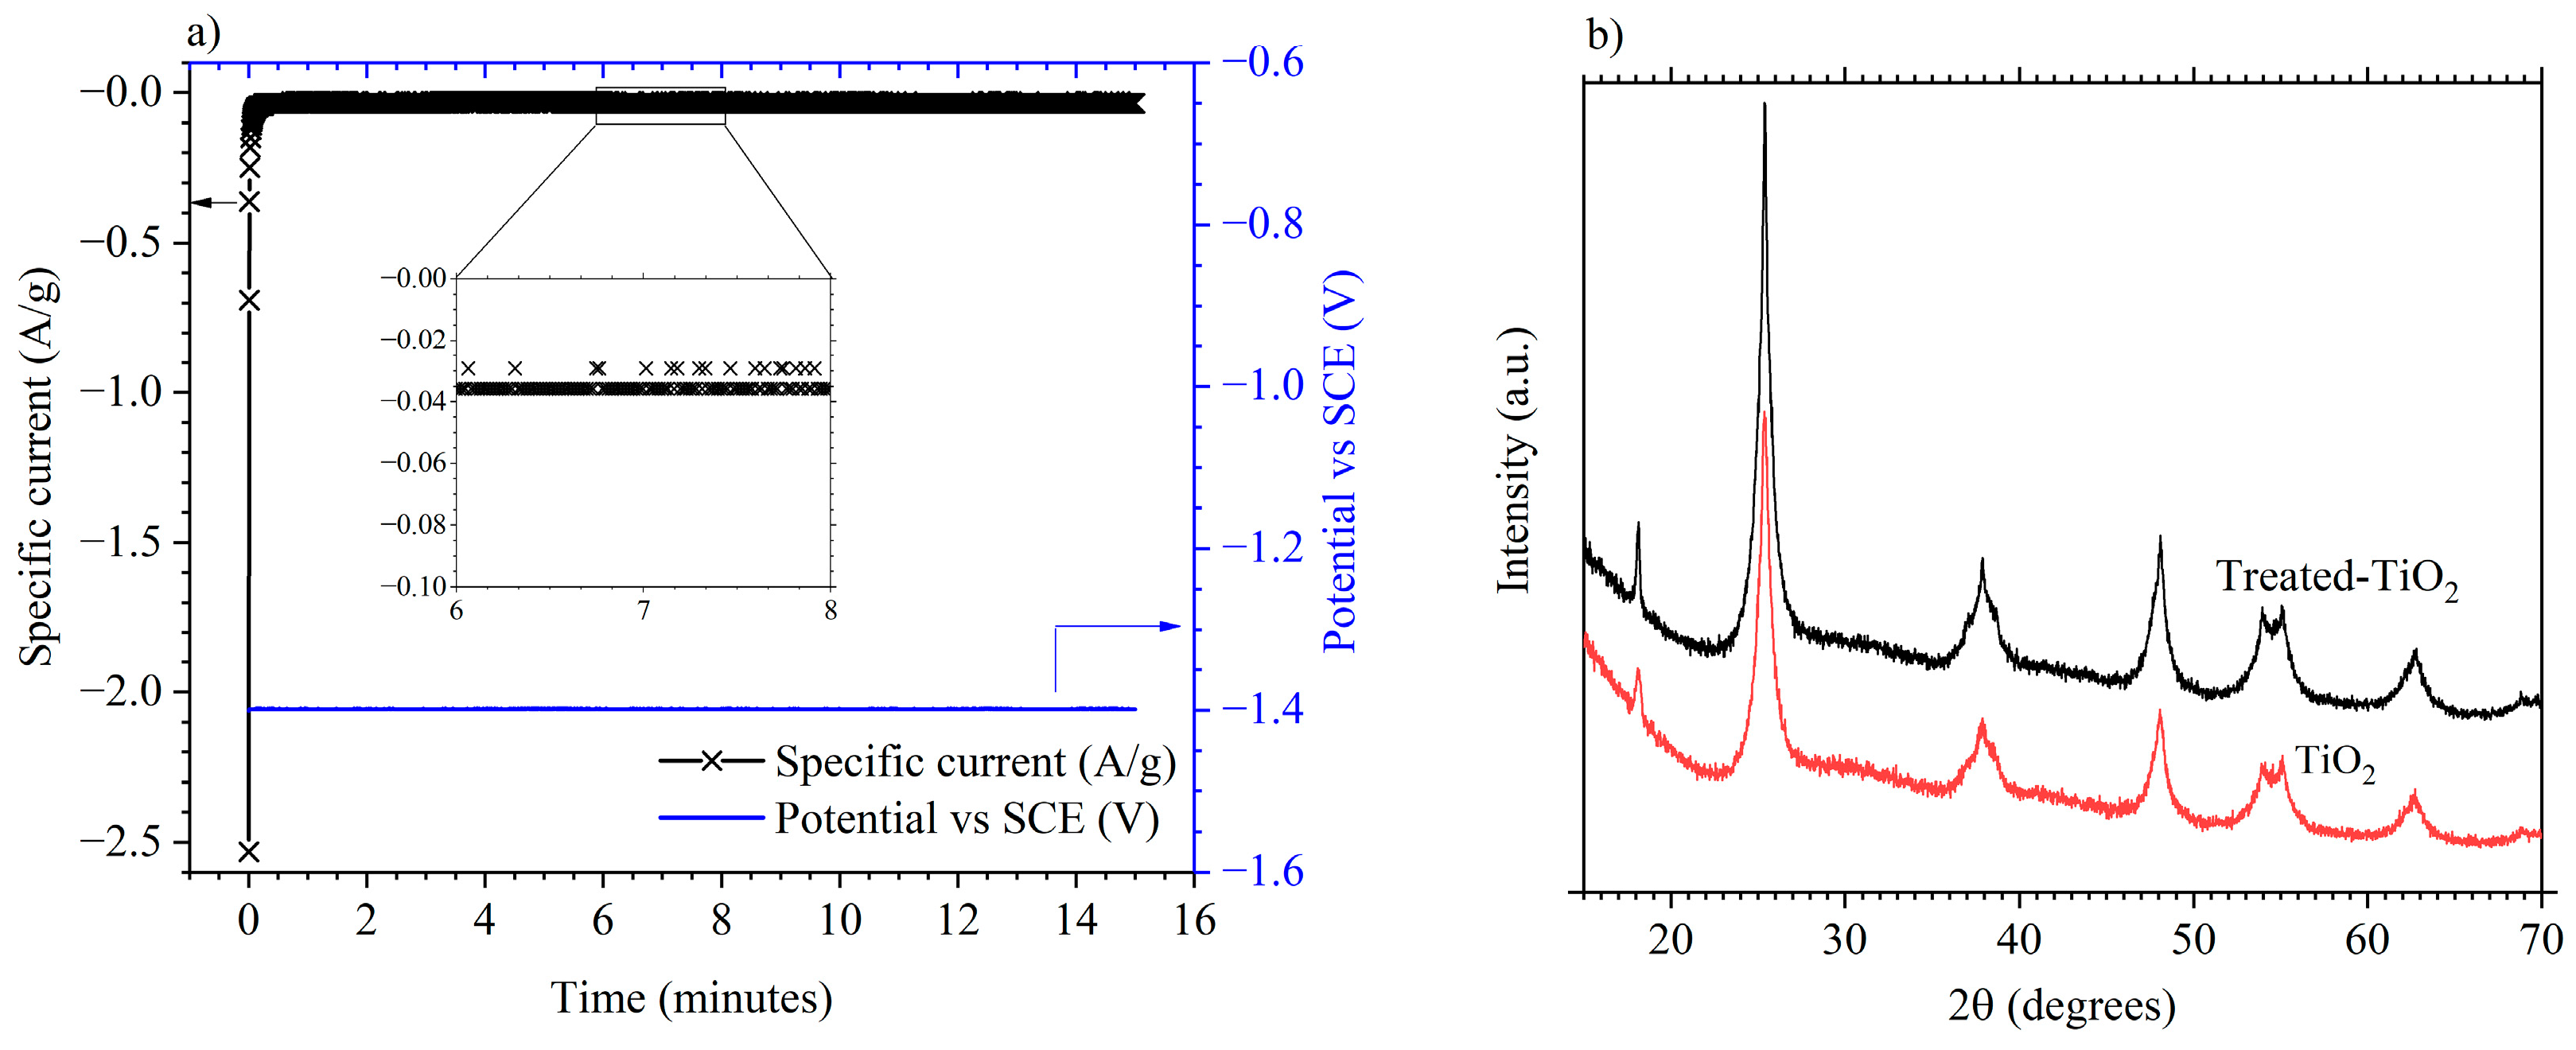
Figure 2.
(a,b) present SEM images of a TiO2 electrode at 1000× and 4,0000× magnification; (c,d) show images from a treated-TiO2 electrode. (e) shows a photographic image of a TiO2 (left) and treated-TiO2 (right) electrode.
Figure 2.
(a,b) present SEM images of a TiO2 electrode at 1000× and 4,0000× magnification; (c,d) show images from a treated-TiO2 electrode. (e) shows a photographic image of a TiO2 (left) and treated-TiO2 (right) electrode.
Figure 3.
High resolution Ti 2p spectra of TiO2 (a) and treated-TiO2 (b) Original measurements given in red with brown denoting the sum of the fitted curves.
Figure 3.
High resolution Ti 2p spectra of TiO2 (a) and treated-TiO2 (b) Original measurements given in red with brown denoting the sum of the fitted curves.
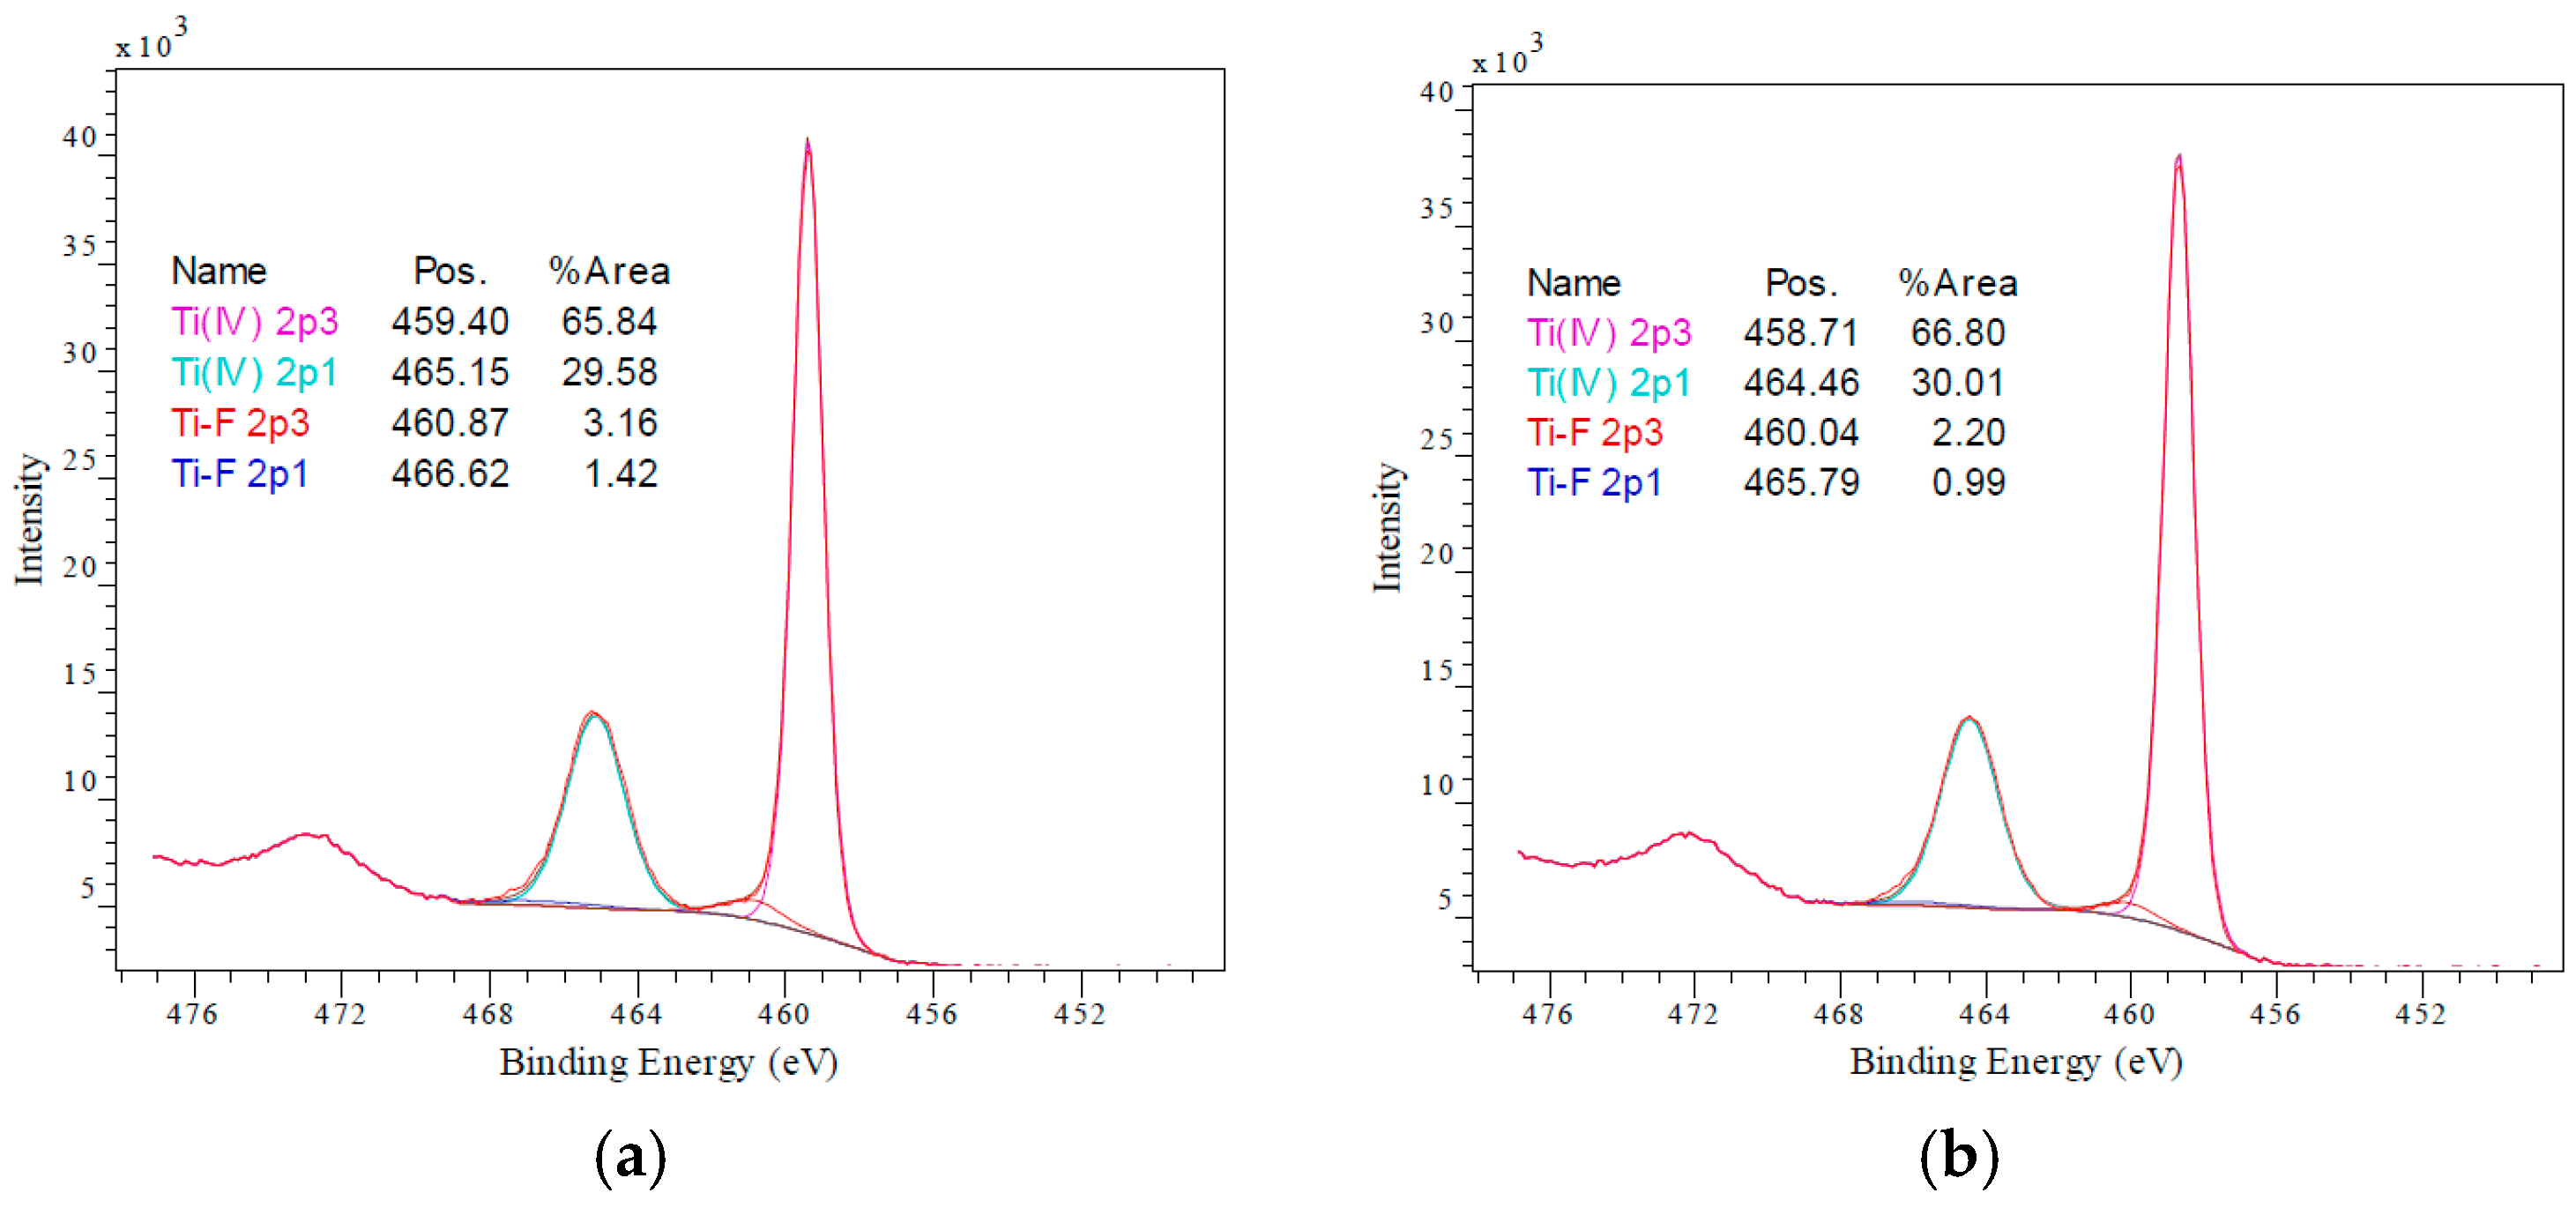
Figure 4.
(a) Mott–Schottky plots of treated-TiO2 and TiO2 at 5 kHz in 1 mol·dm−3 AlCl3/1 mol·dm−3 KCl; (b) Mott–Schottky plots of the treated TiO2 electrode at 2, 5 and 10 kHz.
Figure 4.
(a) Mott–Schottky plots of treated-TiO2 and TiO2 at 5 kHz in 1 mol·dm−3 AlCl3/1 mol·dm−3 KCl; (b) Mott–Schottky plots of the treated TiO2 electrode at 2, 5 and 10 kHz.
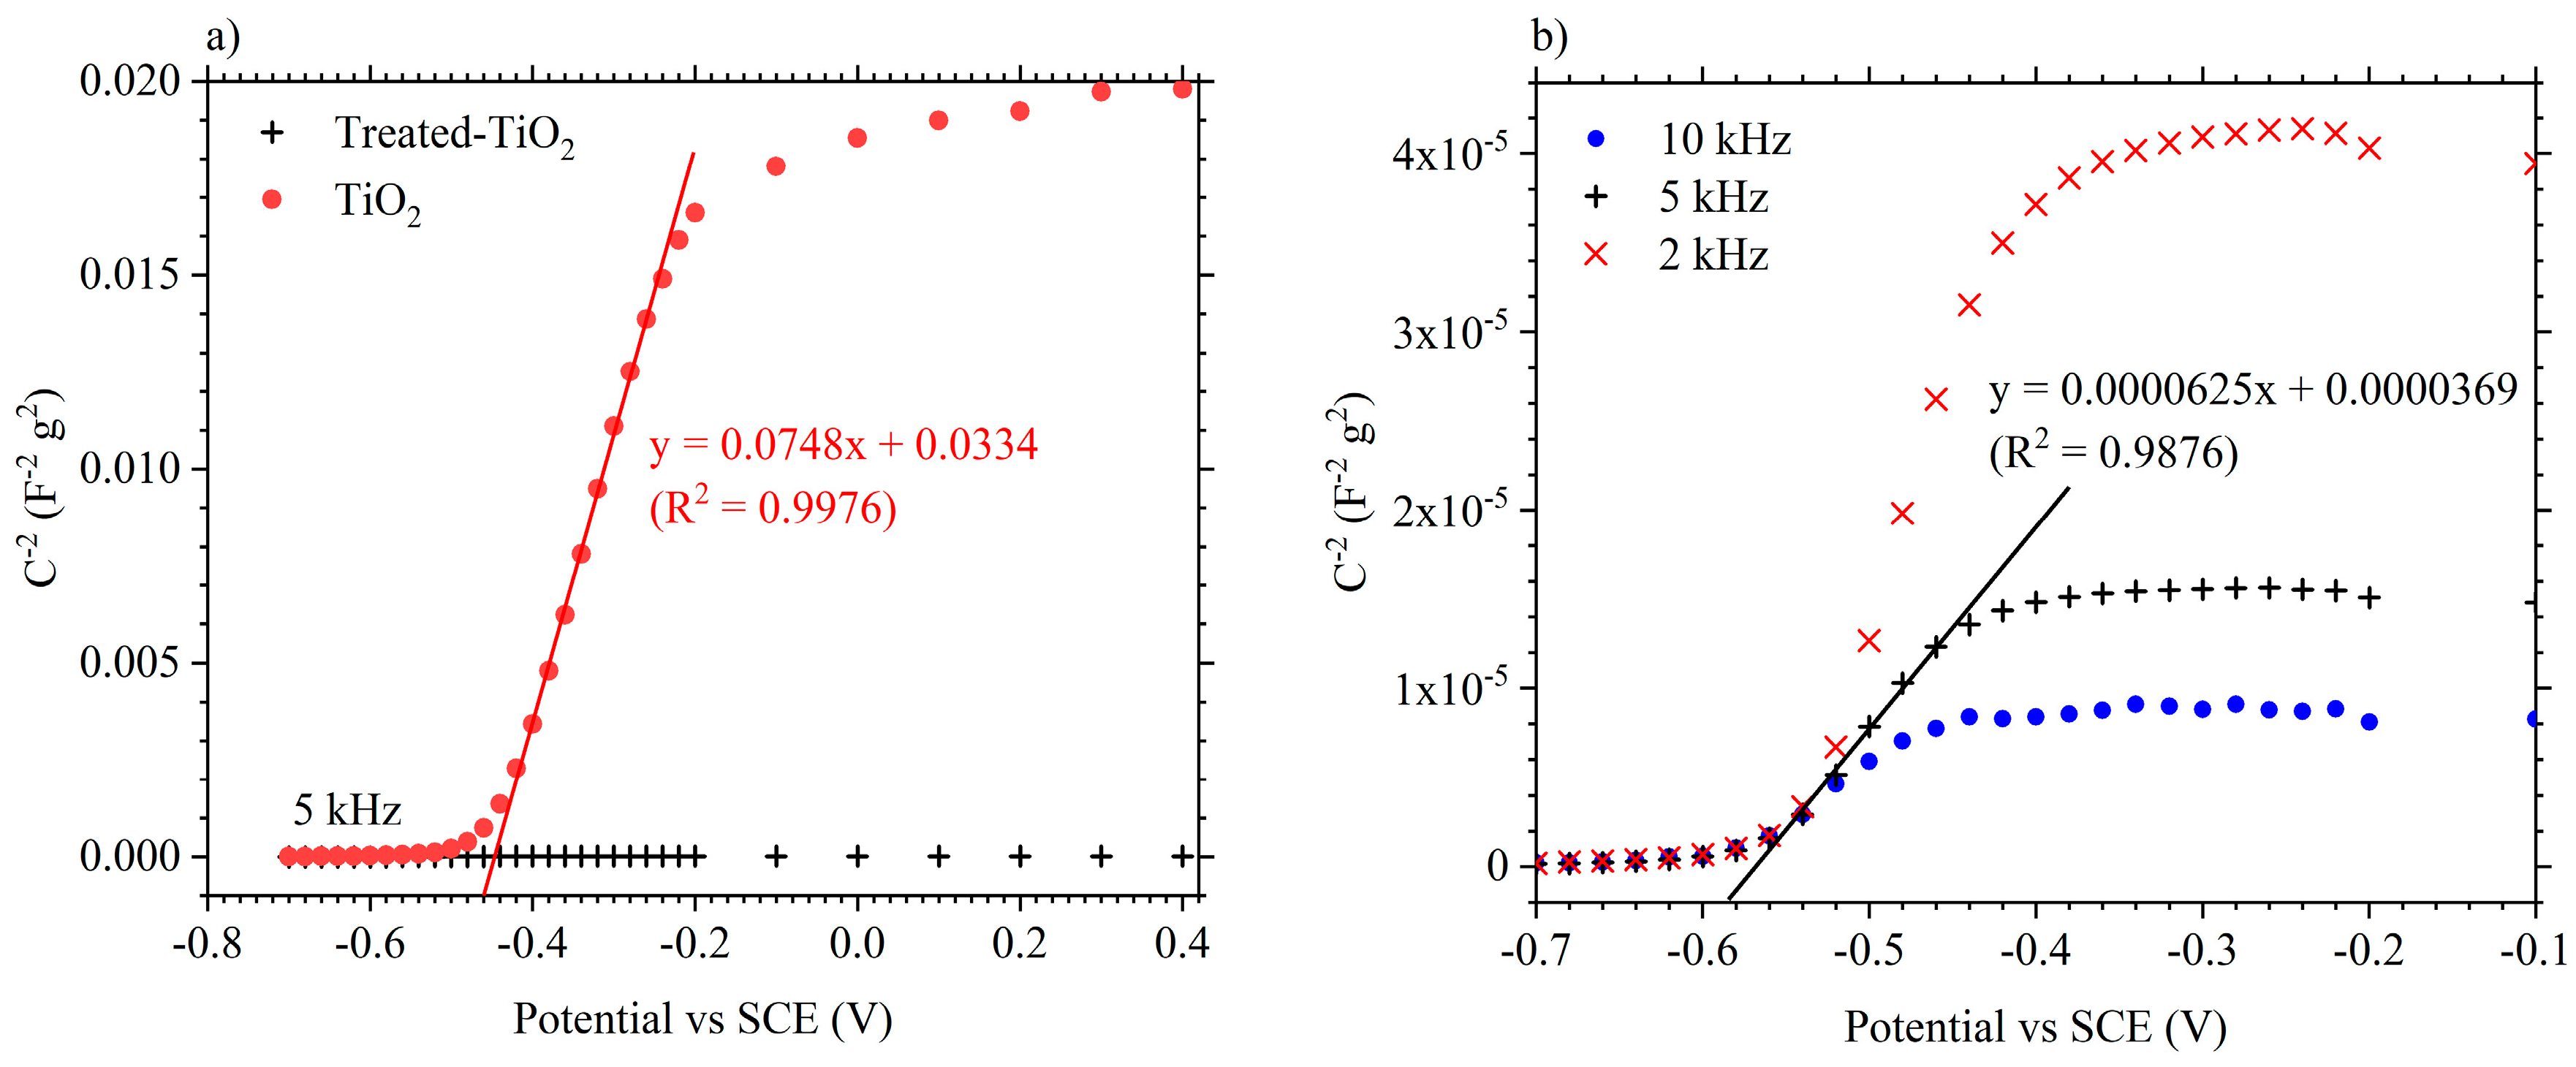
Figure 5.
Discharge capacity (a) and coulombic efficiency (b) of a treated-TiO2 (black cross) and TiO2 electrode (red circle), at various specific currents, plotted against cycle number; (c) Compares the discharge capacity and (d) the coulombic efficiency at each specific current. Electrodes were cycled in 1 mol·dm−3 AlCl3/1 mol·dm−3 KCl between −1 V and +0.4 V vs. SCE.
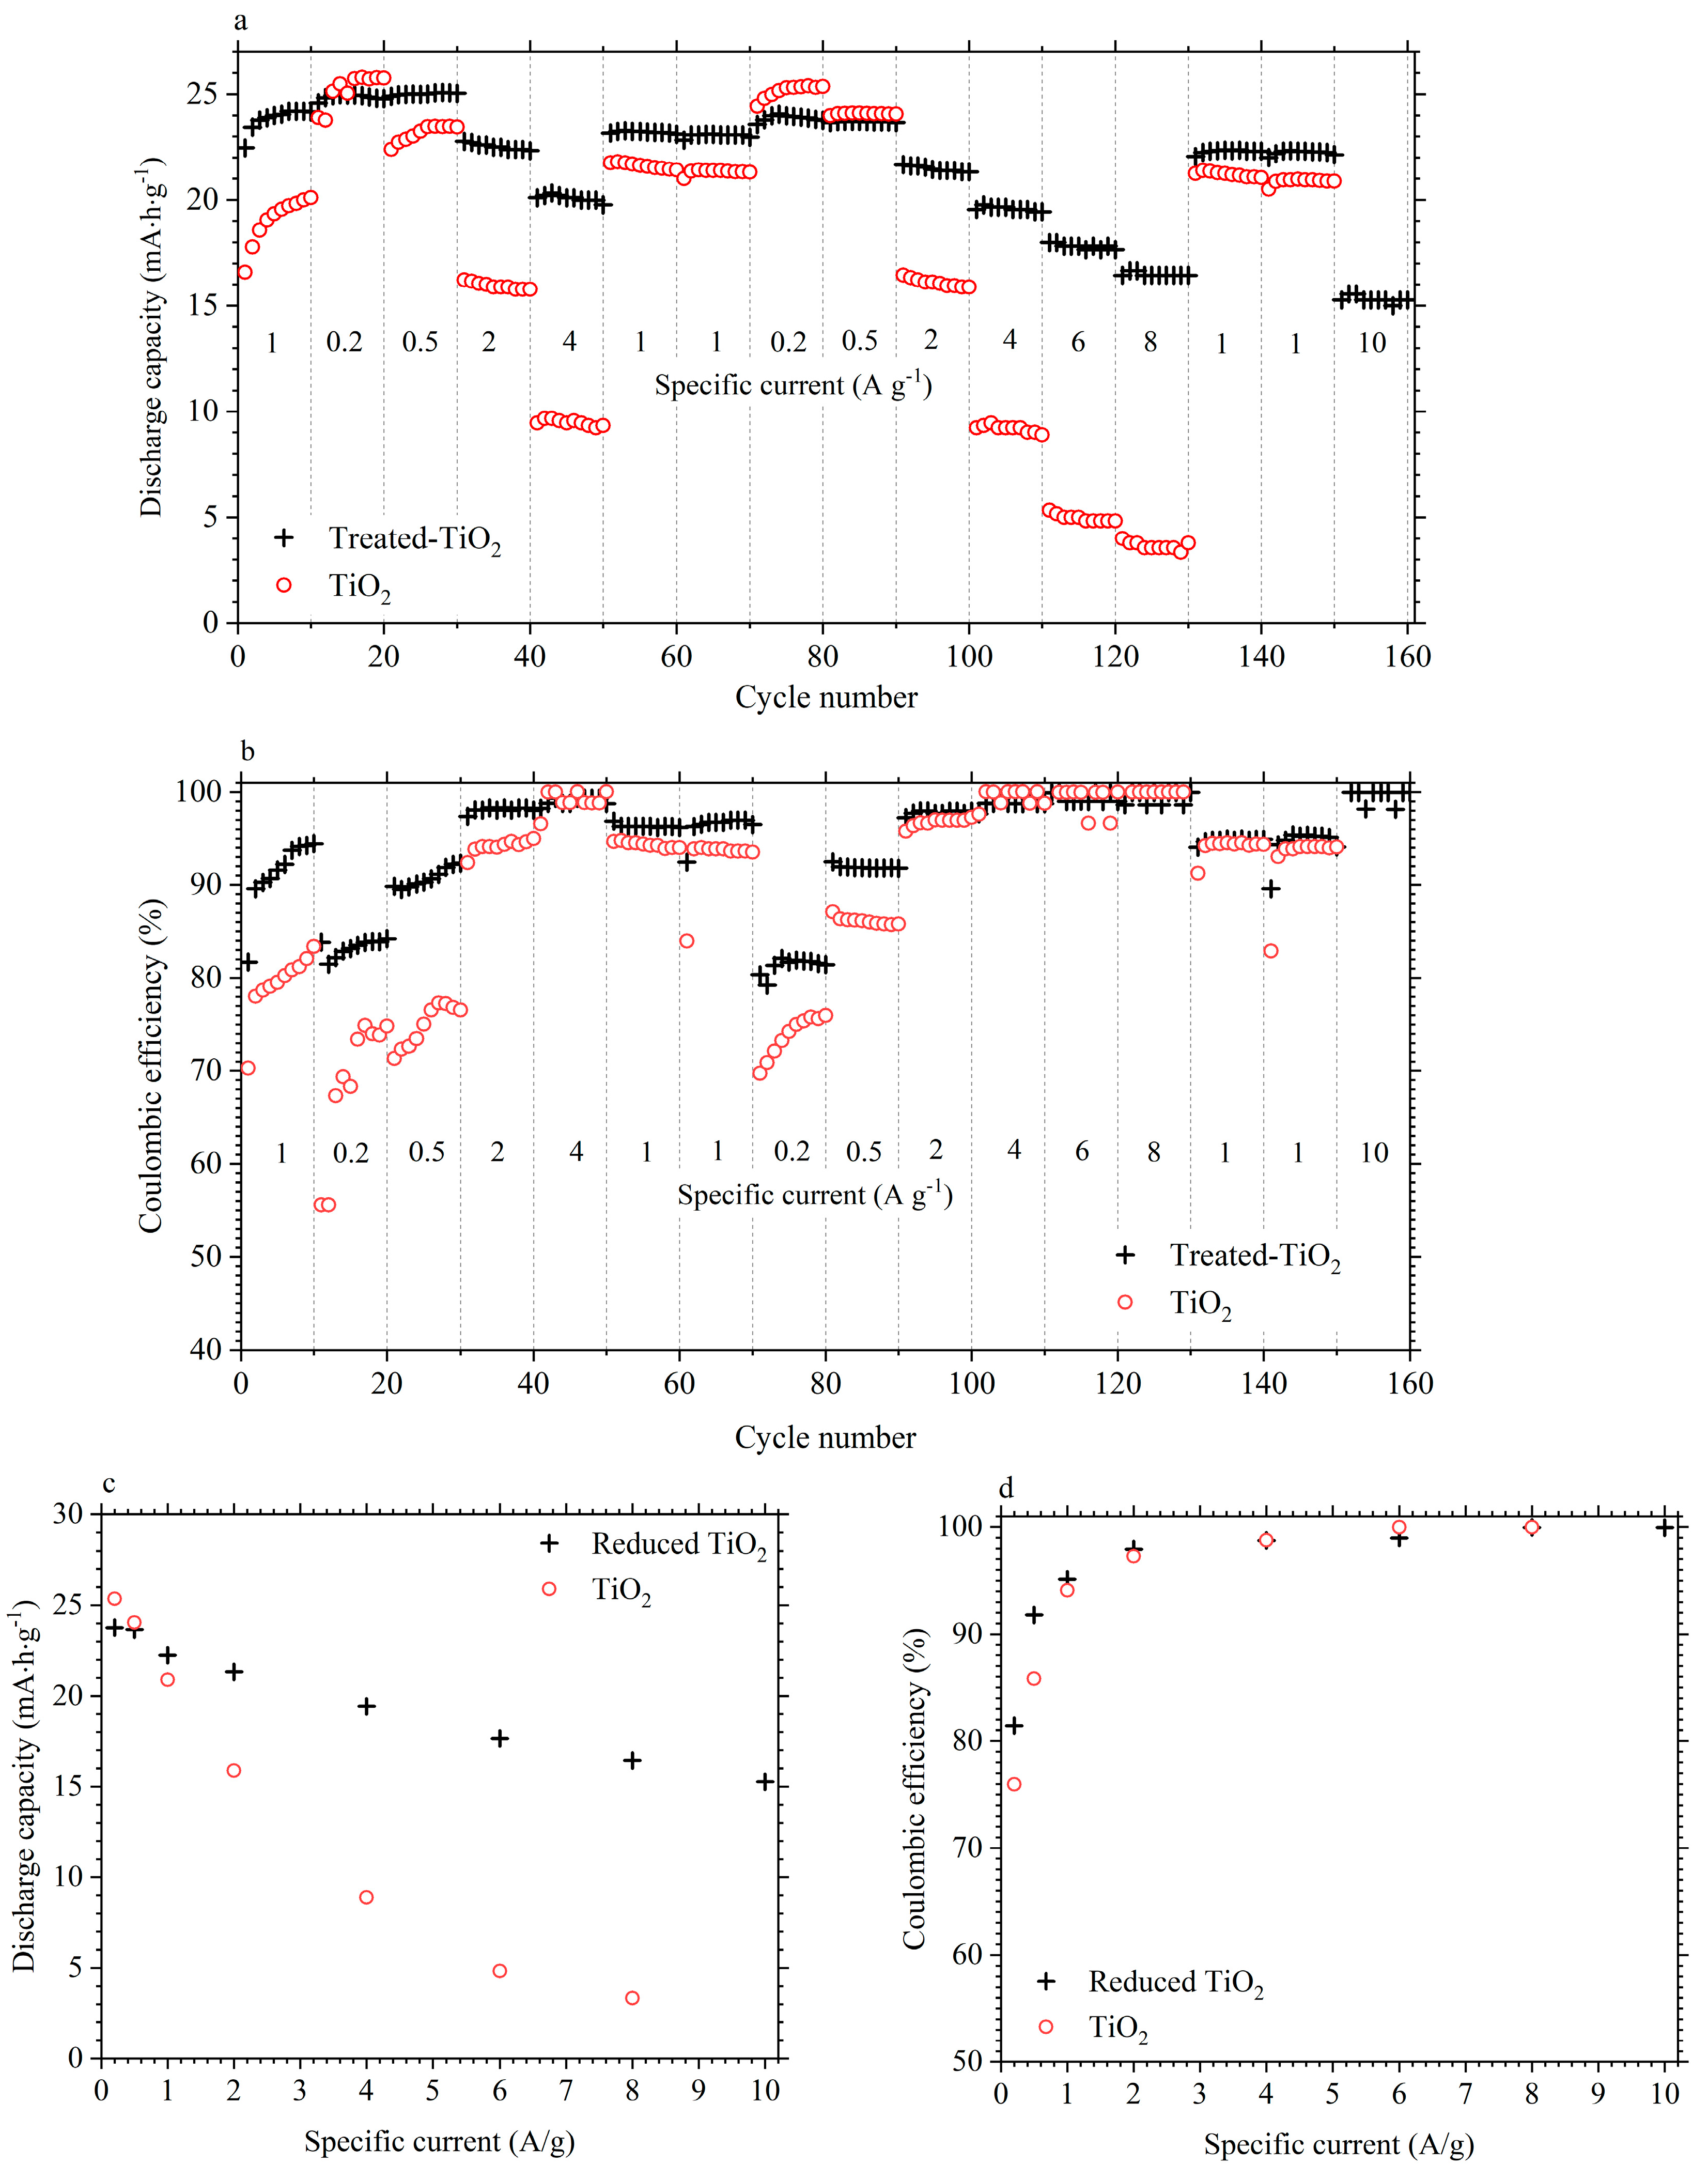
Figure 6.
Voltage profile of the treated-TiO2 (a) and TiO2 (b) electrode during cycling at 1 A/g in 1 mol·dm−3 AlCl3/1 mol·dm−3 KCl at cycles 1, 10 and 60.
Figure 6.
Voltage profile of the treated-TiO2 (a) and TiO2 (b) electrode during cycling at 1 A/g in 1 mol·dm−3 AlCl3/1 mol·dm−3 KCl at cycles 1, 10 and 60.
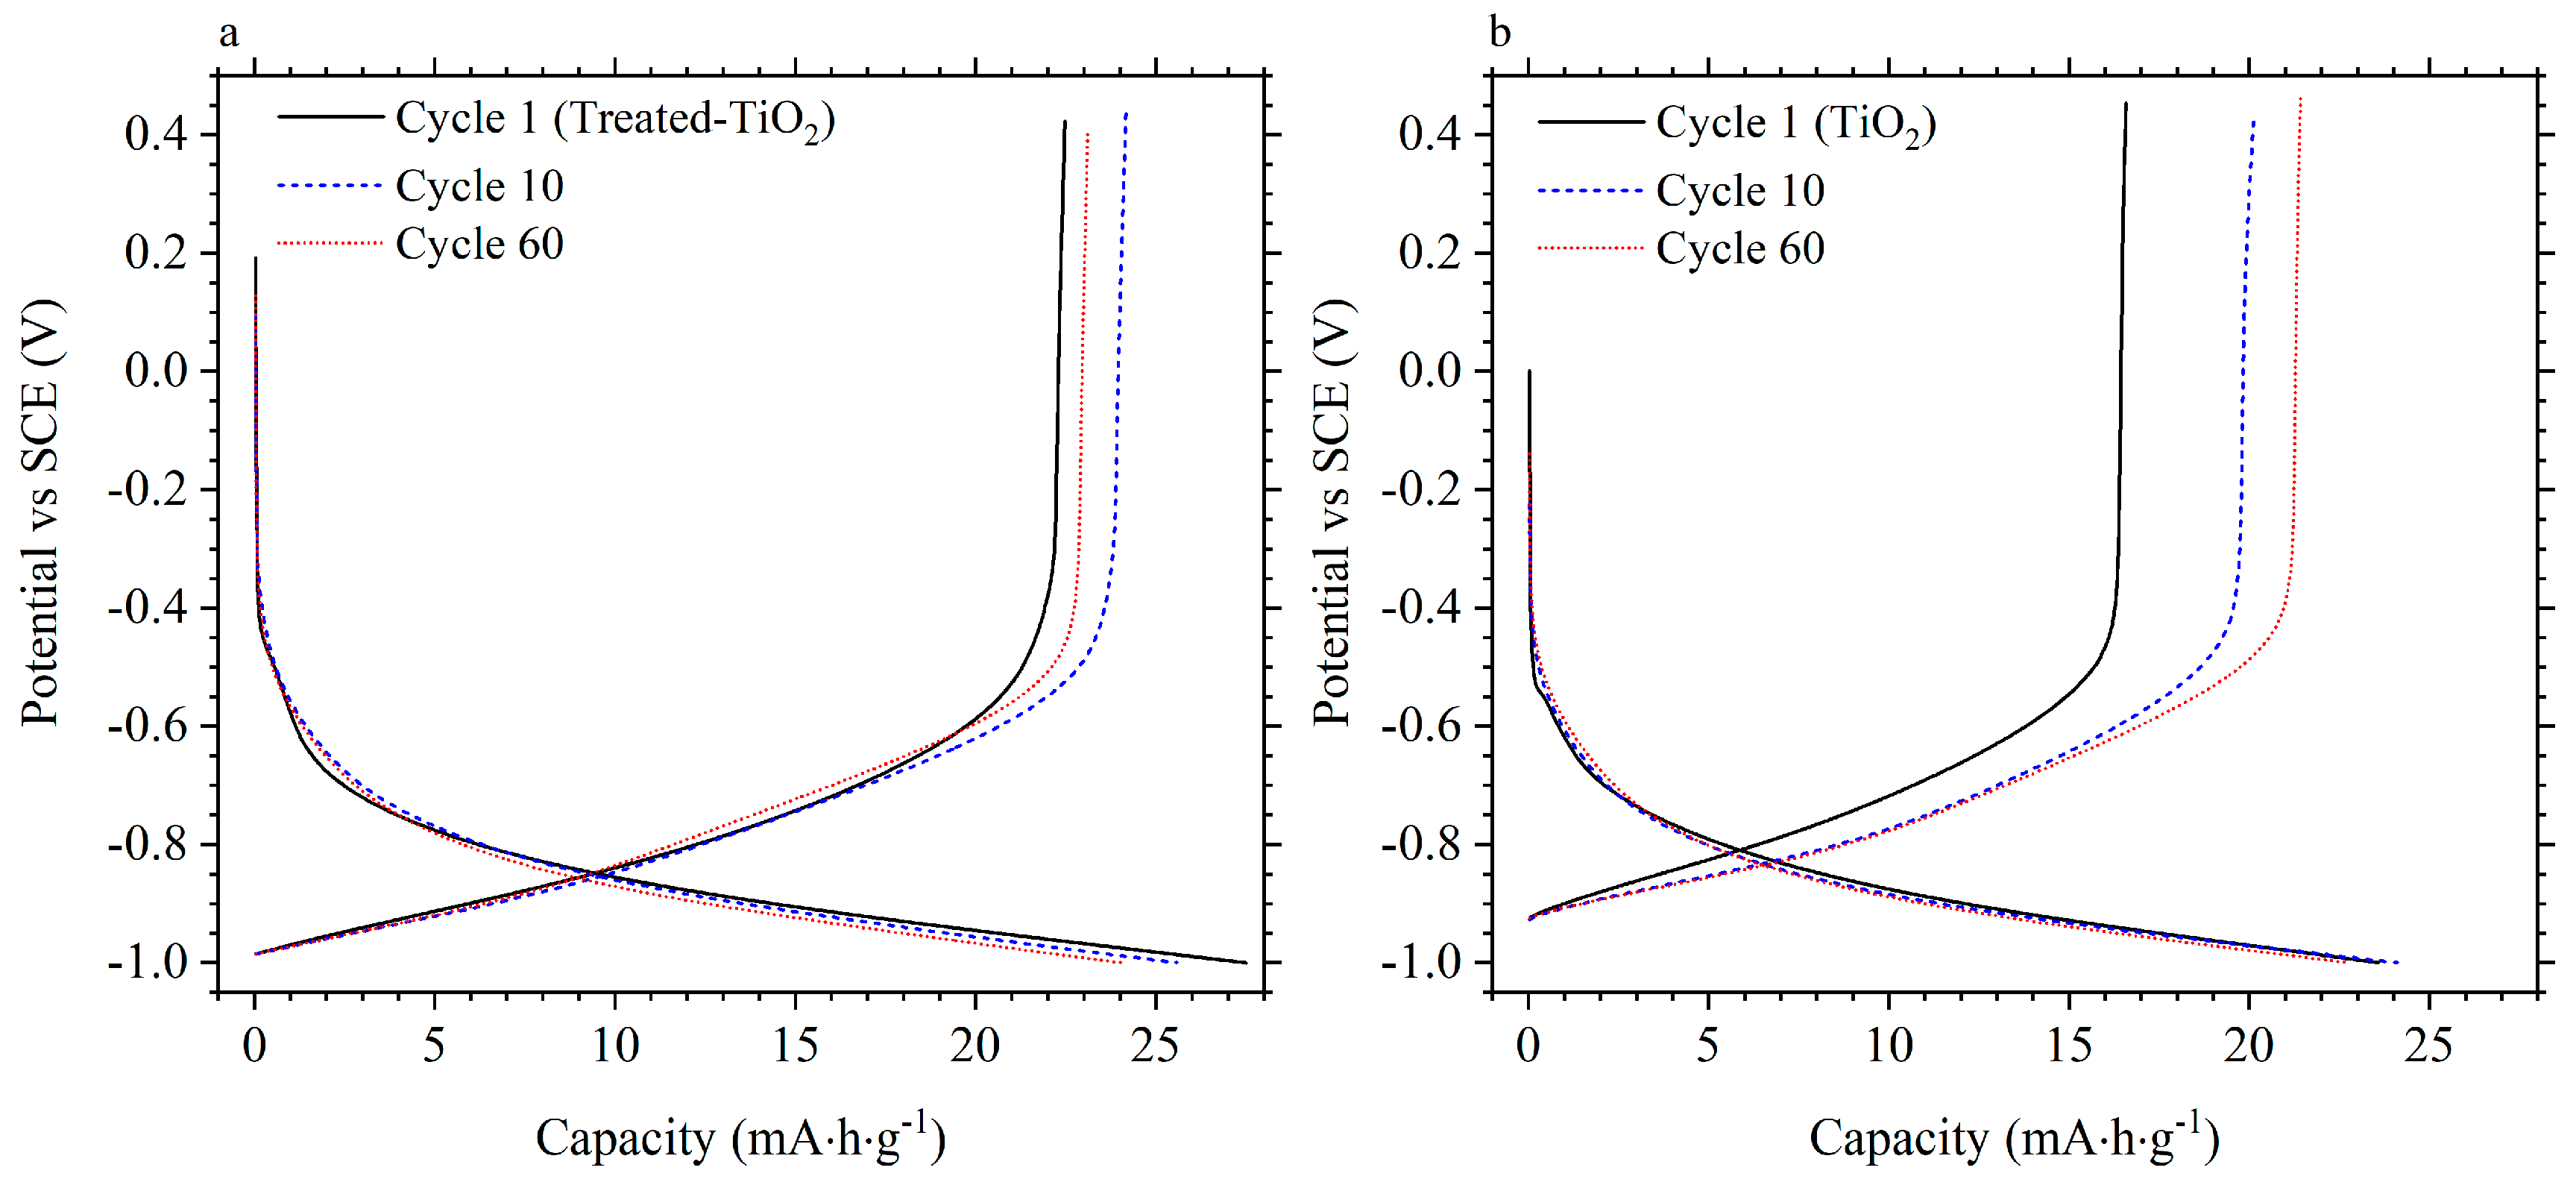
Figure 7.
(a) Comparison of IR-drop, between charge and discharge, for treated-TiO2 (black cross) and TiO2 (red circle) as a function of specific current; (b) Nyquist plot of a TiO2 (dash-dot line) and treated-TiO2 (solid line) electrode. Measurements were taken between 0.1 Hz–10 kHz, at open circuit potential (OCP), after charging to −0.8 V (black) and −0.9 V (blue) vs. SCE.
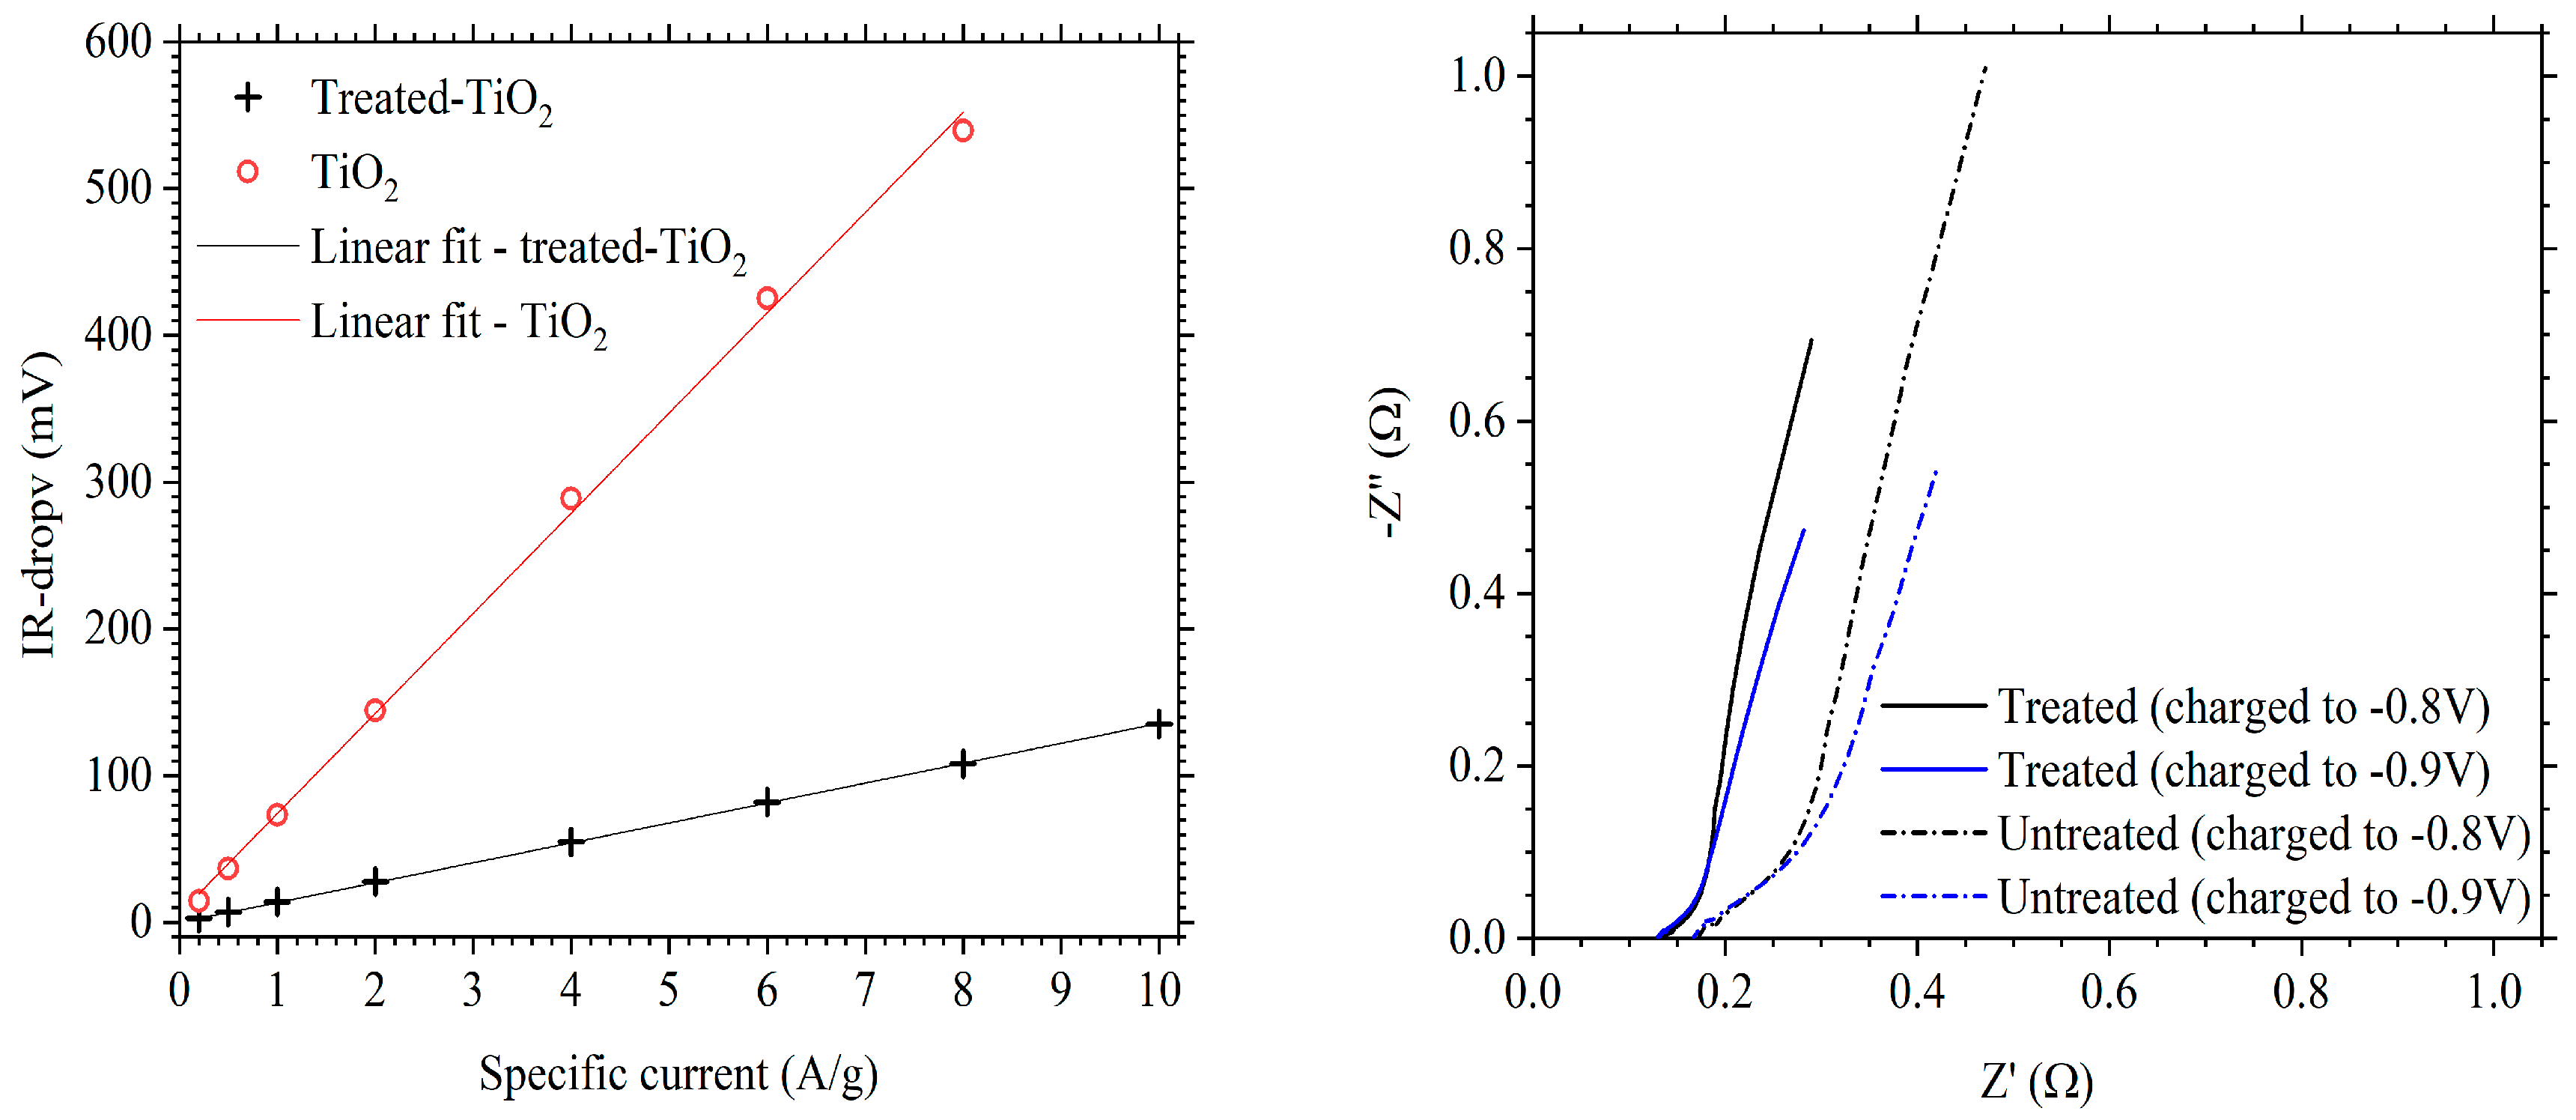
Figure 8.
Voltage profiles of TiO2 (blue-dash) and treated-TiO2 (black) cycled to −1.1 V vs. SCE at 1.0 A/g.
Figure 8.
Voltage profiles of TiO2 (blue-dash) and treated-TiO2 (black) cycled to −1.1 V vs. SCE at 1.0 A/g.
© 2018 by the authors. Licensee MDPI, Basel, Switzerland. This article is an open access article distributed under the terms and conditions of the Creative Commons Attribution (CC BY) license (http://creativecommons.org/licenses/by/4.0/).
Share and Cite
MDPI and ACS Style
Holland, A.; McKerracher, R.; Cruden, A.; Wills, R. Electrochemically Treated TiO2 for Enhanced Performance in Aqueous Al-Ion Batteries. Materials 2018, 11, 2090. https://doi.org/10.3390/ma11112090
AMA Style
Holland A, McKerracher R, Cruden A, Wills R. Electrochemically Treated TiO2 for Enhanced Performance in Aqueous Al-Ion Batteries. Materials. 2018; 11(11):2090. https://doi.org/10.3390/ma11112090
Chicago/Turabian StyleHolland, Alexander, Rachel McKerracher, Andrew Cruden, and Richard Wills. 2018. "Electrochemically Treated TiO2 for Enhanced Performance in Aqueous Al-Ion Batteries" Materials 11, no. 11: 2090. https://doi.org/10.3390/ma11112090
Note that from the first issue of 2016, this journal uses article numbers instead of page numbers. See further details here.