1. Introduction
The direct reduction (DR) of iron ore, usually followed by electric arc steelmaking, is an alternative route to the standard, blast furnace, basic oxygen route for making steel. Annual DR iron production (86 Mt in 2017) remains small, compared to the production of 1180 Mt of blast furnace pig iron [
1]. However, an attractive feature of DR, compared to blast furnace reduction, is its considerably lower CO
2 emissions, which are 40 to 60% lower for the DR-electric arc furnace route, compared to the blast furnace, basic oxygen route [
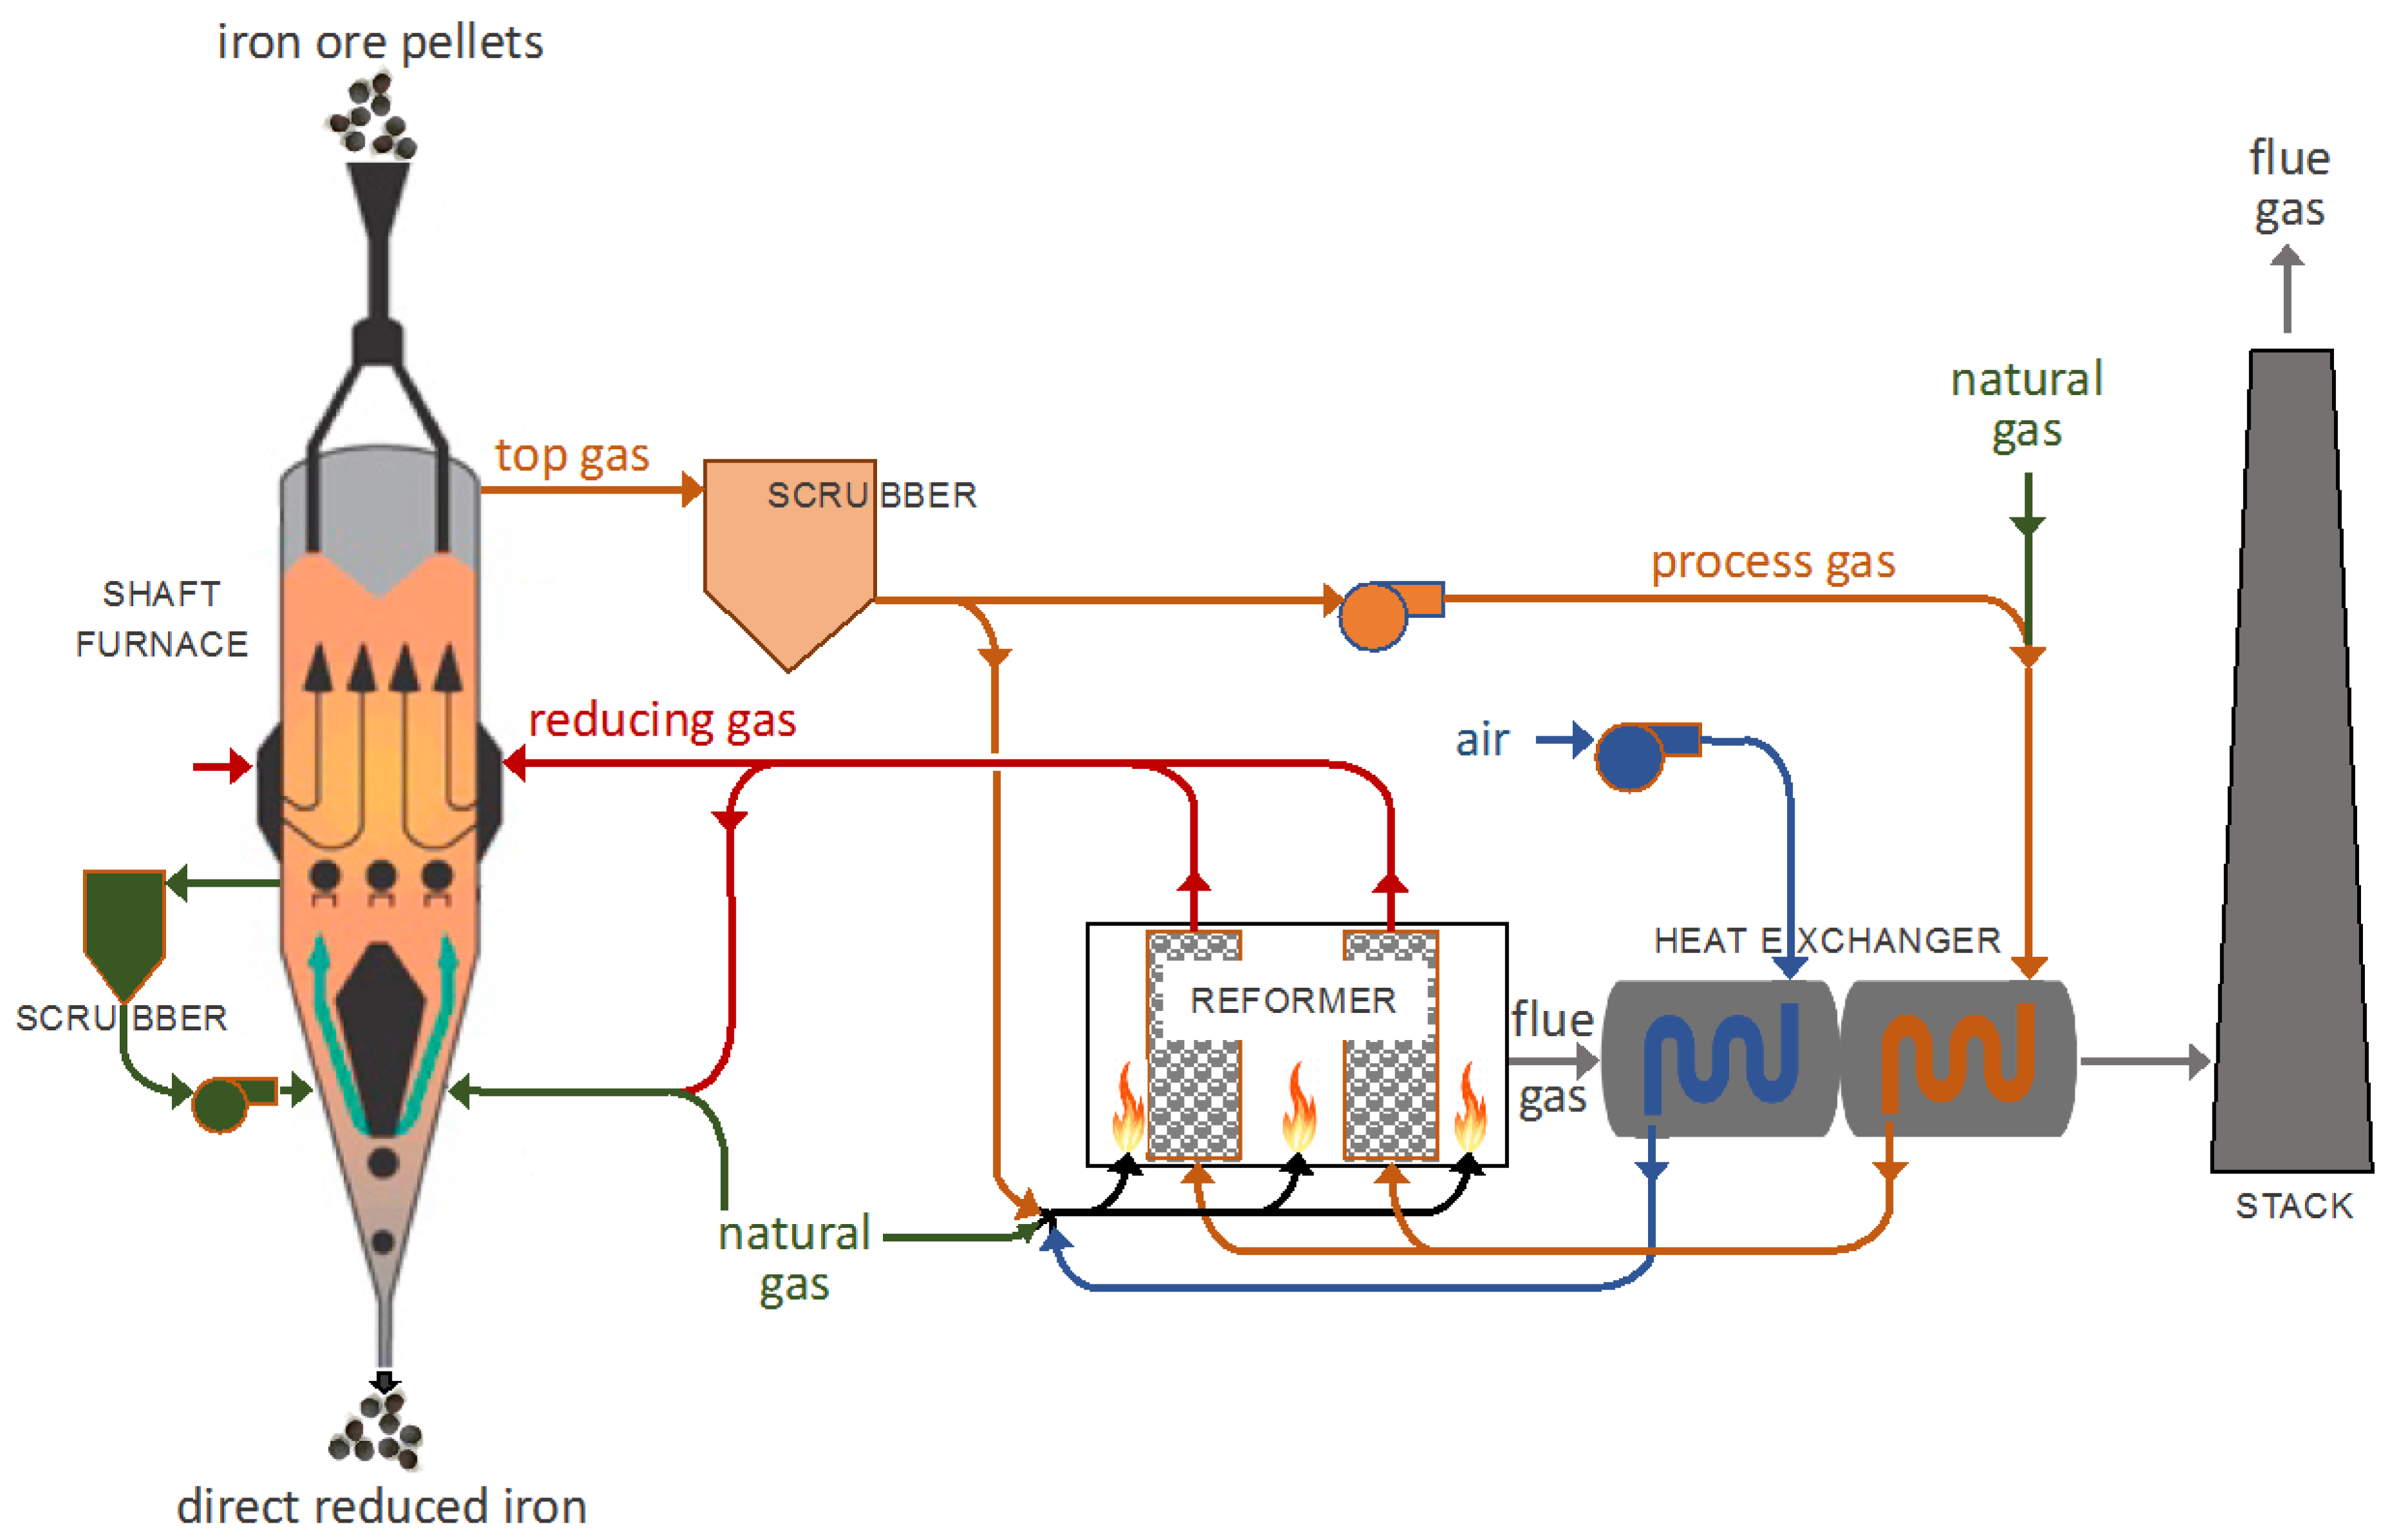
2]. Among DR processes, shaft furnaces represent over 82% of the world’s DR iron production, with the two main processes being MIDREX (65%), as shown in
Figure 1, and HYL-ENERGIRON (17%) [
3].
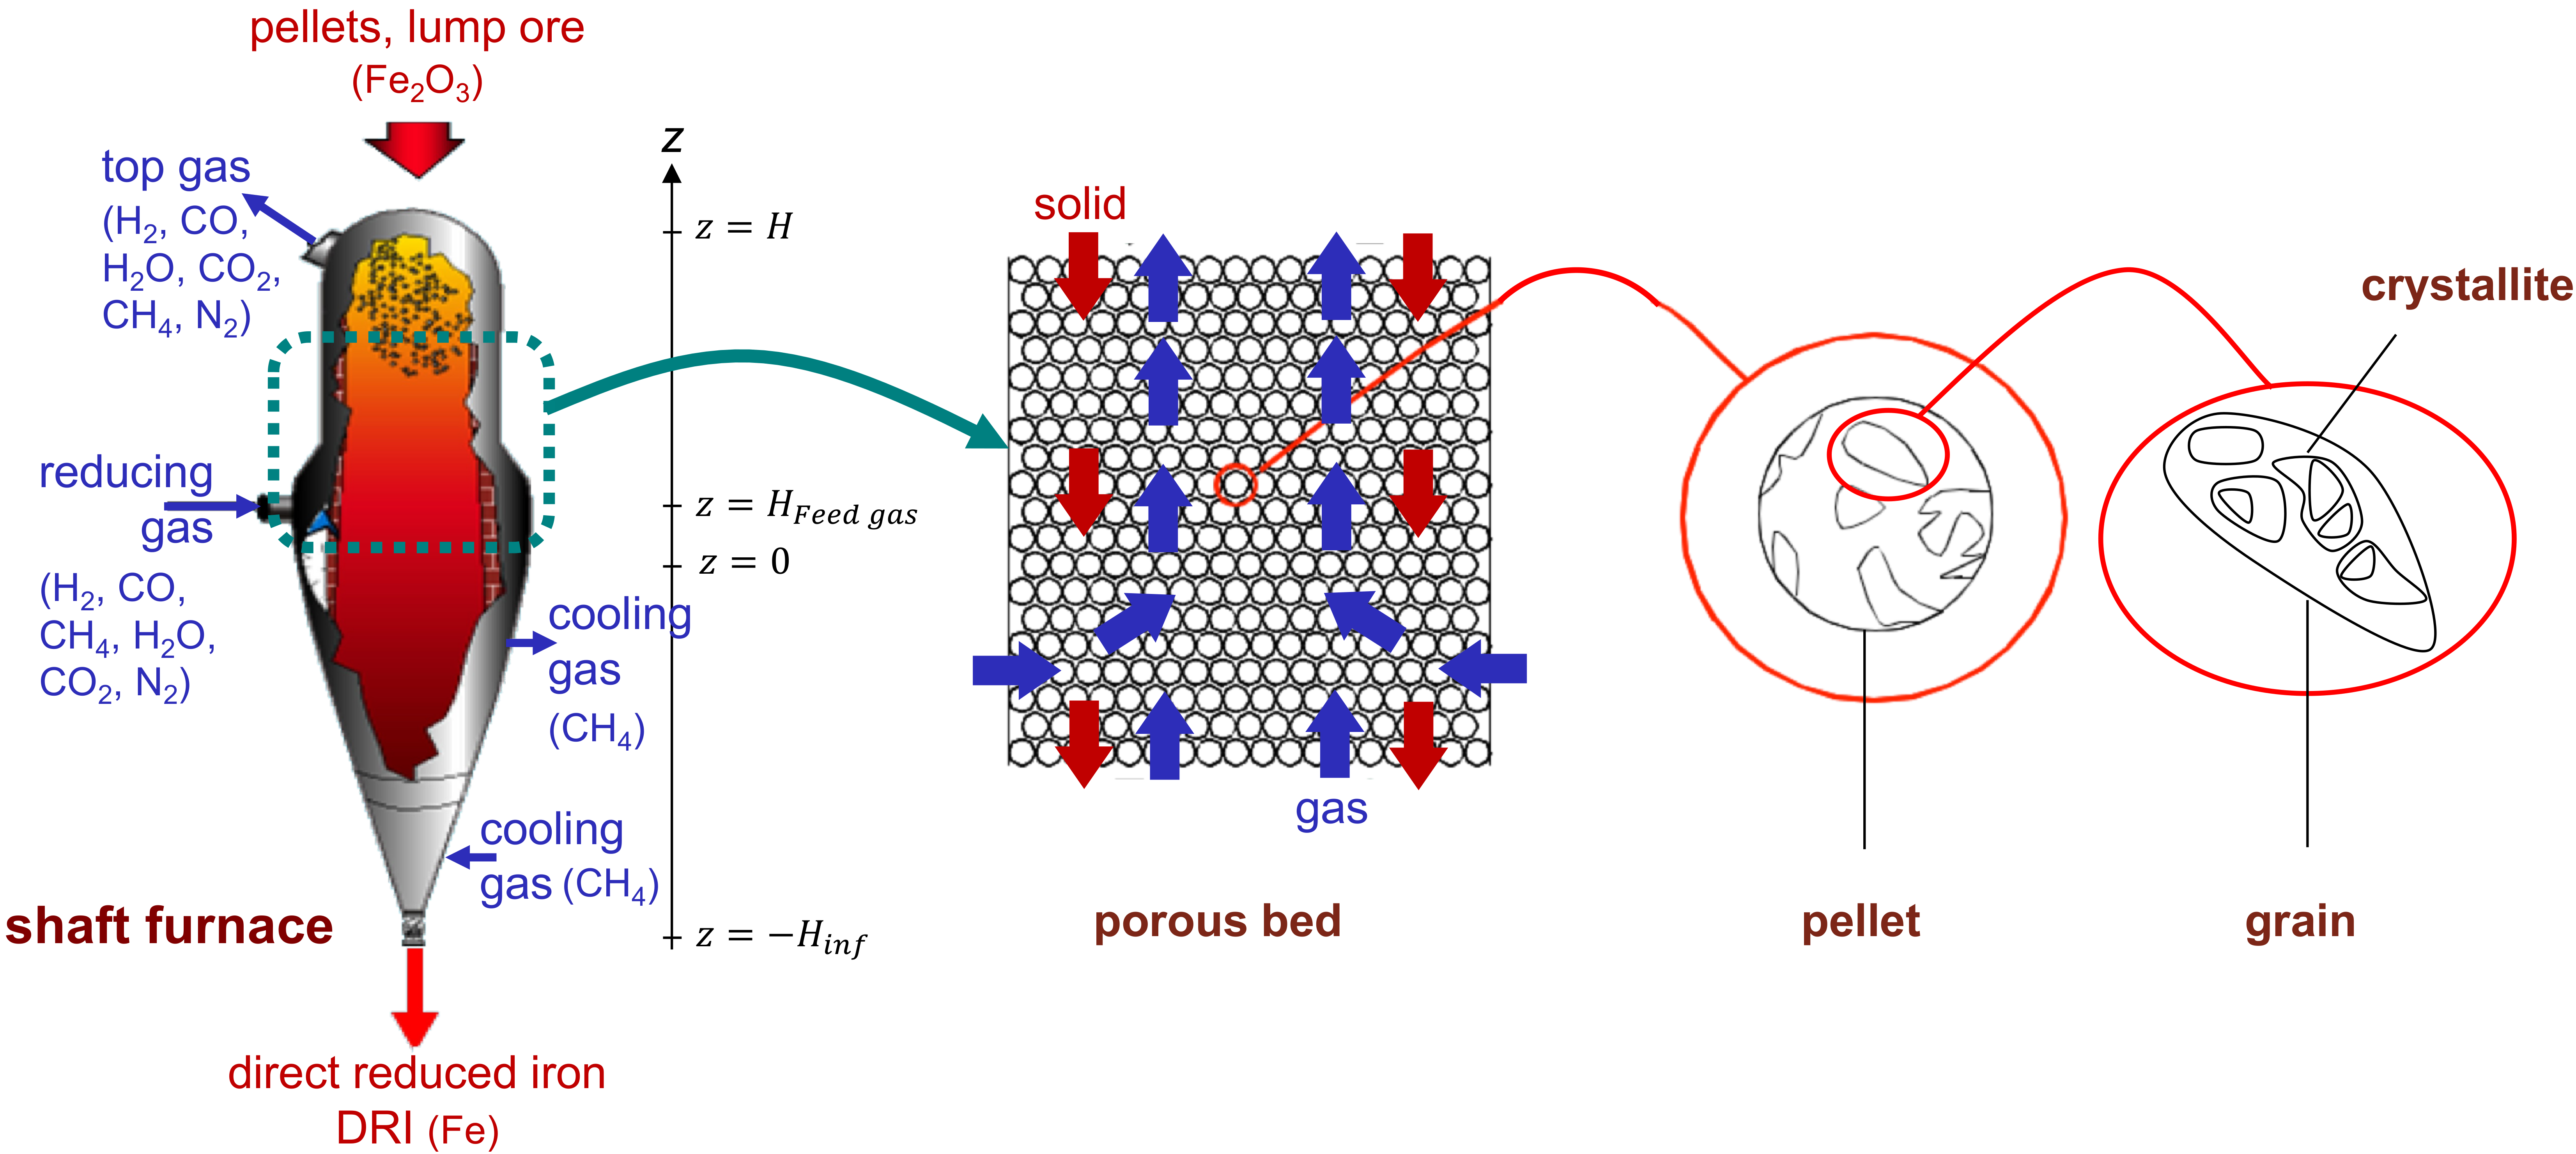
In a DR shaft furnace, a charge of pelletized or lump iron ore is loaded into the top of the furnace and is allowed to descend, by gravity, through a reducing gas. The reducing gas, comprised of hydrogen and carbon monoxide (syngas), and obtained by the catalytic reforming of natural gas, flows upwards, through the ore bed. Reduction of the iron oxides occurs in the upper section of the furnace, at temperatures up to 950 °C. A transition section is found below the reduction section; this section is of sufficient length to separate the reduction section from the cooling section, allowing an independent control of both sections. The solid product, called direct reduced iron (DRI) or reduced sponge iron, is cooled in the lower part of the furnace, down to approximately 50 °C, prior to being discharged.
The modeling of a shaft furnace, simulating the reduction of iron ore by syngas, is a powerful tool for defining optimal operating conditions. Use of such a model can lead to the maximization of conversion or the minimization of energy consumption, among other effects capable of reducing carbon dioxide emissions. As such, numerous iron ore shaft furnace models have been proposed in the literature. Initial studies addressed the reduction of a single pellet by H
2, CO, or H
2-CO mixtures [
4,
5,
6,
7,
8,
9]. Subsequent studies developed models that simulated the reduction zone of the shaft furnace in one dimension [
10,
11]. With the aim of correctly describing the lateral gas feed, some studies have introduced two-dimensional models [
12,
13,
14]; however, these models did not consider the presence of methane, which is responsible for important reactions in the process. More recently, several authors introduced other reactions [
15] and accounted for the cooling zone [
16,
17]. Some even developed plant models [
18]; however, these works were limited to one-dimensional models.
In this work, we developed further the model of Ranzani Da Costa and Wagner, built to simulate the reduction section of DR shafts, operated with pure hydrogen [
13,
14,
19]. We extended this model to consider CO-H
2-CH
4 reducing gas, and accounted for transition and cooling sections. The present model, named REDUCTOR, is 2-dimensional in the steady-state regime. The model includes a sophisticated, pellet sub-model. We consider eight heterogeneous and two homogeneous chemical reactions. These features represent a more advanced and detailed model, compared to previous studies. Moreover, the results were validated against two sets of plant data.
The present model, REDUCTOR, differs from the other model we recently reported [
18] on the following points. REDUCTOR is a computational fluid dynamics (CFD)-type, two-dimensional model, which describes the shaft furnace alone. The other model is of the systemic type, is one-dimensional, and aims to simulate the whole DR plant. The shaft furnace description included in the plant model, though based on similar equations, was intentionally made simpler and faster to run, on process simulation software. Thus, REDUCTOR is more detailed and more precise, but, of course, requires longer computation times.
3. Results and Discussion
In this section, the results of the Plant A simulation are first presented and discussed, then a comparison between the calculated and measured data for both plants is given. Results for the values of the different variables, throughout the reactor, are given in separate figures; however, all of these variables must be considered simultaneously for interpretation purposes.
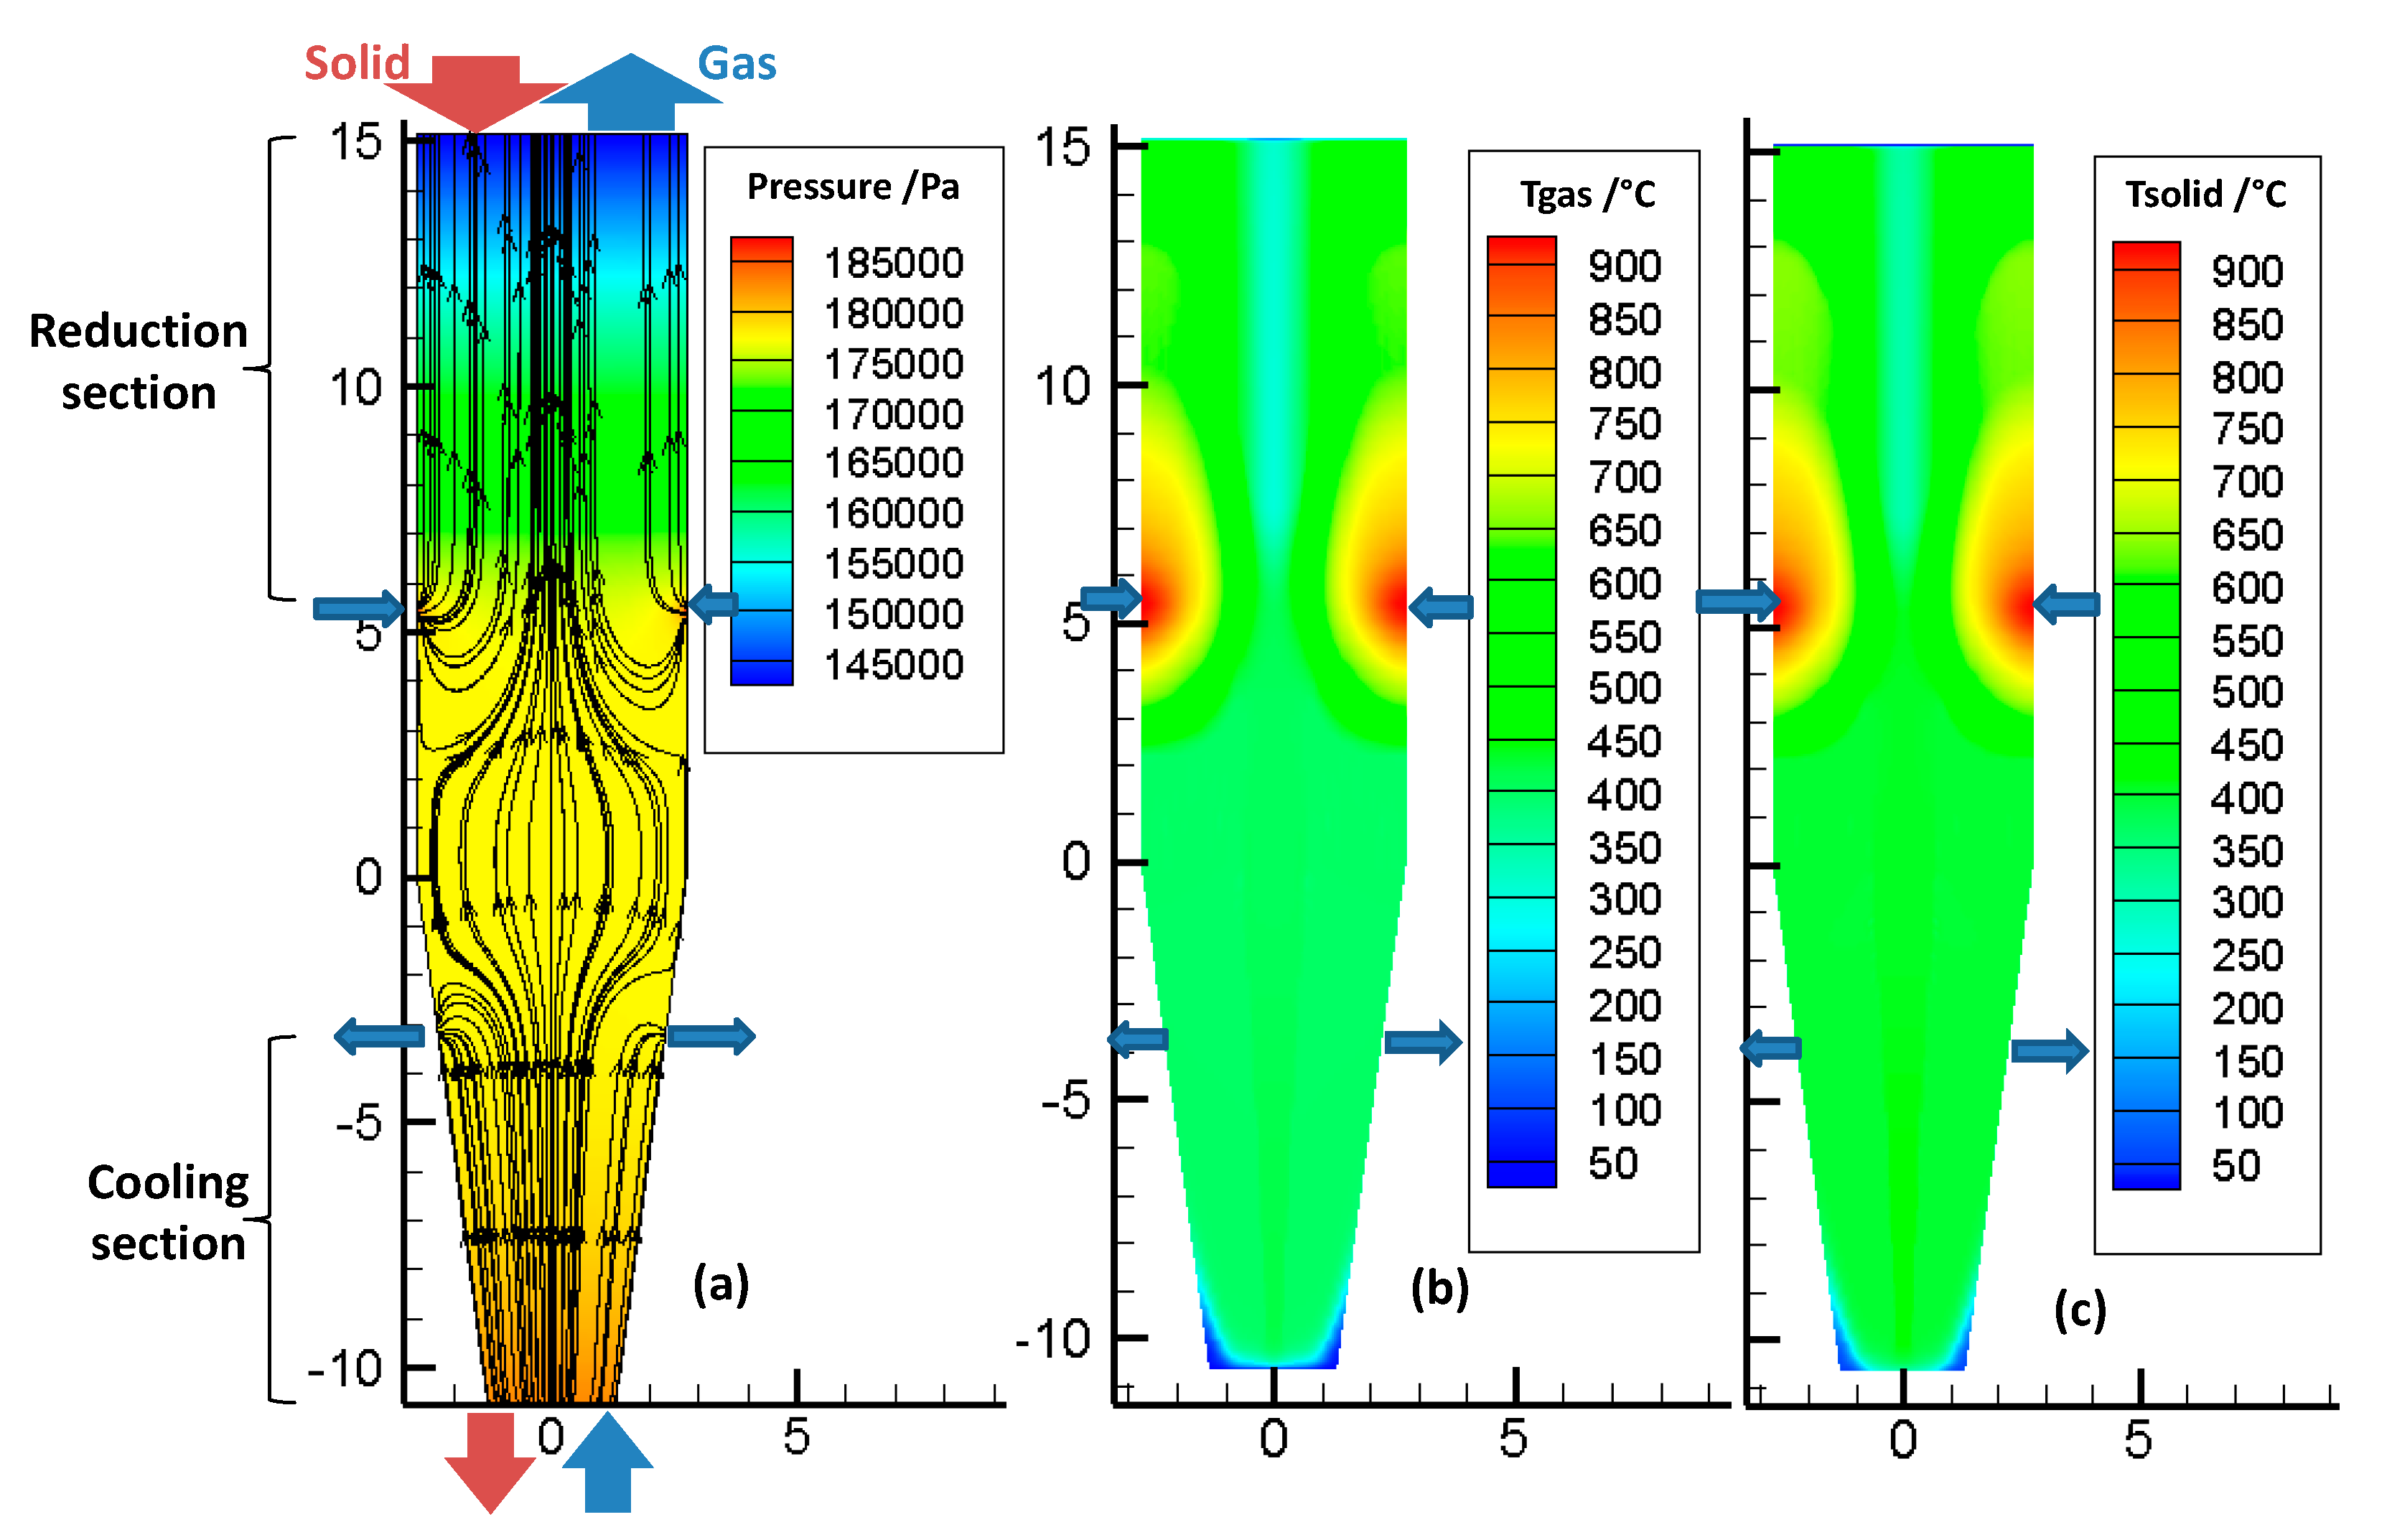
3.1. Pressure Field, Velocity of Gas and Temperature Field
Figure 5a shows the pressure and velocity fields inside the bed, throughout the reactor. The color scale refers to the pressure, and the lines refer to the streamlines. The large arrows indicate the locations of the various gas and solid inlets and outlets. These locations are the same (and not repeated everywhere) in the following figures. The pressure decreases almost linearly, from bottom to top. The reducing gas, injected at the sidewall (
z = 5.32 m), enters radially and then flows essentially vertically, except in the transition zone. The cooling gas first flows upwards, and then, most of it leaves the furnace radially, at the cooling gas outlet, except for a fraction that rises in the reduction section.
Figure 5b,c show the temperature distribution of the gas and solid phases in the reactor. First, it was found that the gas and solid temperatures were very close to each other. This similarity resulted from the high gas-to-solid heat transfer, as was described in a previous study [
14]. Downwards from the solid inlet, the solid temperature rapidly increased to reach the gas temperature. Second, the temperatures were not axially or radially uniform, throughout the reactor. The hottest zone was near the reducing gas inlet, with gas introduced at 957 °C. Above this inlet, the temperature decreased, because of methane reforming (as shown later, in Figure 7), an endothermic reaction. Third, the cooling gas not only cooled the solid in the bottom section but also influenced the temperature field in the reduction section, with the gas rising from the cooling zone to the central part of the reduction zone. This maintained a lower temperature alongside the center of the shaft.
From these results, radial gradients of temperature were revealed to influence, together with the gas composition profiles, the reduction of the solids and the metallization degree achieved.
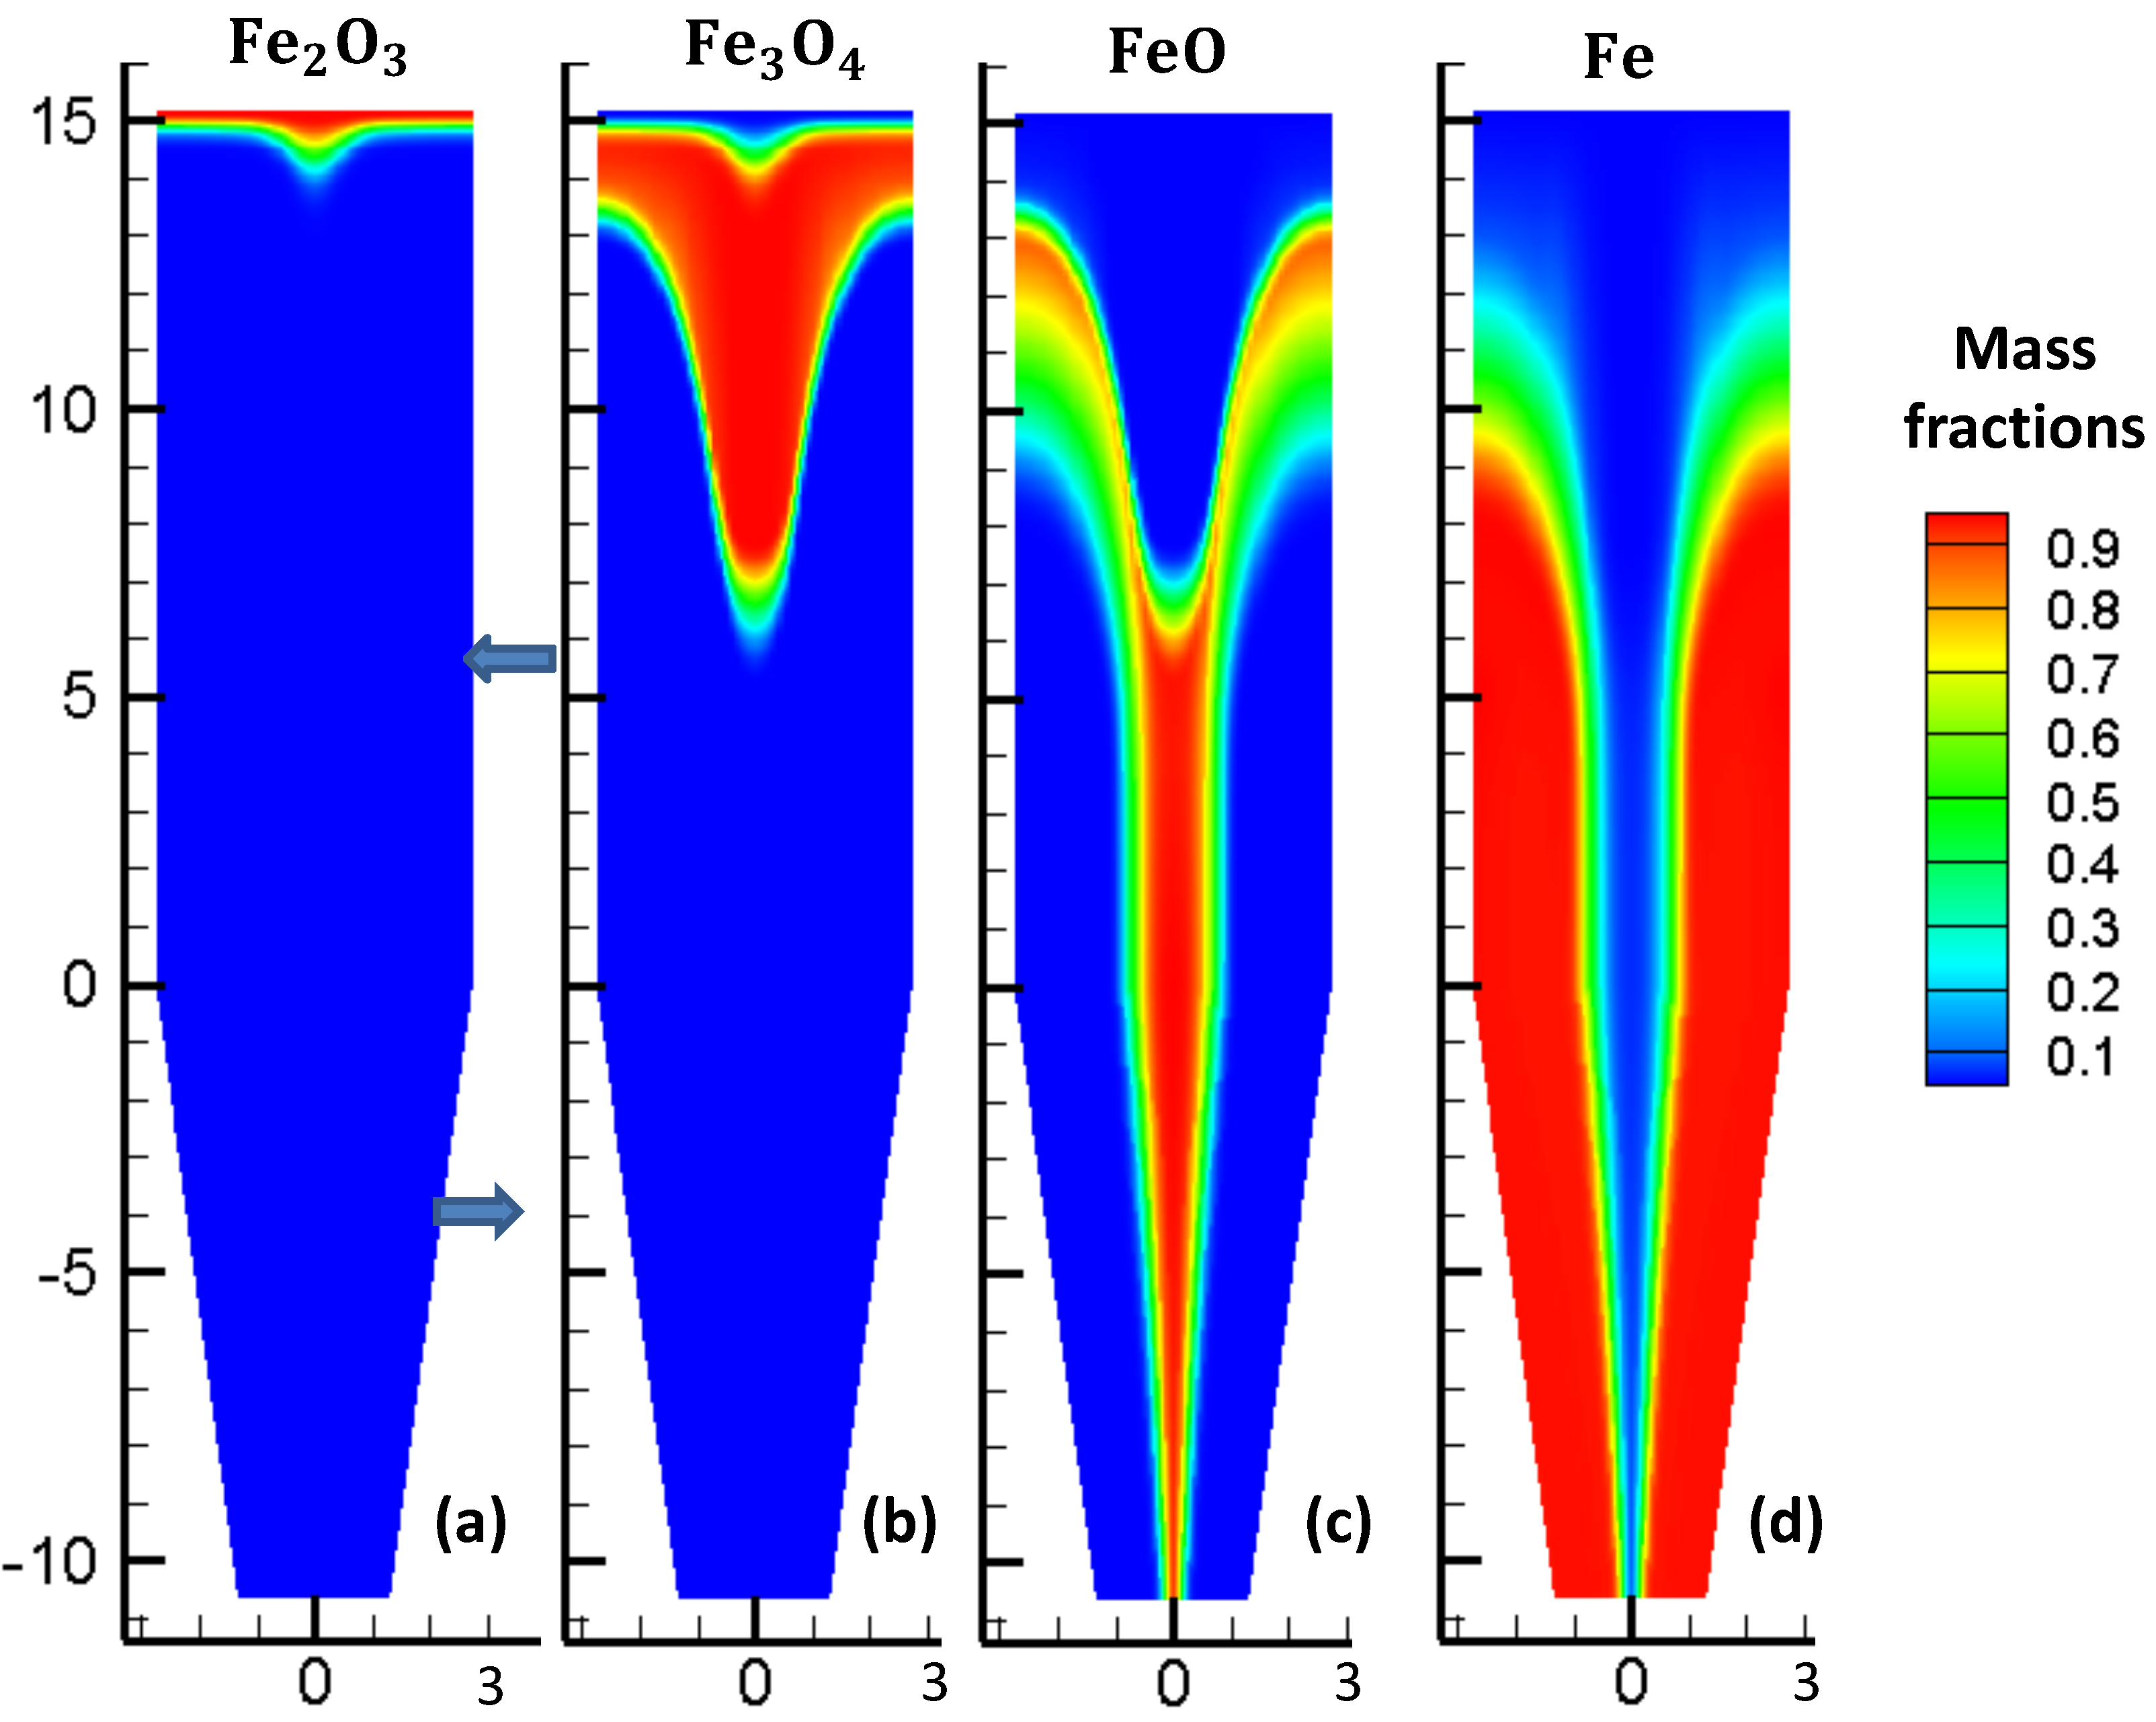
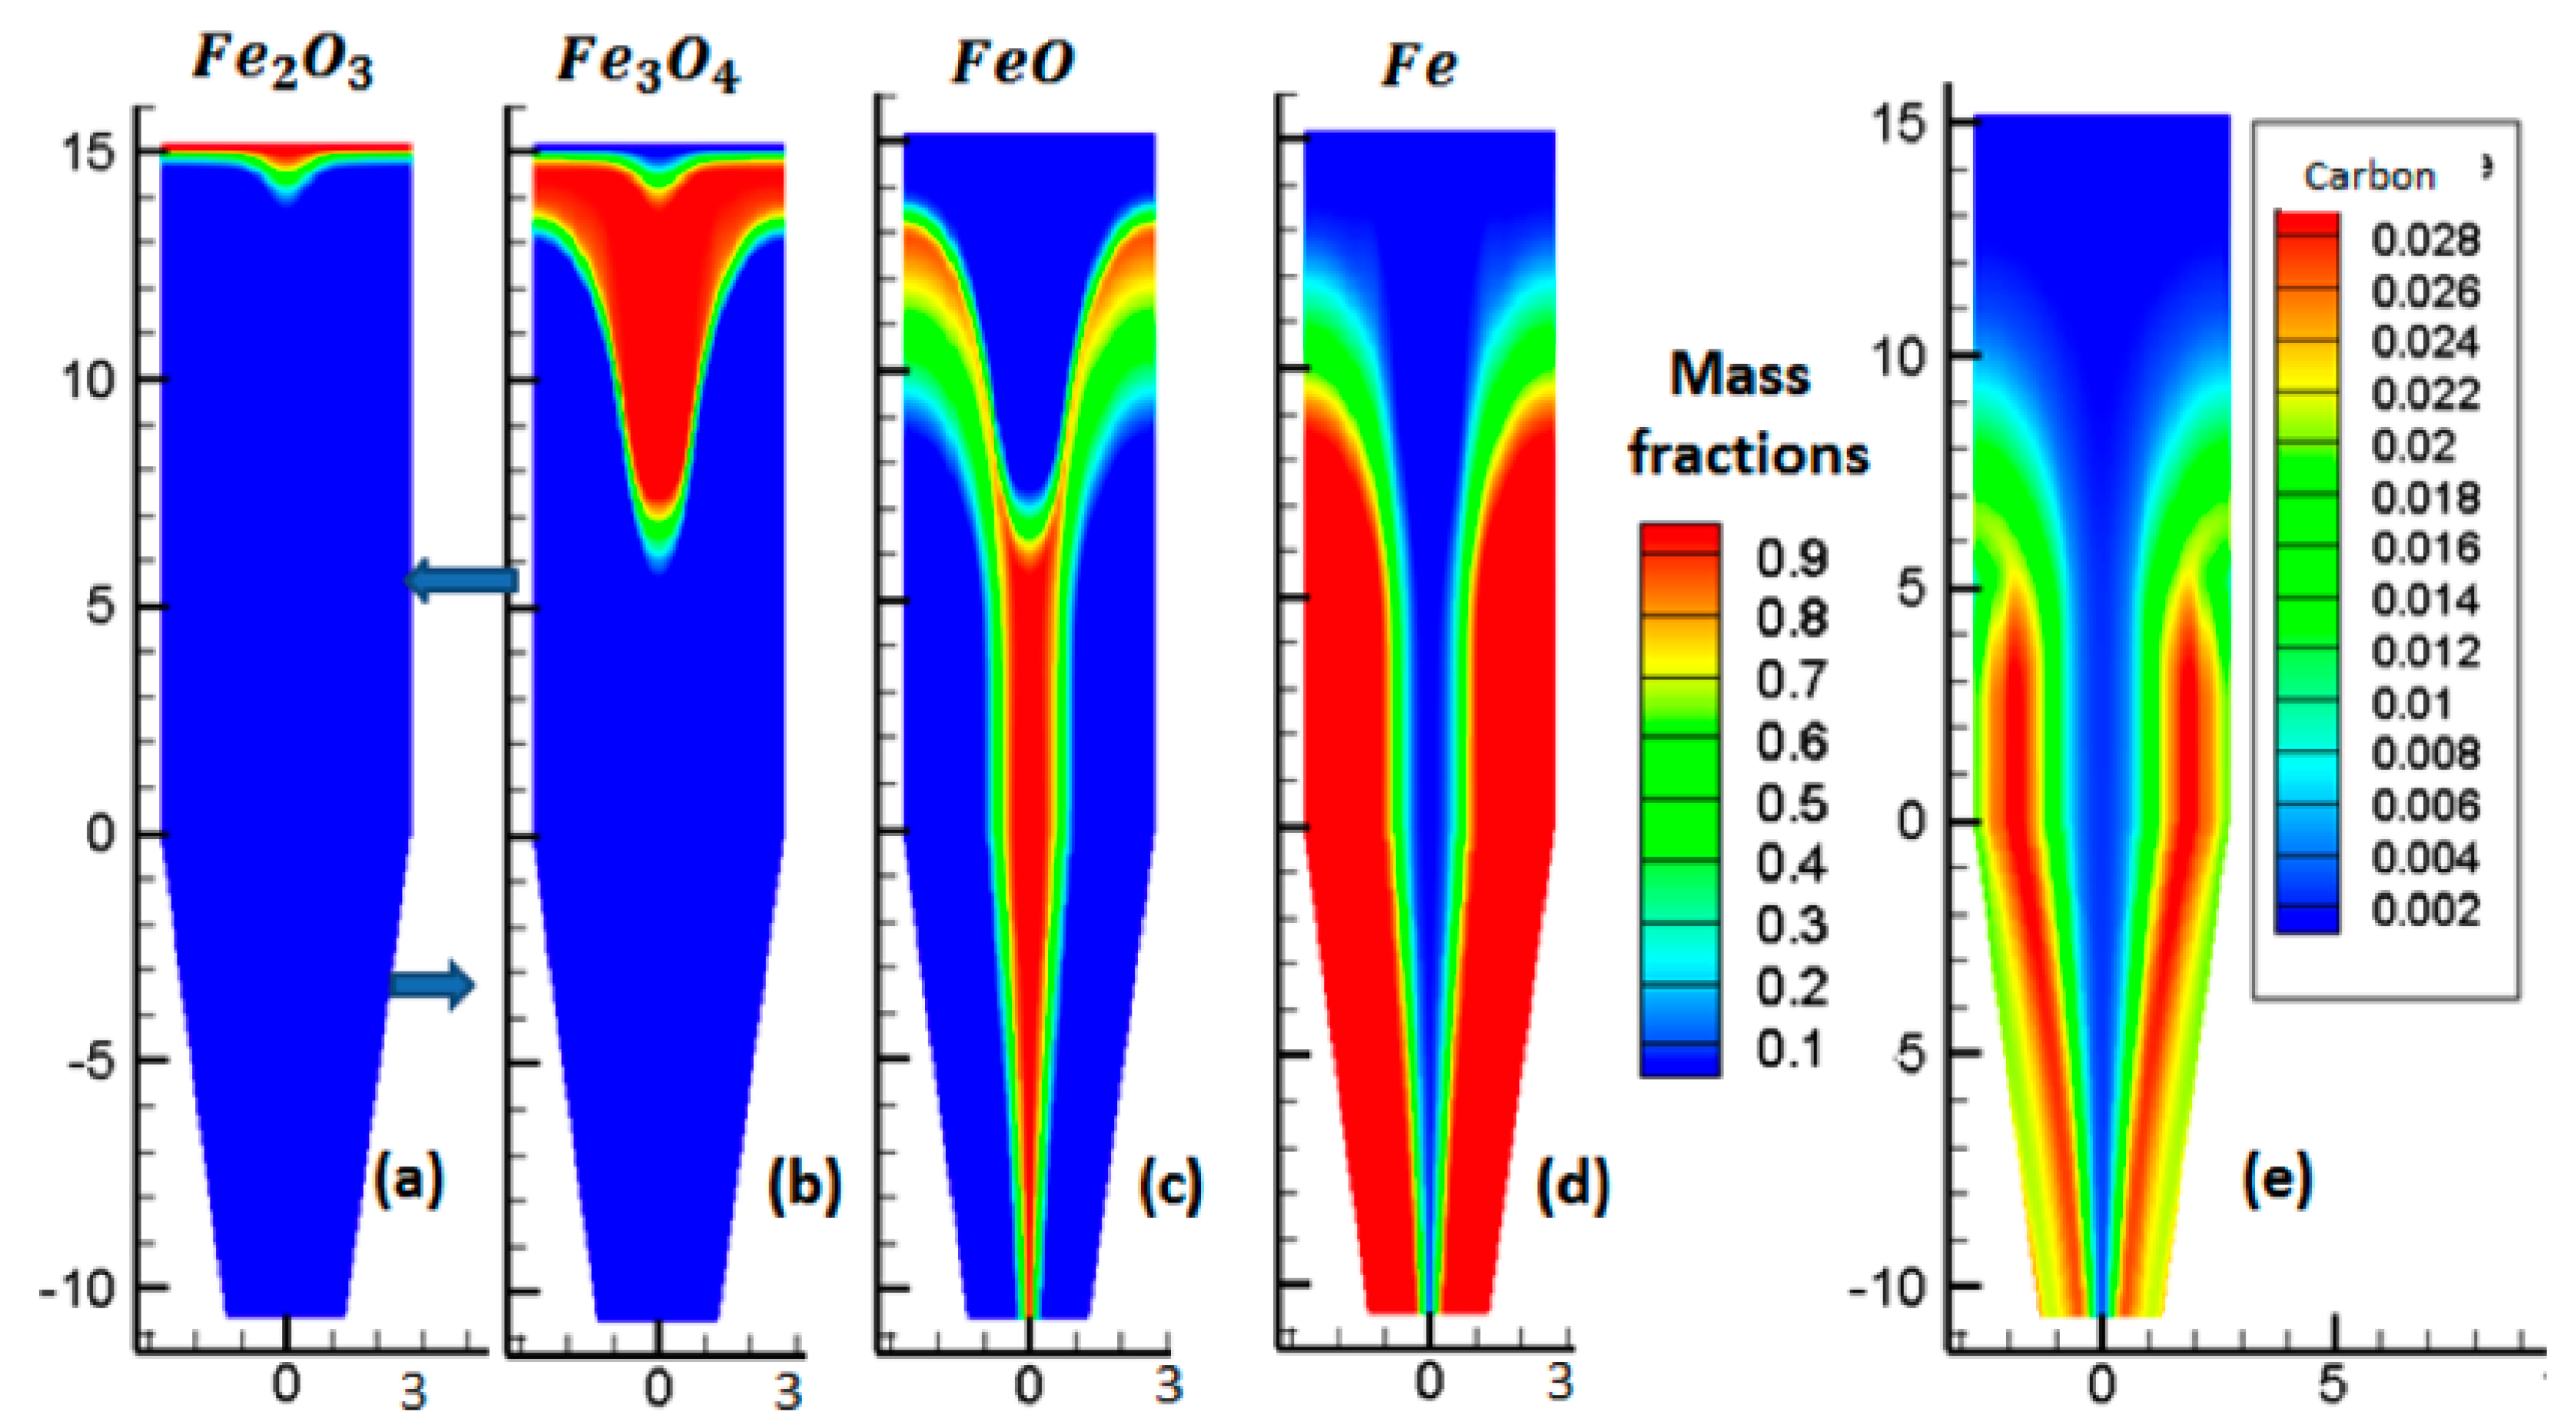
3.2. Solid Mass Fractions
Figure 6 plots the evolution of solid mass fractions, throughout the reactor.
Figure 6a shows that the hematite was fully converted to magnetite very rapidly in the upper part of the reactor. Subsequently, magnetite was reduced to wüstite, as shown in
Figure 6b. Afterwards, wüstite slowly began to reduce to iron, as seen in
Figure 6c,d. In the external two-thirds of the reduction section, above the reducing gas inlet—a zone where the gas was rich in H
2 and CO and the temperature high—the conversion to iron was completed, in approximately 7 m. In the central part of the reactor, where the temperature was lower and the gas, lower in H
2 and CO, the conversion was not completed and some wüstite remained in the cooling zone. Though the average metallization degree was approximately 94%, metallization was not uniform, with most pellets being completely reduced, whereas others were not.
Figure 6e shows the carbon mass fraction, throughout the reactor. We observed that the carbon was in the same location as Fe, in accordance with the catalytic effect of iron on carbon formation.
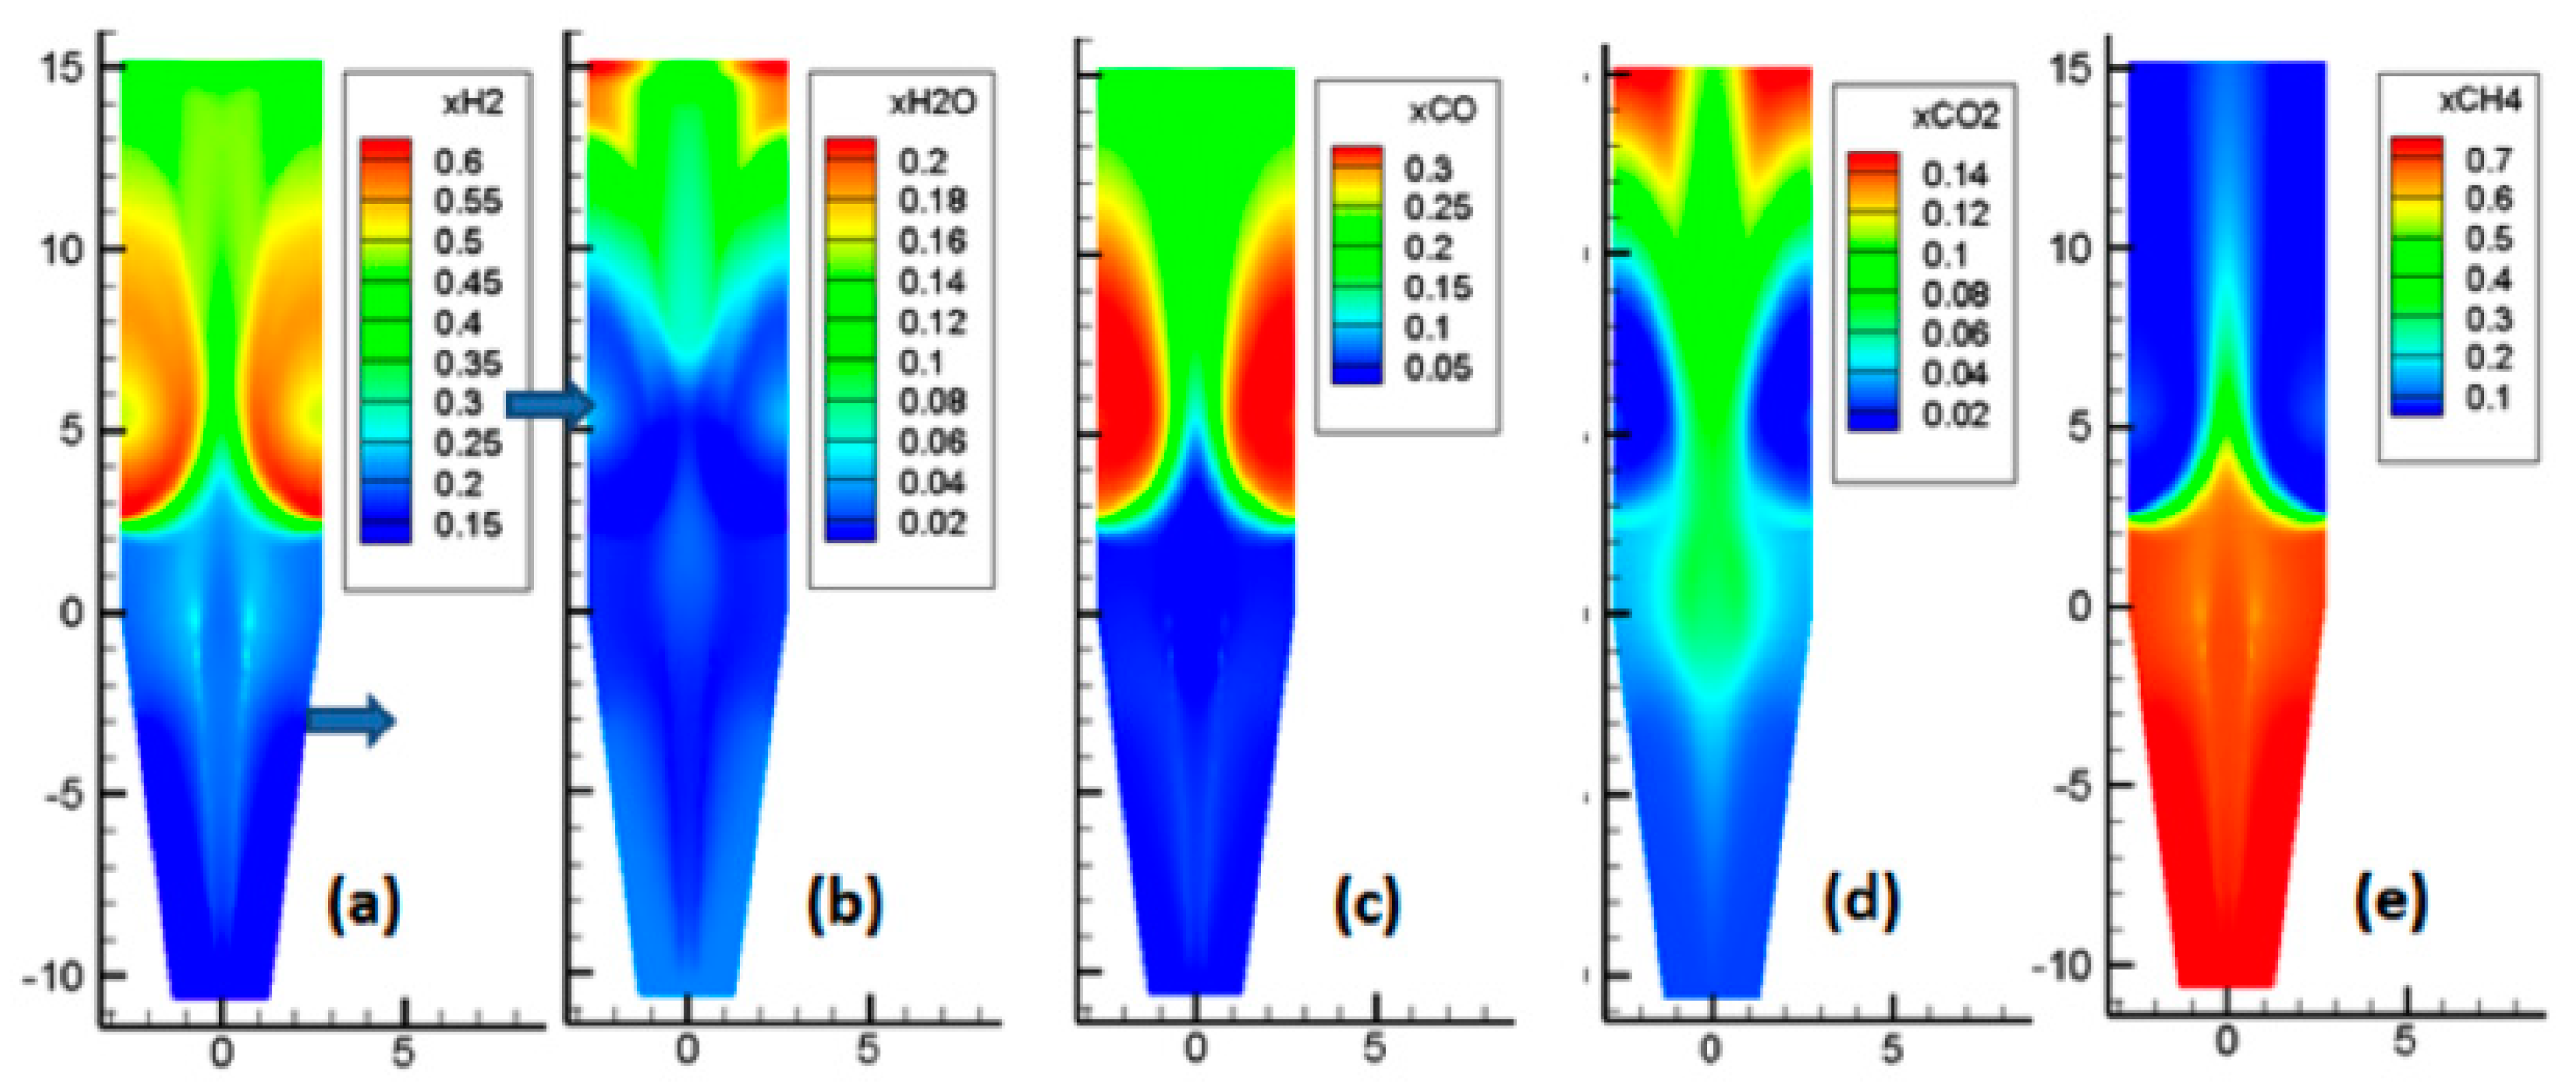
3.3. Gas Mole Fractions
As showcased by
Figure 7, the situation here is more complex, due to the numerous reactions occurring. The main features of these reactions are as follows. Near the reducing gas inlet, the reforming of methane occurred, which increased the H
2 and CO contents. Above the gas inlet, the H
2 and CO contents decreased, while H
2O and CO
2 were formed, as a result of the reduction reactions. In the central zone, with less reduction, lower amounts of H
2O and CO
2 were formed, and part of the cooling gas, rich in CH
4, was present.
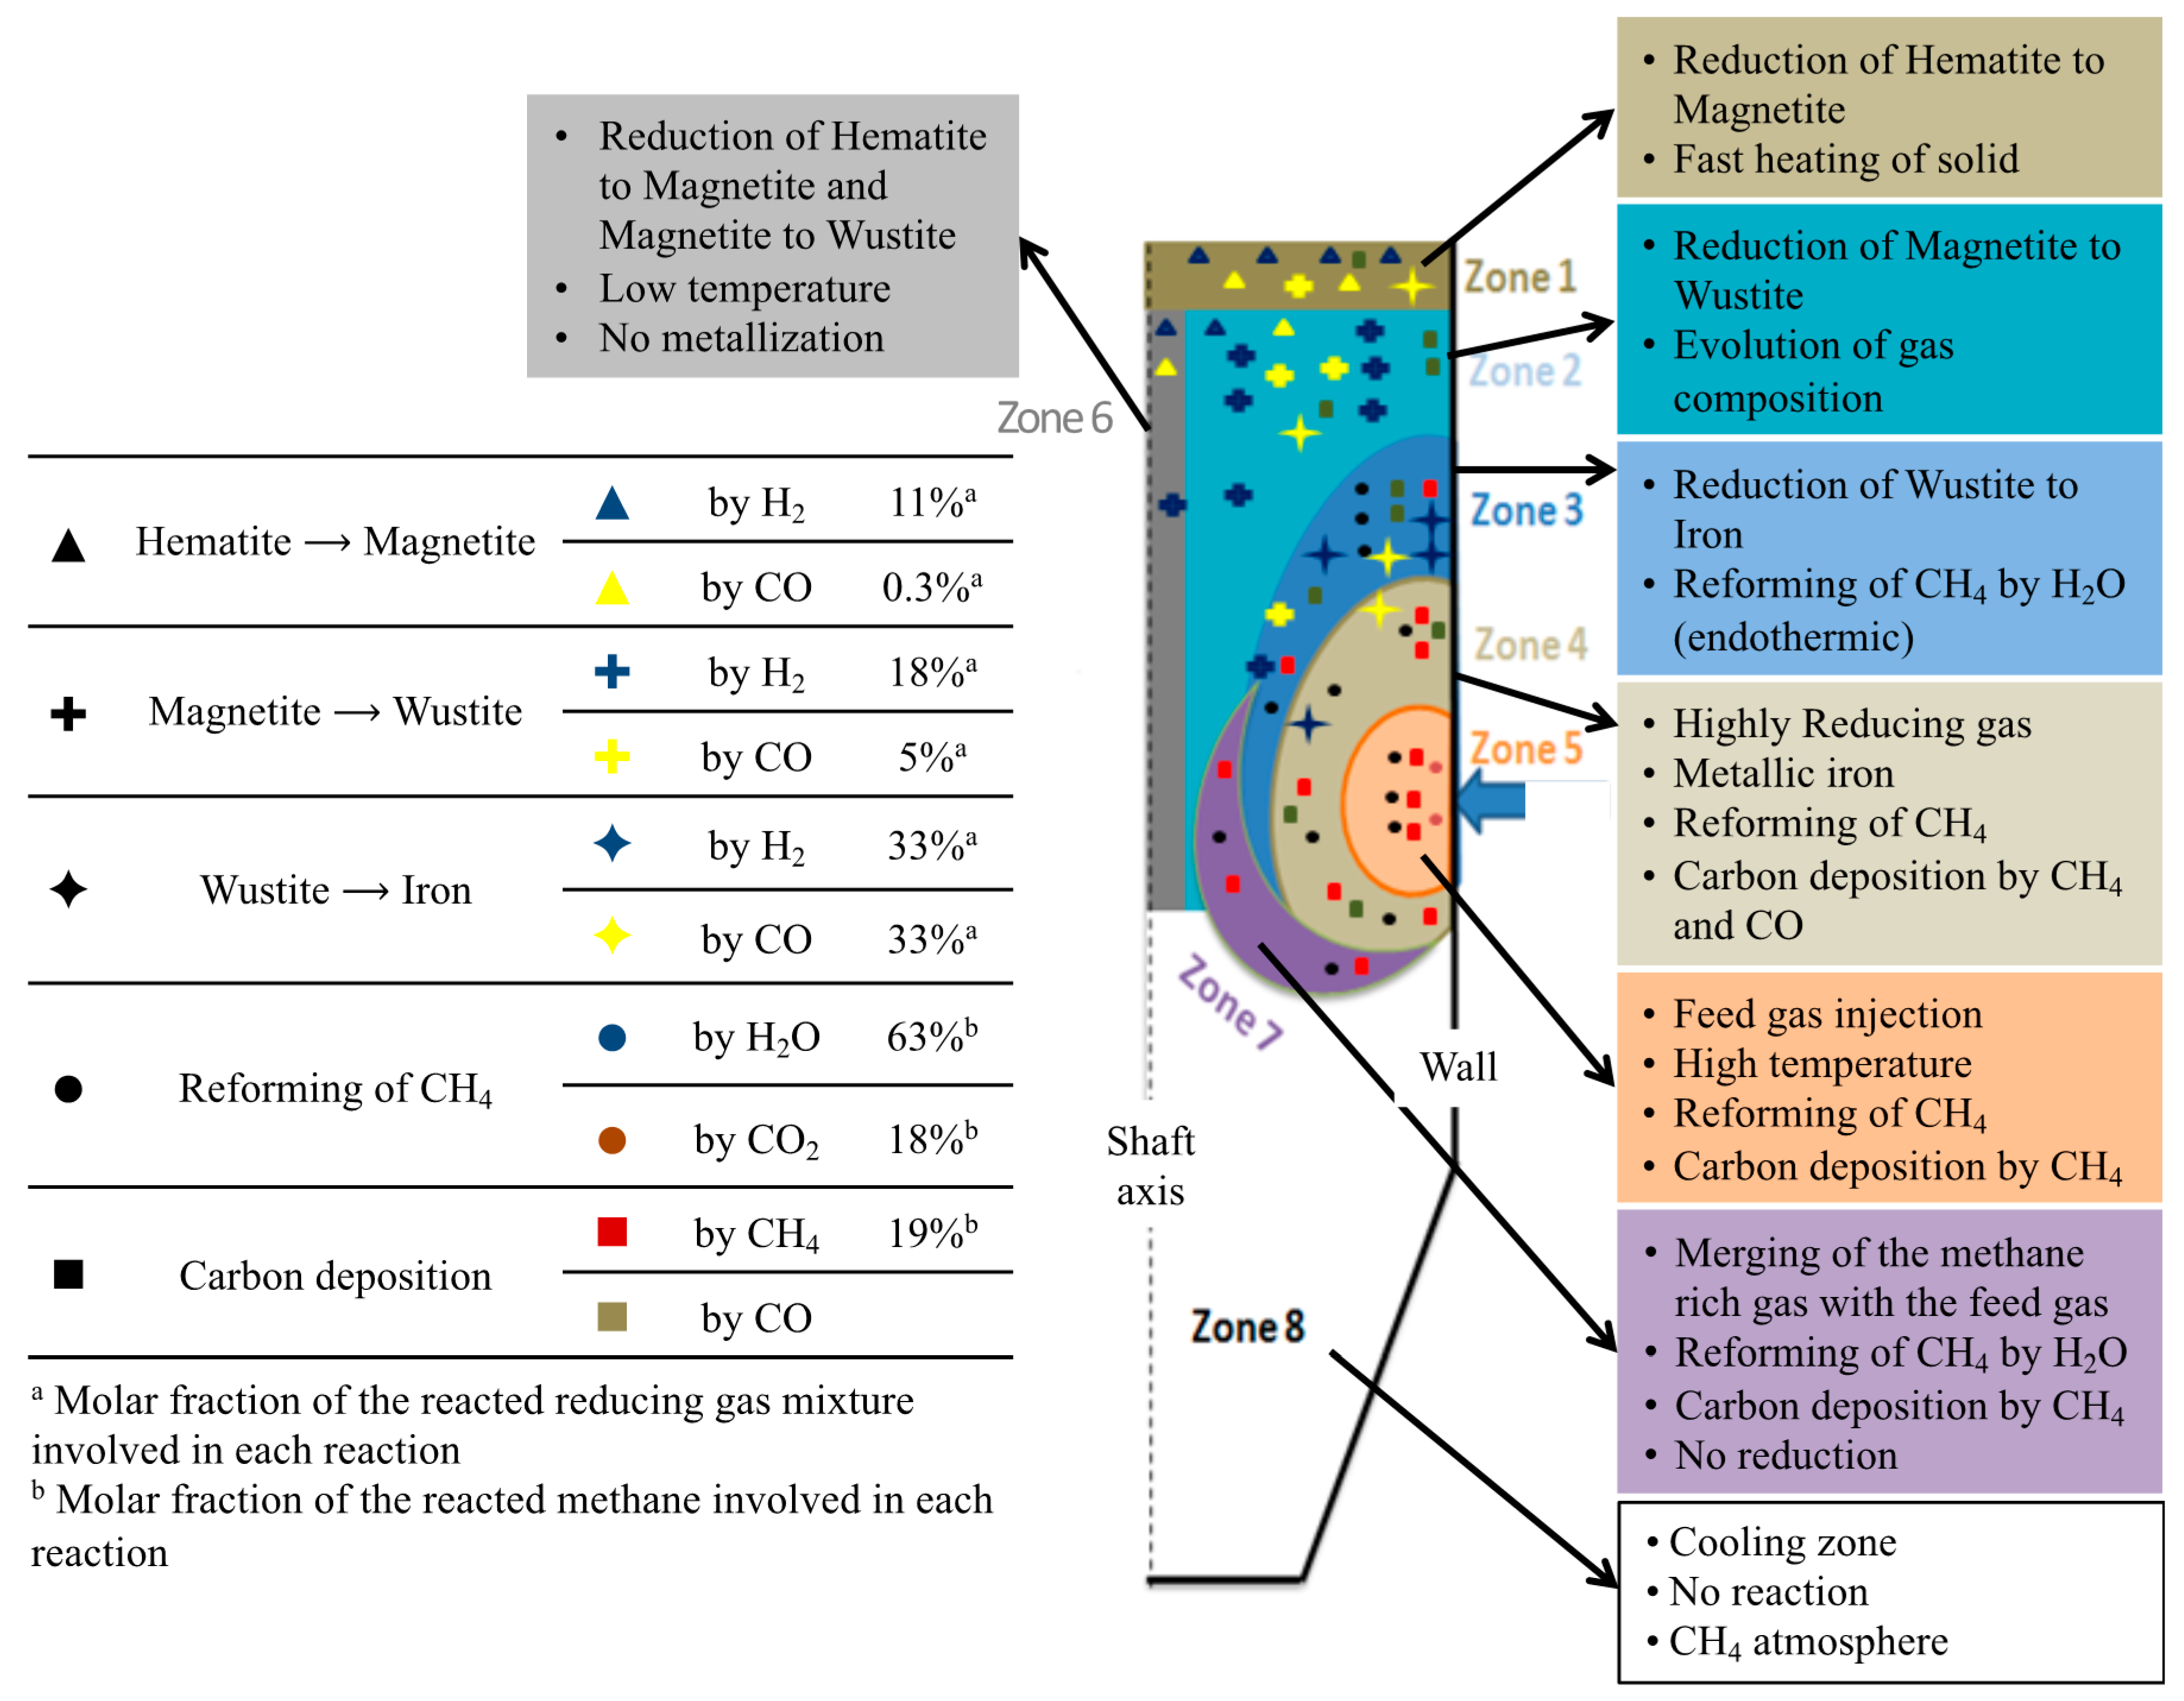
3.4. Overall Picture
Figure 8 is a summary diagram, based on the above results. The shaft furnace was divided into eight zones and distinguished according to the main chemical and thermal processes occurring. On the left part of the diagram are indicated the molar percentages of H
2 and CO, involved in each reaction, and the molar percentage of methane, reformed by H
2O or CO
2, or decomposed to carbon and H
2. This diagram is an illustration of how modeling work can help one to understand the detailed behavior of a reactor. Clearly, these results could not be obtained from other means.
3.5. Validation
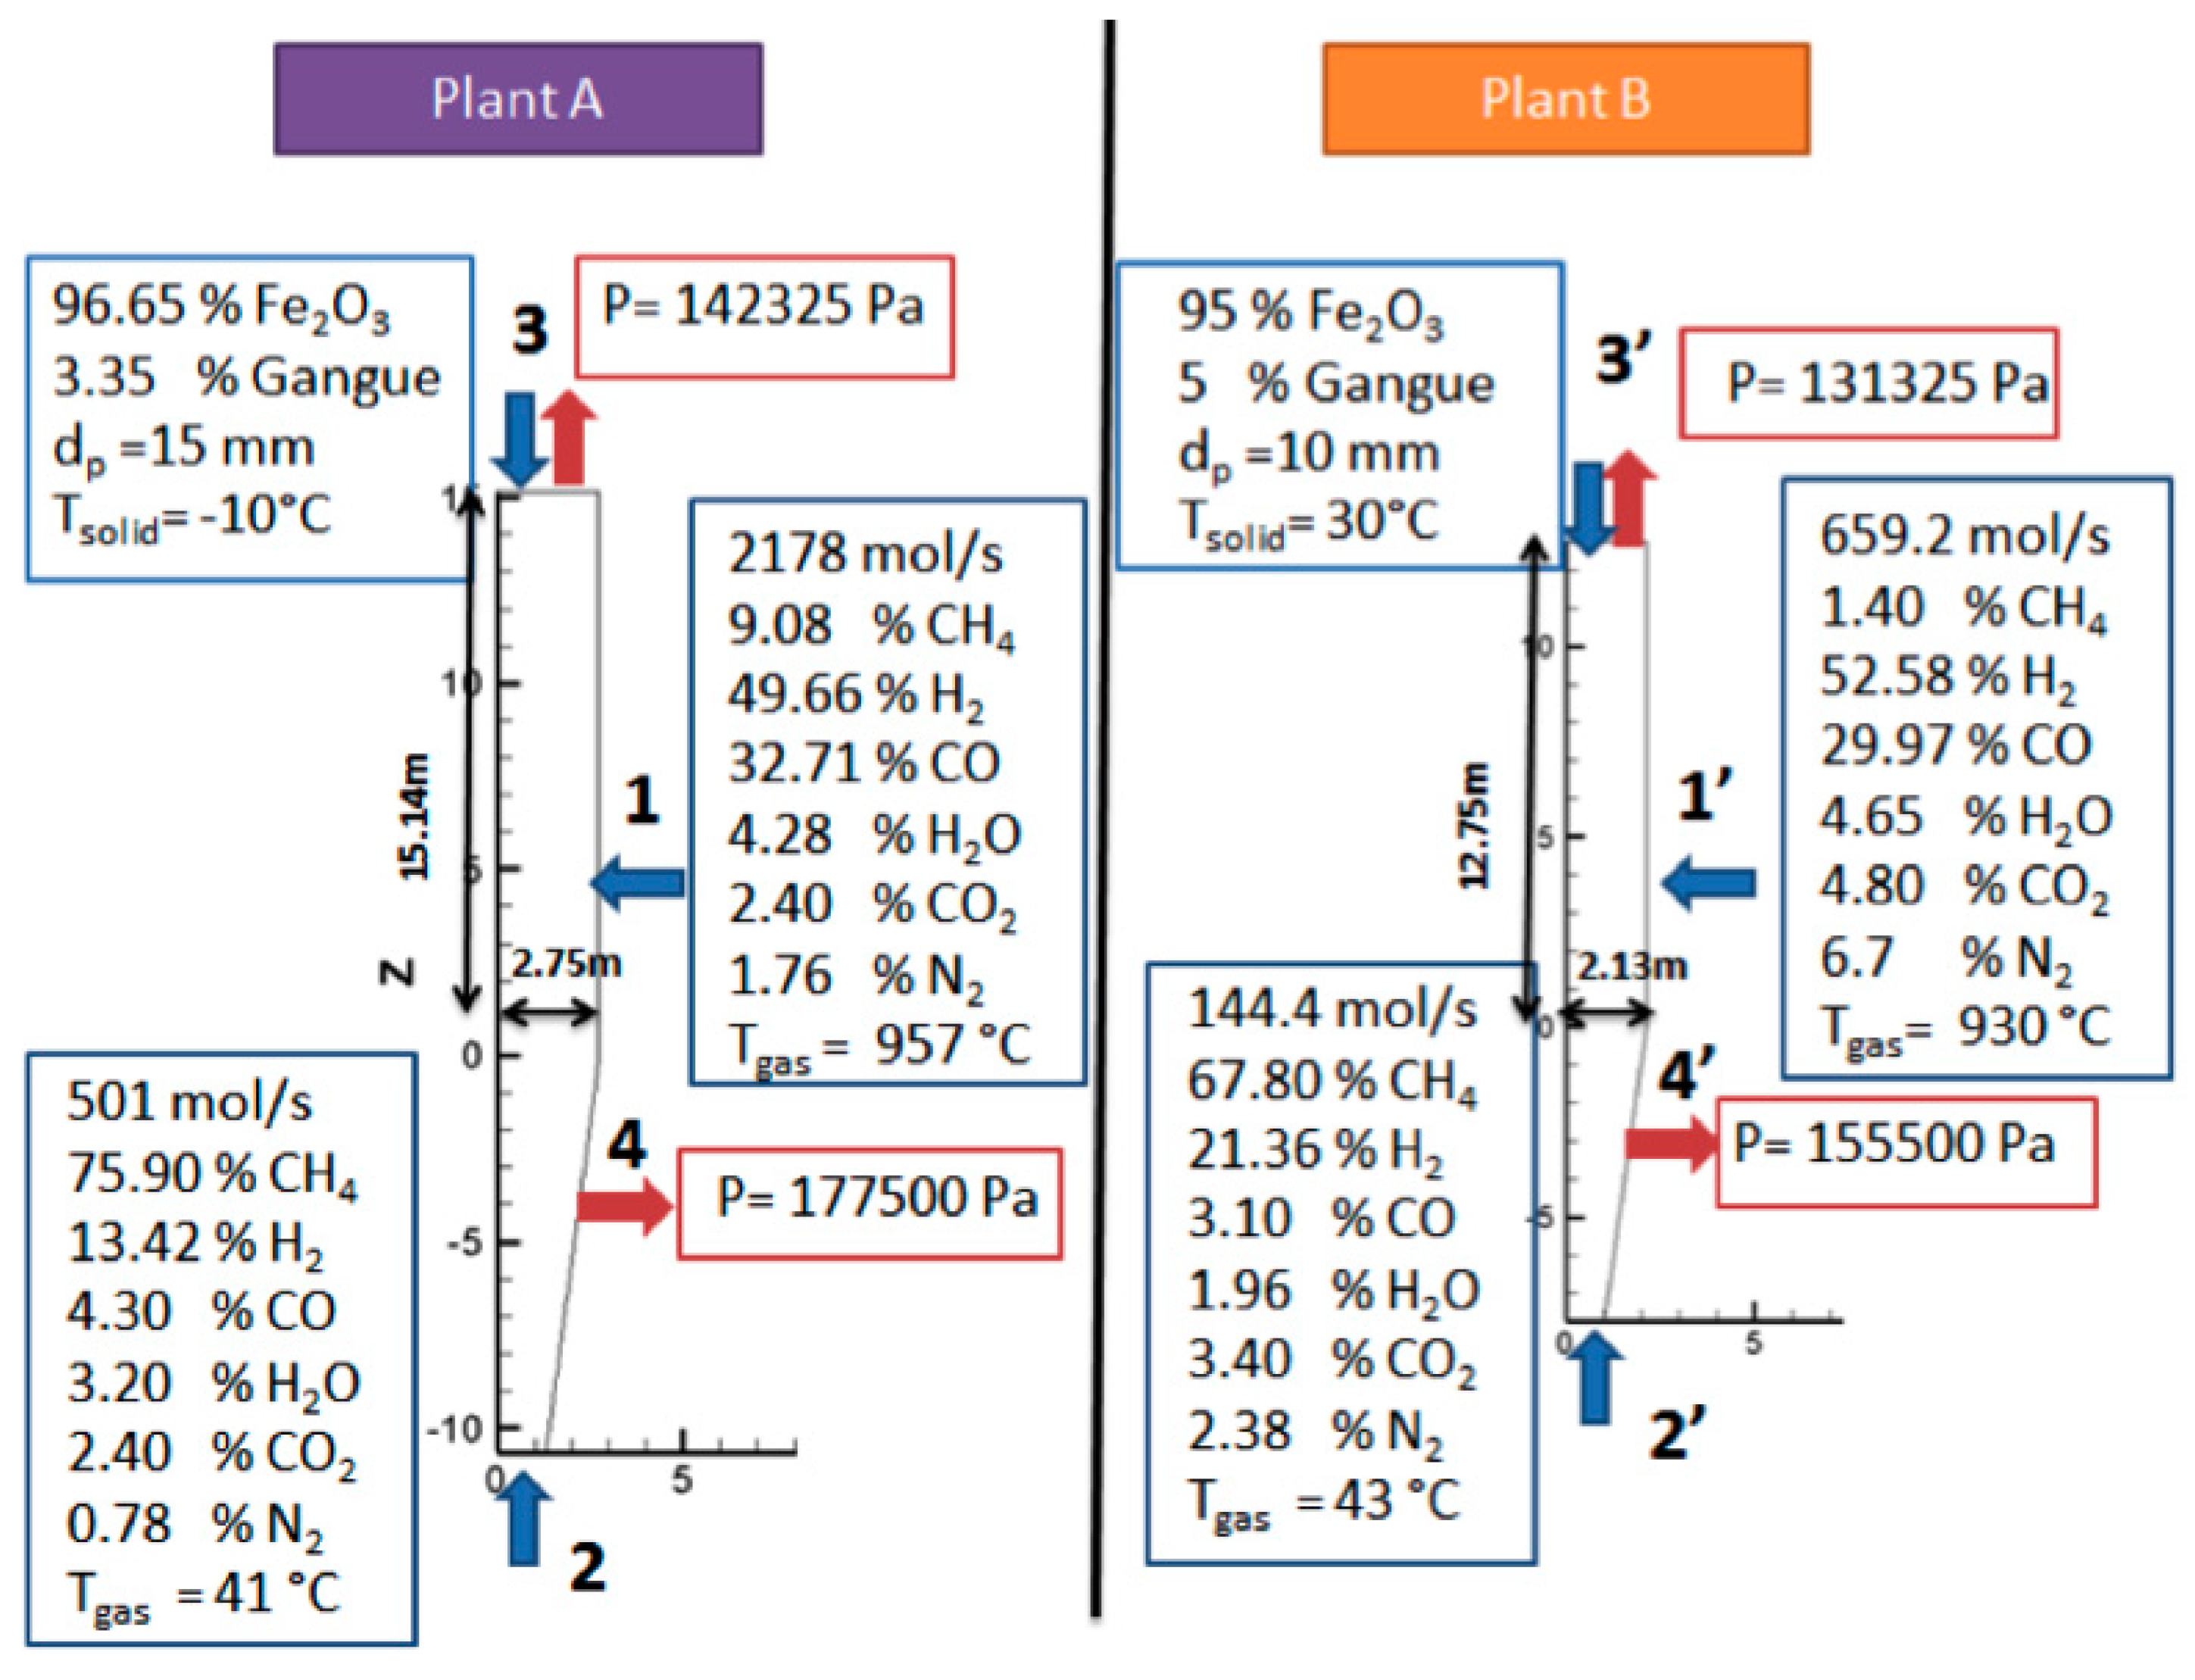
Unfortunately, neither interior measurements of solid or gas temperatures, nor compositions, were available for comparison with the calculations. However, from some published data regarding Plant B, and from plant data measurements from Plant A, an overall validation of the model was possible.
Table 4 provides a comparison of the simulation results, with the available plant data. It can be seen that the model reproduced the outlet temperatures and compositions quite satisfactorily. From this strong agreement, obtained by simulations of two plants of differing capacities, the model can be considered validated.
4. Conclusions
This article presented the modeling and simulation of an iron ore, direct reduction shaft furnace. We developed a new mathematical model, with the aim of introducing a more-detailed description of the chemical processes, compared to previous studies. The model presented is two-dimensional, describes three sections in the shaft, and accounts for eight heterogeneous and two homogeneous reactions. The model was validated against plant data from two MIDREX plants of notably different capacities. From the analysis of the calculated 2D maps of temperature and composition of the gas and solid phases, it was possible to gain new insights into the interior behavior of the shaft furnace and identify different zones, according to the chemical and thermal phenomena occurring. One significant result is the presence of a central zone of the shaft of lesser temperature and conversion.
Such a model can be helpful in: Investigating the influence of various parameters and operating conditions (including the reducing gas composition), comparing different furnace configurations, and suggesting improvements [
29]. These investigations will be the subject of a future paper.


