3.1. Structure Properties
First, the equilibrium lattice constants a (Å) for the anti-perovskite Ti
3AN were calculated. Meanwhile, the elastic constants of Ti
3AN were also calculated. The elastic constants of a crystal characterize its response to external stresses within the elastic limit, and the elastic constants of solids provide valuable information on their mechanical and dynamical properties. In particular, they can provide information on the stability and stiffness of the material [
37]. The three independent elastic constants in cubic symmetry, i.e.,
C11, C12 and
C44, were estimated by calculating the stress tensors upon applying strains to an equilibrium structure. We obtained the lattice constants, elastic constants, and elastic modulus of Ti
3AN. The values are listed in
Table 1.
The calculated lattice constants are close to the experimental ones [
8,
38] with small differences, since the LDA method gives a slight underestimation on the lattice constants. In addition, the bulk modulus
B and shear modulus
G were estimated using the VRH method. For a cubic system, the mechanical stability criterion [
39] is expressed as
,
,
, and
.
The elastic constants given in
Table 1 conform to the criterion above, which indicates that these three structures are mechanically stable. Poisson’s ratio
ν reflects the volume change in the materials under uniaxial deformation. When Poisson’s ratio equals 0.25 and 0.5, it represents the upper and lower limits of the central force solid, respectively. When it is equal to 0.5, the volume does not change under elastic deformation. The Poisson’s ratios of the three compounds are between 0.25 and 0.5, their binding force belongs to the central force [
40]. It can be seen that the three compounds have large Poisson’s ratios (>0.3) and not too large Young’s moduli (<300 GPa) and shear moduli. Therefore, we can expect that the three compounds have comparatively low hardness. In addition, this prediction will be confirmed according to the results in our later analyses.
According to Pugh’s criterion [
40], when
G/B < 0.56, this kind of material generally exhibits toughness, when
G/B > 0.56, it generally exhibits brittleness. The values shown in
Table 1 indicate that the three compounds are tough materials.
B/C44 is taken as the basis for judging the lubrication performance of materials. The larger
B/C44, the better the lubrication performance [
41].
Table 1 reveals that all three compounds have good lubrication performance and are all good lubricants. As is known, a lubricant requires a certain tenacity, and according to the values of
G/B in
Table 1, all three compounds have high tenacity. As seen in
Table 1, the Cauchy pressure
C12-C44 is larger than zero. If the interatomic forces can be described by a potential that only depends on the distance between atoms and if all atoms of an unstrained crystal occupy the centers of inversion symmetry in the lattice, the Cauchy pressure vanishes, and
C12 = C44. This form of the potential excludes torsional, or bending, forces (present in covalent crystals) and interatomic forces, which vary with the atomic volume (present in metals) [
42]. If the Cauchy pressure is positive (negative), the material is ductile (brittle).
The influence of microcracks and lattice distortions is typically considered when studying the mechanical properties of materials. Anisotropy of the elastic properties is usually the condition responsible for the formation of the two abovementioned factors. Therefore, research into elastic anisotropy is beneficial for improving the mechanical durability of materials. In the lattice of Ti3AN, metallic bonds among metal atoms have no directionality, whereas the bonds between Ti atoms and N atoms are parallel to the basis vectors of the lattice with strong directionality. In addition, this is the cause of anisotropy in the elastic modulus. Therefore, the elastic properties along the face diagonal and body diagonal may significantly differ.
Shivakumar and Ranganathan introduced the elastic anisotropy index
AU [
43], which is applicable to all crystals, to quantitatively study the anisotropy of a monocrystal,
where
BV and
BR are the bulk moduli of the Voigt and Reuss models, respectively, and
GV and
GR are the shear moduli of the Voigt and Reuss models, respectively.
AU = 0 indicates the isotropy of a monocrystal. An
AU deviating from 0 results in greater anisotropy in the materials. Moreover, Chung and Buessem [
44] proposed the concept of fractional anisotropy ratios, which are defined as follows:
These ratios were used to evaluate the degree of anisotropy of the bulk modulus and the shear modulus.
AB = 0 and
AG = 0 indicate that the materials are isotropic. Meanwhile,
AB = 1 and
AG = 1 indicate the greatest possible elastic anisotropy.
AE was defined as the Young’s anisotropic factor, and the formula is as follows:
All of the anisotropy values of Ti
3AN are listed in
Table 2. The calculated results show that all anisotropy indices
AU of the three compounds are larger than 0, which indicates the anisotropy of the elastic properties, and the degree of anisotropy inTi
3InN is significantly larger compared with that in Ti
3AlN and Ti
3TlN. The Young’s modulus and shear modulus of Ti
3AN are all anisotropy.
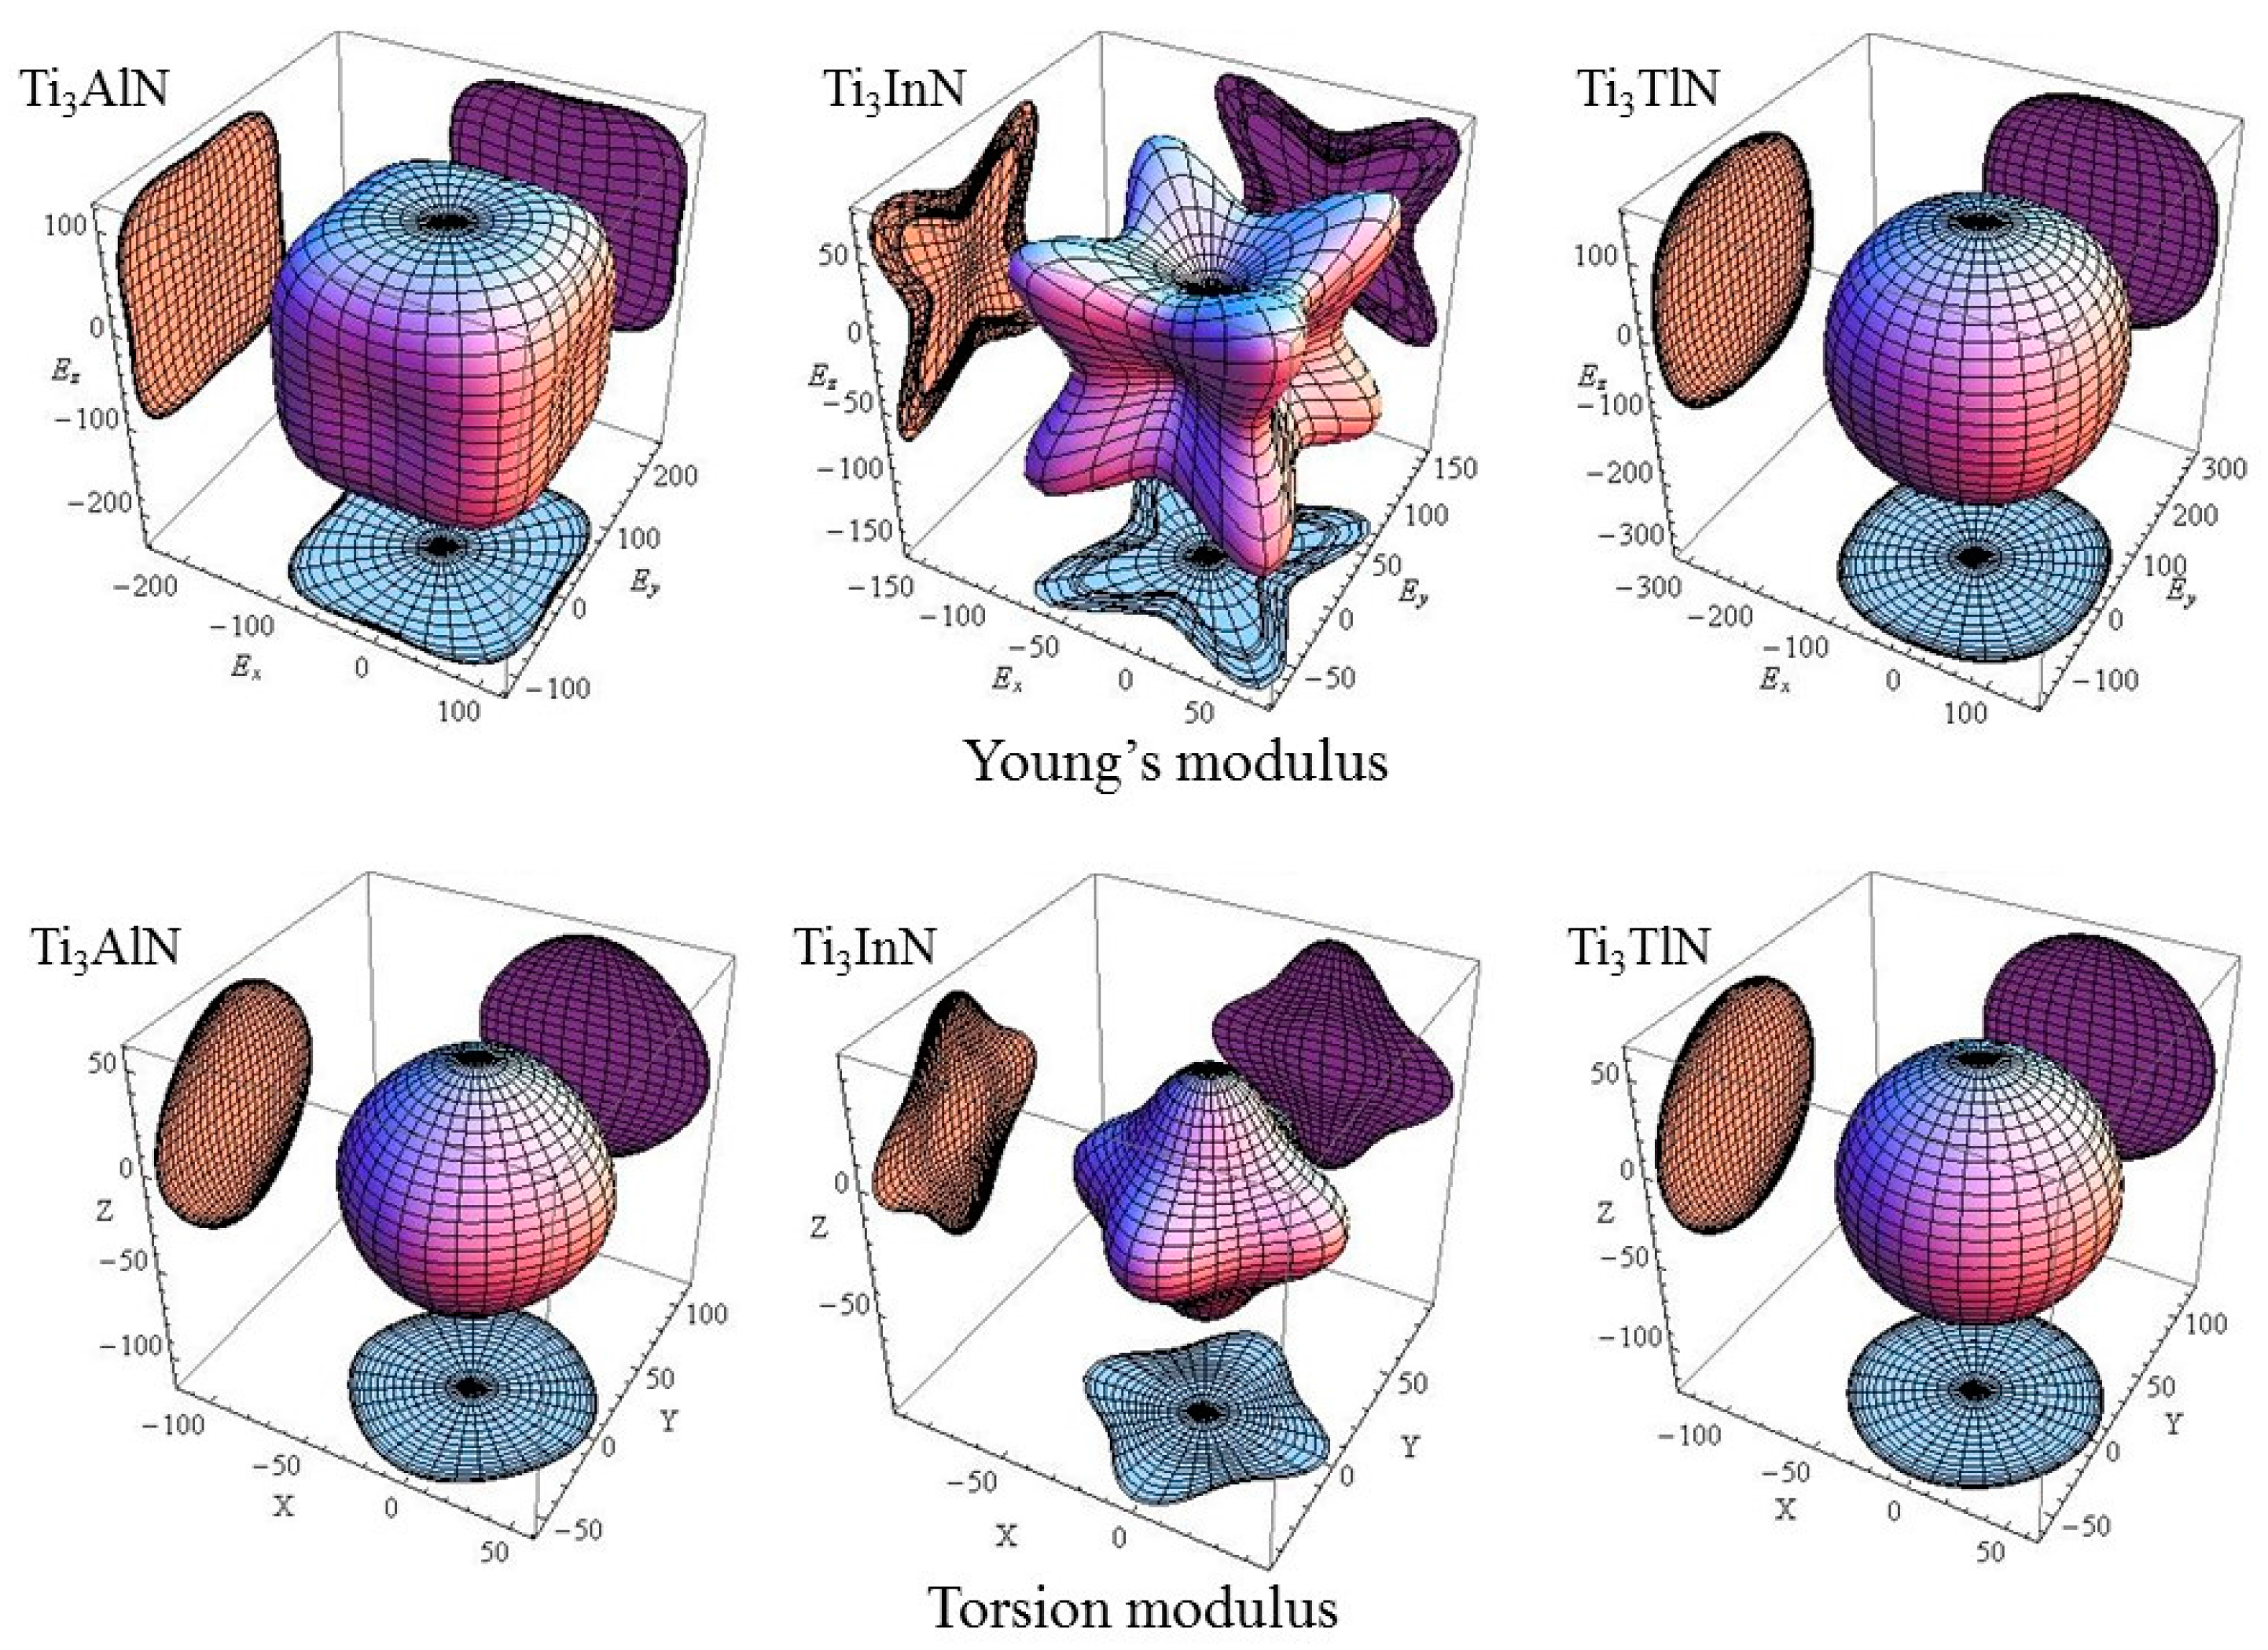
To observe the change in elastic modulus of each cell in different crystal orientations, the Young’s modulus of Ti
3AN in full space is shown in
Figure 2. In addition, the calculation formula is as follows [
45]:
Here,
Sij is the elastic compliance coefficient; Ti
3AN has three independent elastic compliances, which are
S11 =
S22 =
S33,
S44 =
S55 =
S66, and
S12 =
S13 =
S23, and the rest are zero. In addition,
l1,
l2, and
l3 are the direction cosines (
, where a larger
leads to a larger
E. However, the shear modulus is determined by two factors. One is the force-exerting plane, and the other is the force-exerting direction. The latter has infinite possibility on the plane. Therefore, the shear modulus cannot be plotted in 3D space. However, the torsion modulus can be plotted, which is the average shear modulus over all possible directions.
Figure 2 shows the torsion modulus [
46], and the calculation formulas are as follows:
The calculated values of
E and
T in the direction of [100], [110], and [111] are listed in
Table 2.
In
Figure 2, the plots of the Young’s modulus and torsion modulus of Ti
3AlN, Ti
3InN, and Ti
3TlN are remarkably different in full space. For Ti
3AlN, the plot of the Young’s modulus is similar to a cube and shows the minimum Young’s modulus in the [100] direction, followed by the [110] and [111] directions. The plot of the torsion modulus of Ti
3AlN looks like an octahedron, indicating that Ti
3AlN has a minimum torsion modulus in the [111] direction, followed by the [110] and [100] directions. For Ti
3InN, the diagrams are distinct. It is obvious that Ti
3InN has a maximum Young’s modulus and minimum torsion modulus in the [111] direction, followed by the values in the [110] and [100] direction, respectively. For Ti
3TlN, the Young’s modulus and torsion modulus have relatively similar diagrams, which indicates slight anisotropy. In general, the anisotropy of Ti
3AN increases in the order of Ti
3TlN→Ti
3AlN→Ti
3InN.
3.2. Electronic Structures
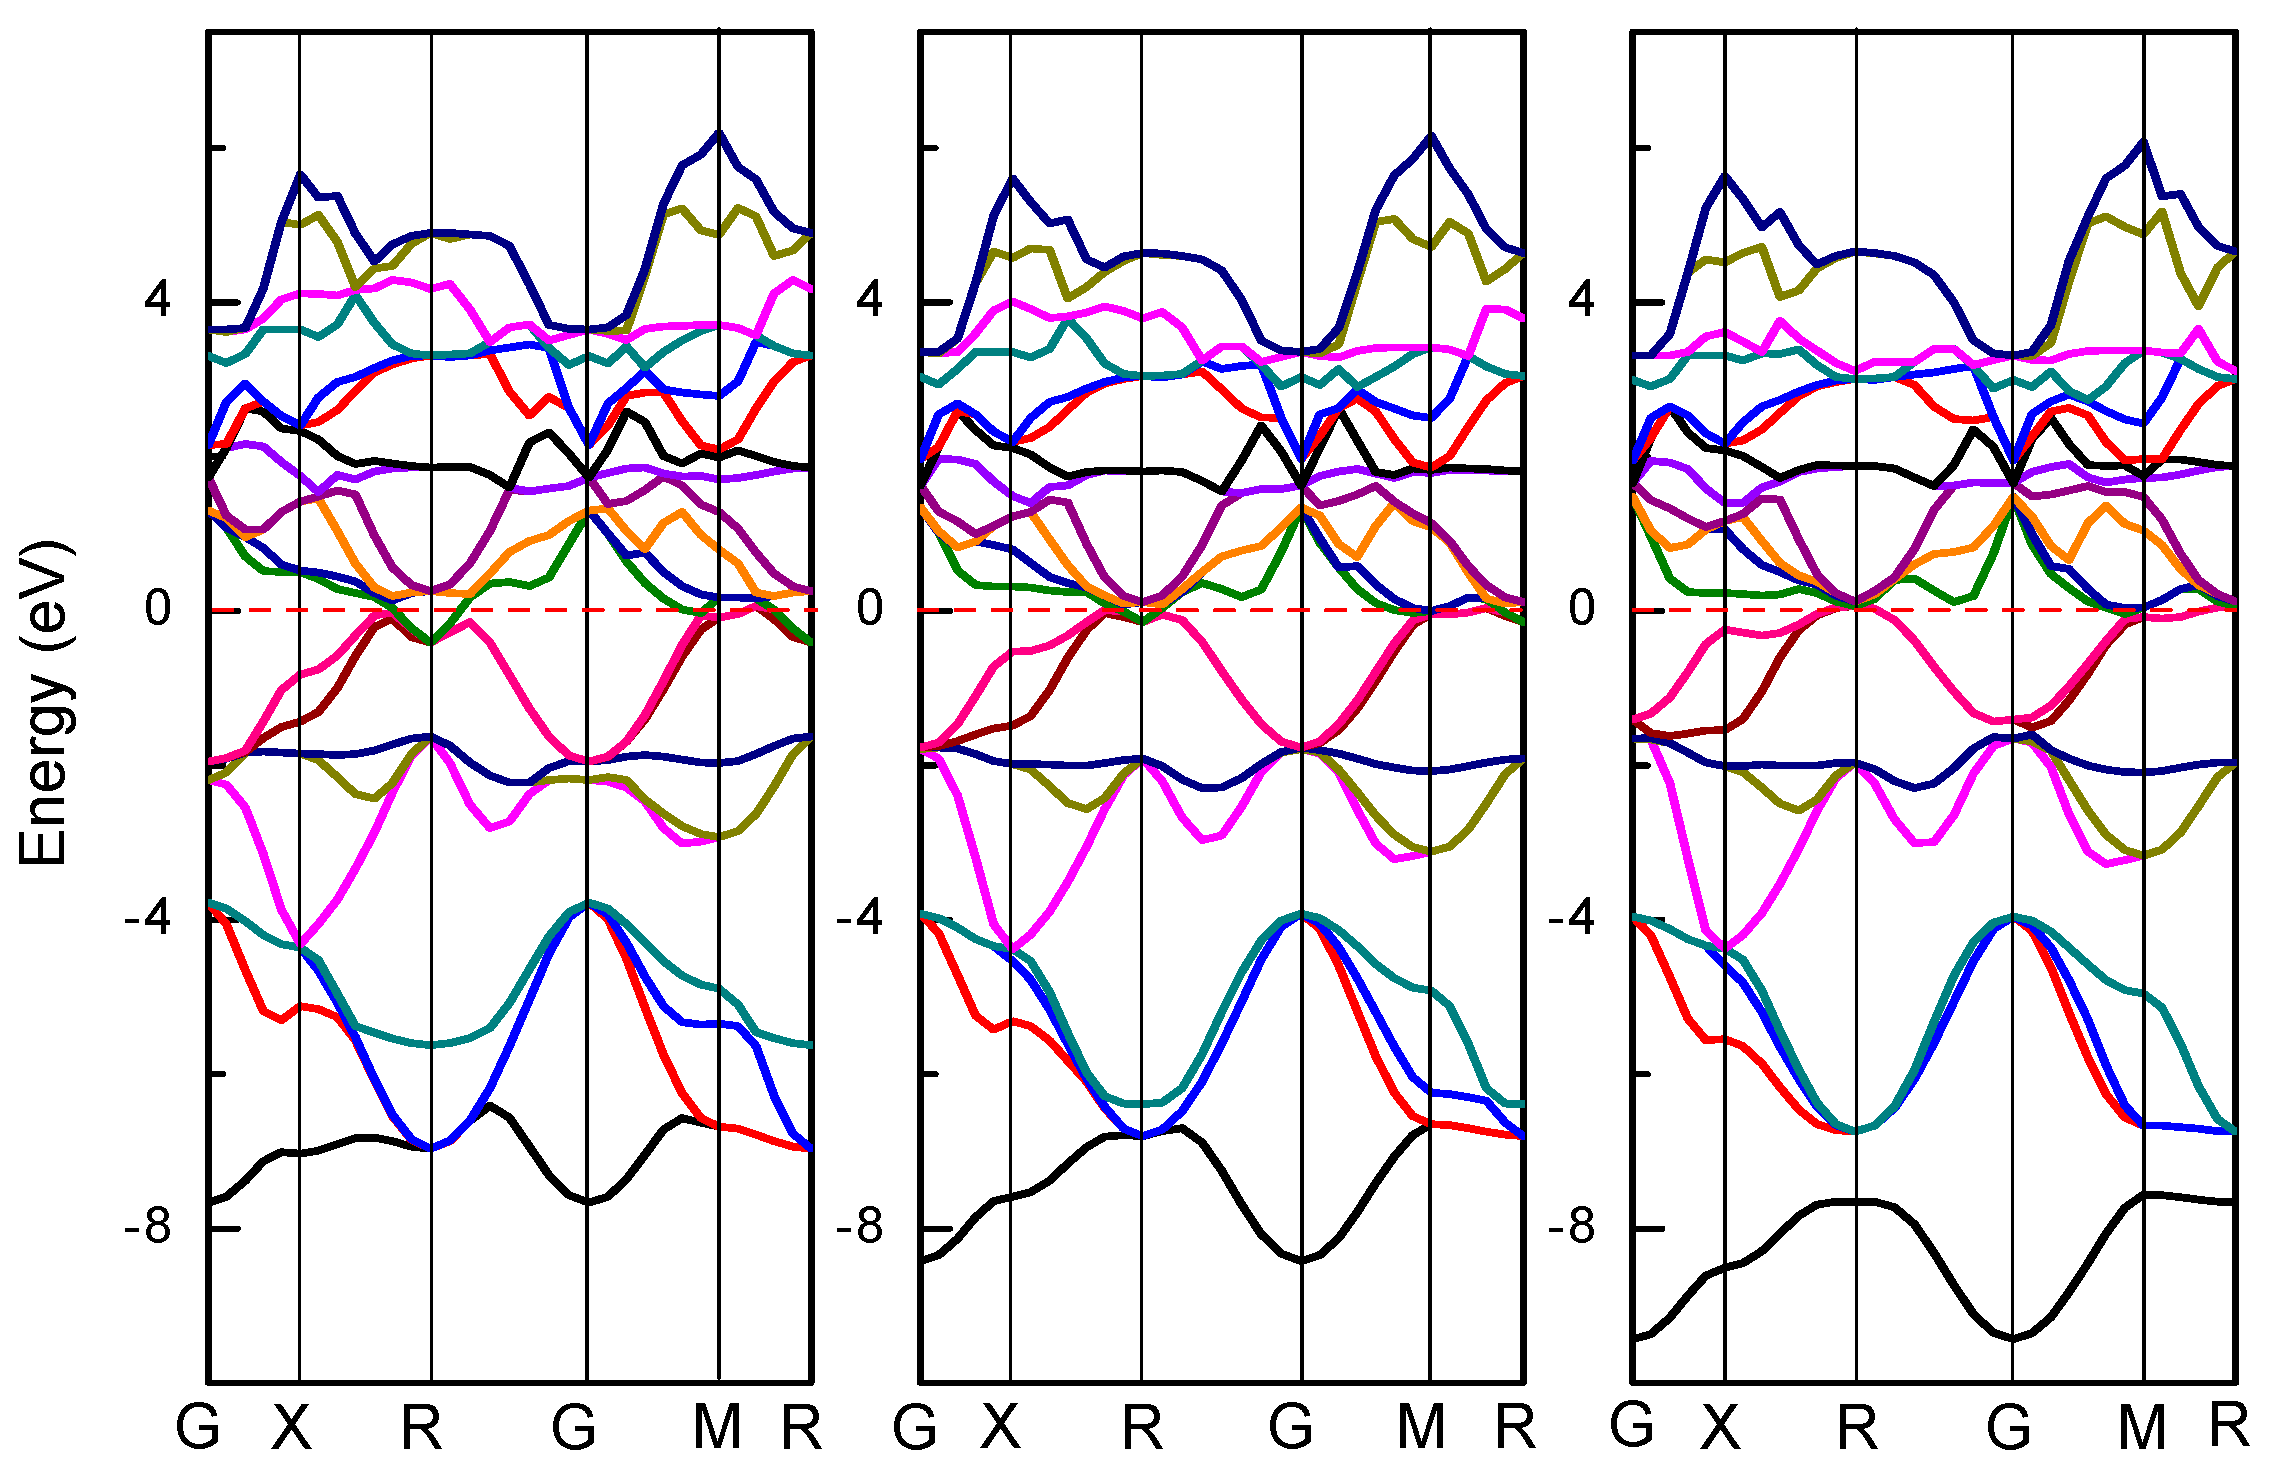
To understand the electronic structure, the energy band structure of Ti
3AlN, Ti
3InN, and Ti
3TlN were calculated. The band structures of Ti
3AN are depicted in
Figure 3. The red dotted lines represent the Fermi energy levels. The characteristics of the electrons near the Fermi surface primarily determine the properties of the materials. As shown in
Figure 3, the energy band structures of the three compounds are very similar. In these band structures, which have no energy gaps, the excitation of energy bands from the valence band to the conduction band occurs across the Fermi level, indicating the existence of free electrons. Therefore, all three compounds have metal-like conductive properties.
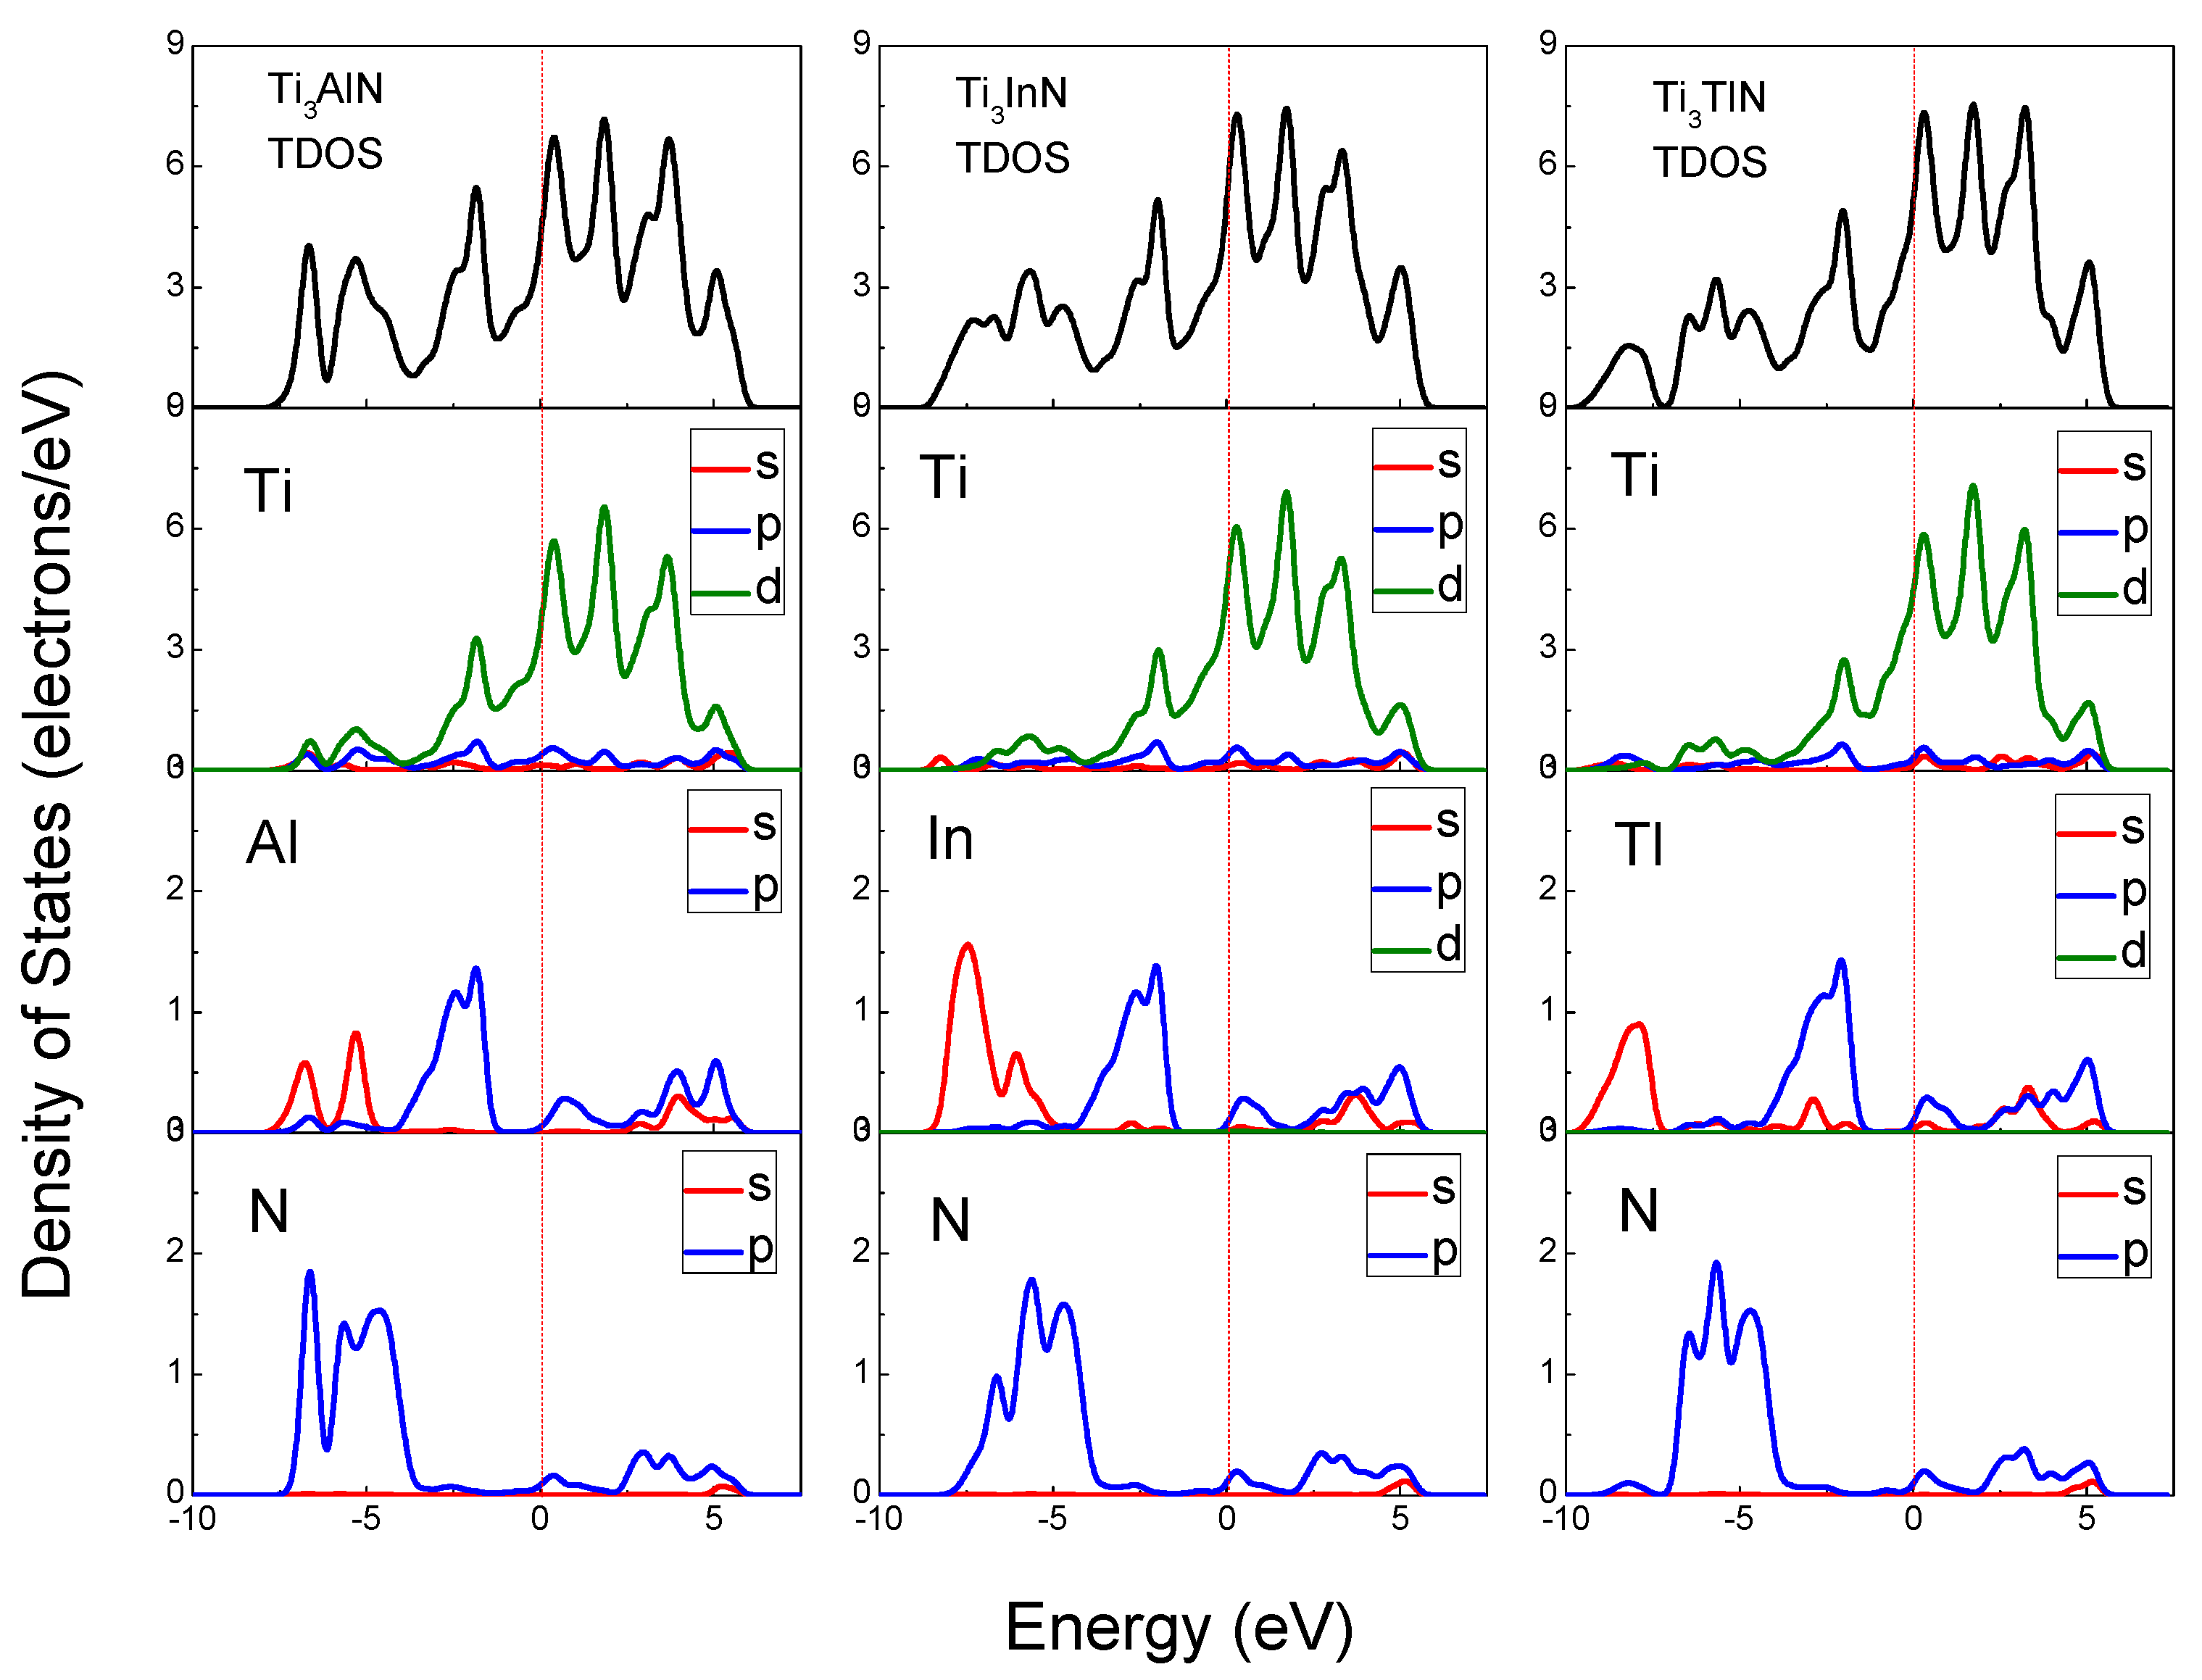
The total density of states (TDOS) and partial density of states (PDOS) of Ti
3AlN, Ti
3InN, and Ti
3TlN are shown in
Figure 4 and reveal the composition of the electronic states in the energy band structure. The origin of the band structure spectra is due to A s, A p, and N p states, with contributions from Ti s, Ti p, and Ti d states in the energy range of −9.2 to 6.5 eV. From the Fermi level to 6.5 eV, the band structure is originally derived from the A p and Ti d states. The Ti d states remain the majority at the Fermi level; therefore, the main part of the electrical conductivity is due to the d electrons of the transition metal Ti. On the left side of the Fermi level, the band structure spectra are mainly derived from Ti d states hybridized with A s, A p, A d, N s, and N p electrons. The peaks located near −5 eV and 2 eV correspond to the Ti 3d and N 2p states. The hybridization of the Ti d states with the N s and N p states suggests a strong covalent bonding contribution in the Ti
3AN compounds, which corresponds to the Ti-N bonds in the lattice. The density of states of the hybridized peaks near −5 eV is mainly attributed to the 2p states of the N atoms, whereas the d states of the Ti atoms contributed less. For the peaks near 2 eV, the d states of the Ti atoms have major contributions, whereas the contributions from the N atoms are small. It is clearly observed that all PDOSs of the Ti atoms are significantly larger than those of the N atoms for the hybridized peaks near −5 eV and 2 eV, and the calculated Hirshfeld analysis shows that the Hirshfeld charge of N atoms for all the three compounds is −0.34, in contrast, the Hirshfeld charge of Ti atoms is positive (0.04 for Ti
3AlN, 0.07 for Ti
3InN, and 0.06 for Ti
3TlN), thus, the Ti-N bonds exhibit some ionicity [
47]. And in the Mulliken’s population analysis, the bond population of Ti-N bonds are all positive (as shown in
Table 3), indicating the covalency of the Ti-N bonds [
48]. In conclusion, the electronic structures of Ti
3AN have been proven to be a mixture of metallicity, covalency, and ionicity. Therefore, these compounds present the characteristics of both metals and ceramics, such as electrical conductivity and oxidation resistance.
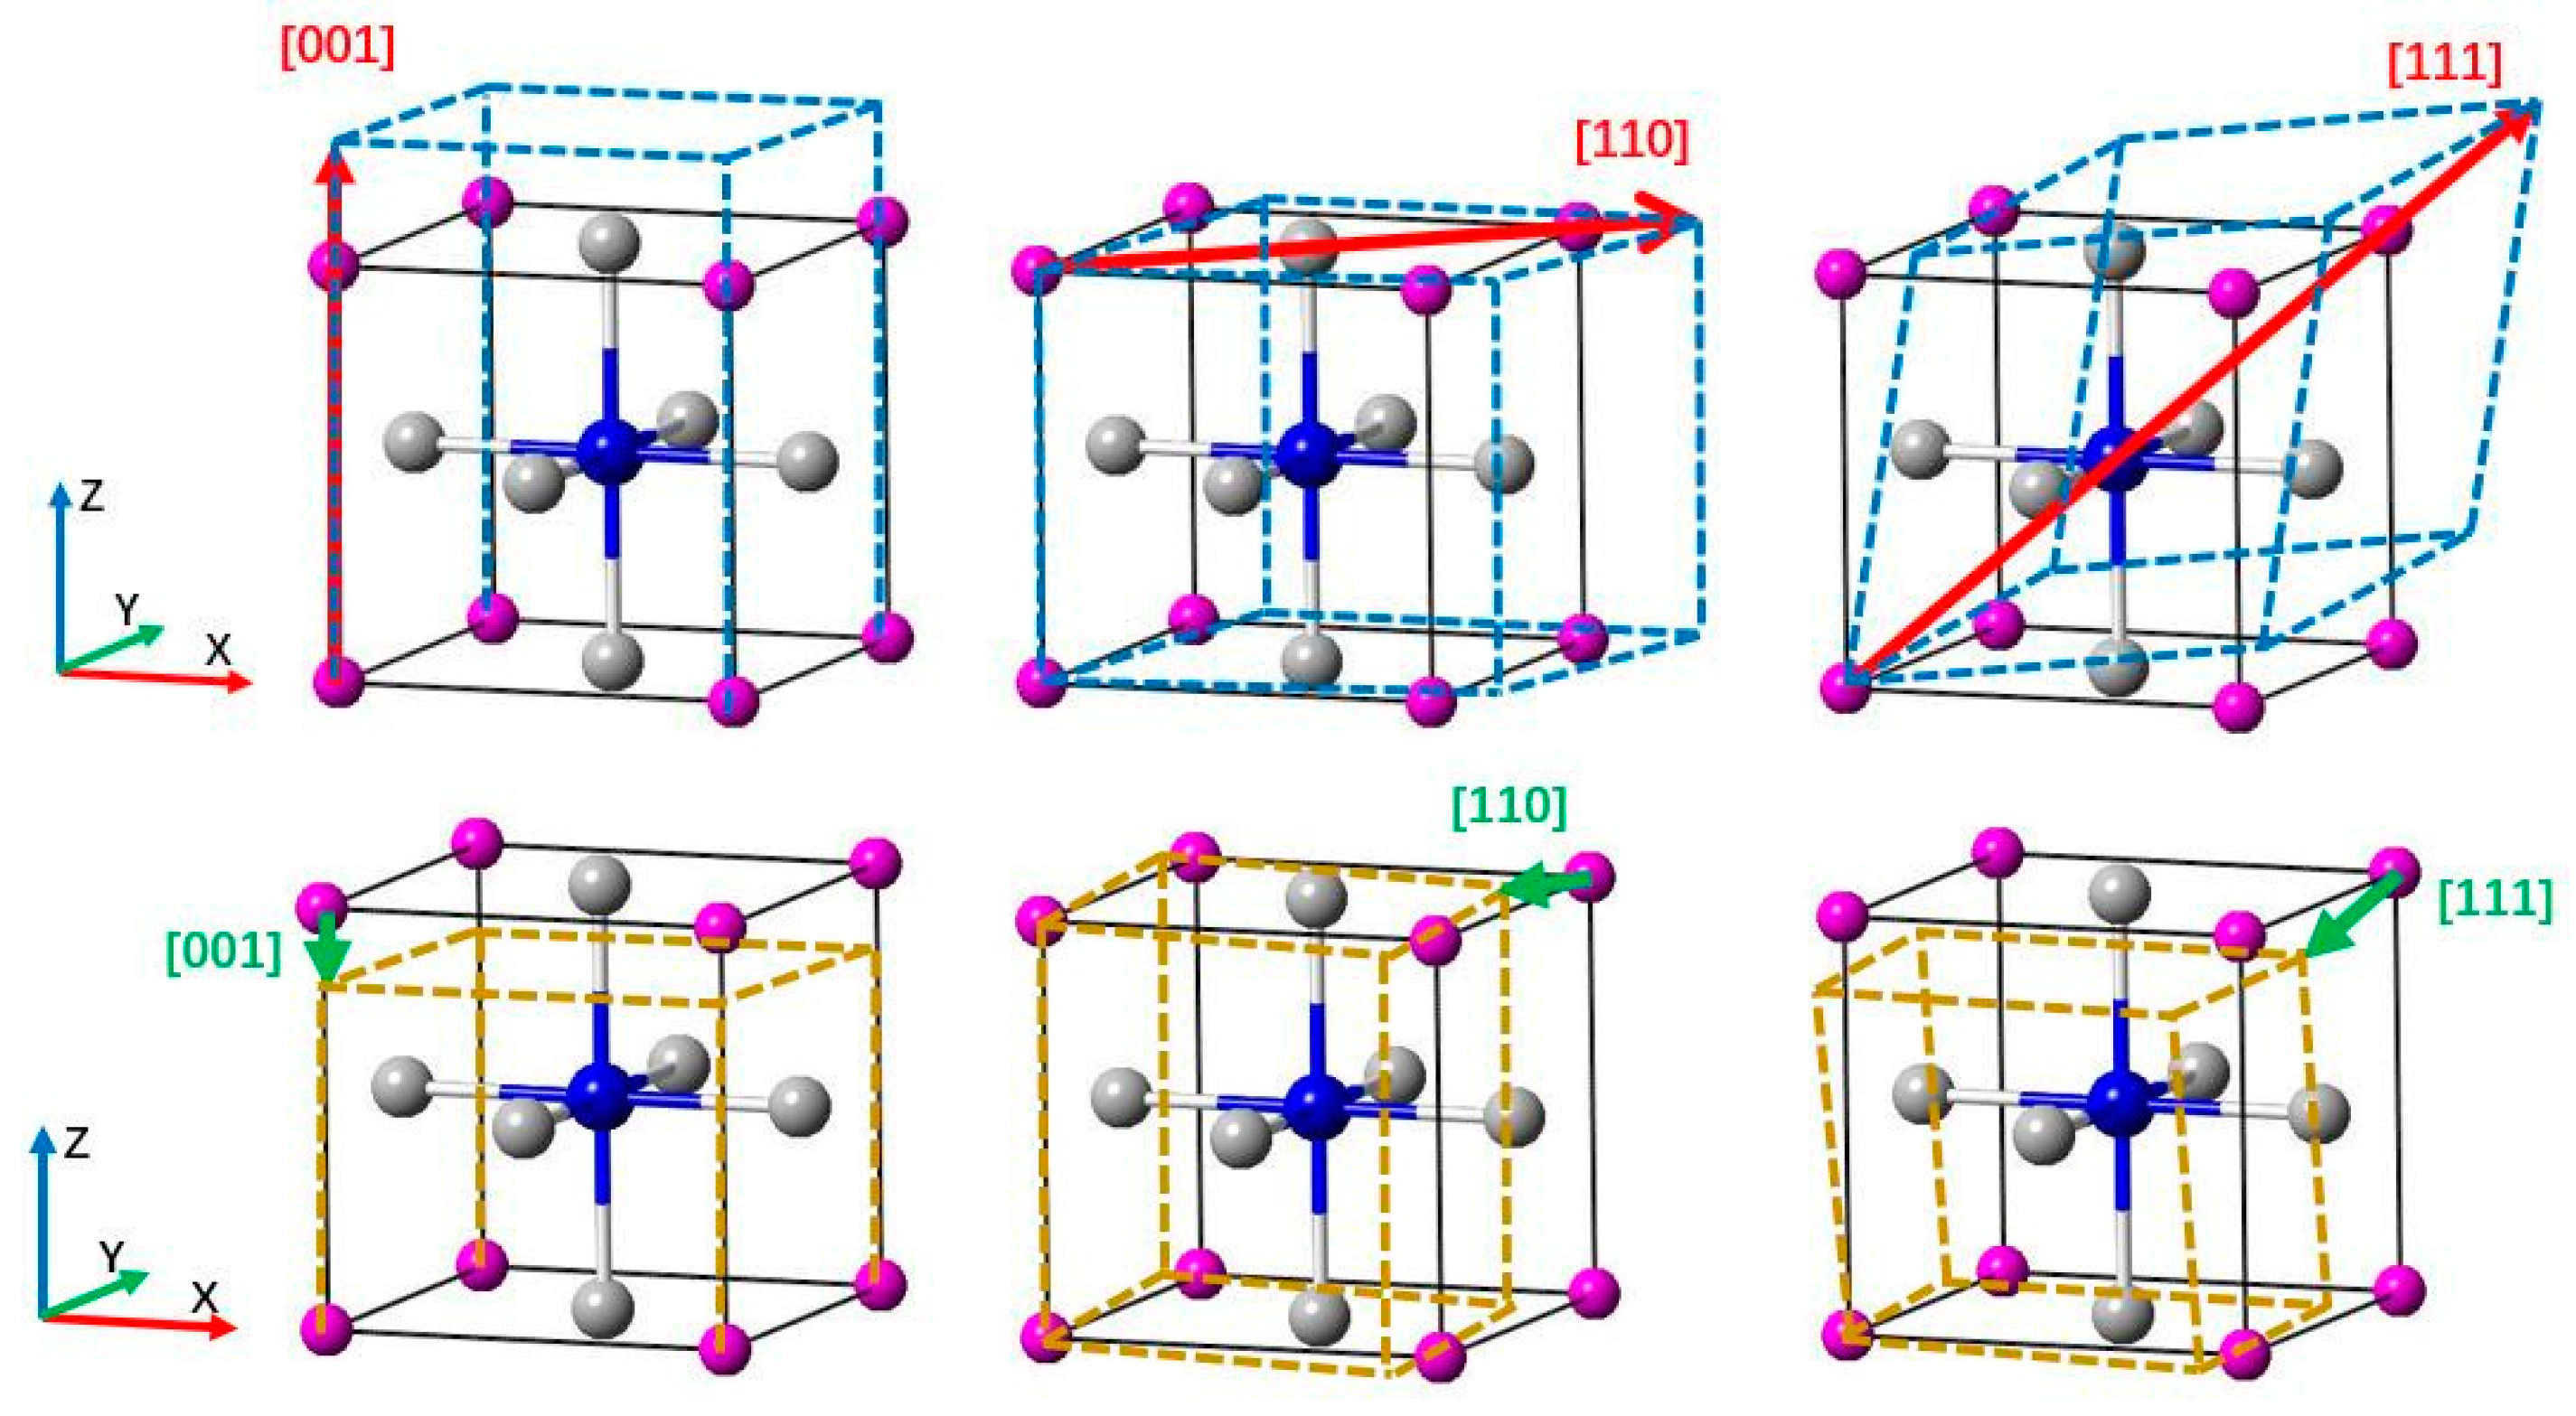
3.3. Deformation Modes
We calculated the tensile stress-strain curve in the [001], [110], and [111] crystal orientations to study the deformation mechanism of Ti
3AN. With tensile loading, the materials usually experience a variation from the elastic region to the unstable region and finally fracture as the strain increases. When the elastic deformation reaches its limit, a turning point appears in the tensile curve, which means that the atoms break away from the pull of adjacent atoms and spontaneously slide from the original lattice position to a new one to attain a minimum total energy in the system [
49]. The diagrams of tension and compression are shown in
Figure 5. In addition, the stress-strain curves are shown in
Figure 6. Notably, these figures are plotted with data calculated by the LDA method, which is used hereafter.
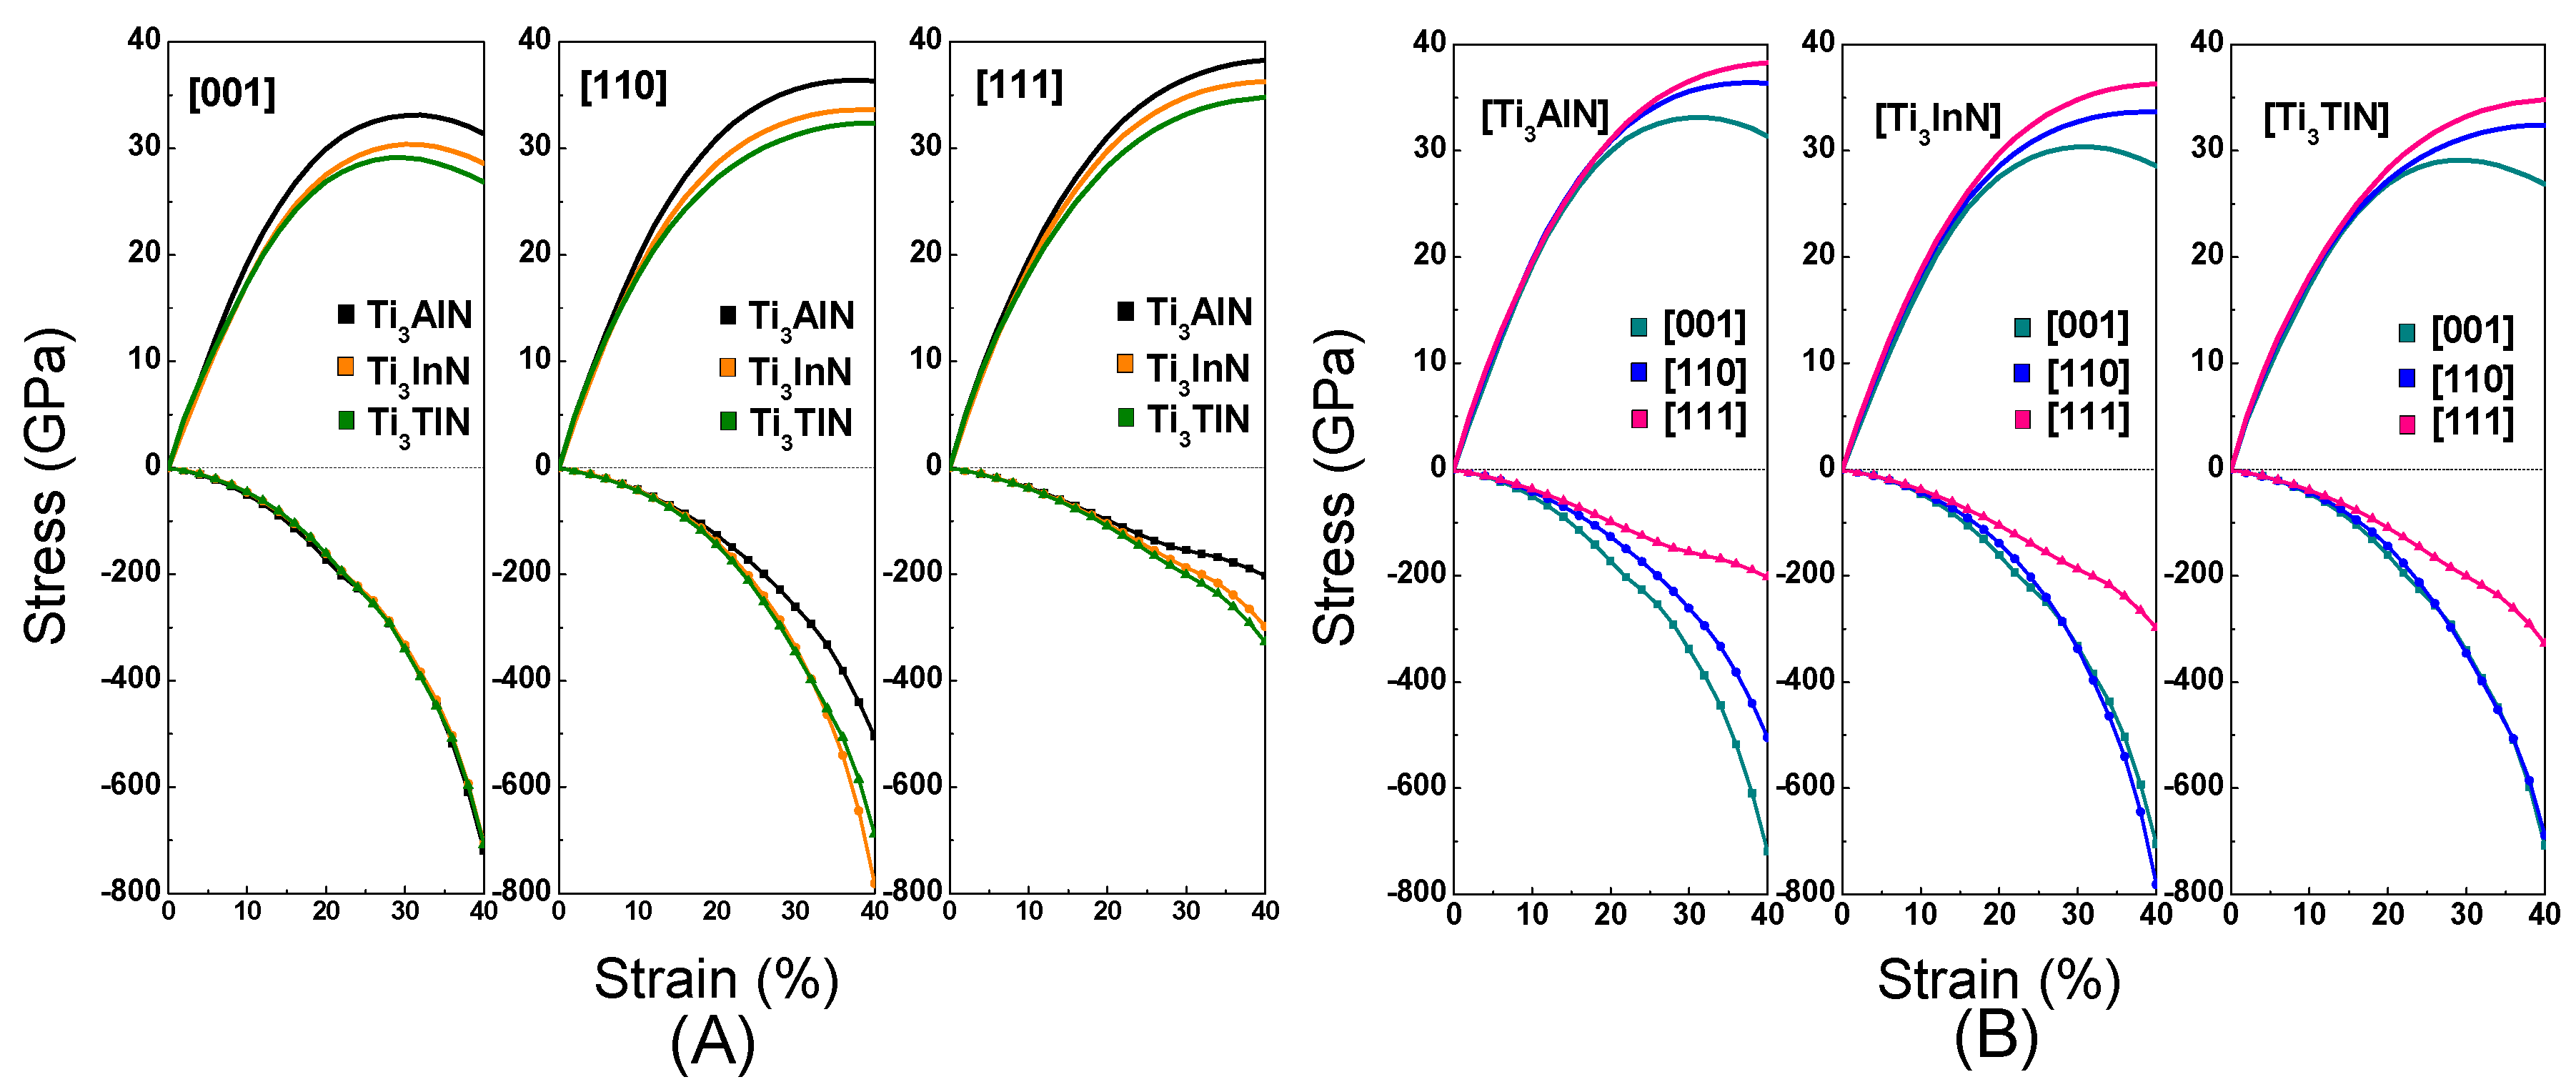
Figure 6A shows the tension and compression stress-strain curves in the [001], [110], and [111] crystal orientations for Ti
3AN. Notably, the Ti
3AN samples in the [001] orientation show a variation from the elastic region to the unstable region and then fracture. The maximal tensile stresses, defined as the ideal tensile strength, equal 33.12 GPa, 30.37 GPa, and 29.12 GPa in the [001] crystal orientation for Ti
3AlN, Ti
3InN, and Ti
3TlN, corresponding to a strain of 32%, 30%, and 30%, respectively. Ti
3AlN presents the maximal tensile strength along the [001], [110], and [111] directions, and Ti
3AlN has a relatively broader elastic region in the [001] crystal orientation compared with Ti
3InN and Ti
3TlN. Thus, we can conclude that Ti
3AlN possesses the best ideal strength among the three compounds.
To achieve an increase in the compressive strain, the compressive stress was increased continuously. The three compounds show striking similarities when compressed along the [001] crystal orientation. However, the curves show differences when the compounds are compressed along the [110] and [111] crystal orientation. Ti3InN shows the most distinct shape under tension and compression.
Figure 6B shows the anisotropy in the stress-strain variation of Ti
3AN in different crystal orientations. The pattern shows differences in the shape of the curve, which means that the three compounds have different performances under tensile stress in the [001], [110], and [111] crystal orientations. In addition, the three compounds show the best mechanical performance when stretched along the [111] crystal orientation. The order is τ[111] > τ[110] > τ[001]. We suppose the cause of this behavior is the stretching along the [111] crystal orientation elongating more bonds. However, when we apply pressure to the three compounds in the three crystal orientations, the compression performance in the [111] orientation is relatively poor. In the [111] crystal orientation, the same compression can cause greater deformation. As is known, crystal slippage often occurs in the most densely packed crystal orientation, and as [111] is the most densely packed crystal orientation, this may be the reason for the poor performance in the [111] orientation under compression.
To produce the same strain, the pressure should be much greater than the tension, and the pressure tends to increase with an increase in strain. The chemical bonds in these compounds are stable, and there is a certain distance between the atoms in the compounds. Compressing the distance is more difficult than stretching the distance, which may be the cause of the phenomenon.
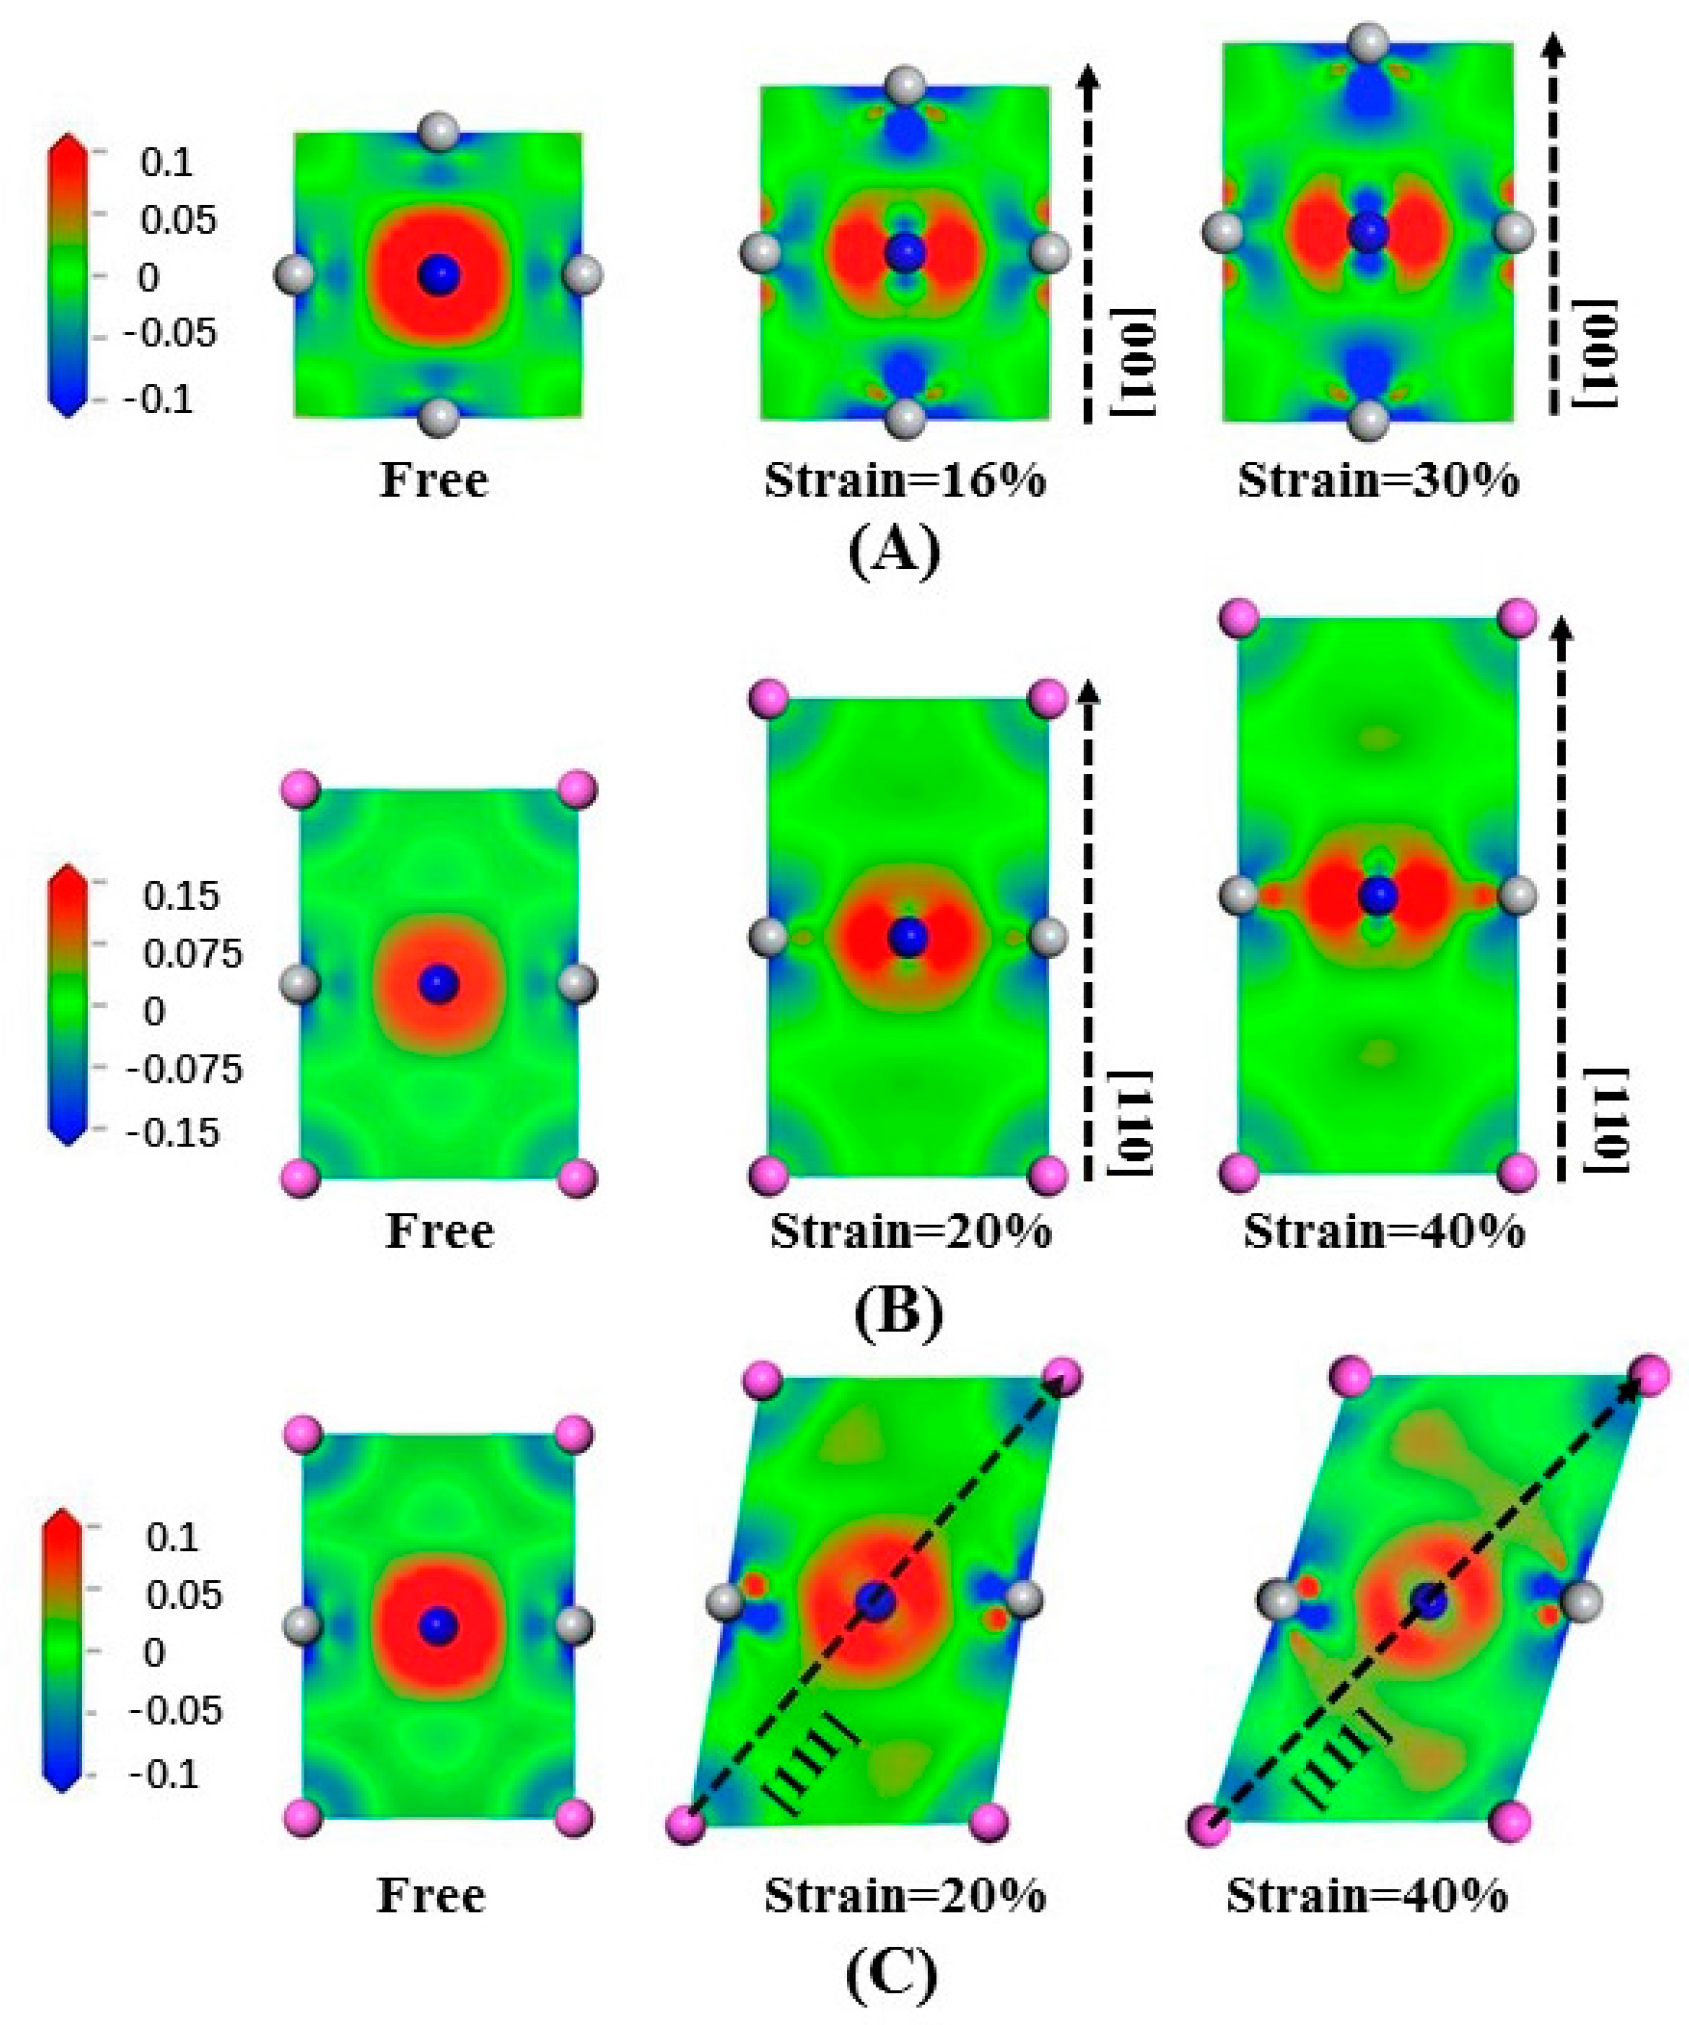
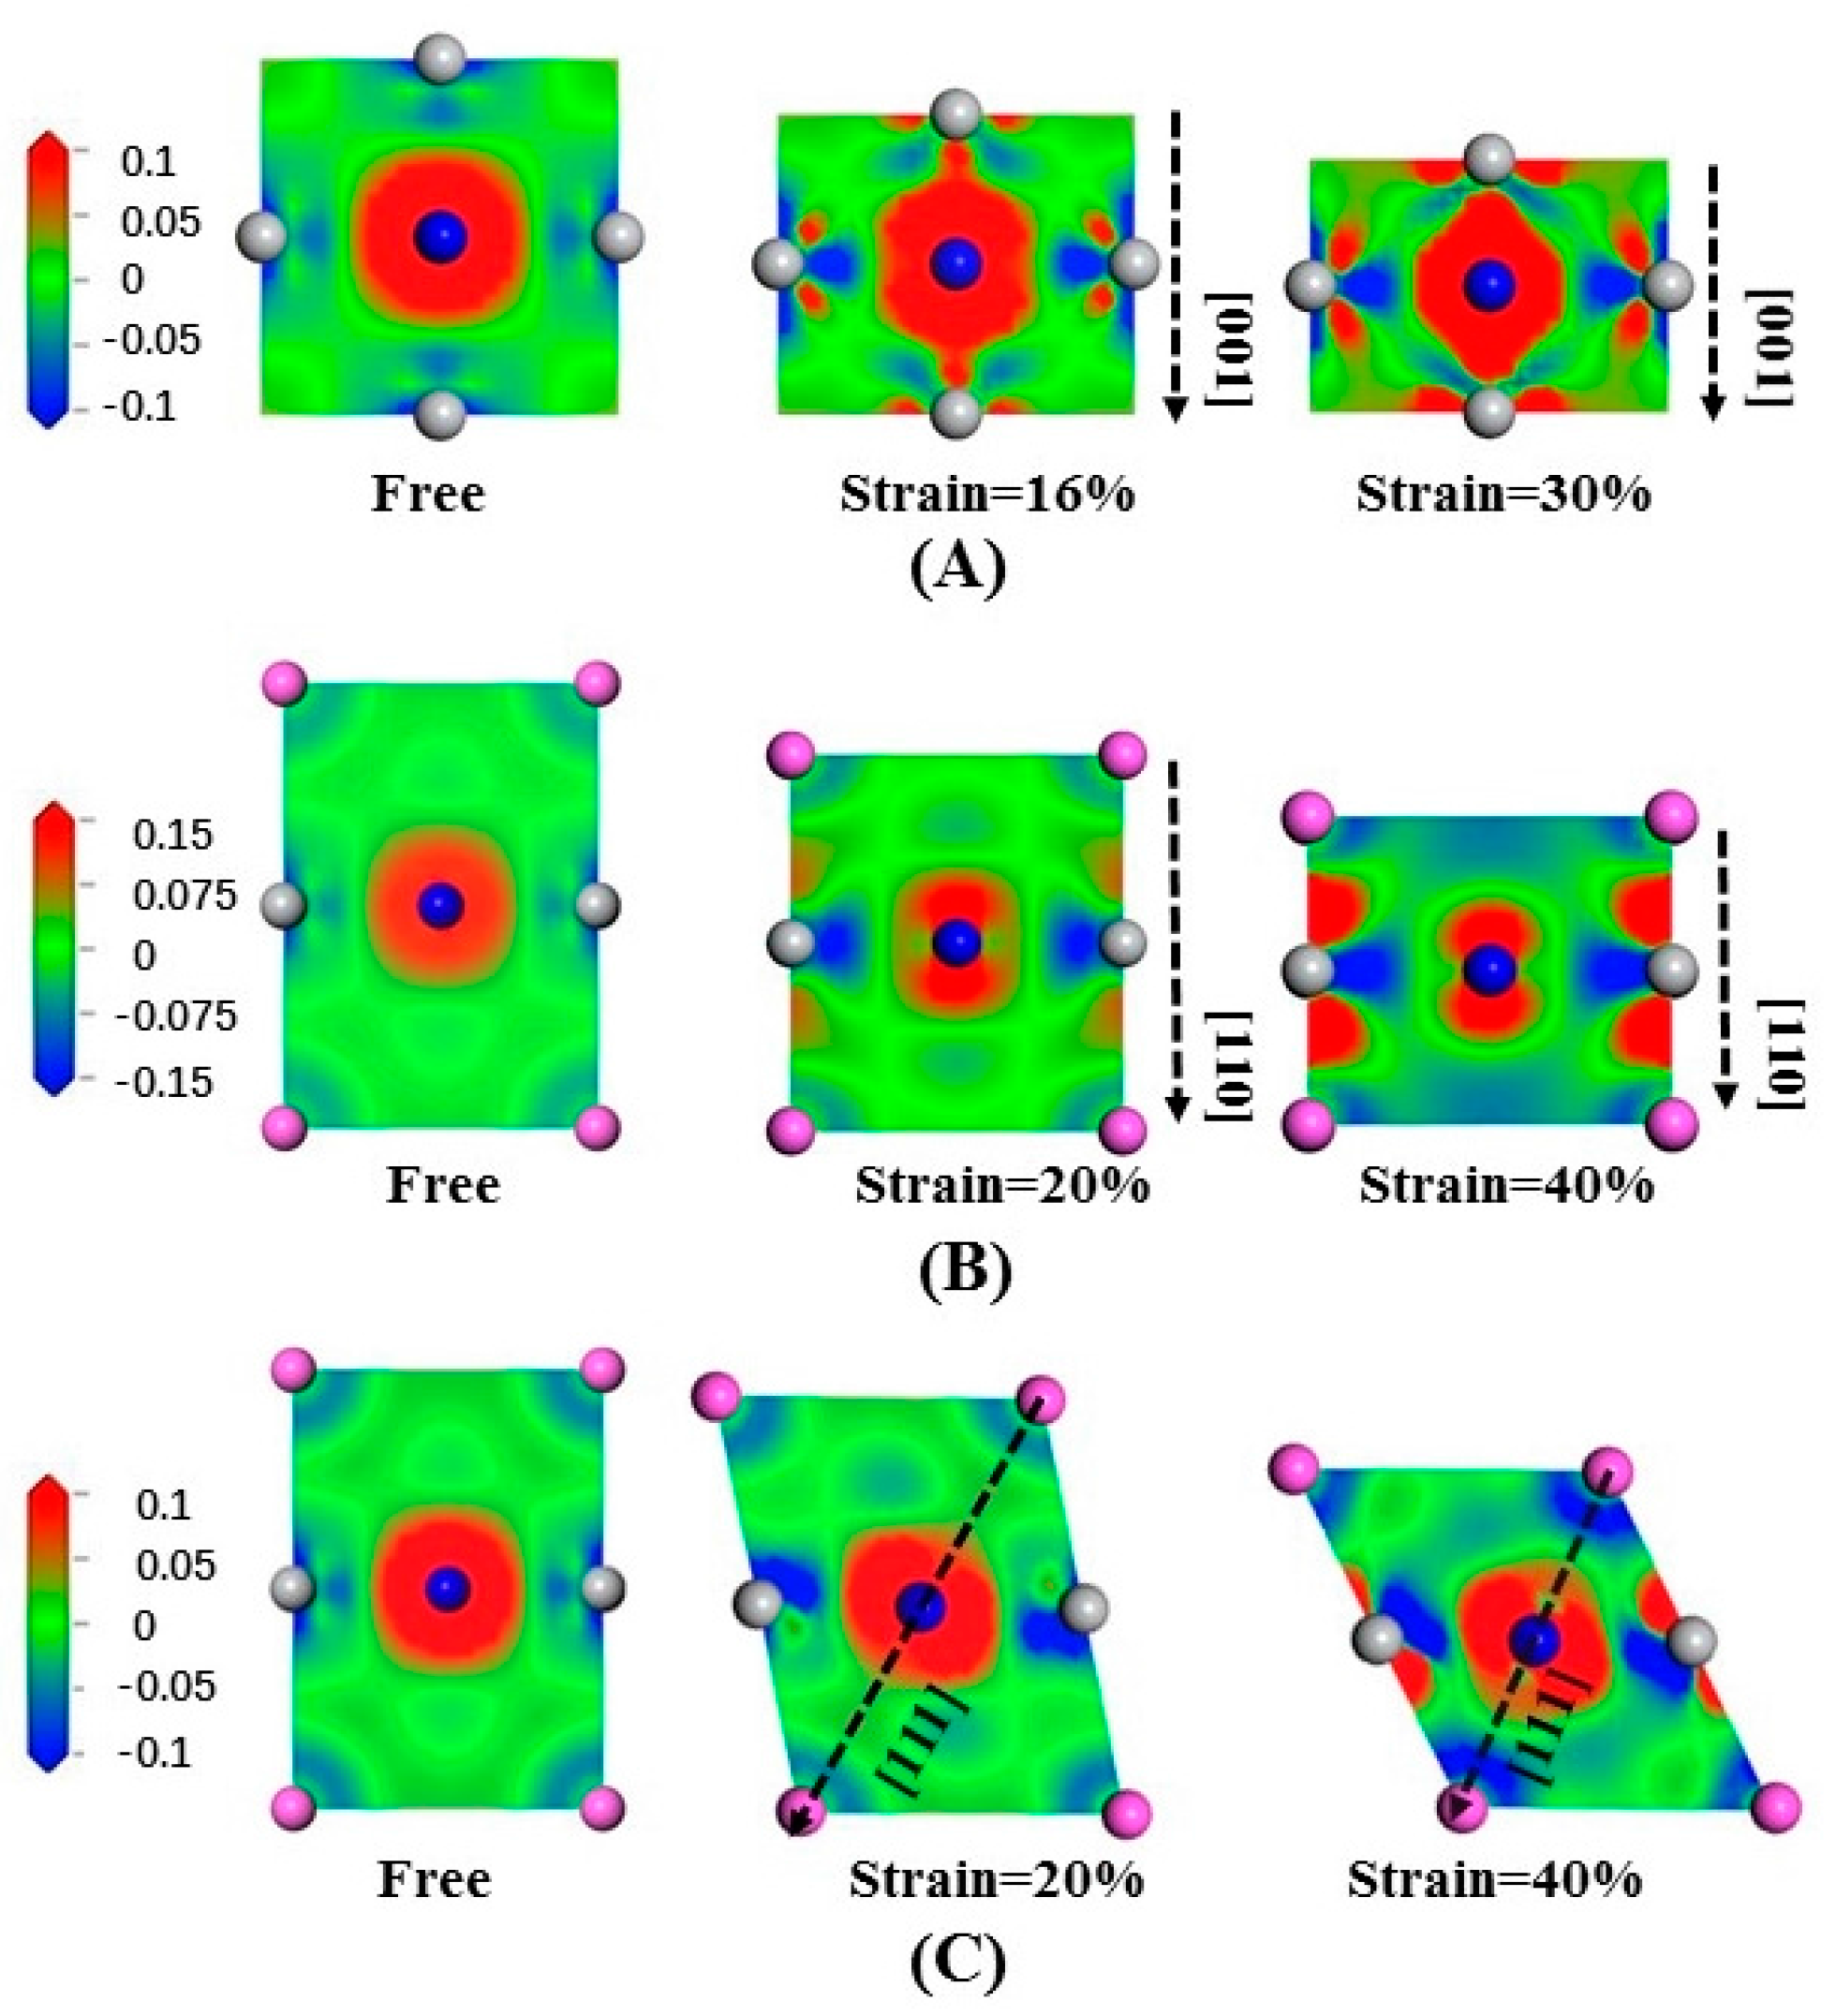
The electrons density distribution is a basic calculation quantity and can be obtained from calculations based on DFT. The electron density difference can be derived from the electrons density distribution. The electron density difference can express the redistribution of electrons after the construction of a system with atoms. The bonding situation can be obtained intuitively from the electron density difference. In addition, the electron density difference can further explain the tensile deformation mechanism of materials in the angle of electron transfer. The computational formula is as follows [
50]:
where
is the electron density of the compound system,
,
and
represent the electron density of Ti atoms, A-group atoms and N atoms in the free state, respectively.
Figure 7A illustrates the electron density difference in Ti
3AlN in slice along the (200) crystal plane stretched along [001]. We notice that the Ti-Ti bonds undergo slight changes. In contrast, the electron density distribution of the Ti-N bonds undergoes a dramatic change. Stretching in the [001] crystal orientation strengthens the effect of electron transfer by the Ti-N bonds in the (200) crystal plane, either along the direction parallel to the stretching direction or along the direction perpendicular to the stretching direction. For the Ti-N bonds along the stretching direction, the electrons tends to be away from the Ti atoms, while for the Ti-N bonds perpendicular to the stretching direction, the electrons tends to be close to the N atoms.
Figure 7B illustrates the electron density difference of Ti
3AlN in slice along the
plane stretched along [110] in order to illustrate the electron density arrangement. The Ti-Al bonds undergo slight changes, while the Ti-N bonds changed greatly. Stretching strengthens electron transfer in the transverse direction, and the electrons tend to keep close to the N atoms in the direction perpendicular to the stretching.
The electron density difference of tensile-deformed Ti
3AlN in slice along the
plane stretched along [111] is presented in
Figure 7C to illustrate the electron density arrangement. We can clearly notice the deformation of the cell under tensile strain. In addition, electrons transfer along the Ti-Al bonds in the stretching direction is strengthened, while electrons transfer in the perpendicular direction is weakened. Ti-N bonds maintain their toughness during the tensile stress process.
Figure 8 shows the electron density difference of Ti
3AlN under compression, where (A) is the slice of (200) compressed along [001]; (B) is the slice of
compressed along [110]; and (C) is the slice of
compressed along [111]. In
Figure 8A, in the direction perpendicular to compression, the electrons tend to stay away from the Ti atoms. In
Figure 8B, in the direction parallel to compression, the electrons tend to gather near the N and Ti atoms, but in the direction perpendicular to compression, the electrons tend to be away from the Ti atoms. When compressed along [111], the Ti-N bonds are greatly changed, and the electrons tend to stay away from the Al and Ti atoms in the direction parallel to the compression and be close to the N atoms in the direction perpendicular to the compression, as shown in
Figure 8C.
By analyzing the changes in the bonds during the deformation process, taking the same standard scale for both tension and compression, we find that when the same strain is obtained, the electron density difference changes immensely under compression. This may explain why compression requires much greater stress than tension. The features are the same for Ti3InN and Ti3TlN under tensile deformation, which is not presented here for brevity.
3.4. Hardness
Hardness is an important physical quantity for characterizing the resistance of solid materials to elastic and plastic deformation. In general, materials with greater hardness have better wear resistance. In addition, materials with low hardness may act as lubricants. In other words, hardness is an important indicator of the wear resistance of materials. Due to Ti
3AN simultaneously containing metallic bonding, ionic bonding, and covalent bonding, we can obtain the hardness of Ti
3AN by the following formulas [
51,
52,
53]:
in which
is the hardness,
is the hardness of the
bond,
is the calculated Mulliken population,
is the volume of the
bond,
is the bond length of the
bond,
is the number of
bonds.
The population number and bond length of Ti
3AN were calculated, and the values are listed in
Table 3. In addition, the calculated hardness of the three compounds is also listed in
Table 3. Ti
3InN has the lowest hardness compared with Ti
3AlN and Ti
3TlN, which is 6.87 GPa. By analyzing the bonds in the Ti
3AN lattice, the bond length, the population and the bond volume of the Ti-N bonds, no significant difference was found in the three compounds. When examining the values of the metallic bonds, we can clearly see that the bond lengths, populations, and bond volumes are similar, except for the population of the Ti-Ti bonds in Ti
3InN. The population of the metal-metal bond in Ti
3InN is obviously low compared with the ones in Ti
3AlN and Ti
3TlN, which is 0.33. We suppose this phenomenon to be the reason for the anomalously low bond hardness of the Ti-Ti bonds in Ti
3InN, which leads to a reduction in the hardness of Ti
3InN. In other words, the high bond population of Ti
3AN suggests high hardness. The calculated hardness is 10.73 GPa and 11.14 GPa for Ti
3AlN and Ti
3TlN, respectively. We can see that the calculated results for Ti
3AlC are in agreement with the experimental data, and Ti
3AlC has similar lattice structure and bonds with Ti
3AN, thus, our calculations and hardness formulas for Ti
3AN are reliable.
3.5. Anisotropy of the Minimum Thermal Conductivity
Lattice vibrations determine many physical properties of a crystal. In addition, lattice vibrations can be reflected by the phonon system. Acoustic waves are key physical quantities with significant function in studying the thermal conductivity of a material. We calculated the wave speed of the transverse and longitudinal acoustic waves for Ti
3AN in the [100], [110], and [111] crystal orientations.
Table 4 shows the results, and the calculation formulas are as follows [
55]:
where
Cij is the elastic constant and
is the density. For a cubic crystal system, there are two dispersion curves between Γ[000] and Χ[100] in the phonon spectrum, which are correlated to a non-degenerate longitudinal acoustic branch and a doubly degenerate transverse acoustic branch, respectively [
55]. Therefore, the two transverse acoustic waves along [100] have the same wave speed. The acoustic wave in [111] is similar to that in [100]. In [110], all of the phonon dispersion curves are in the non-degenerate state, and thus the two transverse acoustic waves propagate at different wave speeds. The distributions of the two transverse acoustic waves in the phonon spectrum significantly differ. The calculated results of CaO are also shown in
Table 4, and the calculated wave speed is in good agreement with experimental values, indicating that the calculation method is reliable.
The acoustic wave speed closely relates to the thermal conductivity of a material. At high temperature, the thermal conductivity decreases with increasing temperature [
55]. Therefore, determining the minimum value of the thermal conductivity at high temperature is important for exploring the application of materials under extreme conditions. We calculated the thermal conductivity of polycrystalline Ti
3AN by the Clark model and Cahill model [
55,
57].
where
E is the Young’s modulus,
ρ is the density,
is Boltzmann’s constant,
is the average mass for an atom in the lattice,
is the molar mass of the molecule,
is the number of atoms,
is Avogadro’s constant,
is the number of atoms per unit volume, and
and
are the wave speeds for the transverse acoustic wave and longitudinal acoustic wave, respectively. We calculated the lower limit of the lattice thermal conductivity based on the two models, and the results are shown in
Table 5. The high-temperature thermal conductivity decreased in the order of Ti
3AlN→Ti
3TlN→Ti
3InN. The accuracy of the calculated results for ZrO
2 becomes quite satisfactory with the experimental data in
Table 5, which supplies the safeguard for the following studies.
In contrast to the Clark model, the Cahill model is based on the wave speed of the lattice vibration. In the formula,
and
correspond to the acoustic wave speeds along the crystal orientation. Therefore, we can calculate the thermal conductivity of the lattice in different lattice orientations. The alternative formula is as follows [
57]:
In this paper, we calculated the minimum thermal conductivity of the three compounds in the [100], [110], and [111] direction. The detailed results are presented in
Table 6.
The difference in the wave speed of the acoustic wave along the different crystal orientations indicates the anisotropy in the thermal conductivity. As shown in
Table 6, the value of
,
[110] and
[111] are quite different; therefore, Ti
3AN has anisotropic thermal conductivity. For a crystal with isotropic thermal conductivity,
=
[110] = −
[111] =
. Thus, we can determine the degree of anisotropy in the thermal conductivity by comparing
(avg) = (
+
[110] +
[111])/3 and
[hkl]. The difference between
and
(avg),
[110], and
(avg), and
[111] and
(avg) are 0.36%, 0.14%, and 0.43% for Ti
3AlN, respectively; those for Ti
3InN are 0.53%, 0.74%, and 0.21%, respectively; and those for Ti
3TlN are 0.1%, 0, and 0.19%, respectively. Thus, the degree of anisotropy in the thermal conductivity shows a general increase in the order of Ti
3TlN→Ti
3AlN→Ti
3InN. All three compounds have relatively low thermal conductivity, and the thermal conductivity meets the requirements of heat-insulator materials.


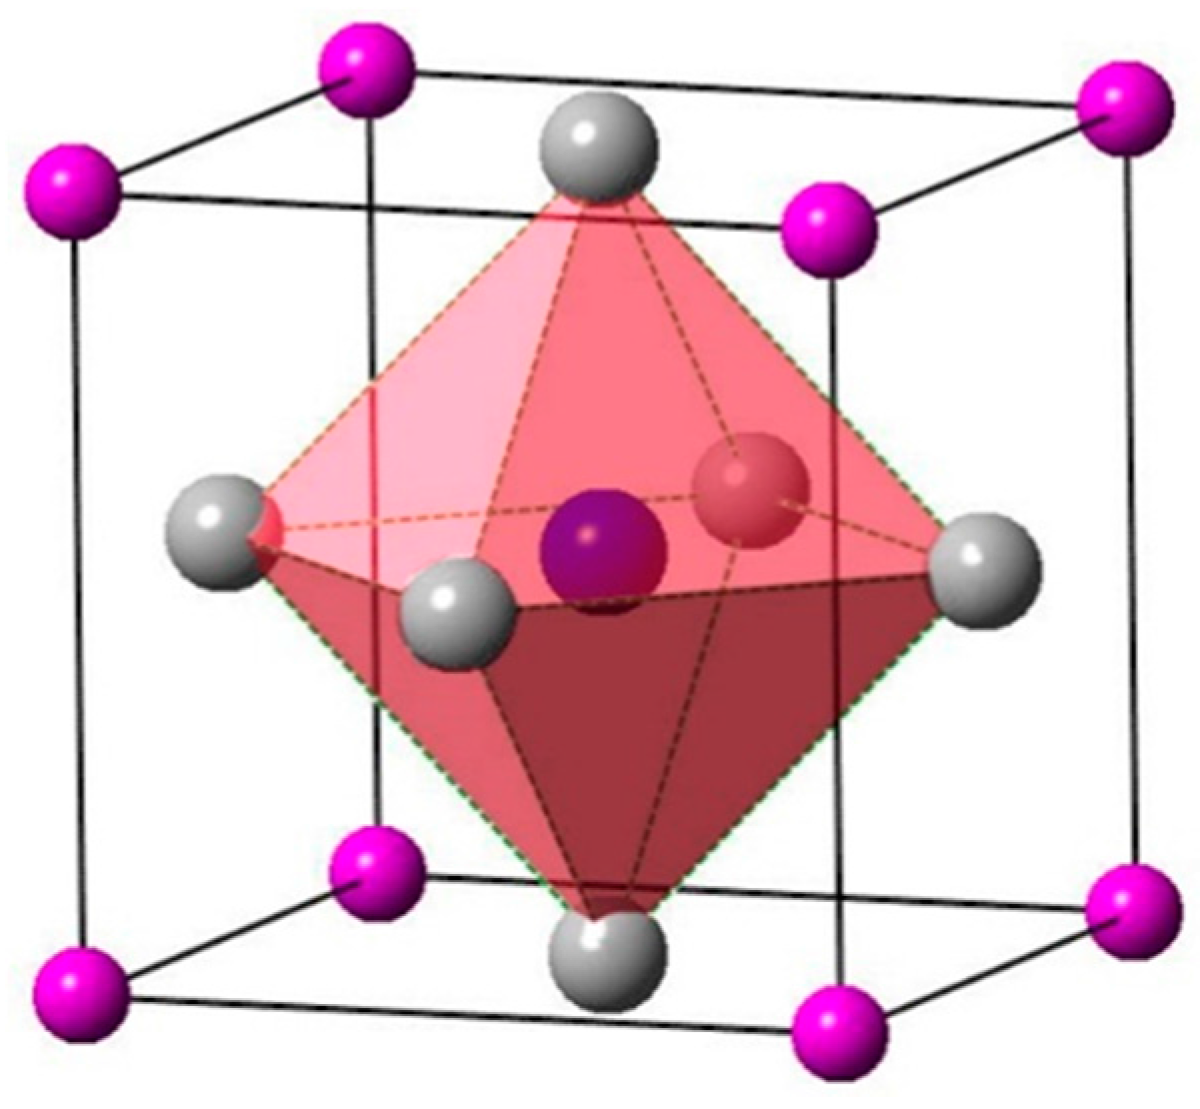
 : Ti atoms,
  : IIIA atoms,
  : N atom (located in the body center).


