1. Introduction
Due to the many incentive programs that have been approved in the different countries where solar PV has been developed, PV generation has become one the most encouraged sources of energy generation [
1]. In this context, there is a contrast between the various European PV markets. One of the main policy differences across the European countries is the possibility of consuming generated energy after it has been measured in the output meter (i.e., feed-in tariff (FiT)) [
2]. When this option is enabled along with some kind of incentive scheme, the owner’s cost per kilowatt-hour of energy consumed can be cheaper than that provided by the distributor network operator (DNO), as this system remunerates the owner for every kilowatt-hour generated. Most incentive schemes disappear over time [
3] as their countries’ markets grow. Therefore, the purpose of this paper is to start developing models to clarify the benefits associated with consuming all of the energy that a PV installation produces, even without financial support schemes such as FiT or a renewables obligation certificate (ROC). Assuming that grid parity is achieved, solar PV generation energy can be sold through the grid at a price similar to its purchase price. This scenario gives the energy provider multiple business opportunities, such as becoming a residential or commercial energy distributor. This scheme would create multiple miniature DNOs. For residential schemes, the risk is clearly defined and is comparable to that of a mortgage. Additionally, economic fluctuations and financial stability can vary by country [
4]. Most of the developed countries in the world, including the United States, the United Kingdom, Italy, and Germany, are introducing self-consumption as their main solar PV development systems [
5]. For example, the United States has promoted the market for distributed PV using net metering and support policies [
6].
In the case of Spain, the decision to revoke the FiT [
7] and the significant increase of electricity prices can turn self-consumption into an attractive concept due to its financial savings and stability [
8,
9].
In terms of self-consumption, several authors have analysed PV systems, both economically and environmentally.
The effect of the demand profile’s temporal resolution in the design and economics of PV self-consumption systems was studied in [
10,
11], which determined that good results can be reached at temporal resolutions of between 5 and 60 min, although for the design of the storage system, it is advisable to use a relatively small temporal resolution (of at least 5 min). These studies show the need to continue investigating this topic.
Other authors have focused on the use of batteries, with some affirming that the use of batteries can favour the increase of self-consumption installations [
12]. Despite the high cost of these batteries, using them can be profitable if the price of electricity increases enough [
13]; if the consumer pays higher prices during peak demand hours, batteries can result in significant savings on the consumer’s electricity bill [
14]. The researcher in [
15] studied the effect that the application of demand-side management (DSM) programs, in combination with energy storage, had on the design of PV self-consumption systems, determining that no linear relation exists between electricity flows and storage capacity. Regarding DSM programs, the result obtained in [
16] showed that using batteries is more effective than implementing DSM programs to promote self-consumption. However, despite the possible economic benefits, the negative environmental effects associated with the use of batteries are not often considered [
17]. These negative environmental aspects, if they are considered and evaluated, could discourage the use of batteries in grid-connected systems.
Other studies about PV self-consumption systems have been conducted in various countries [
18,
19,
20,
21,
22]. The results achieved show that, in many cases, self-consumption is economically viable, although its profitability depends on the regulatory policies that exist in each country. As the types of applicable rates determine the profitability of these installations [
23], a proper normative regulation is needed to promote self-consumption [
24].
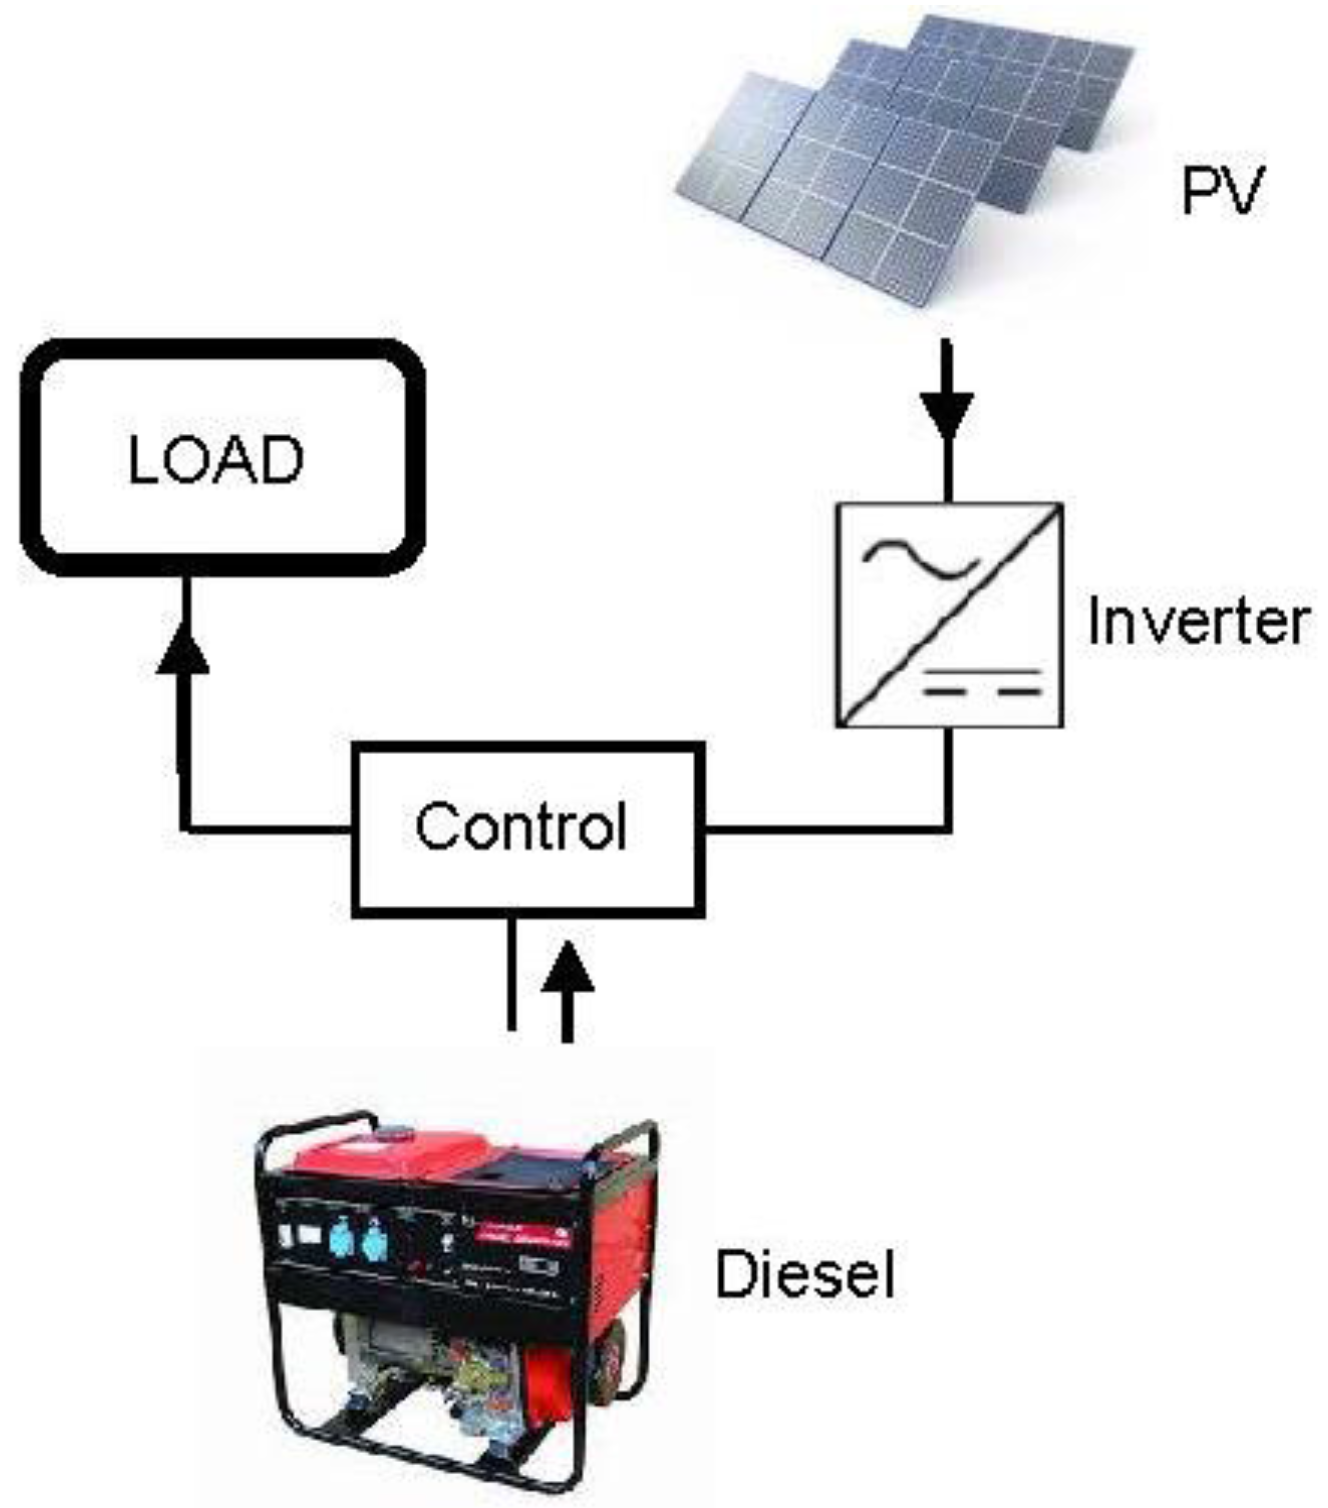
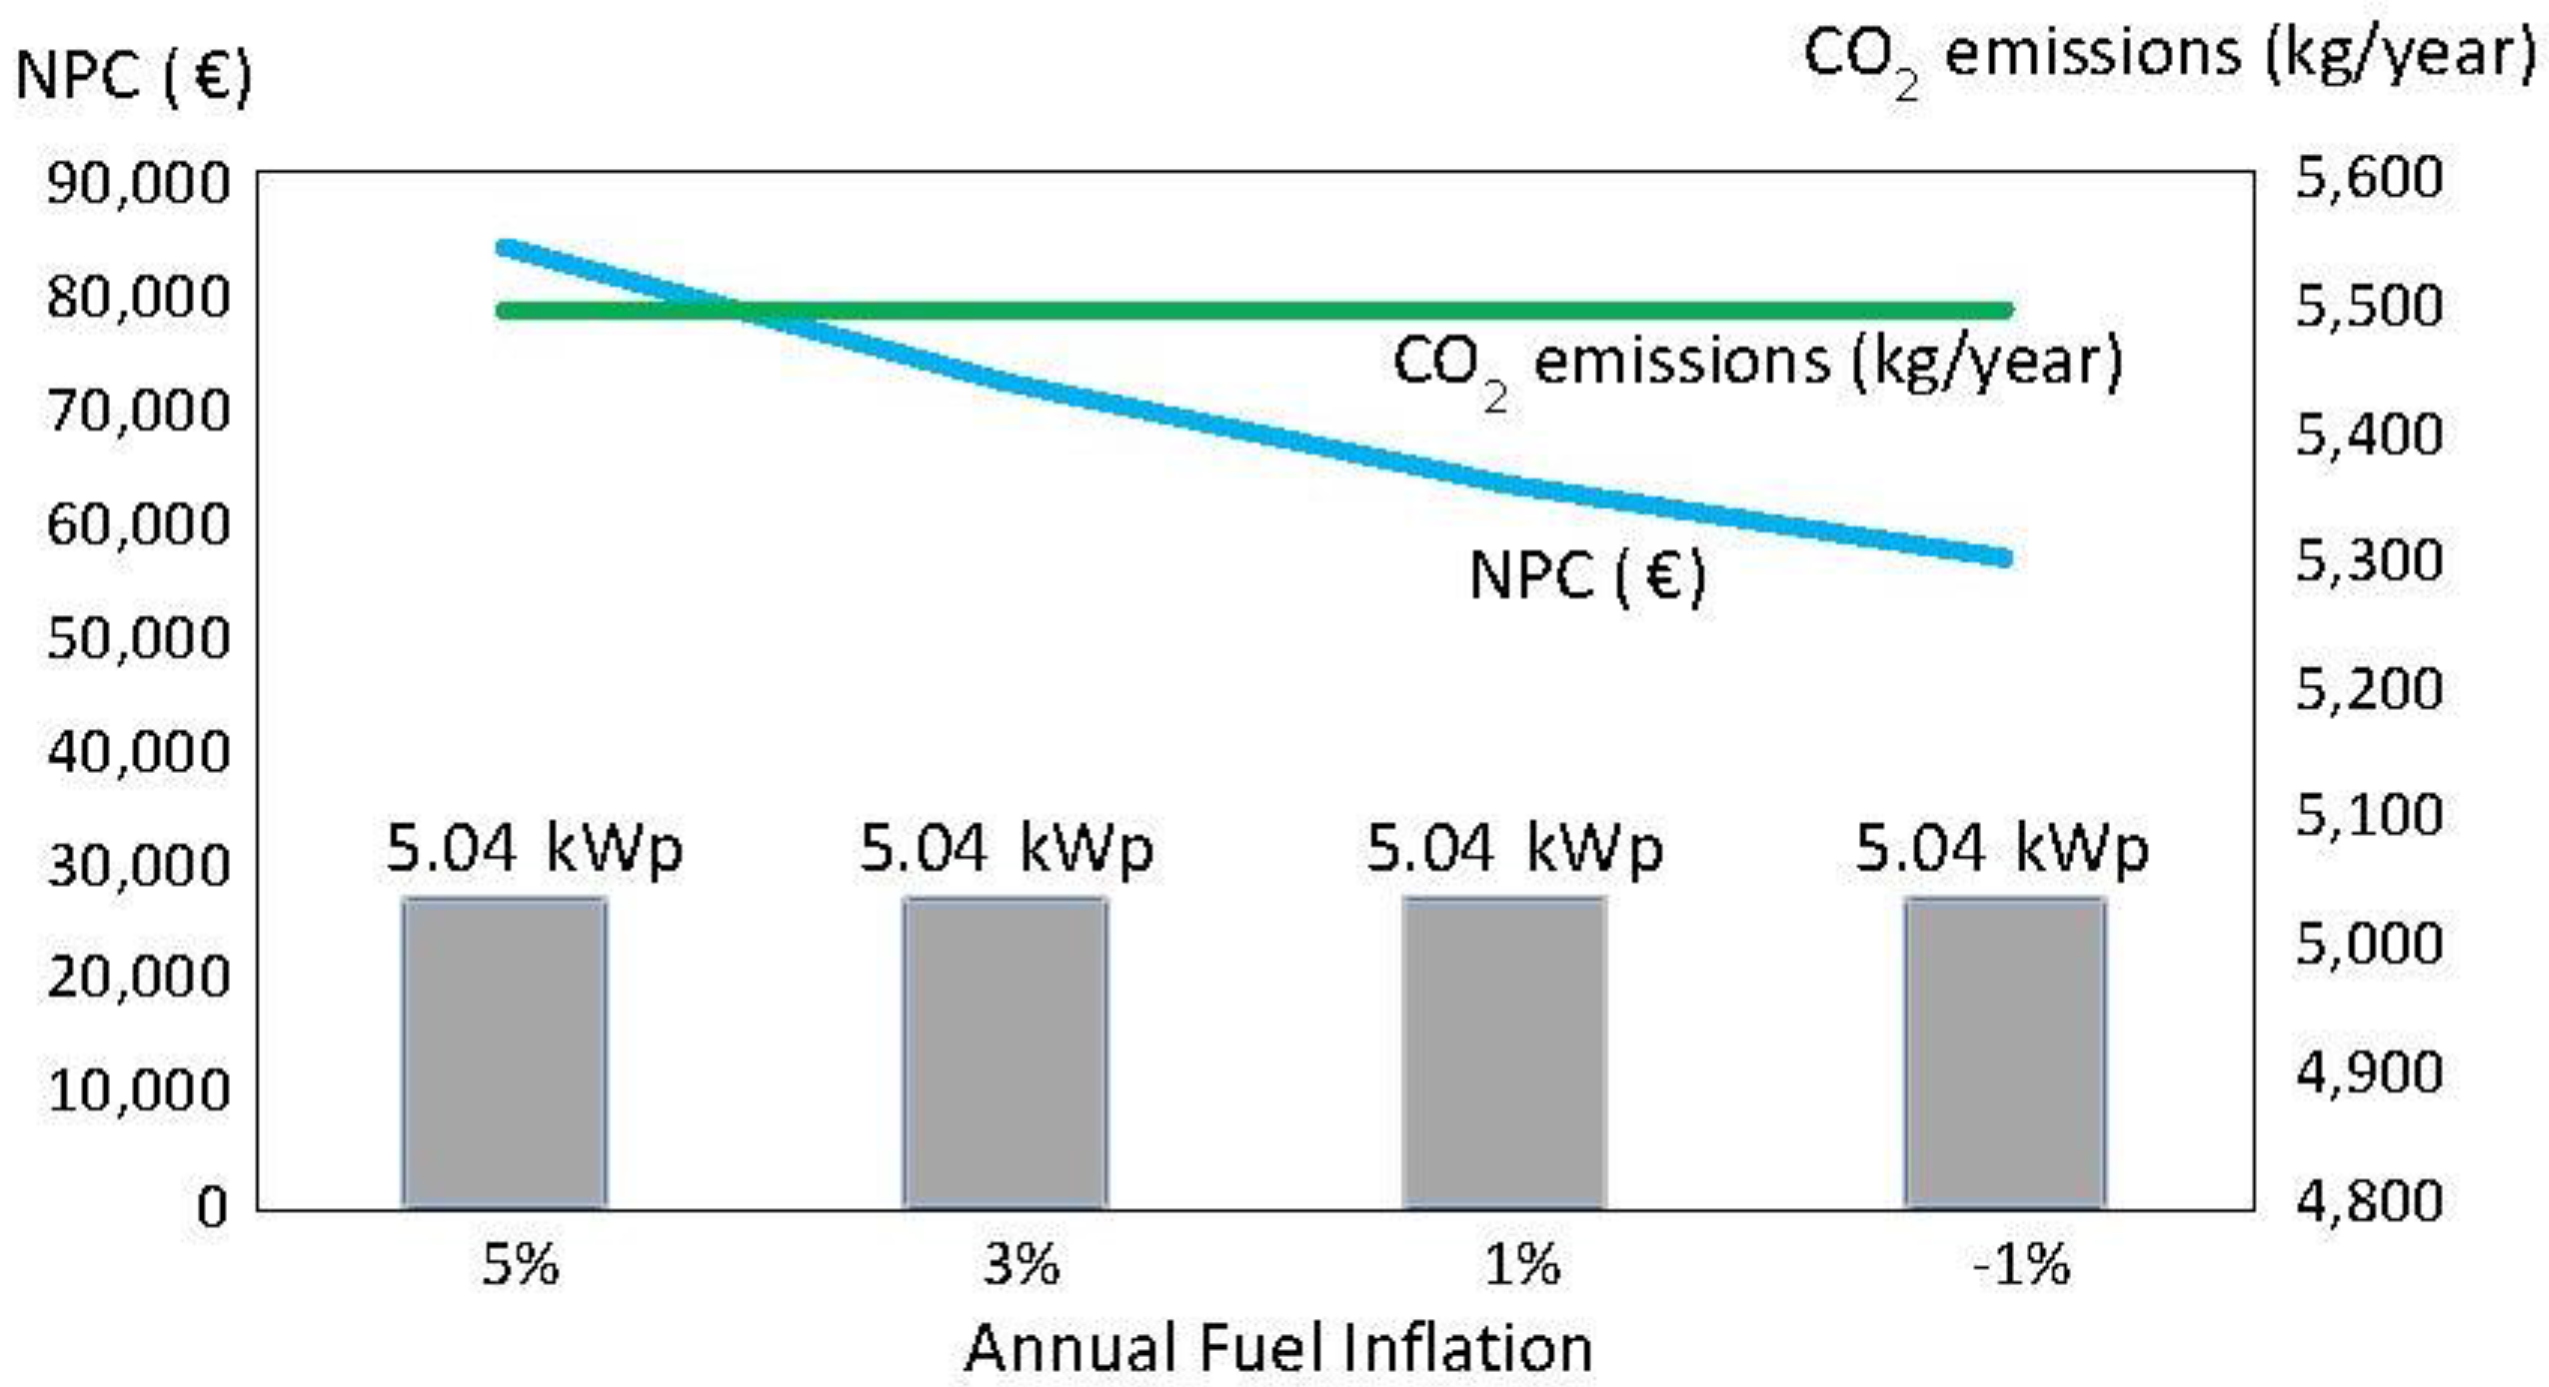
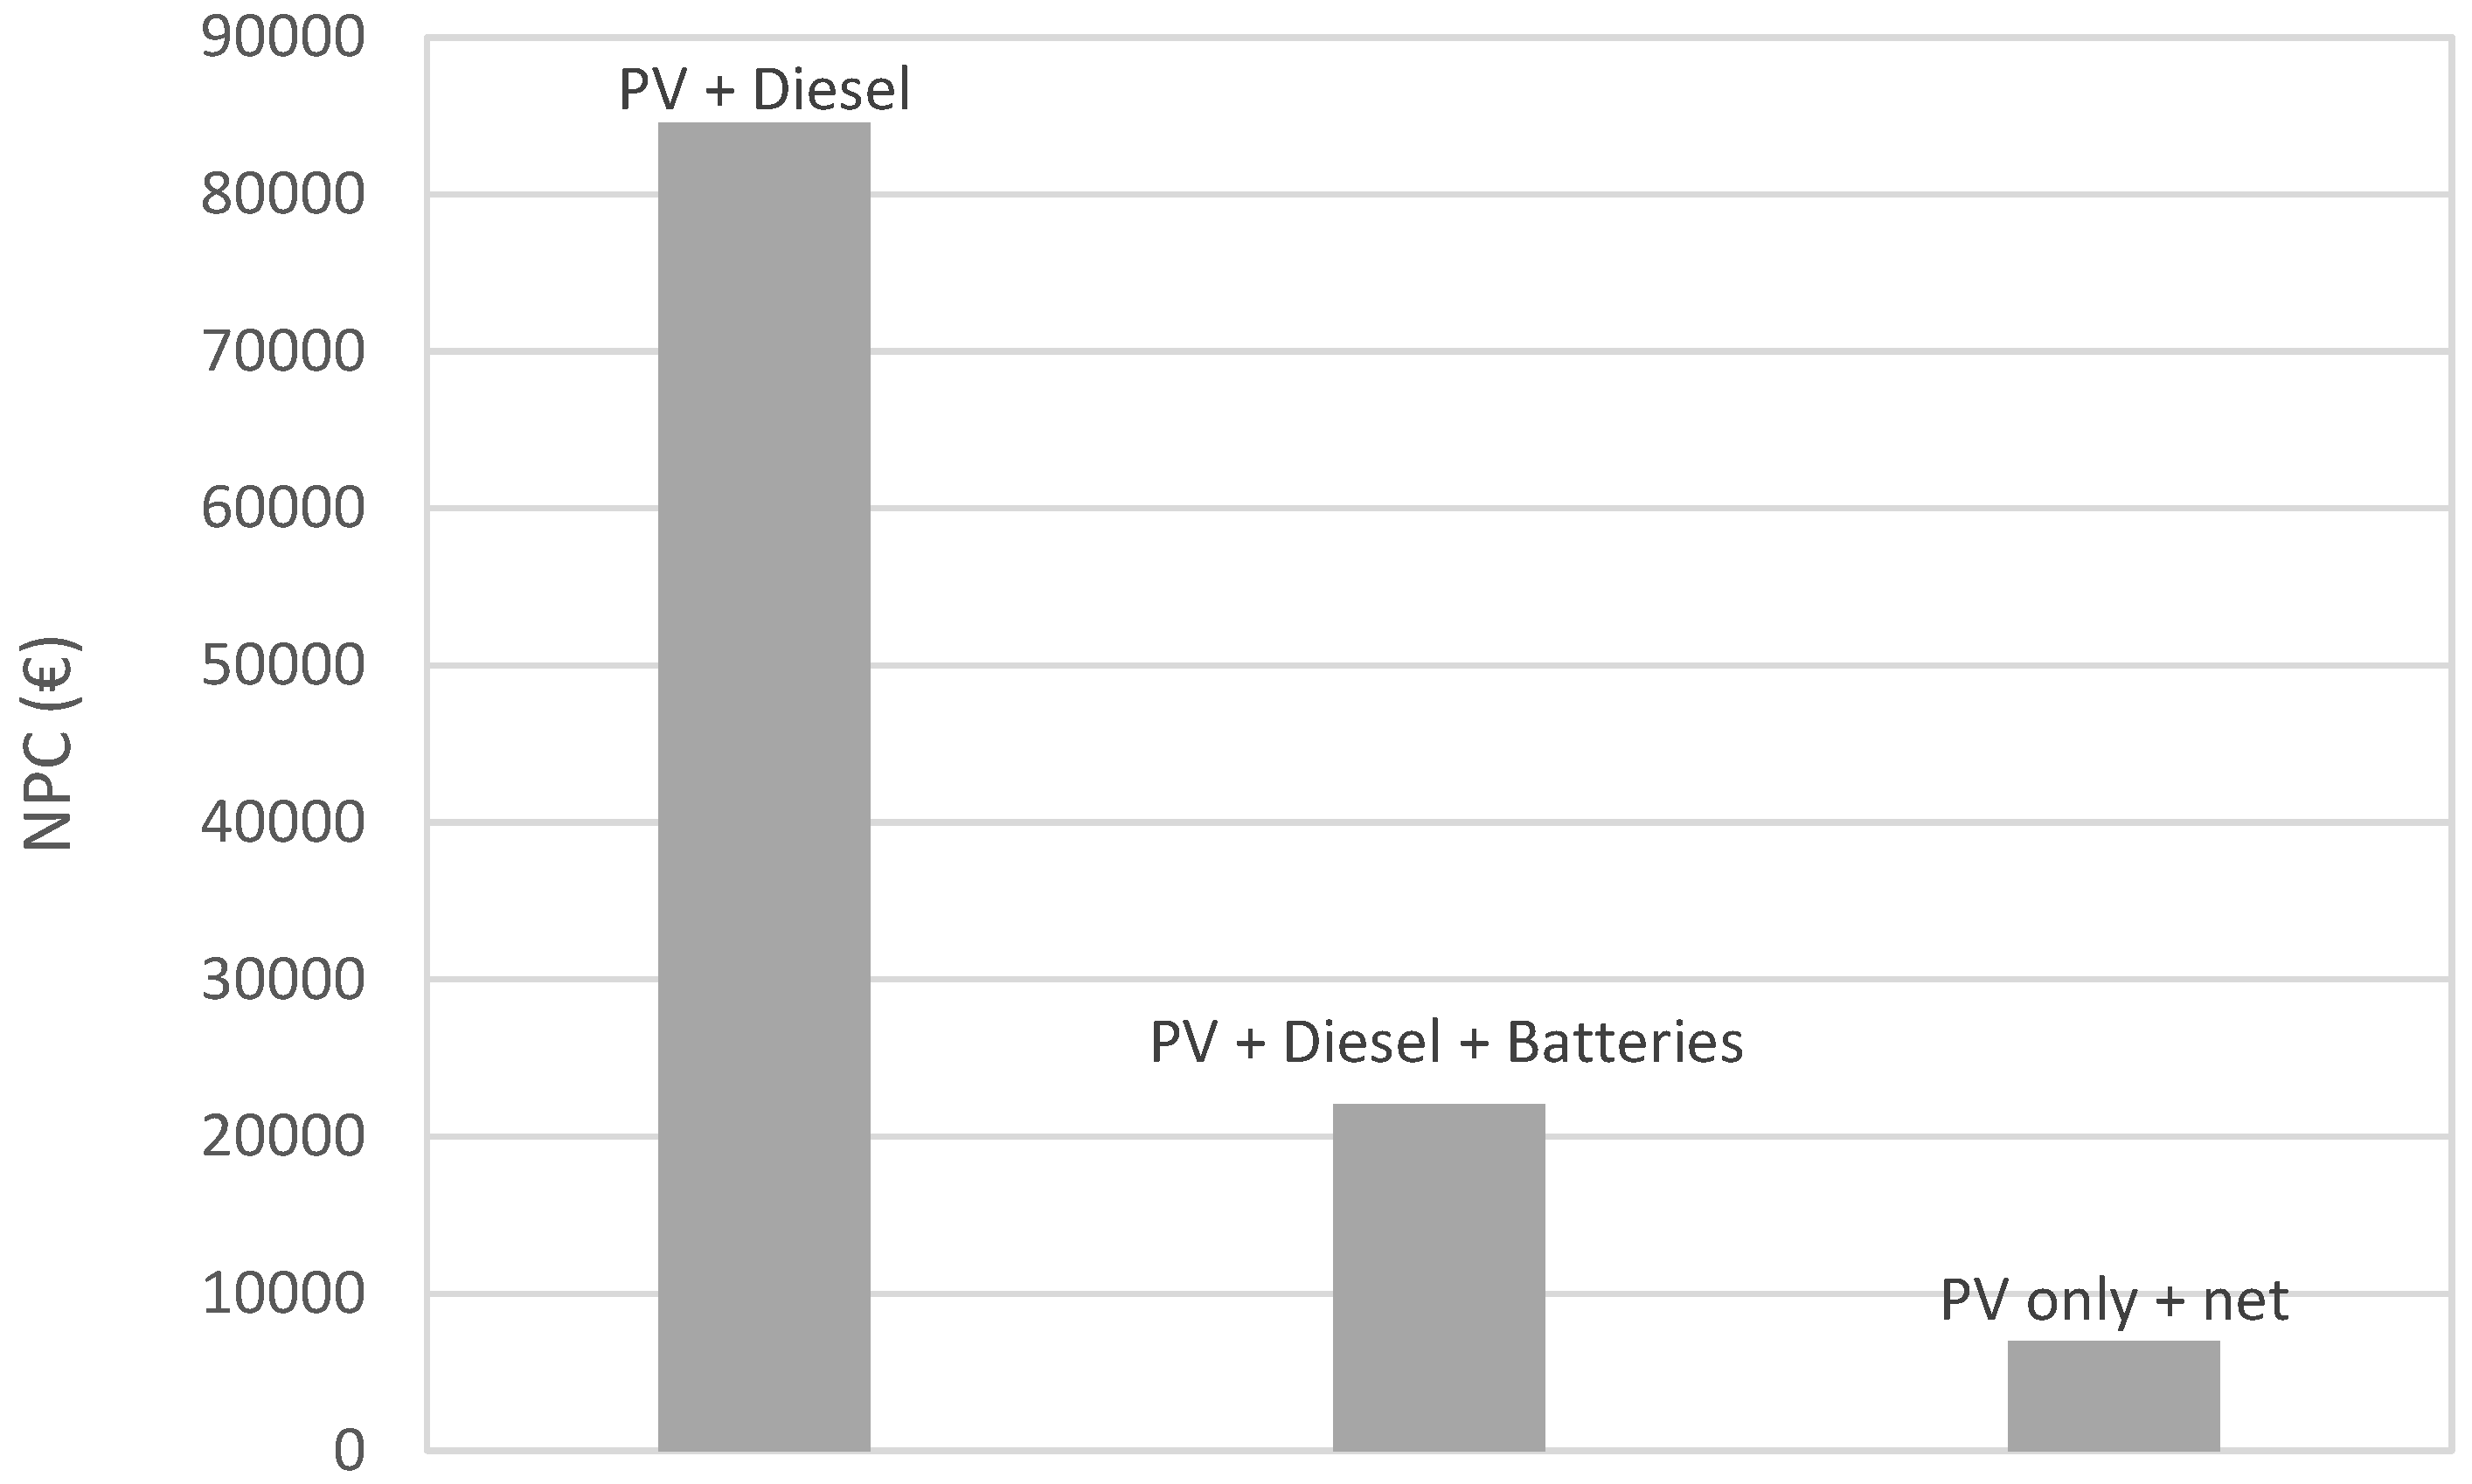
Considering all of the above, this paper presents a study about self-consumption in Spain (both off-grid PV systems with batteries or diesel generators and grid-connected PV systems under net-metering policies), focusing on the economic and environmental aspects. The NPC is calculated in this economic study [
25] for all cash flows during the system’s lifetime (e.g., acquisition and installation costs, operation and maintenance costs, and replacement costs for components when their lifespan ends); the authors then converted to the initial system time by means of standard economic statistics (e.g., interest rate and inflation rate). In addition, the levelised cost of energy (LCOE) is obtained by dividing the NPC by the total load consumed during the system’s lifetime. In this research’s environmental study, the CO
2 emissions for all components’ life cycles are evaluated.
This paper focuses particularly on Spain’s irradiance zone three (III), which includes the majority of Spain’s mid-peninsular land. This zone includes Zaragoza, Madrid, most of Catalonia, Castilla Leon, Castilla La Mancha, Comunidad Valenciana, Extremadura, and Andalucía. The average household energy consumption is considered.
As a tool for the simulations and optimisations, the software iHOGA (improved Hybrid Optimisation by Genetic Algorithms, Dufo-López R., Zaragoza, Spain) [
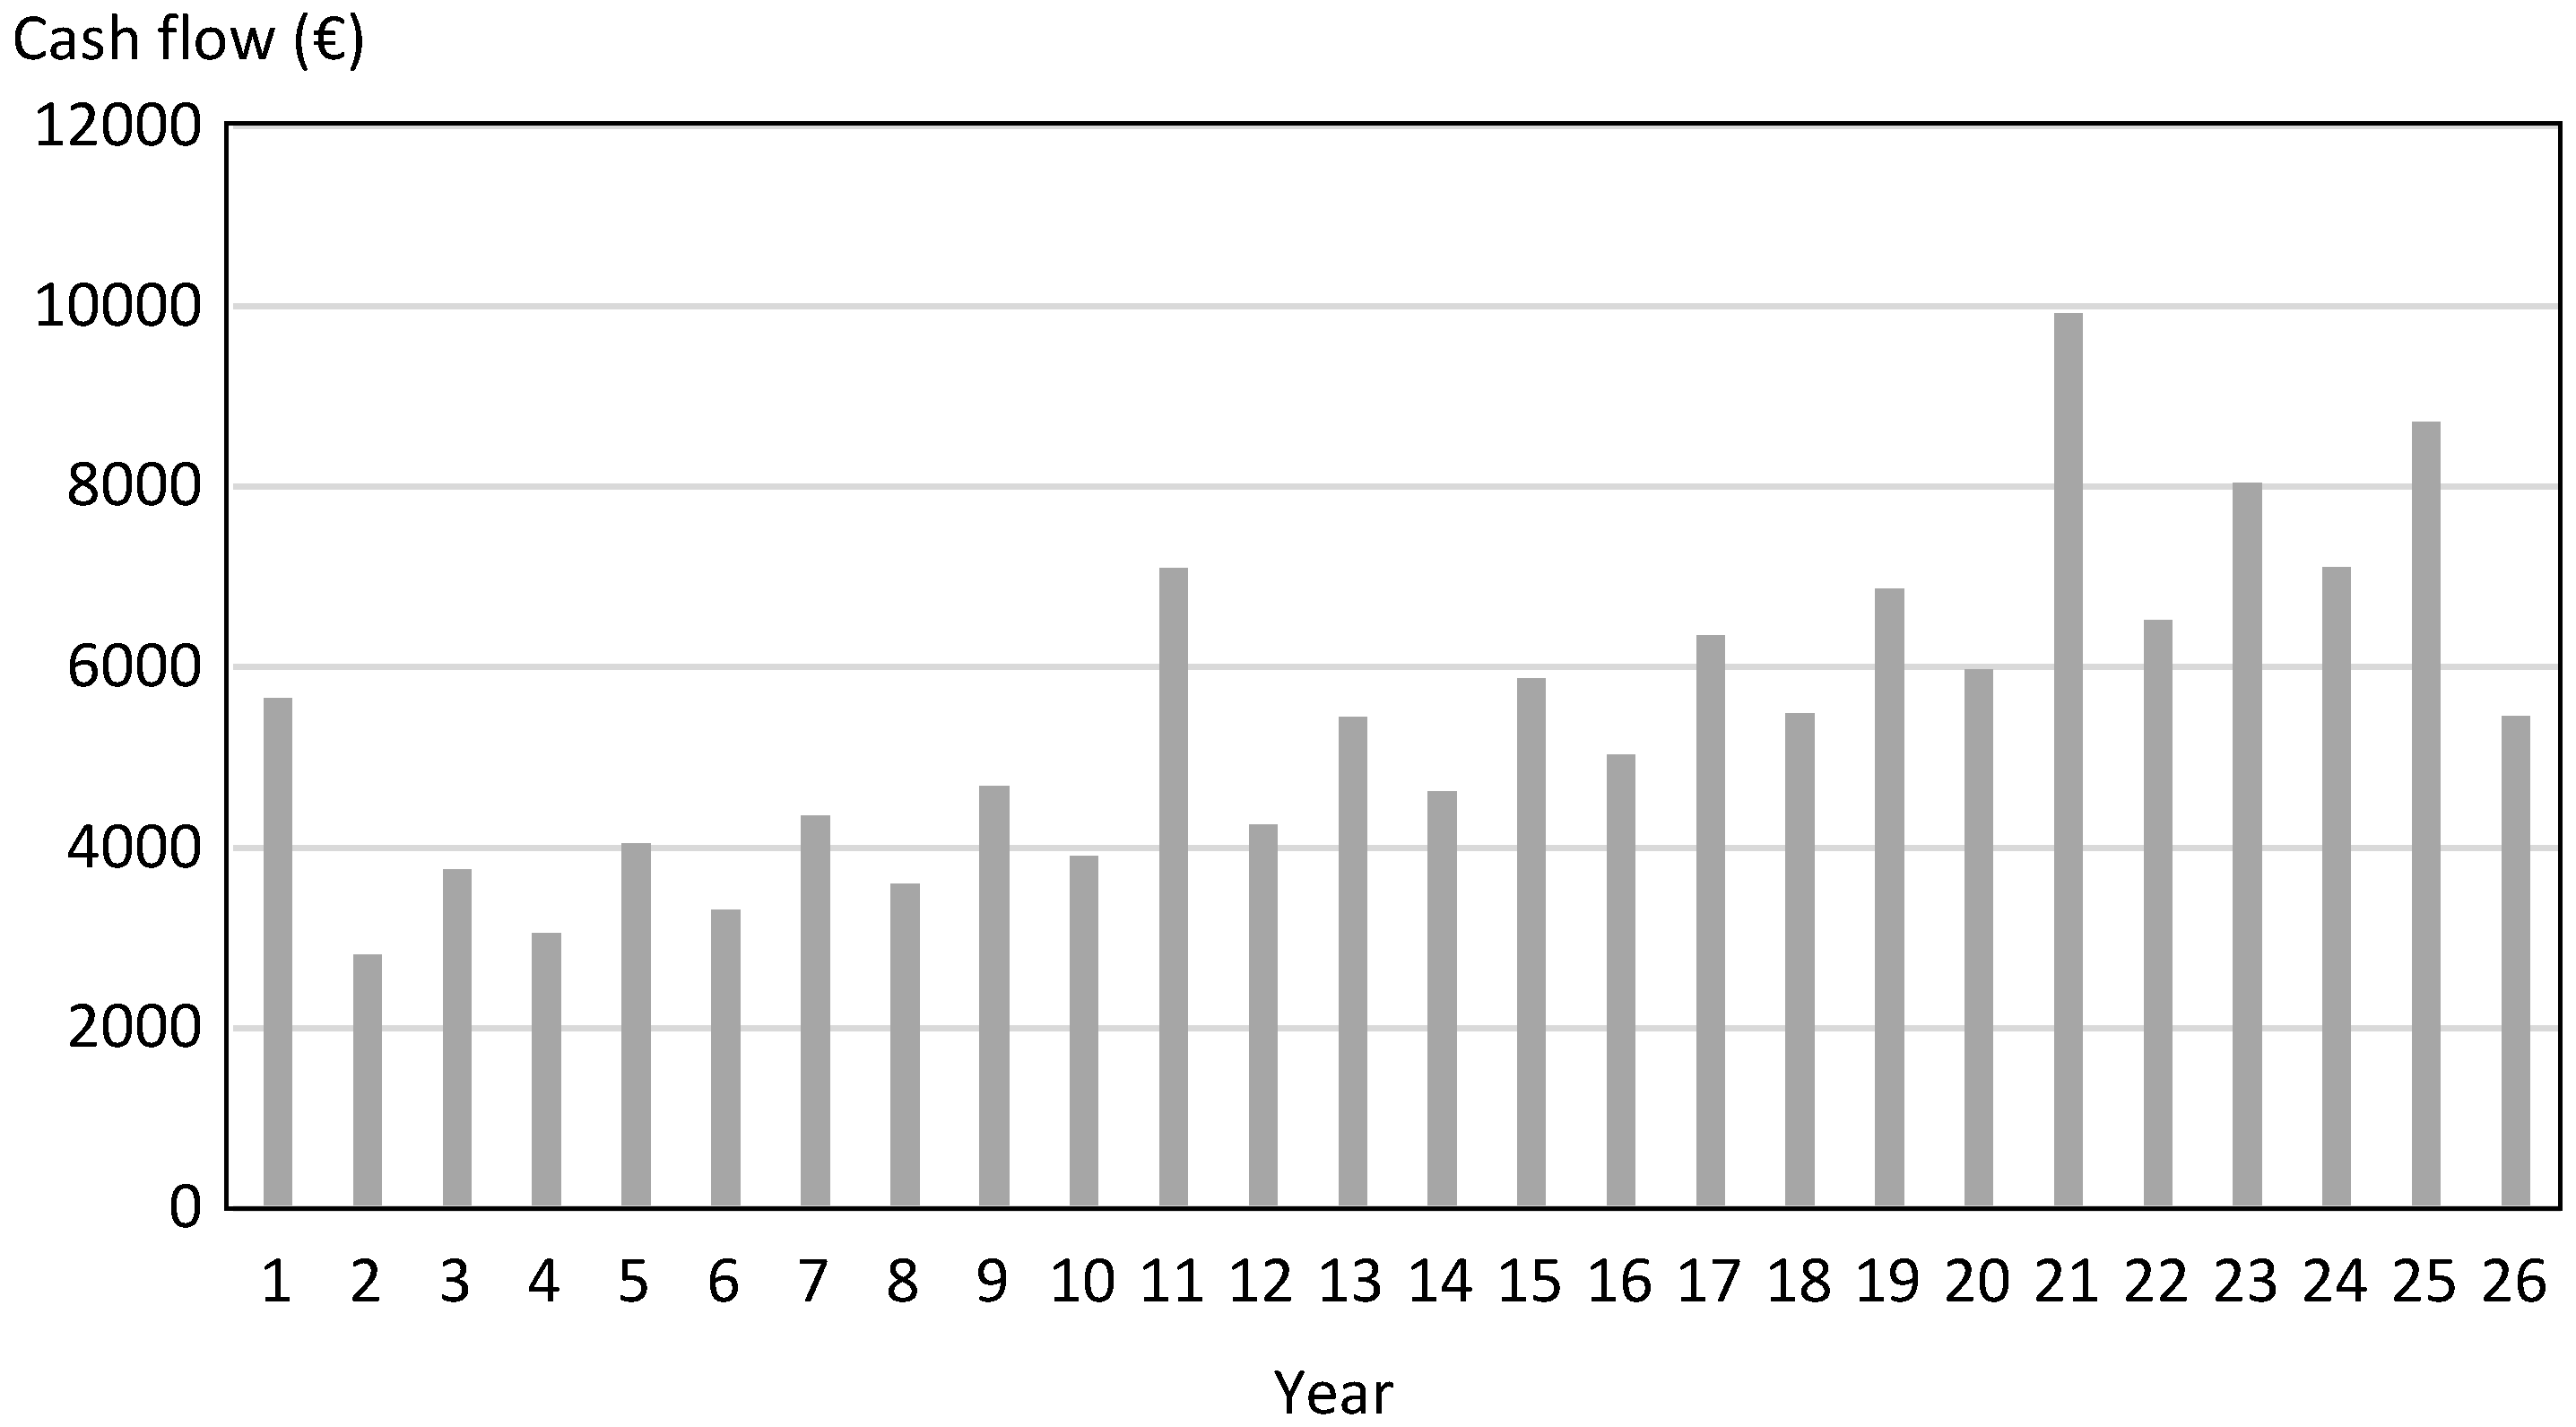
26] has been used. iHOGA is a simulation and optimisation software tool that optimises the hybrid renewable system, simulating the performance of the system on an hourly time-step basis throughout a whole year (which is supposed to be repeated until the end of the system’s lifetime) or during the battery lifetime in the cases in which there is a battery in the system (when the battery’s life ends, the old batteries are replaced with new ones, and the performance during the battery’s lifetime is supposed to be repeated until the end of the system’s lifetime). Systems with different combinations of components are tested to simulate their operation and to determine their performance during the system’s lifetime. When systems comply with technical requirements, the NPC is calculated; across all the evaluated cases, the system lifetime averaged about 25 years (as is usual for PVs); the average interest rate was 4%; and the general inflation rate was 2%. Cash flows were analysed on a yearly basis. The main data input into iHOGA were system components, electricity demand, renewable resources, technical parameters, and economic parameters. More references about iHOGA can be found in previous papers [
27,
28].
In this study, we assume that retail prices and net metering policies will not vary. The inclusion of changes to the retail rate design for distributed PV systems [
29] and/or to the tariff policy [
30] can affect the on-grid, PV-only system’s results. The authors expect to address these research topics in future works.
This work is presented as follows: Self-consumption methods; Economic and energy data; Study cases; and Conclusions.
3. Energy and Economic Data
Depending how accurately the system is calculated, the profitability of a system can be determined with high or low precision. A simple house with all the requirements for living in a modern society has been considered.
The total installed solar PV system cost includes the modules, inverter, support structure, electrical low-voltage circuits and protections, cables and structure anchor, engineering, mechanical installation, electrical installation, and value-added tax (VAT). The components can be weighted in order of price, which are the solar modules, inverter, structure, batteries, and manpower. Over the last five years, system costs have decreased by as much as 25% of their initial cost. This implies that it is possible to make the system competitive against other technologies and against the retail electricity price [
32].
Next, we describe the data used in this study.
3.1. Meteorological Data Sources
There are many solar irradiance meteorological data sources available. Some of them are based on private weather stations. In this work, data from the Photovoltaic Geographical Information System (PVGIS) [
38] have been used. The values for a place at zone III in Spain, with a slope of 15° and oriented to the south, are shown in
Table 1.
The reason why we are using a 15° tilt angle is because it is a common inclination for a roof in that area of Spain. Nevertheless, the optimal angle for an installation connected to the grid would be 35° tilt angle (maximising the electricity production of the whole year) and 60° for an off-grid system (maximising the electricity production of the month with the lowest irradiation, usually December).
3.2. PV Panels
The PV panels comprise nearly 50% of the budget (in grid-connected PV systems). The influence of Chinese manufacturers has reduced the global price of the system, but recently, anti-dumping policies have stopped this tendency [
39]. Regulations imposed by the European Union say that it cannot be possible to assume lower prices for Chinese-manufactured solar panels [
40].
The size of the installation directly affects the cost of the panels. In this case, we consider installations below 10 kW. After reviewing the market, in 2016, the solar module price is around 0.55 €/Wp for a 5 kW system.
3.3. Mounting Structures
There are different prices depending on whether the structure is aluminium or hot galvanised steel. In the past, aluminium was a very expensive metal, making the hot galvanised mounting structures more competitive. Aluminium structures were priced at 0.34 €/Wp, but this price has decreased by 50% over the past few years because aluminium is more than 50% cheaper in 2016 than it was in 2007 [
41]. Typically, the mounting system on a rooftop installation is aluminium because it is lighter than the galvanised steel. With this in mind, we consider an aluminium structure in our budget.
3.4. Inverters
A solar inverter converts the DC output power from the solar panels into AC electricity that is synchronised with the AC frequency of the grid. For domestic applications, string inverters are the most used, and single-phase systems are the most common configuration on houses. For industrial or large-scale applications, a central inverter could be used. In this work, we consider a string inverter because of the size of the studied installations. Prices are around 0.1 €/Wn for an industrial inverter and 0.24 €/Wn for a 5 kWn inverter, considering a European manufacturer. These prices are obtained through market research. The efficiency of the system could be improved using microinverters, but at the moment they are not very common in the market due to their high price.
3.5. Energy Balance
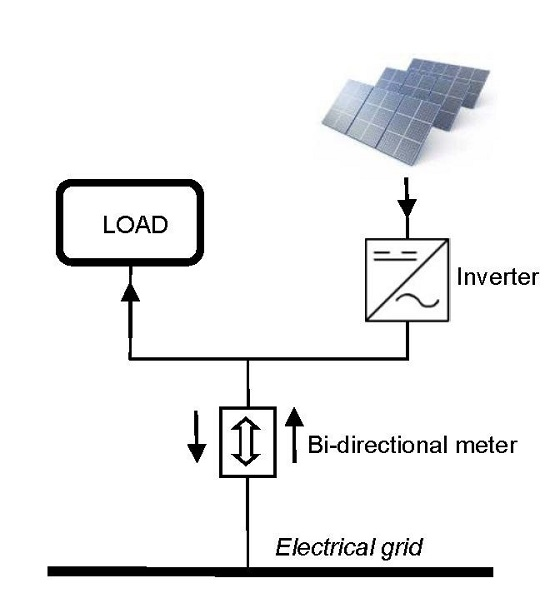
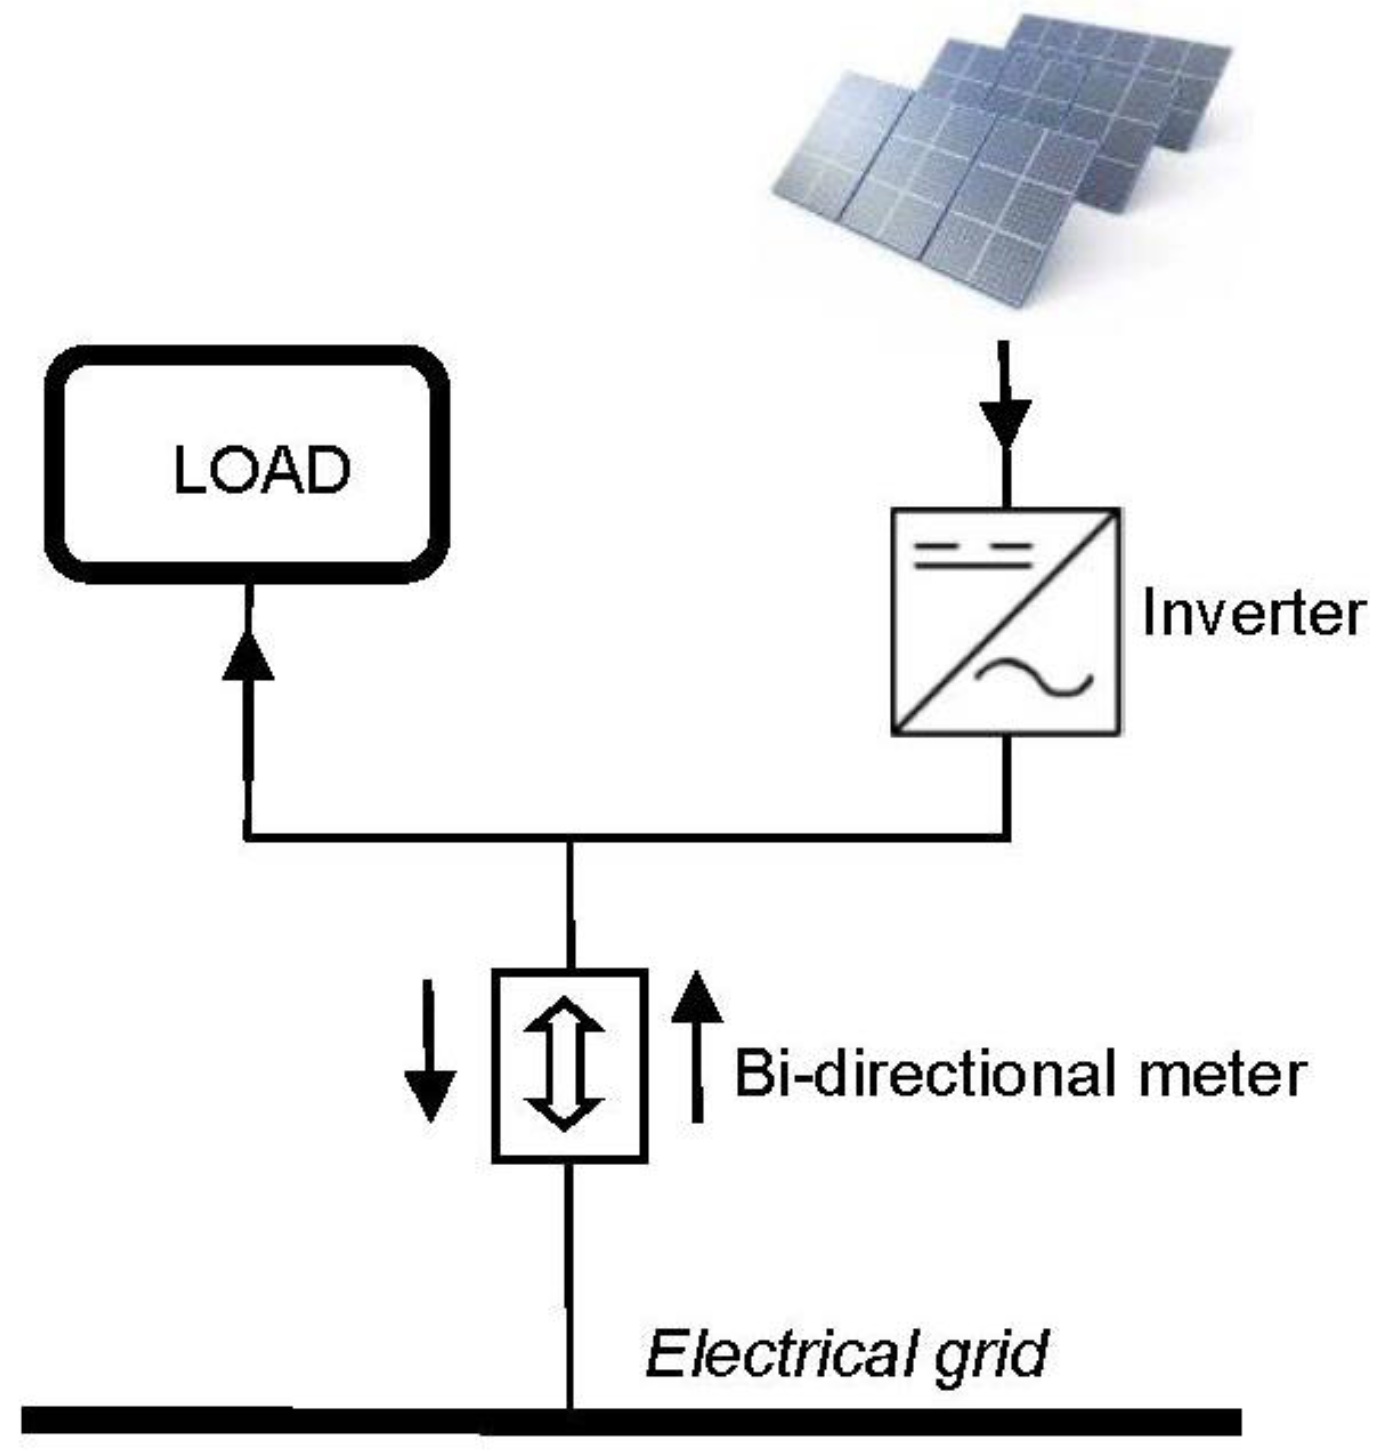
Sizing the system depends on the load consumption. Off-grid systems must be dimensioned following the worst-case scenario of consumption and also the worst-case scenario of generation (usually winter time). Furthermore, there are periods in which the energy produced by the system is greater than consumption and vice versa. However, grid-connected systems under net-metering policies should be dimensioned to produce approximately the same energy as the total energy consumed during the year.
Considering a solar PV generator installed in the roof of a house, the power consumption of a typical household located in Spain has been modelled.
The total consumption or energy demand per day is calculated using Equation (1).
where
Total consumption is the total electricity demand in the worst-case consumption scenario;
Units is the number of units of the same item present in the house;
Power is the maximum instant power consumed by the item; and
Hours per day used is the number of hours per day of estimated use.
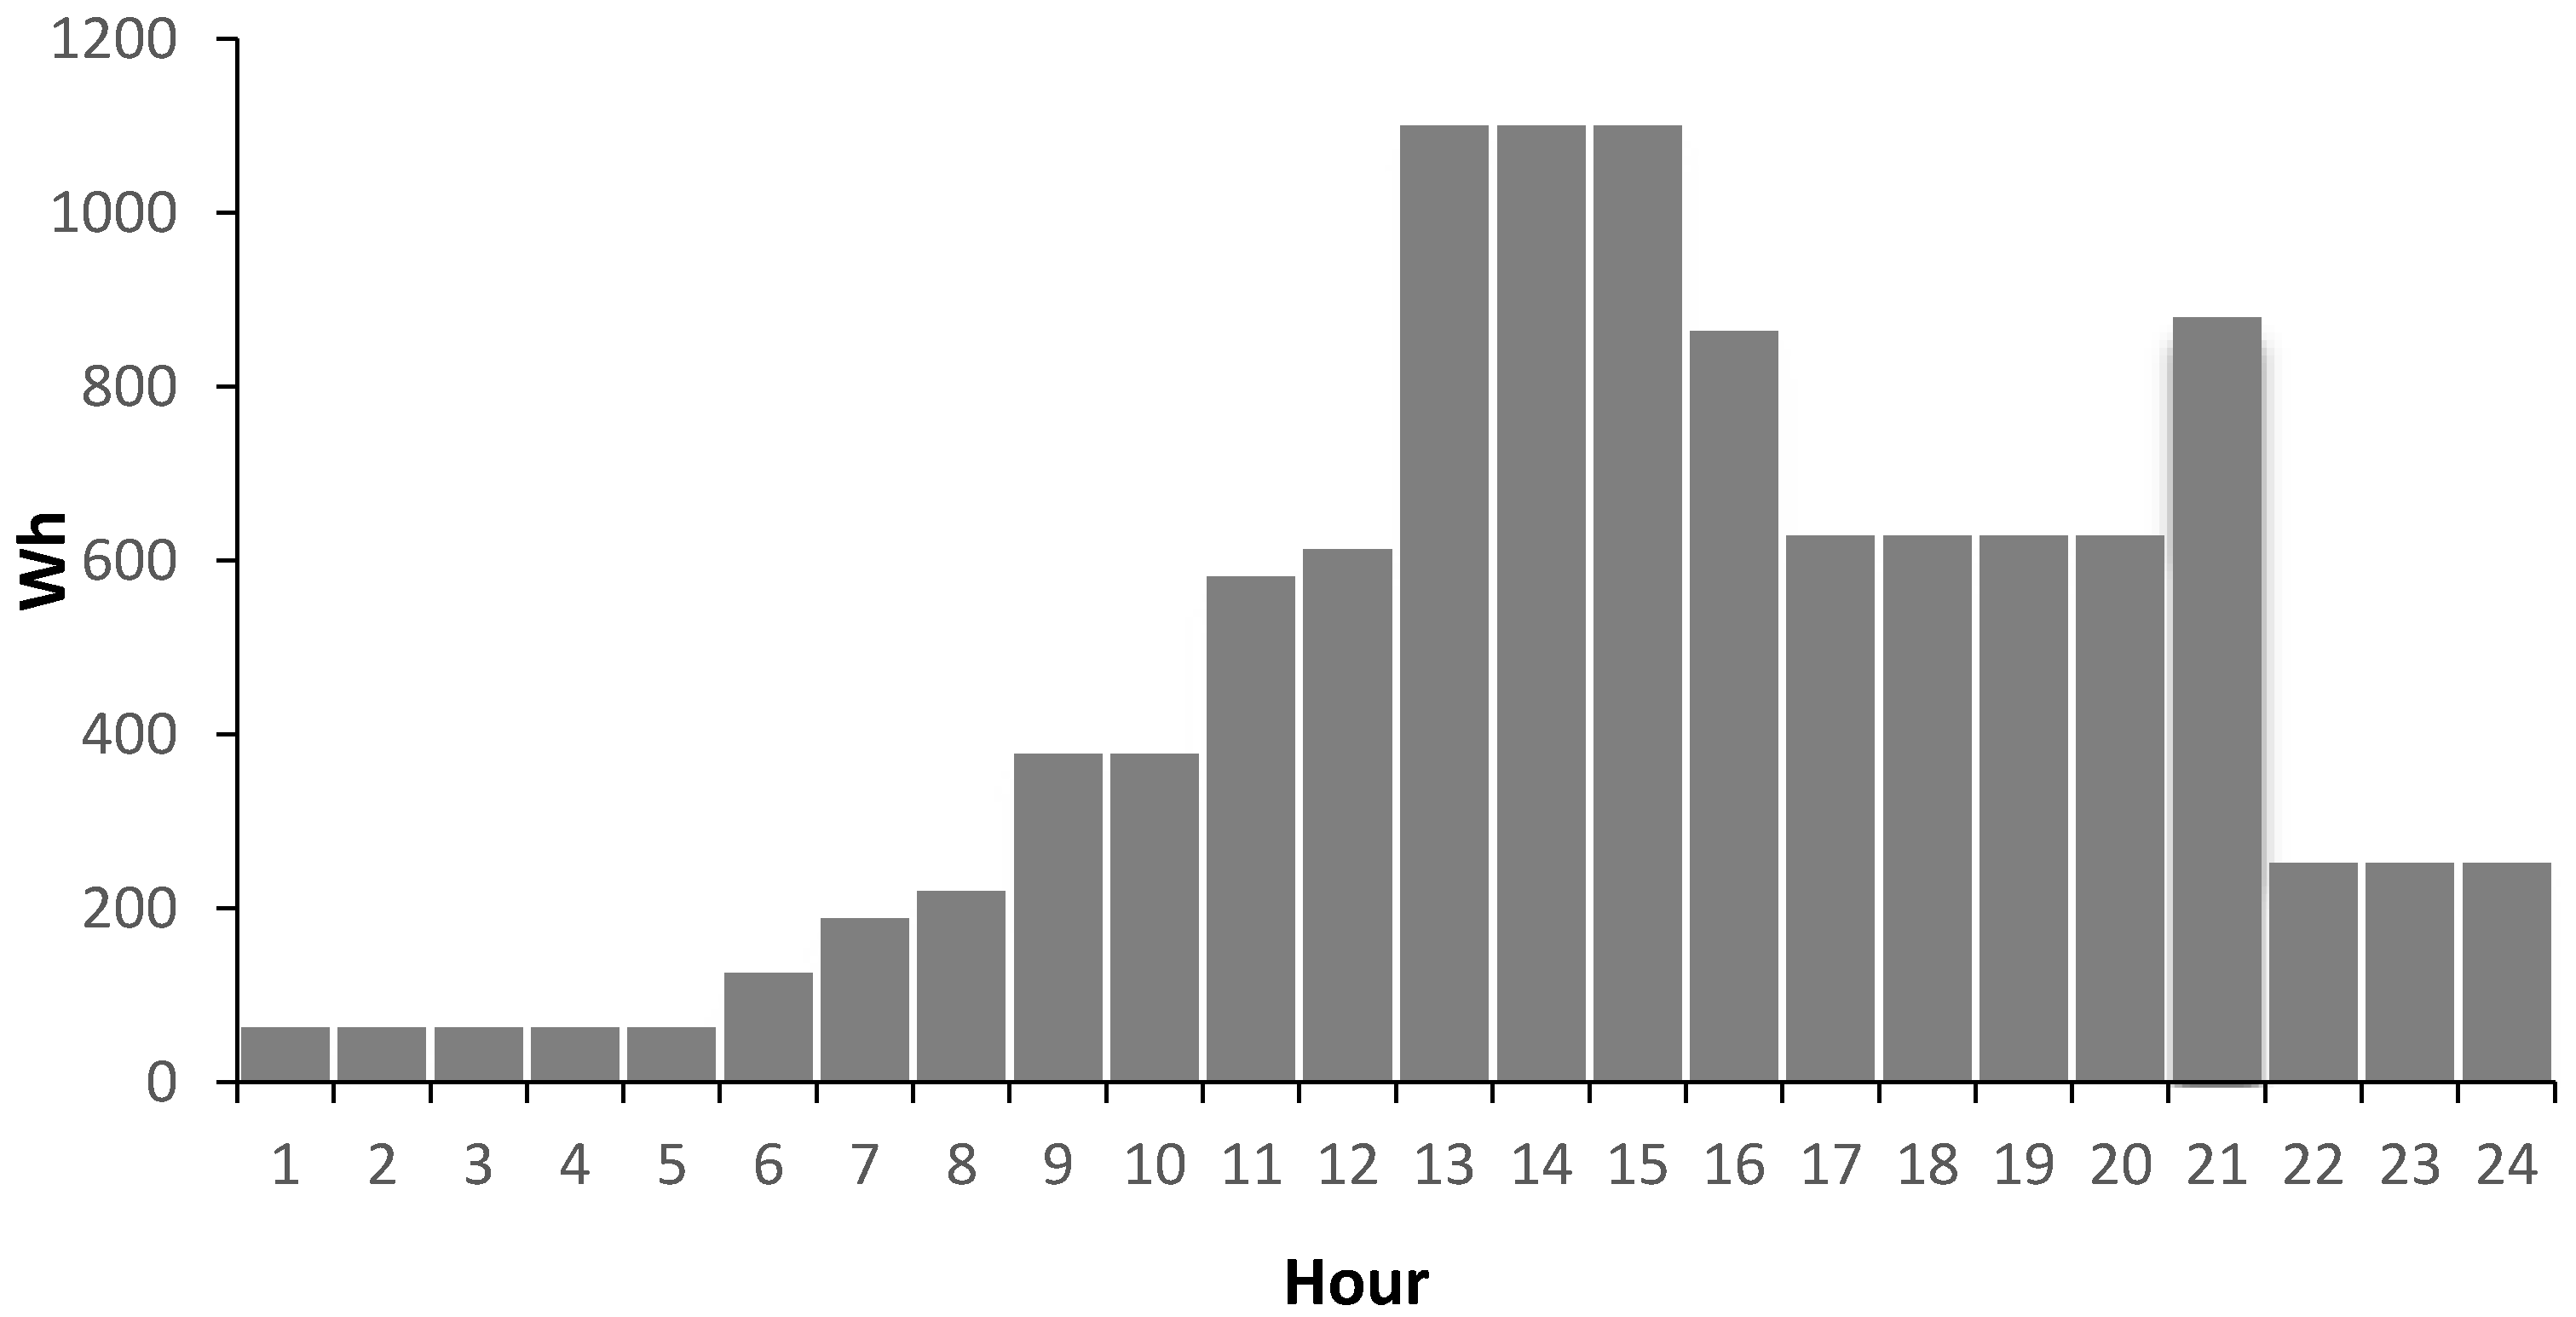
The house considered in this work has a power consumption of 10,000 Wh per day (a typical household load in Spain). The hourly consumption for the day (which is supposed to be repeated every day) is shown in
Figure 4. The assumption that the behaviours of the tenants are constant all year has been considered; therefore, the hourly consumptions are the same, as some components and loads, like heaters, have been disregarded under the assumption that they are powered by gas. There is a demand peak at 21:00, usual in households in Spain. In Spain, it is common for dinner to start at 20:00, 21:00 or 22:00.
Demand growths have not been considered as it is a household load. The electrification of the house could be increased in the future (adding, for example, more automation for opening/closing window blinds, etc.); however, it has been considered that home appliances will consume less energy in the future, being more efficient, which can compensate for the increase in electrification.
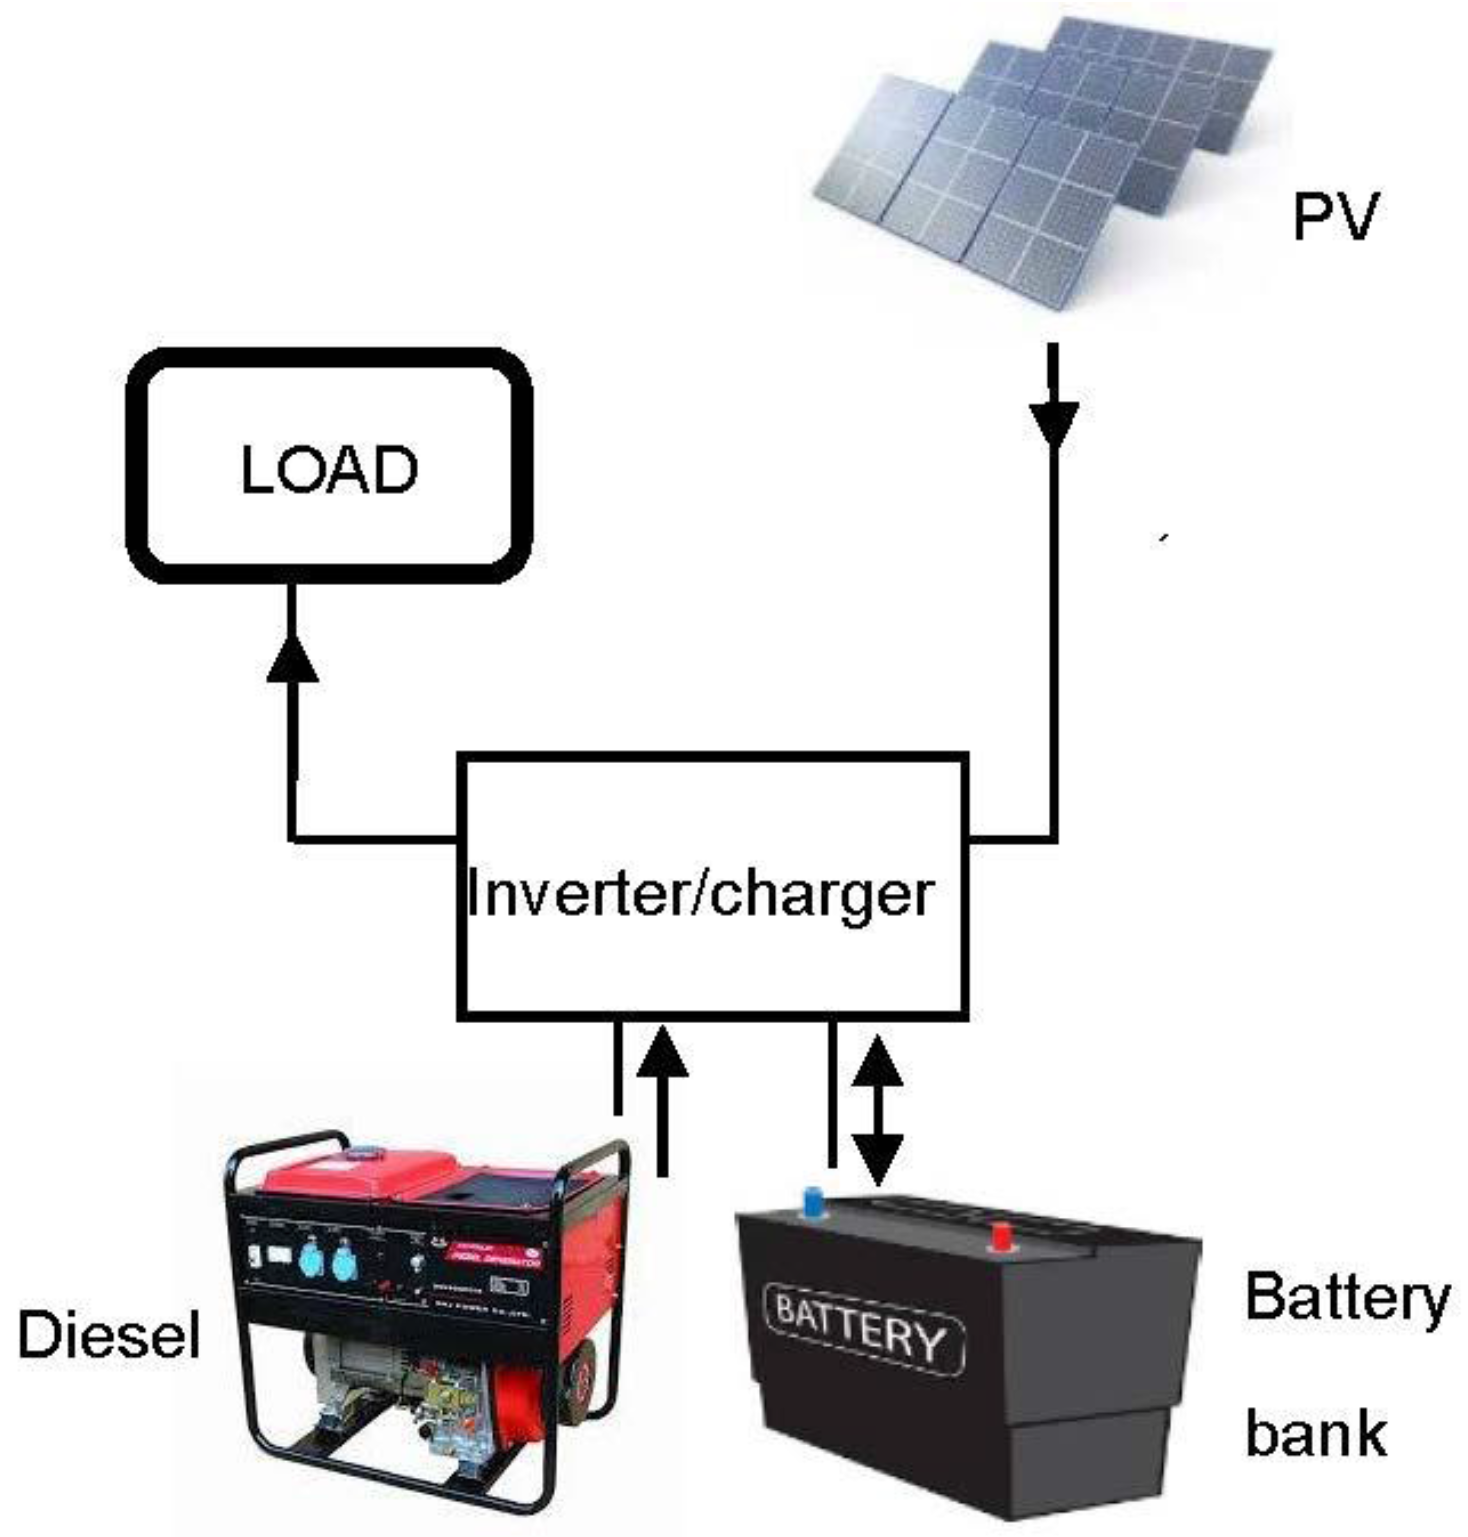
The production generated over one year changes depending the amount of sunlight and the weather. Since the power production balance is not regular, the energy balance has to be regularised either with a storage system (batteries), backup diesel generator, or the AC grid (FiT or net-metering scheme). In this work, FiT has not been considered, as it tends to disappear.


