1. Introduction
As the size of modern electronic devices has continued to shrink, heat dissipation per unit volume has grown rapidly. Piezoelectric fans (piezofans) are commonly used to improve heat transfer performance under natural convective conditions due to their operational simplicity, small size, minimal noise emission and low power consumption. Such fans are composed of a thin flexible blade and a piezoelectric patch and are actuated by a periodically-alternating electric voltage at the resonance frequency. The cantilever blade vibrates between two extreme locations, inducing an air flow stream in alternate directions. This results in the downstream flow changing periodically on opposite sides.
Toda [
1,
2] was the first to perform a theoretical and experimental investigation of the flow field induced by a vibrating Polyvinylidene fluoride (PVF2) bimorph plate. Since then, many studies experimentally examined the performance of heat transfer enhancement under the actuation of a piezofan [
3,
4,
5,
6,
7]. Some numerical studies were performed to investigate the flow fields and heat transfer performance of piezofans [
8,
9,
10,
11,
12,
13,
14,
15,
16]. Their results revealed that the average maximum heat transfer augmentation and local maximum heat transfer augmentation can be increased by about 100% and 350%, respectively. Lin [
14,
15] utilized a three-dimensional numerical model to examine the flow field and heat transfer performance under the actuation of a piezofan and presented the flow structure of the flow streams while the induced air stream was incident on the heated surface. His results revealed the mechanism of the induced flow for the improvement of heat transfer performance under the free convection condition for both rectangular and circular cylindrical heat sources. He found that the average heat transfer augmentations are about 1.6–3.6-fold for a flat-plate heat source and about 1.2–2.4-fold for the cylindrical heat source, with good agreement between numerical and experimental results.
In general, the heat transfer improvement achieved by the actuation of a piezofan depends on the clearance between the fan tip and the heat source, the vibration amplitude of the fan tip and the applied vibration frequency. Most previous studies focused on the effects of the operating parameters. Yoo et al. [
17] used lead zirconate titanate to test several shapes of piezofans to examine the maximum fan tip displacement. They found a correlation between air velocity and the applied voltage. Their results indicated that the ceramic bimorphs on a rectangular blade shape produced a highest maximum tip displacement of 35.5 mm under an input of 220 Volts and 60 Hz. Liu et al. [
6] examined the heat transfer performance of piezofans with six different dimensions and proposed a correlation between the heat transfer augmentation ratio and the dimensions of piezofans. The results showed that the heat transfer performance increased with increasing width of the piezofan. Recently, Shyu and Syu [
18] used a finger-like piezofan in a plate-fin array to cool a heat sink. The heat transfer performance was better than that of rectangular blades. Most previous studies presented the heat transfer performance and flow field for rectangular piezofans. The heat transfer performance is significantly affected by the velocity of the flow generated by the piezofan [
19]. The present study examines the flow characteristics of a piezofan under its first resonant vibration mode for the rectangular and trapezoidal blades with various widths. Five blade types are examined in this work; three rectangular with different widths and two trapezoidal blades with divergent and convergent shapes, respectively.
2. Experimental Procedures
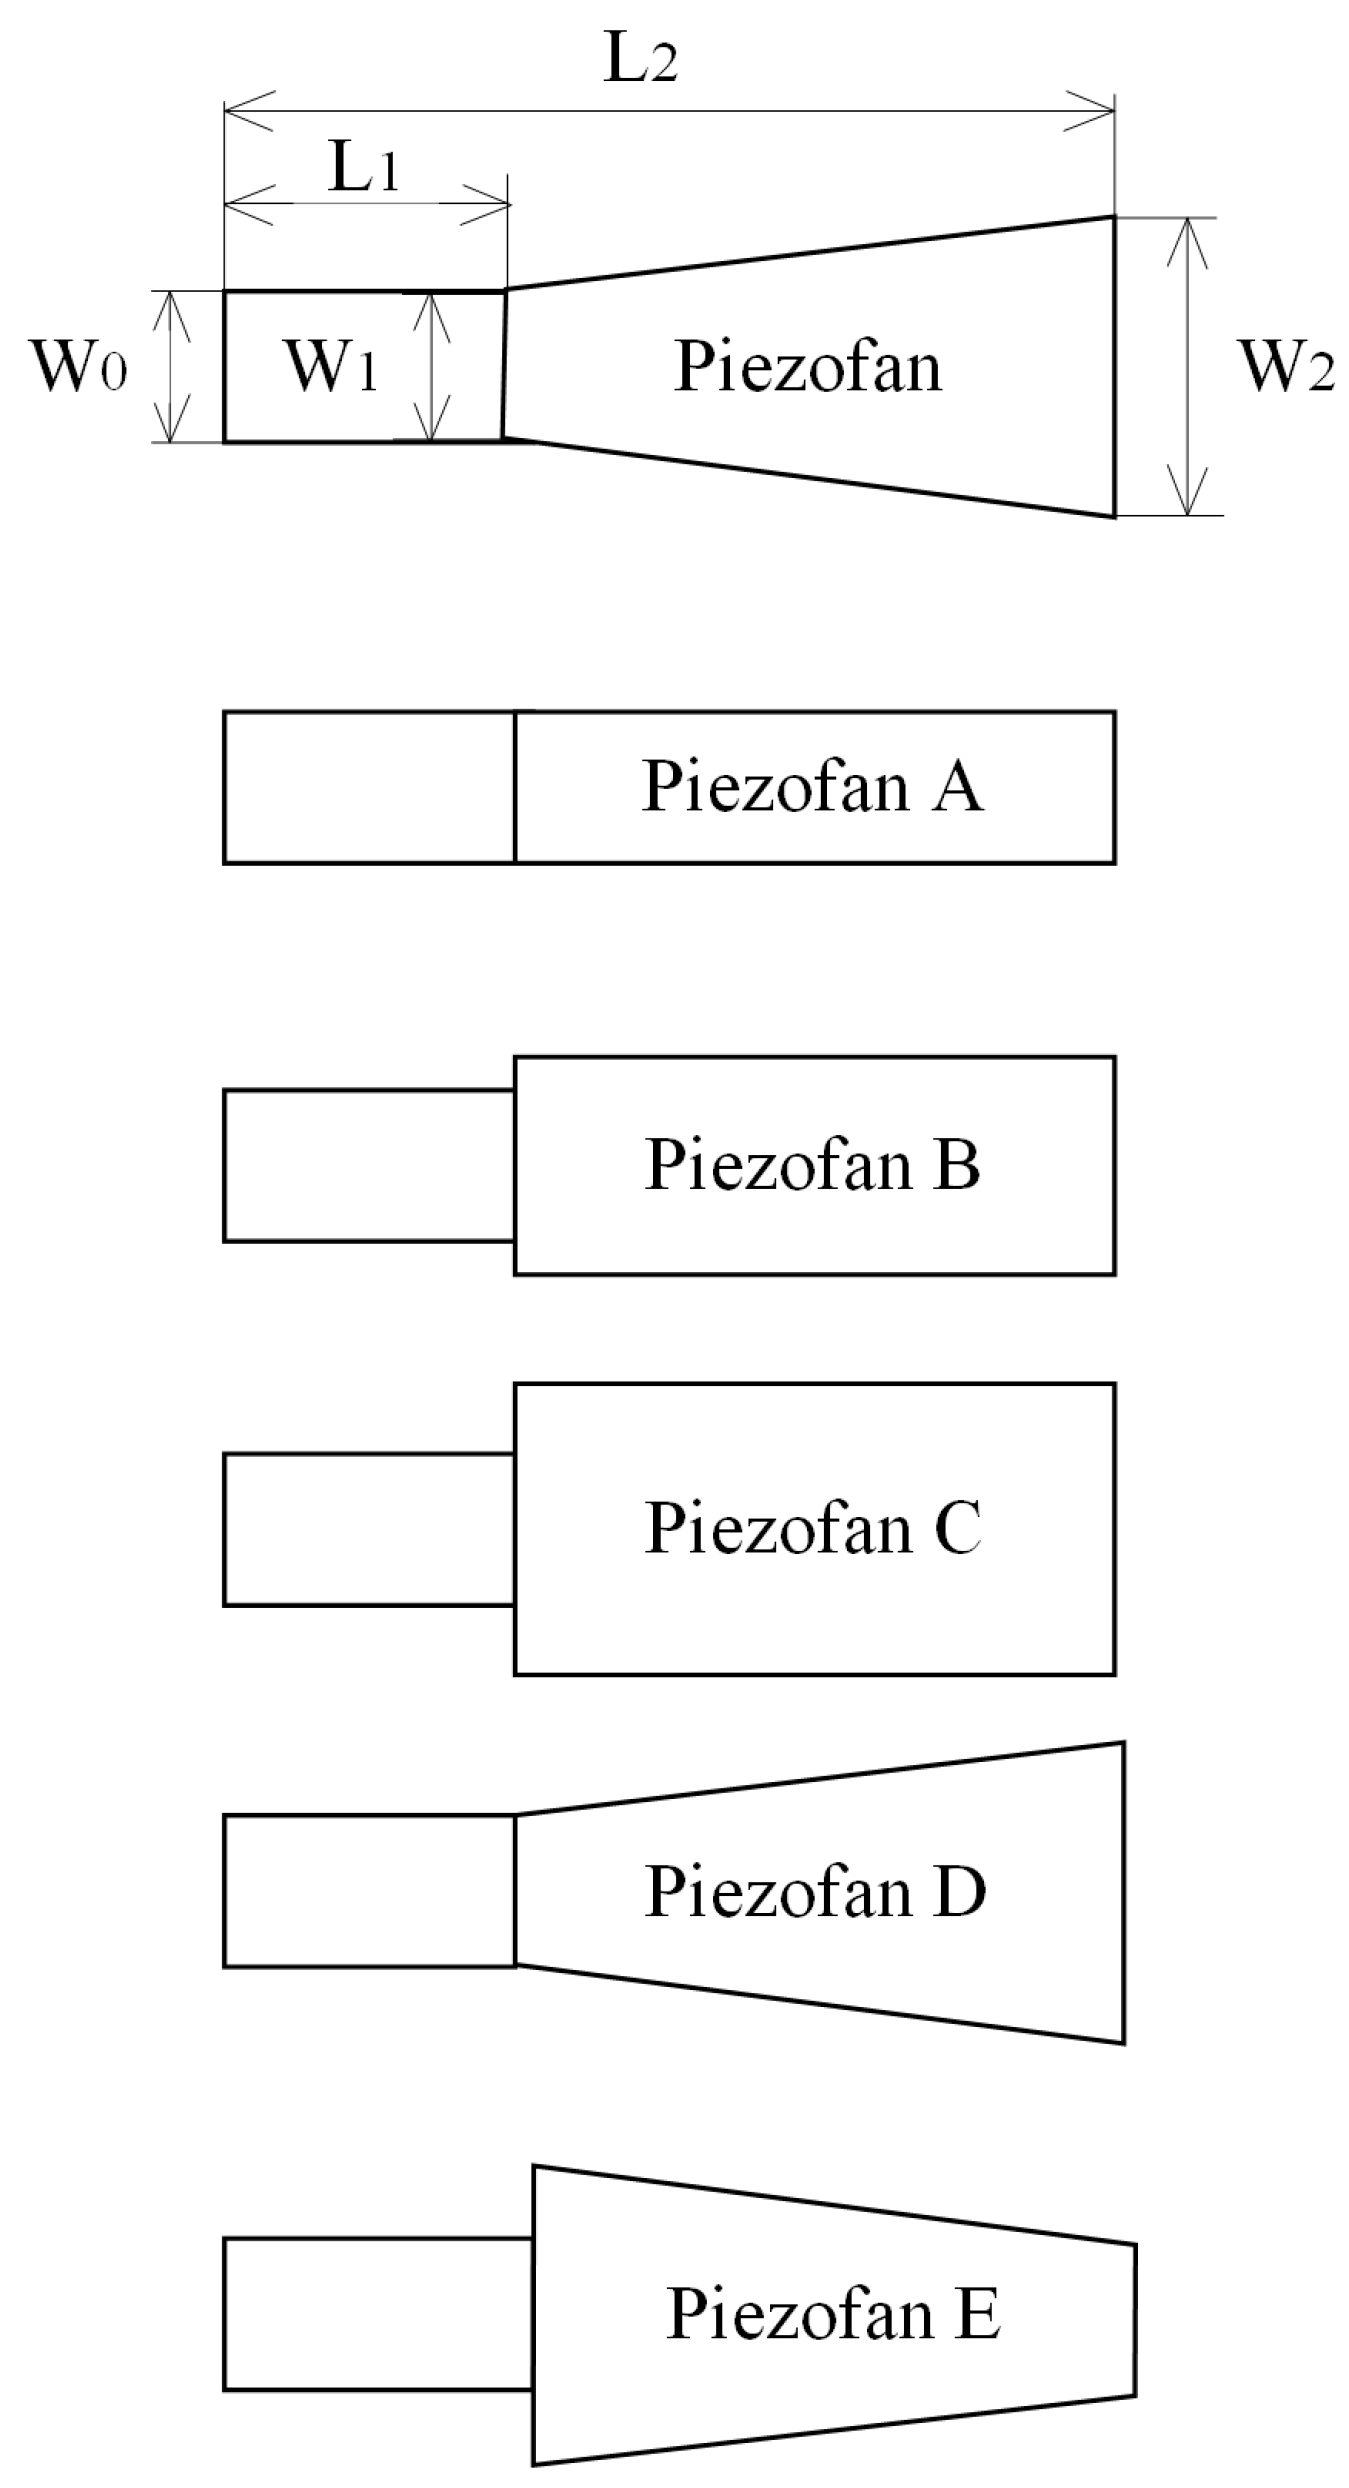
A piezofan is composed of a thin flexible blade and a piezoelectric ceramic. The piezoelectric ceramic has dimensions of 29 mm × 12.7 mm × 0.5 mm (length × width × thickness) and is commercially available, packaged with electric cords (Piezo Systems, Inc., (Woburn, MA, USA)). The length of the blade is 51 mm with an overlap of 4 mm attached to the piezoelectric ceramic, resulting in a total length of 76 mm. Schematic diagrams and dimensions of the five blade types are shown in
Figure 1 and
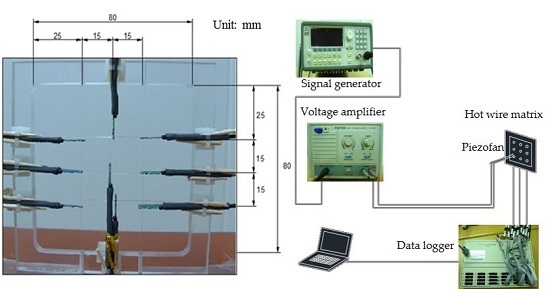
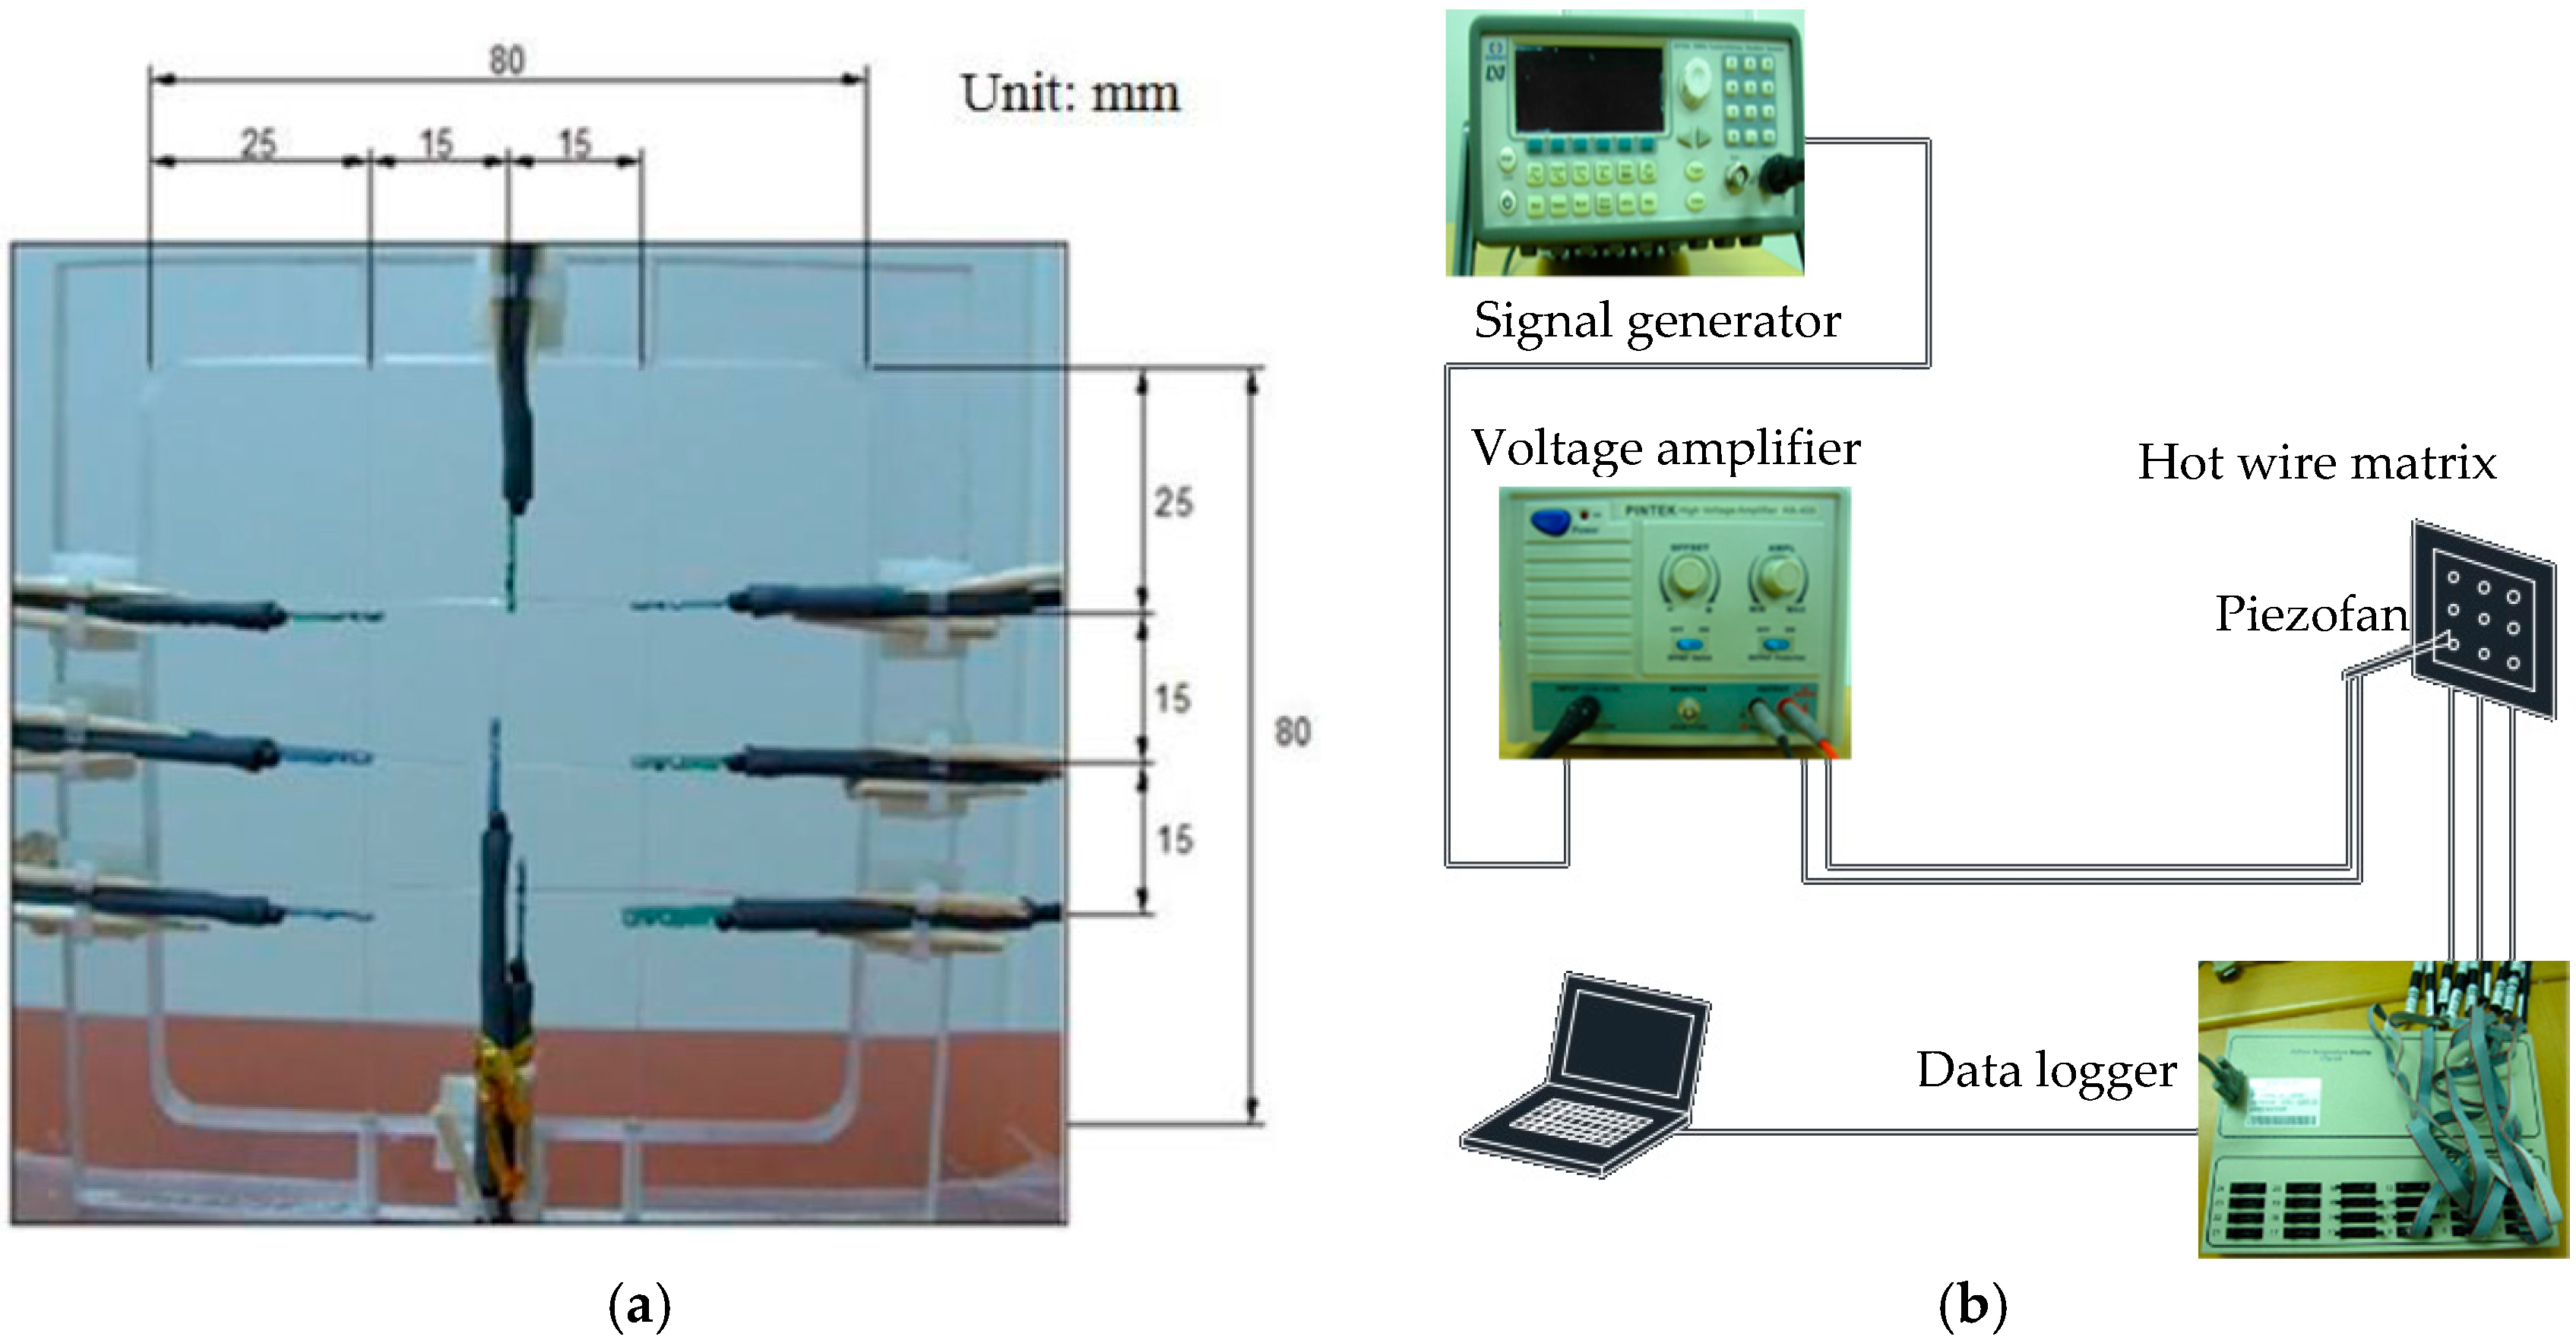
Table 1, respectively. Five sheets made of PVC or PET with different thicknesses were used as the blades for each type of piezofan to create the different resonance frequencies; thus, a total of 25 piezofans were tested in the experiment. A sinusoidal voltage with a specified resonance frequency was generated by a signal generator (PICOTEST G5100A) for each piezofan. The signal was fed to a voltage amplifier (PINTEK HA-405) to drive the piezoelectric ceramics. The amplitude of the vibration blade was adjusted via the amplification ratio.
Nine hot-wire velocity sensors were constructed as a measurement matrix to examine the average velocity magnitude downstream of the piezofan. The distance between the fan tip and the matrix is defined as d; it was 6.35–76.2 mm, adjusted using a movable platform. The velocity sensors were arranged as a 3 × 3 matrix, with a separation distance of 15 mm between sensors, as shown in
Figure 2a. Therefore, the effective measurement area was 45 mm × 45 mm. The test section was enclosed in a cubic box, whose dimensions were 750 mm × 750 mm × 750 mm, to reduce the influence of environmental air streams. The experimental setup is schematically shown in
Figure 2b.
The velocity sensors used in the measurements were made by Degree Controls, Inc. (Milford, NH, USA). Their accuracy is 10% in the measurement range of 0.15–0.75 m/s and 0.04 m/s in the measurement range of 0.76–5 m/s. The resolution of the velocity data logger (Degree Controls, Inc., ATM24) is within 1%, which results in an experimental uncertainty of less than 15% [
20]. The response of the hot-wire velocity meter corresponded to one second, which is insufficient to measure the time-varying stream induced by a piezofan vibrated at 20–50 Hz; thus, the measured velocity is a time-averaged magnitude of the velocity in the experiment.
4. Results and Discussion
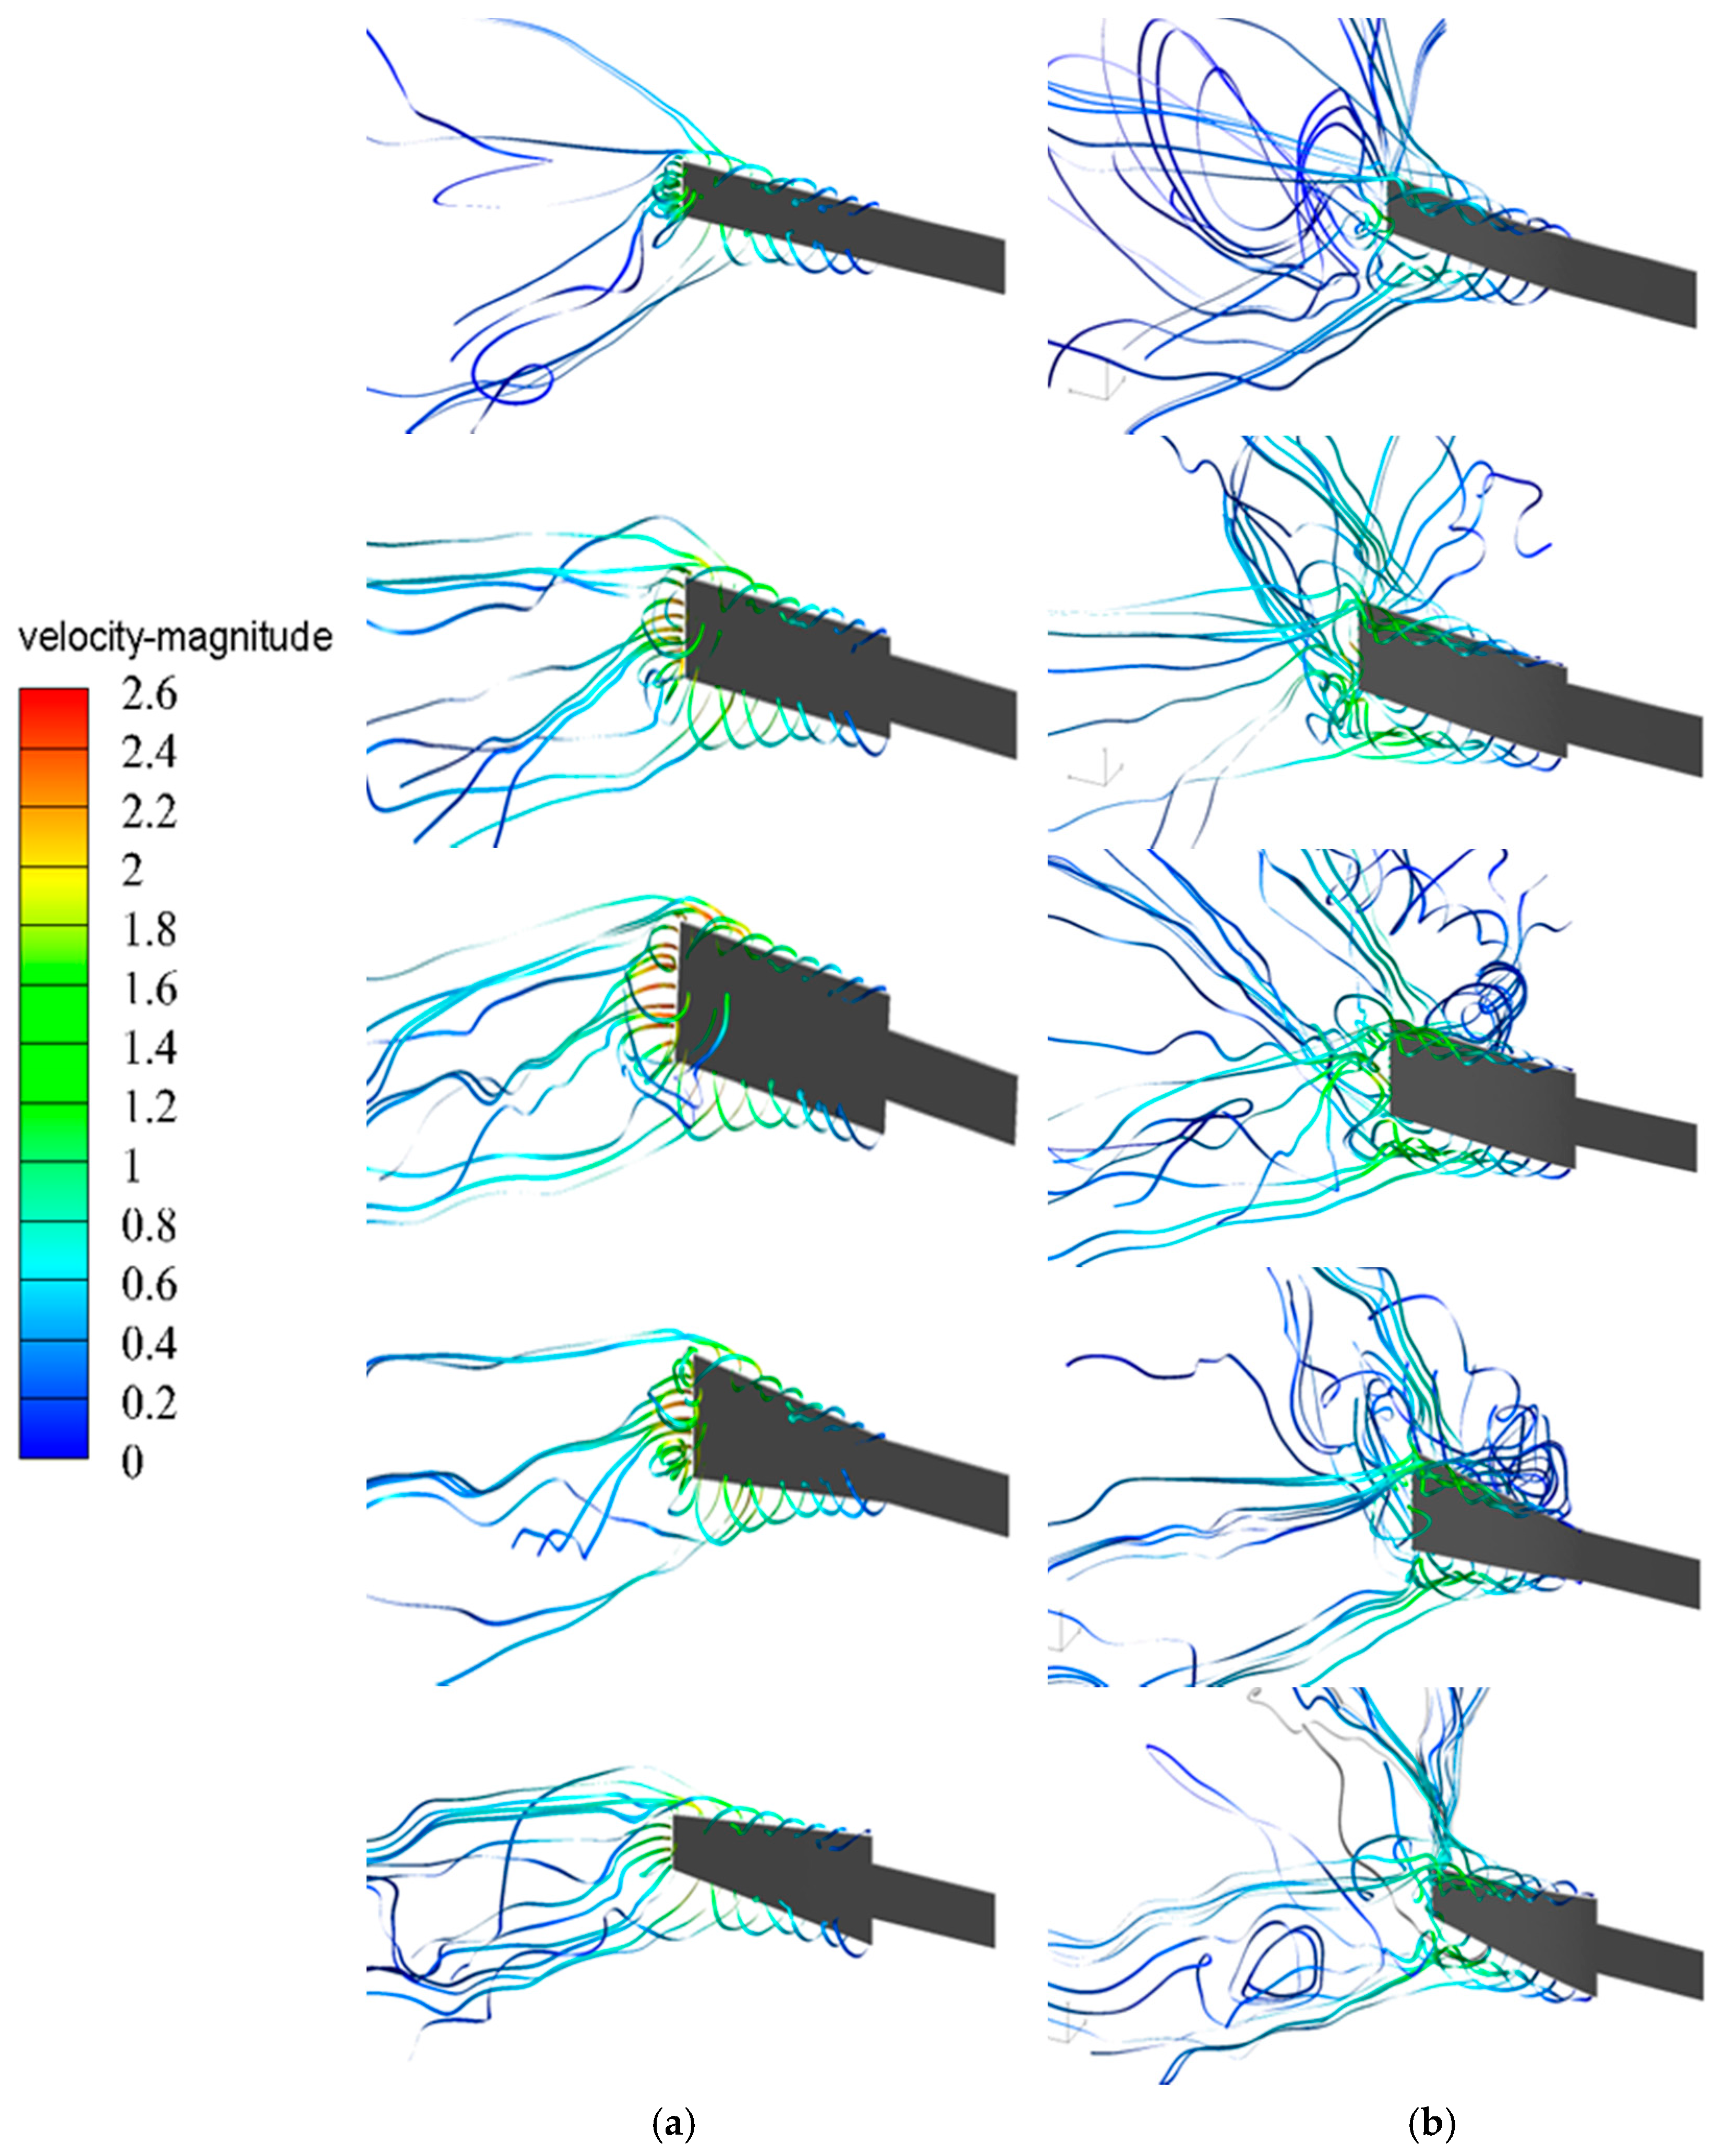
Figure 6 displays the streamlines released from the blade edges and the tip of the vibration blades under a resonance frequency of 40 Hz. The initial velocity of the released stream increases with increasing blade position along the blade base to blade tip. As the streamlines leave the blade edges, they form a pair of counter-rotating screw-type jet-like streams and flow along the longitude direction of the piezofan. When they move toward the neutral positions, as shown in
Figure 6a, they concentrate in front of the blade tip. In contrast, the streamlines became widespread when they moved to the extreme displacement position (
Figure 6b). A close inspection of
Figure 6a indicate that most of the streamlines are dragged by the moving blade and flow backward to the side surfaces of the blades, resulting in a circulation flow for Piezofans A, B, C and D. Note that, if a heat source (such as a heated cylinder or a heated plate) is placed in front of the piezofan, the circulation flow will be broken [
14,
15,
19] due to the clearance between the heat source and fan tip being smaller than the circulation zone. This recirculation flow did not appear for Piezofan E due to the blade with the trapezoidal convergent shape inducing flow that contracted to a narrow region around the tip, eliminating recirculation.
Figure 6b shows that no circulation appears ahead of the blade tip for all piezofans. The streamlines flow straight along the tangent direction of the blade edges and spread over the front of the tip due to the blade shape having the maximum deformed curve at the extreme position.
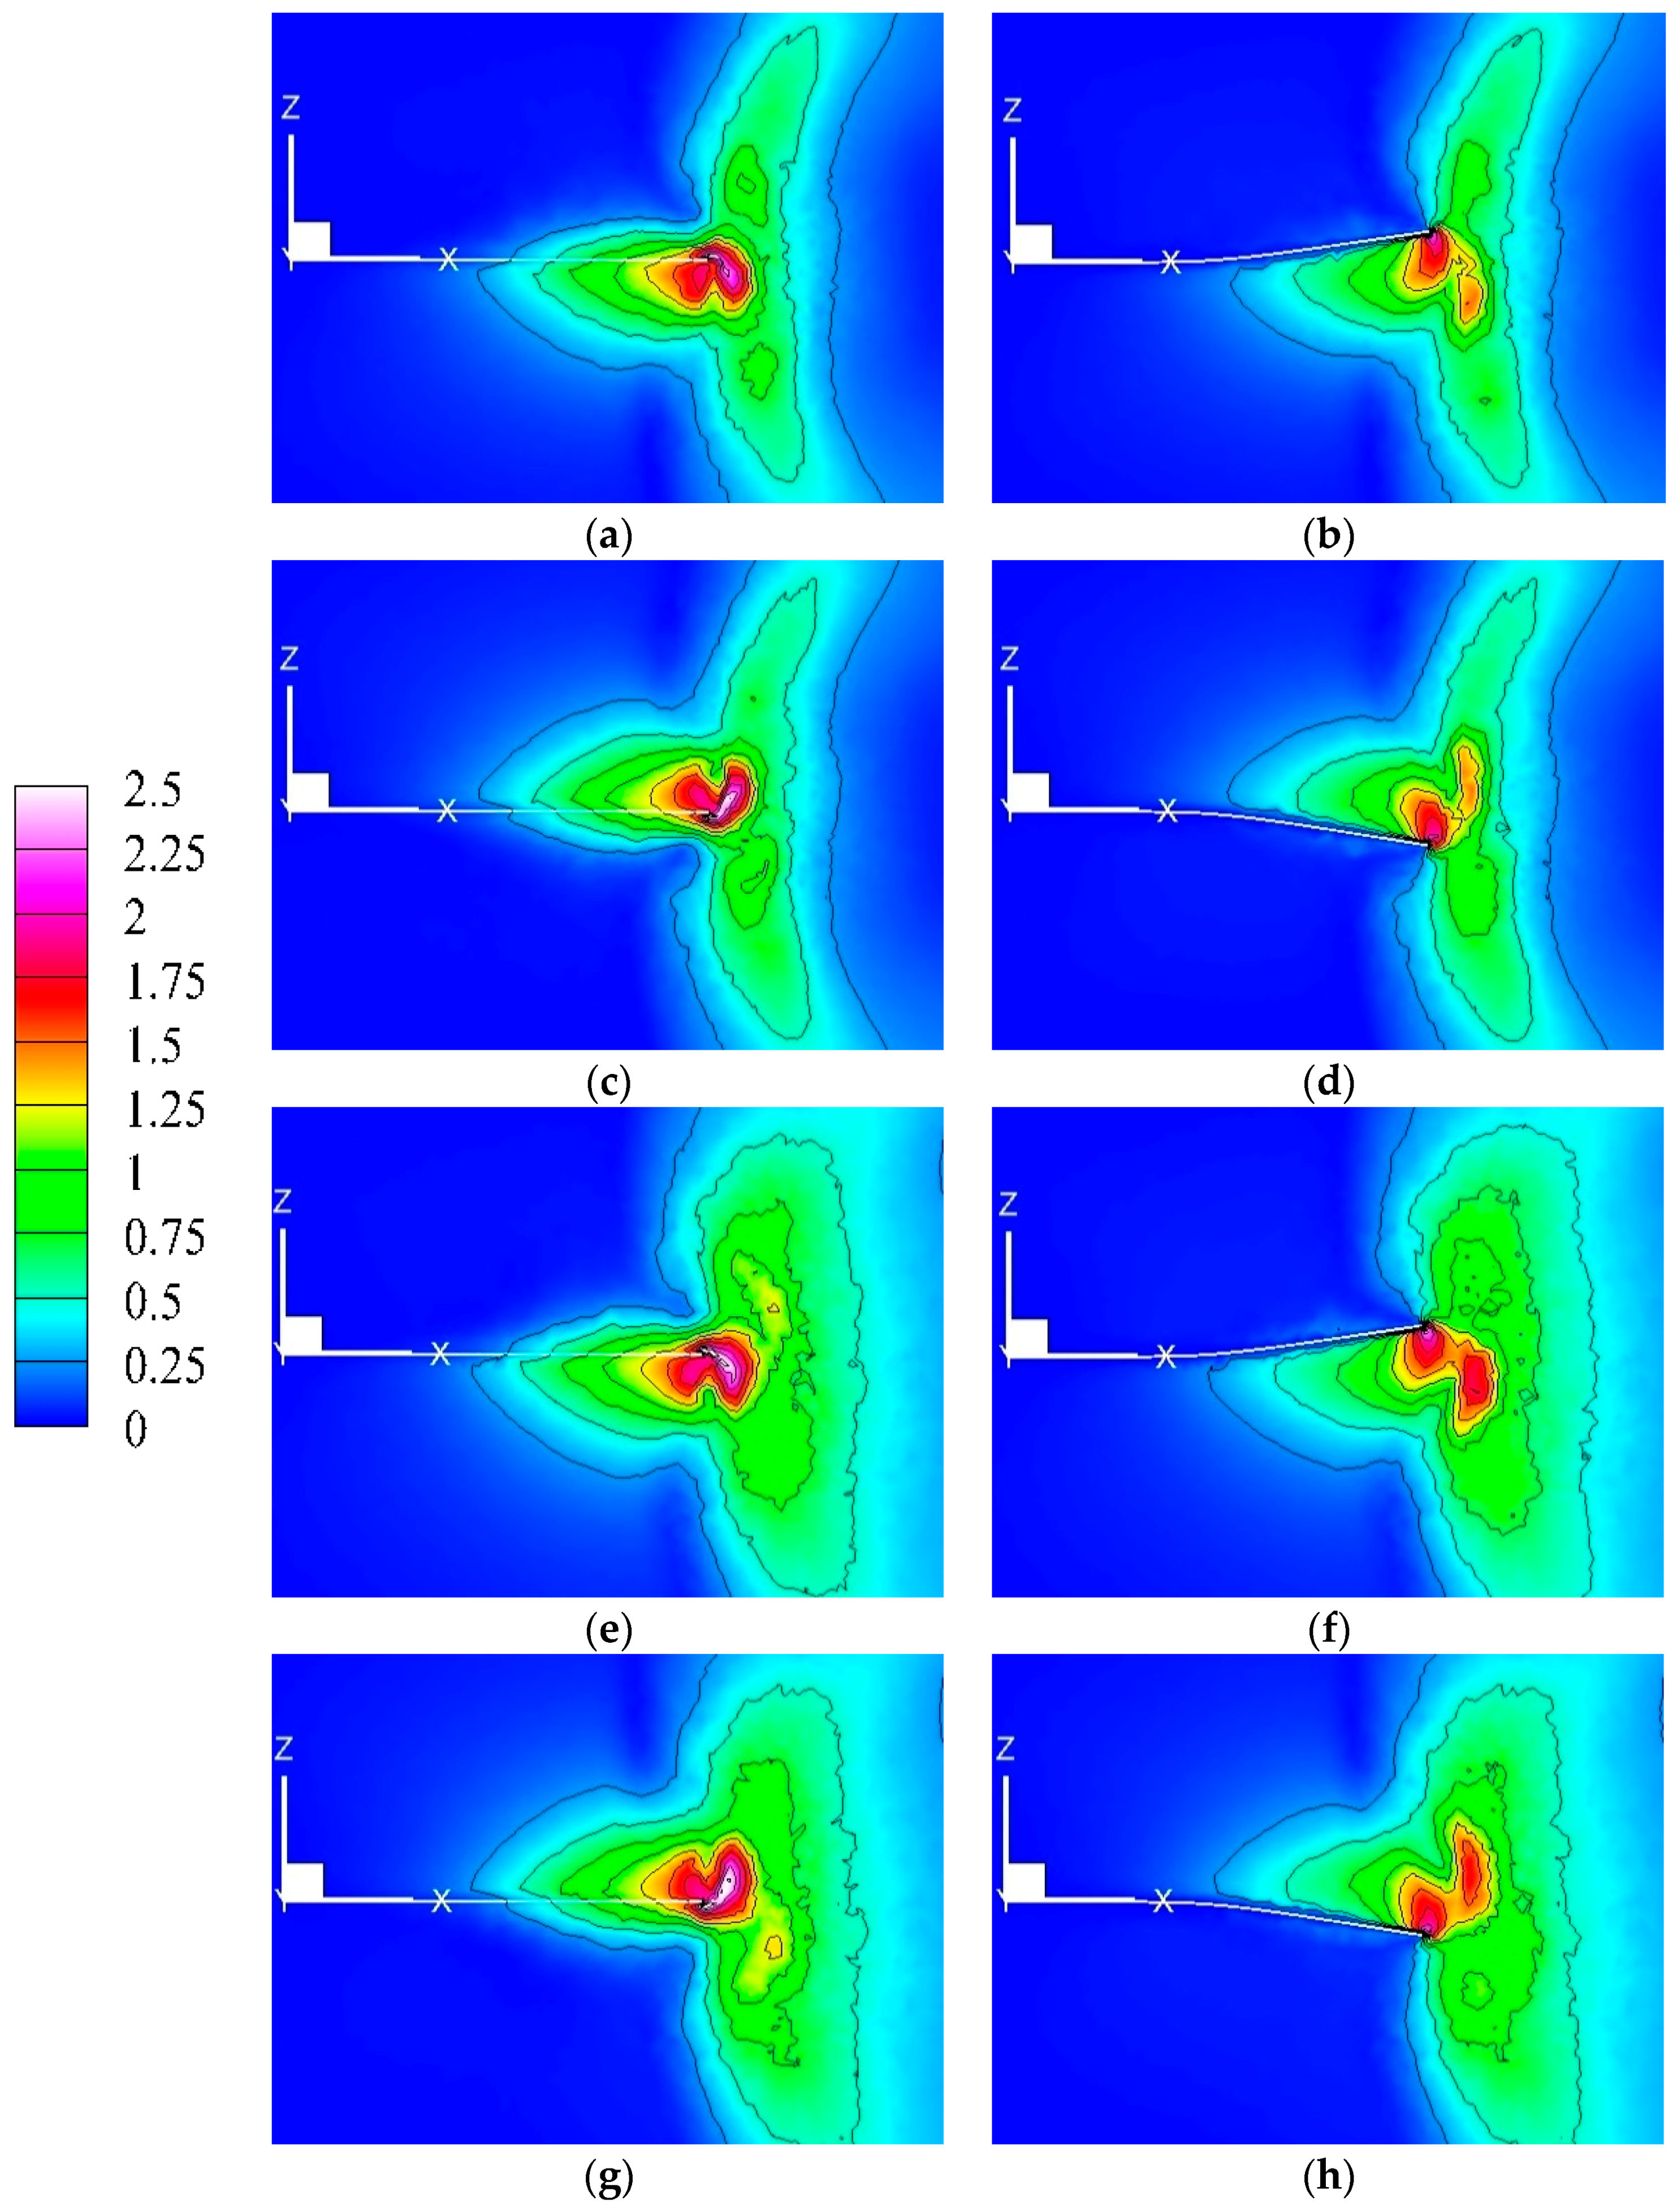
Figure 7a–d displays the velocity contours at the central plane, y = 0, of the cantilevers for a complete vibration period for Piezofan B. The velocity of the air stream induced by the vibrating cantilever at the neutral positions is greater than that at the points of extreme blade displacement due to the blade having the maximum moving velocity at the neutral positions. The maximum velocity appears at the region behind the moving blade tip; the stream is induced by the drag force of the oscillation cantilever.
Figure 7e–h shows the velocity contours for the contracted trapezoid shape (Piezofan E). Compared to the velocity contours of Piezofan B, the region of velocity greater than 0.2 m/s is smaller and contracted in the front of the blade tip. This confirms that flow circulation (shown in
Figure 6) did not appear for the contracted trapezoid blade shape.
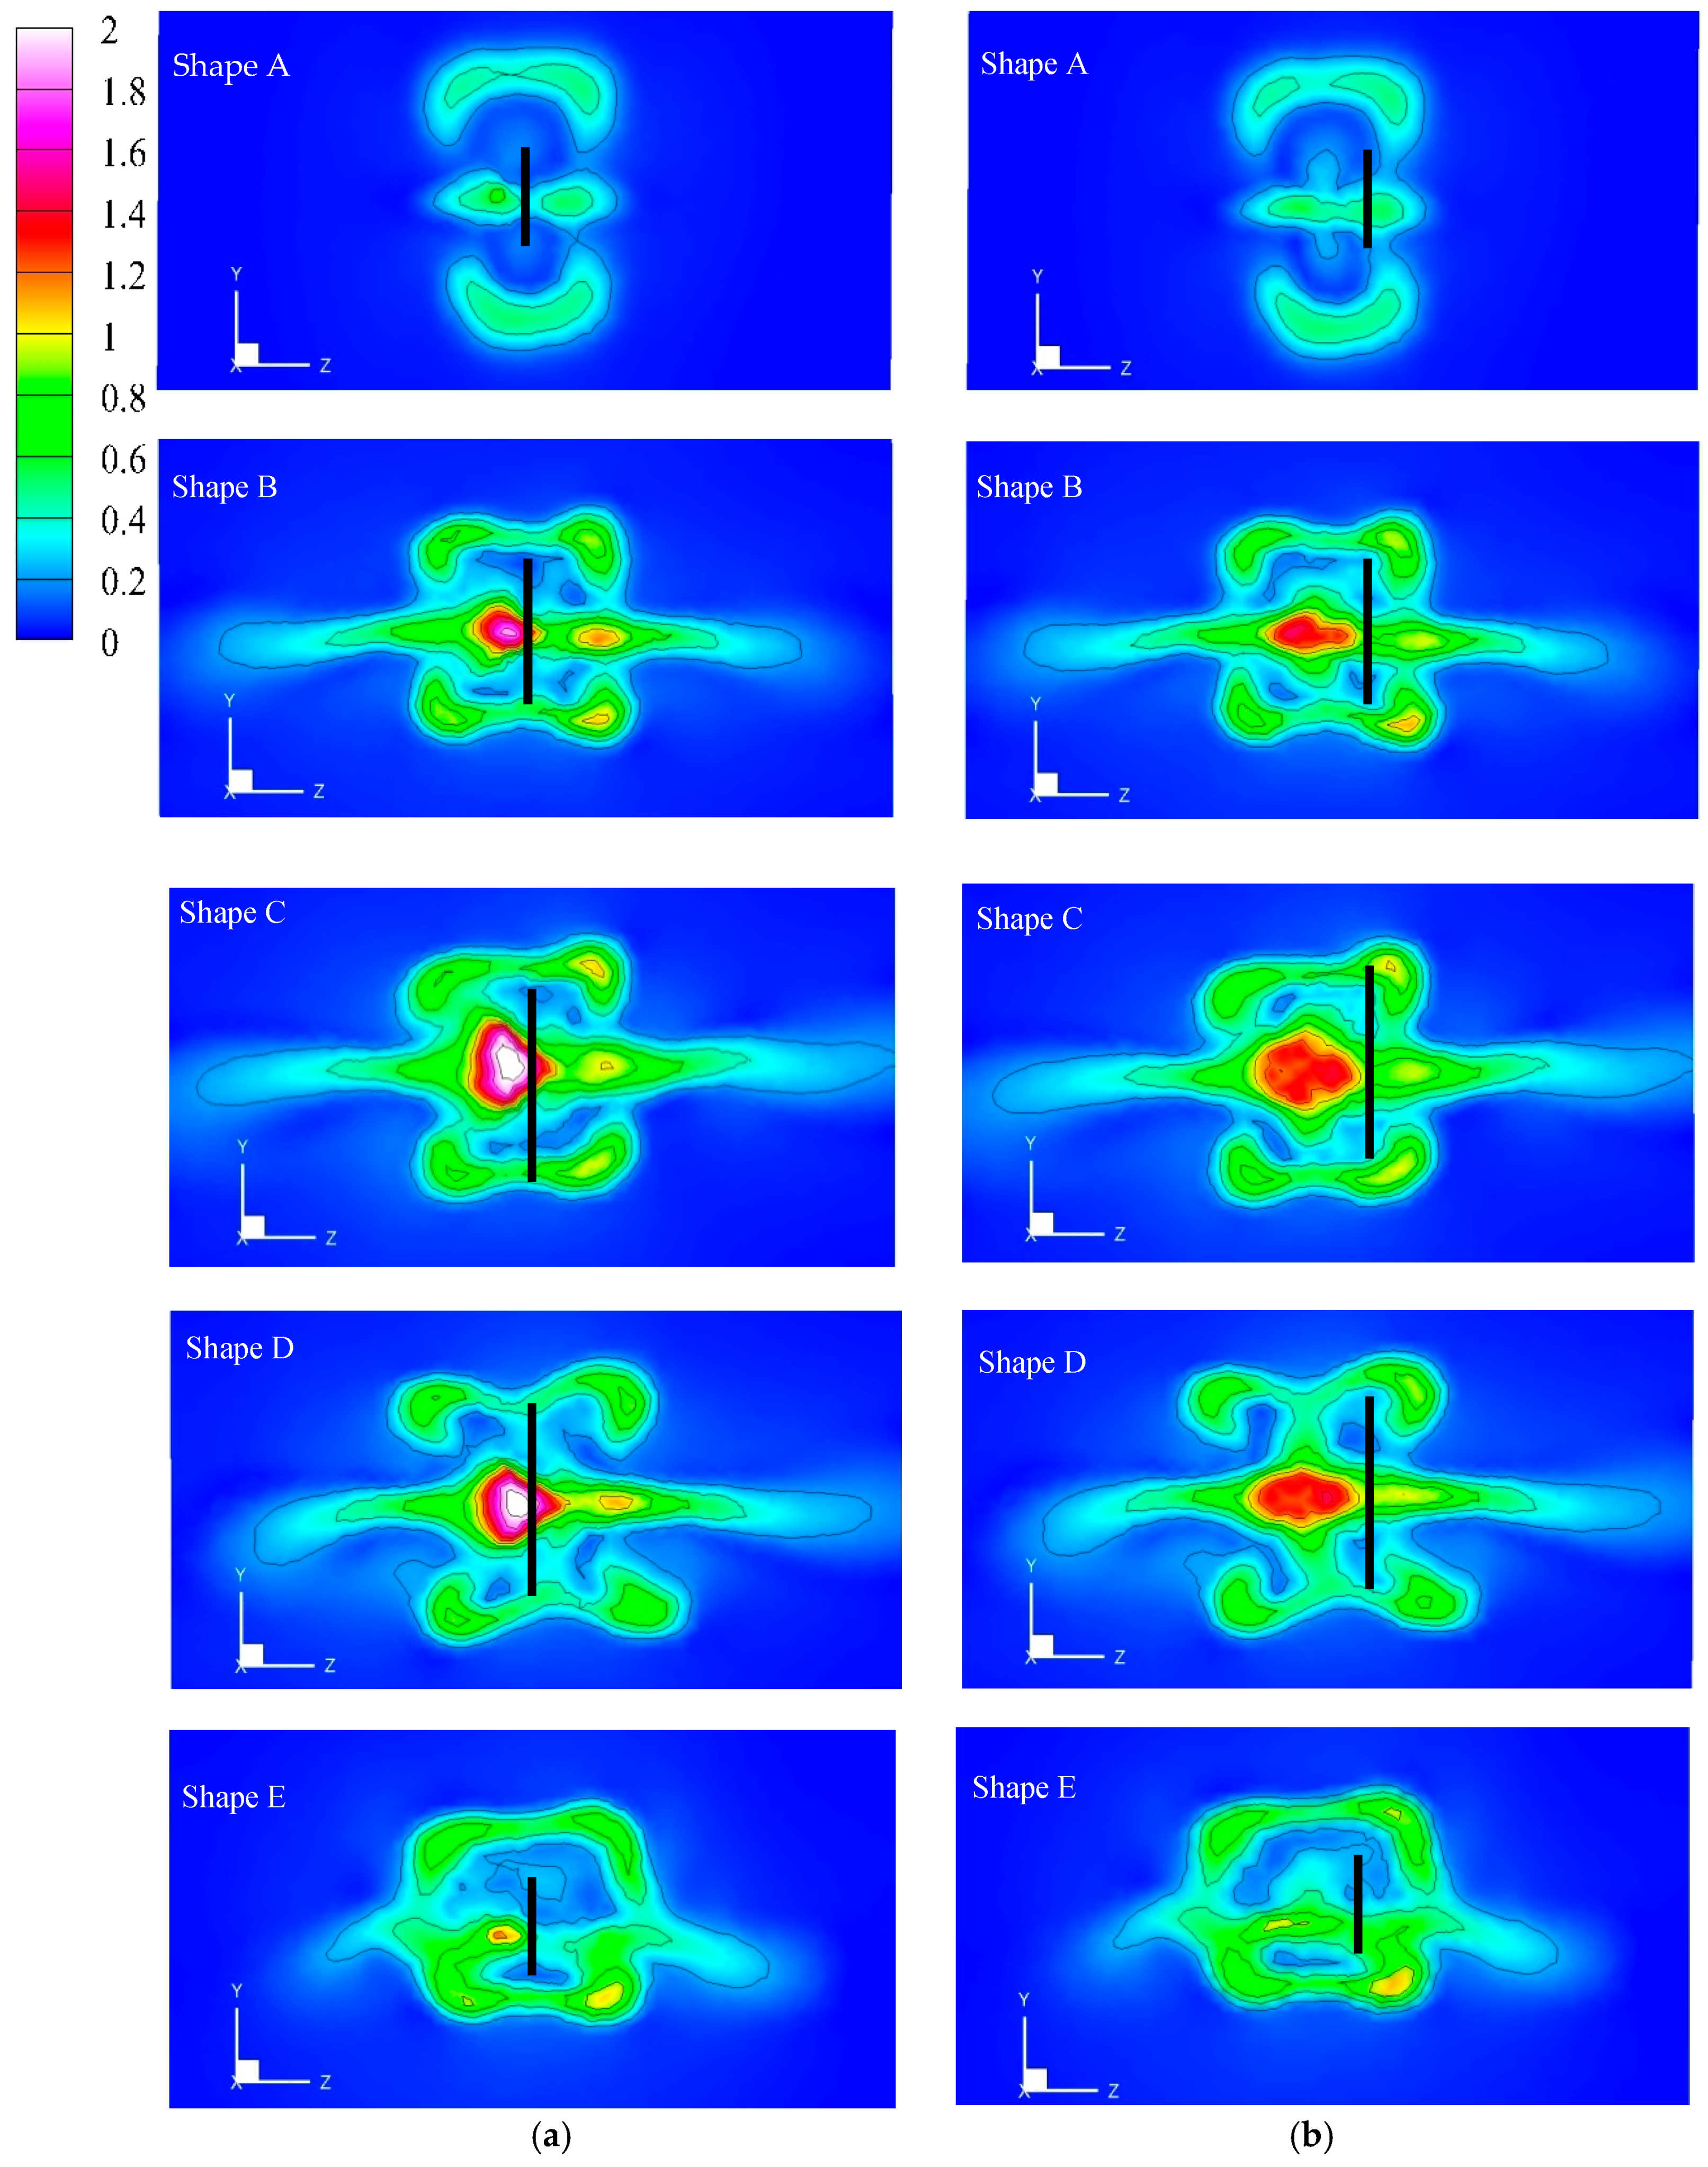
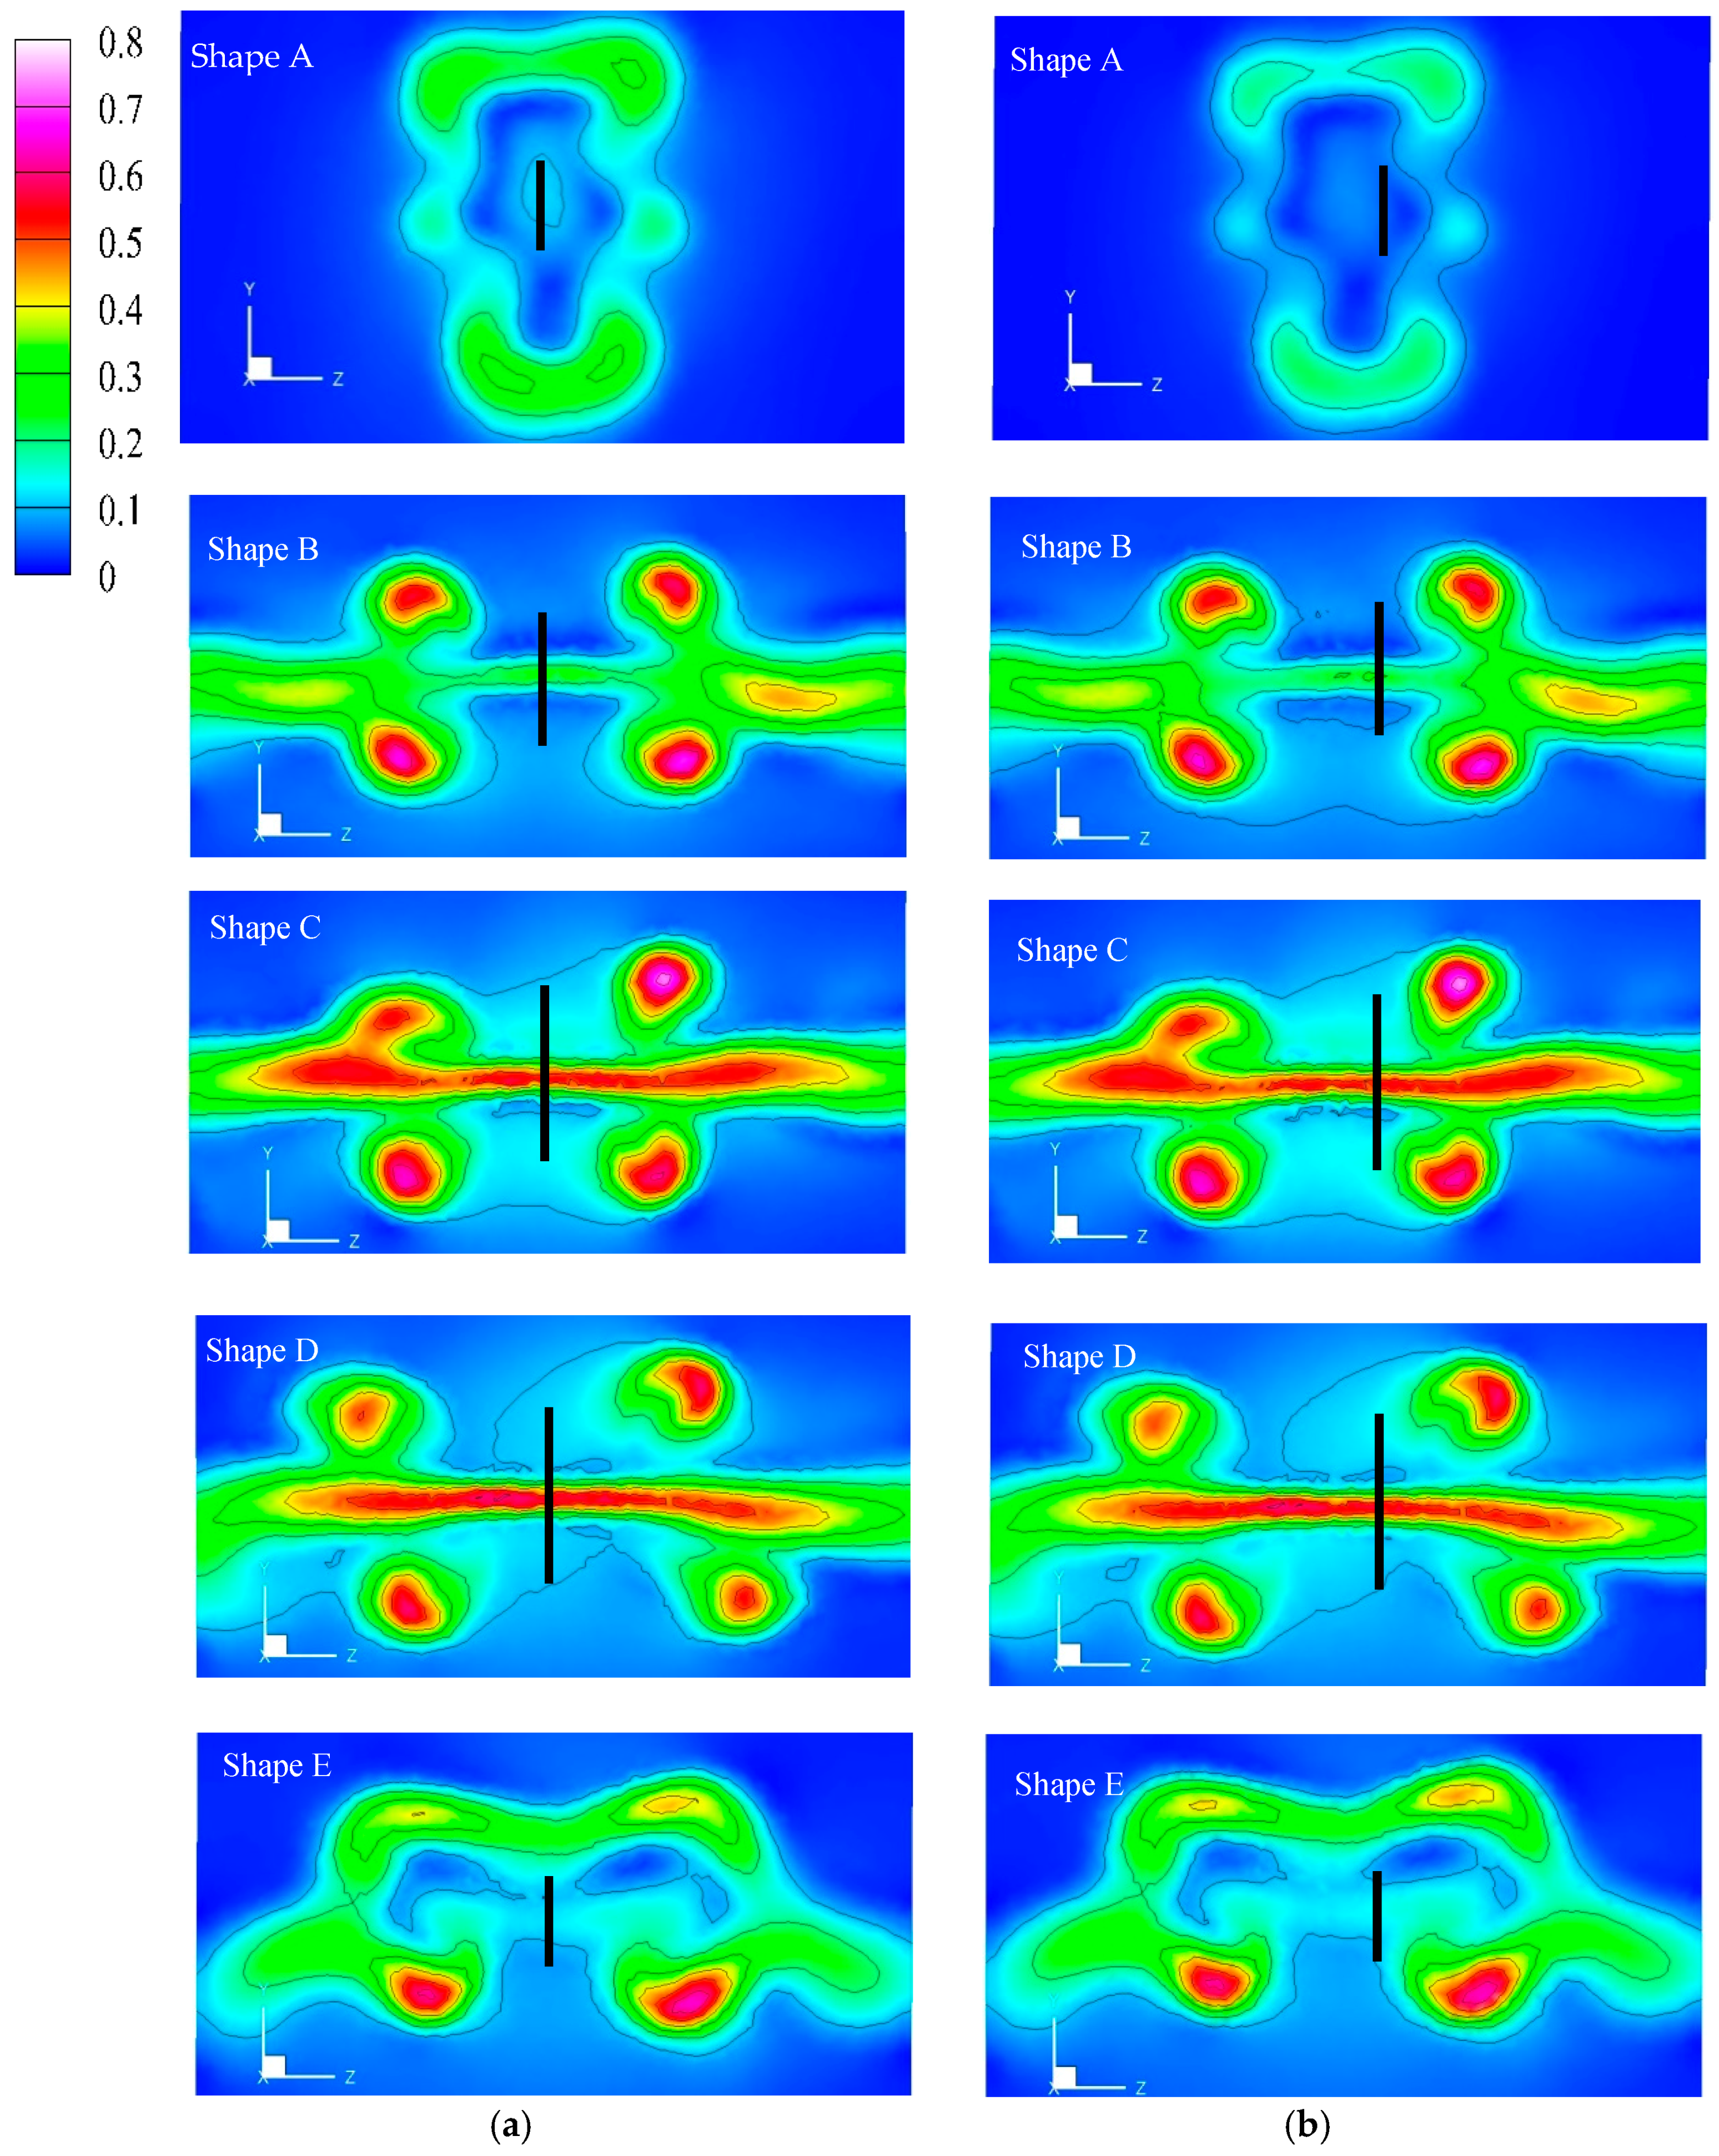
The cross-section velocity contours of the
x-axis for the five piezofans are shown in
Figure 8. These contours were obtained at a dimensionless distance of δ = 0.5 from the blade tip. Because the vibrating direction of the blade is along the
z-axis, the velocity contours extend horizontally.
Figure 8a shows that the maximum velocity regions are just behind the moving blade tip when the blade moves toward the neutral positions. In contrast to
Figure 8a, the maximum-velocity regions are not so obvious when the fan tip moves to the maximum displacement in the positive z-direction (
Figure 8b) due to the movement velocity of the blade approaching zero. Although the maximum velocity occurs around the central region, four minor high-velocity regions appear at the corners, i.e., around the extreme displacement locations of the moving blade. The velocity contours at a distance of
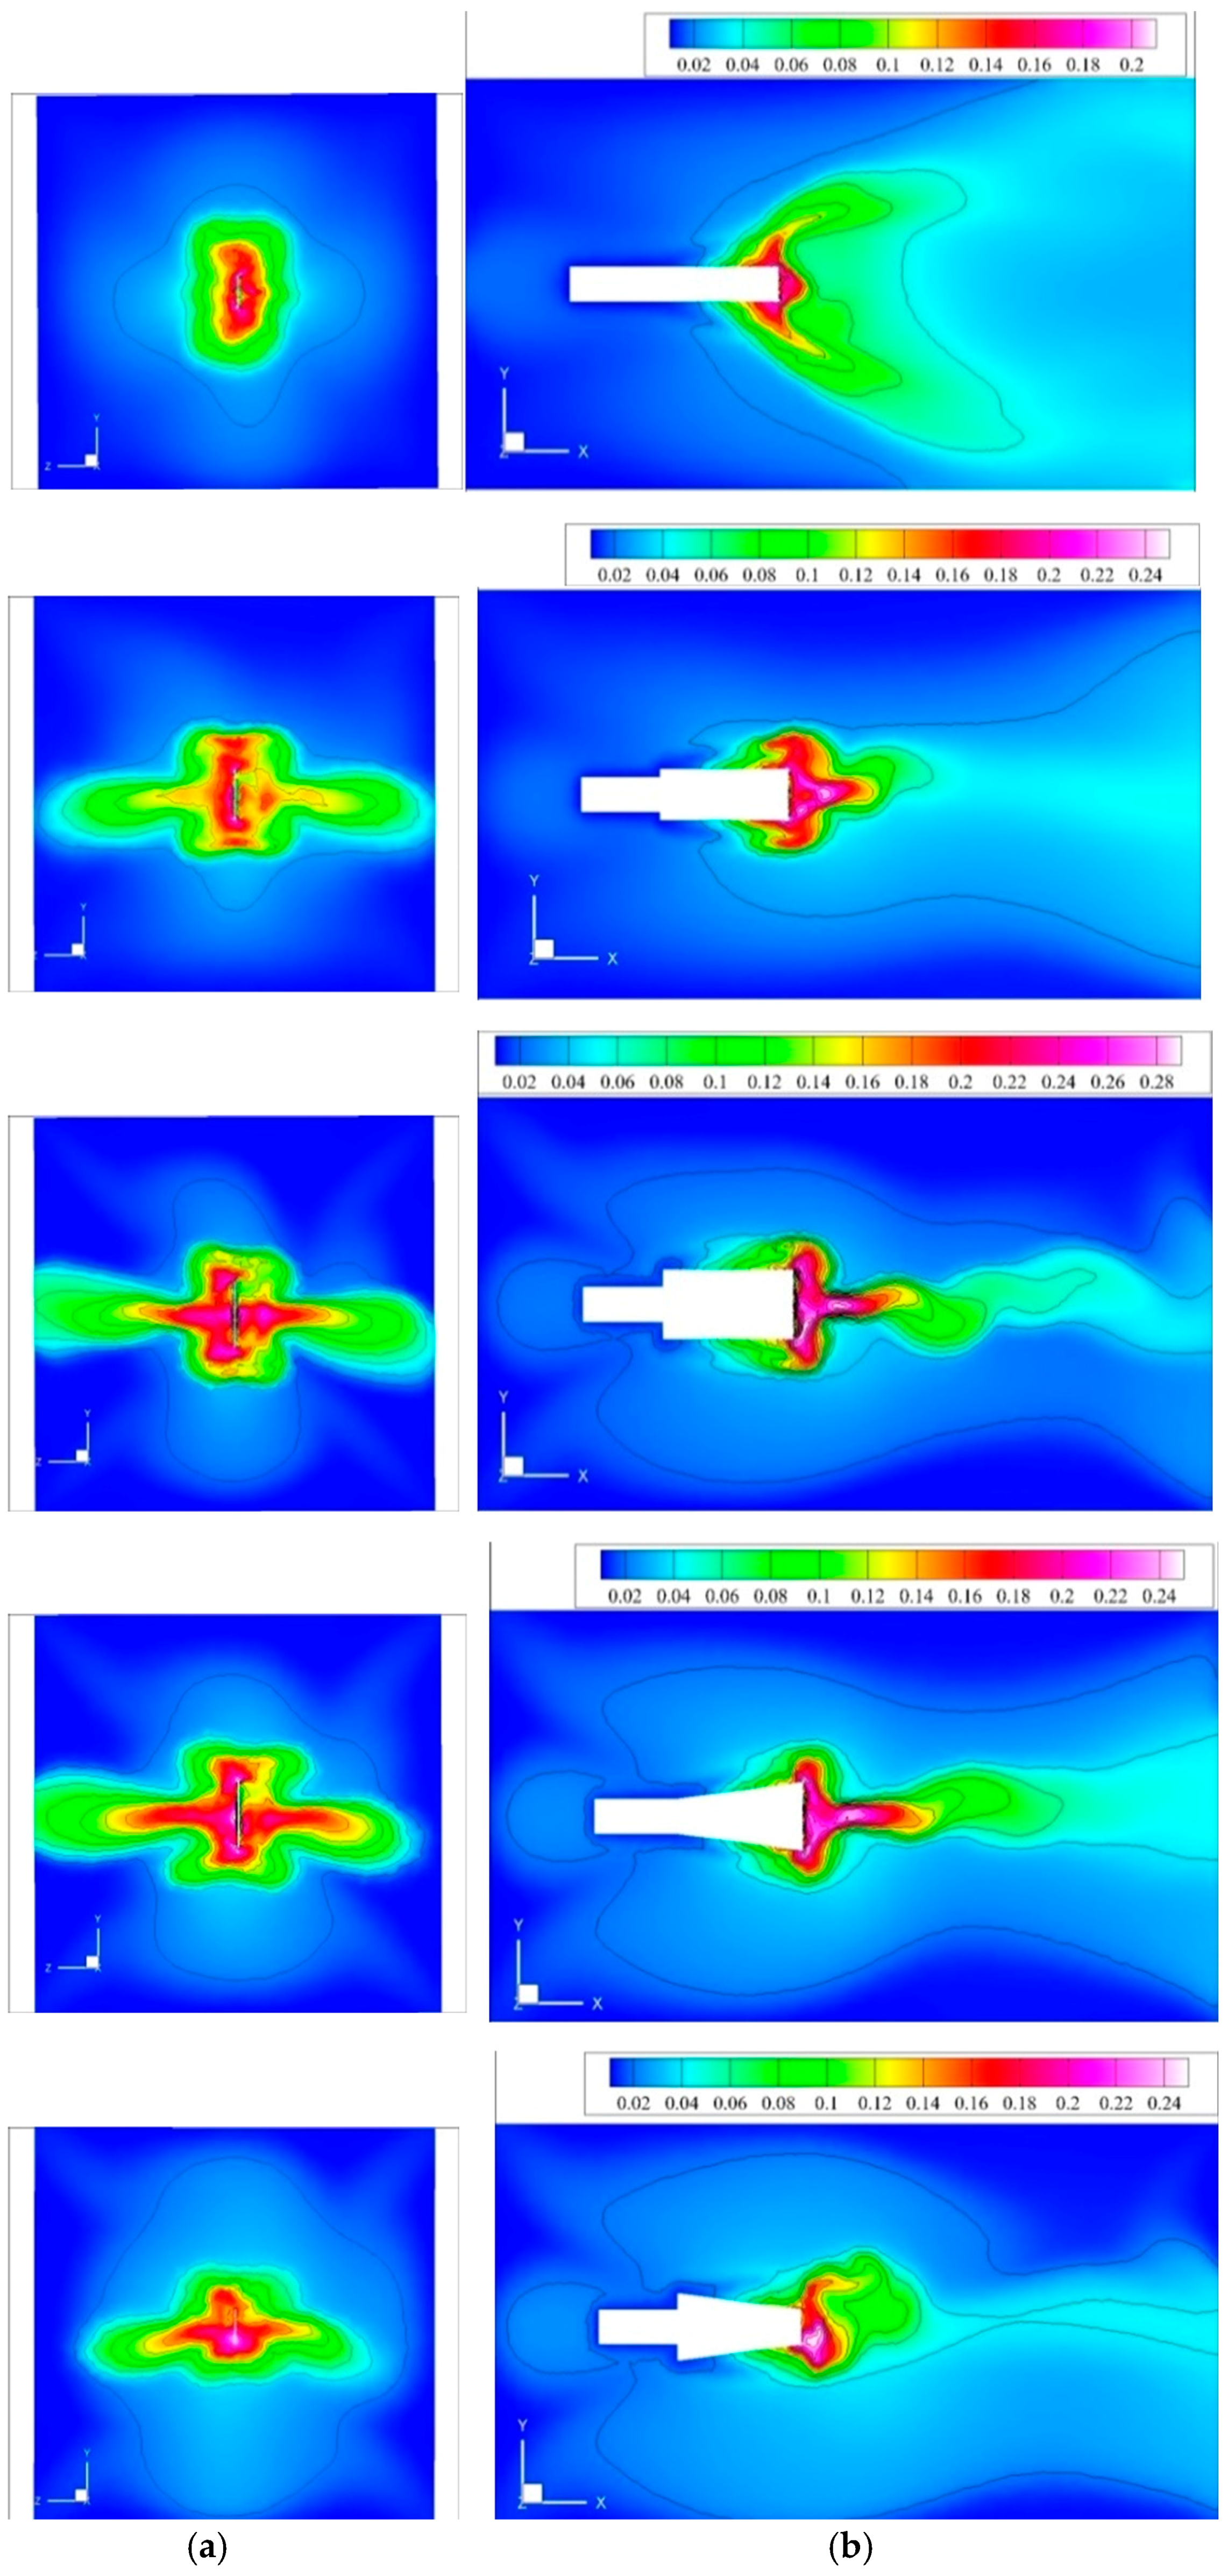
are shown in
Figure 9. The streams spread more widely since they leave farther from the piezofan, like the velocity distribution of a jet flow. The strength of flow decreases along the positive
x-direction, resulting in the velocity magnitudes being smaller than those shown in
Figure 8. The four minor high-velocity regions at the four corner are more obvious than those in
Figure 8. In addition, the velocity of the streams around the central region diverges more quickly than that of those at the four corners. For Piezofan A, the velocity decreases rapidly with the increasing of the distance from the fan tip.
Because the air flow induced by the vibrating blade is a time-varying flow field, the strength of flow is mainly dominated by the movement velocity of the blade at each location in every period. The major flow at the central region in front of the fan tip resulted from the dragging effect of the fan tip [
19]. This maximum-velocity region changed location and oscillated horizontally as the blade tip periodically vibrated. The strength of the flow decreased with increasing distance from the fan tip, as mentioned above. In contrast, the strength of the minor flow at the corner decreased more smoothly than that of the main flow. The four local minor flows in the corners are produced by the screw-type flow from the blade edges; the flows extended widely due to the large deformation of the blade. Note that the local maximum-velocity regions are less obvious for Piezofan E due to its blade having a convergent shape, resulting in the streamlines being more concentrated around the center region compared to those of other shapes. The blade with a contracted shape (piezofan E) is thus the better for hot spots heat source than those with divergent and rectangular shapes.
The turbulence intensities, I, at the fan tip plane and middle plane of the piezofans are displayed in
Figure 10. The turbulence intensity is strongest around the fan tip due to the greater displacement there. The distributions of the turbulence intensity around the fan tip are similar to those of the velocity contours shown in
Figure 8a. This reveals that turbulence intensity coincides with velocity distribution around the fan tip.
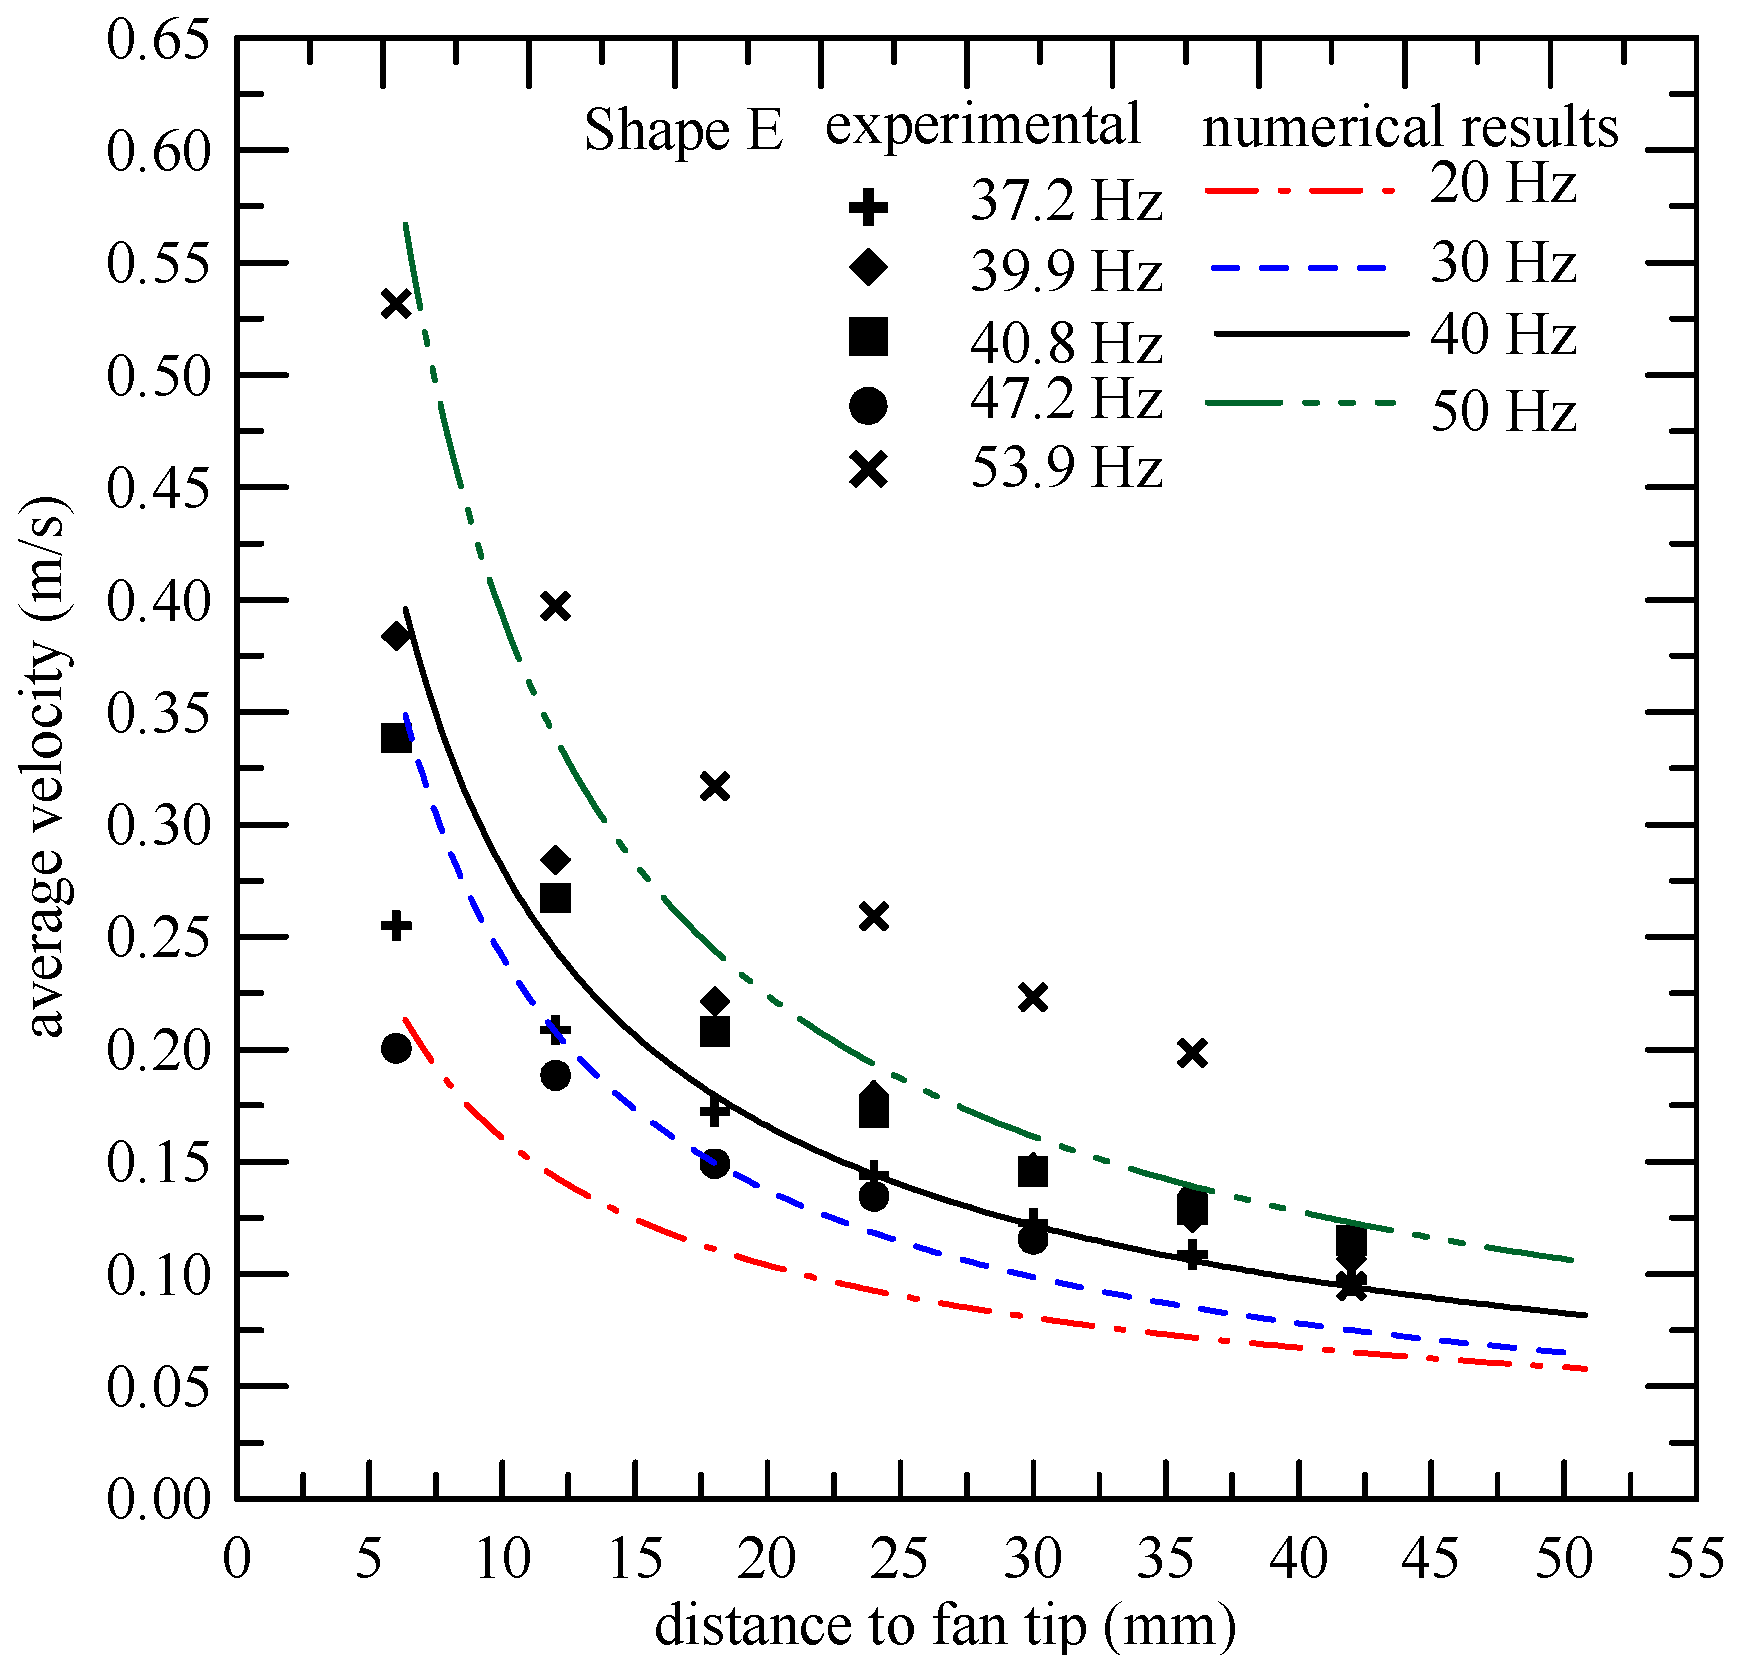
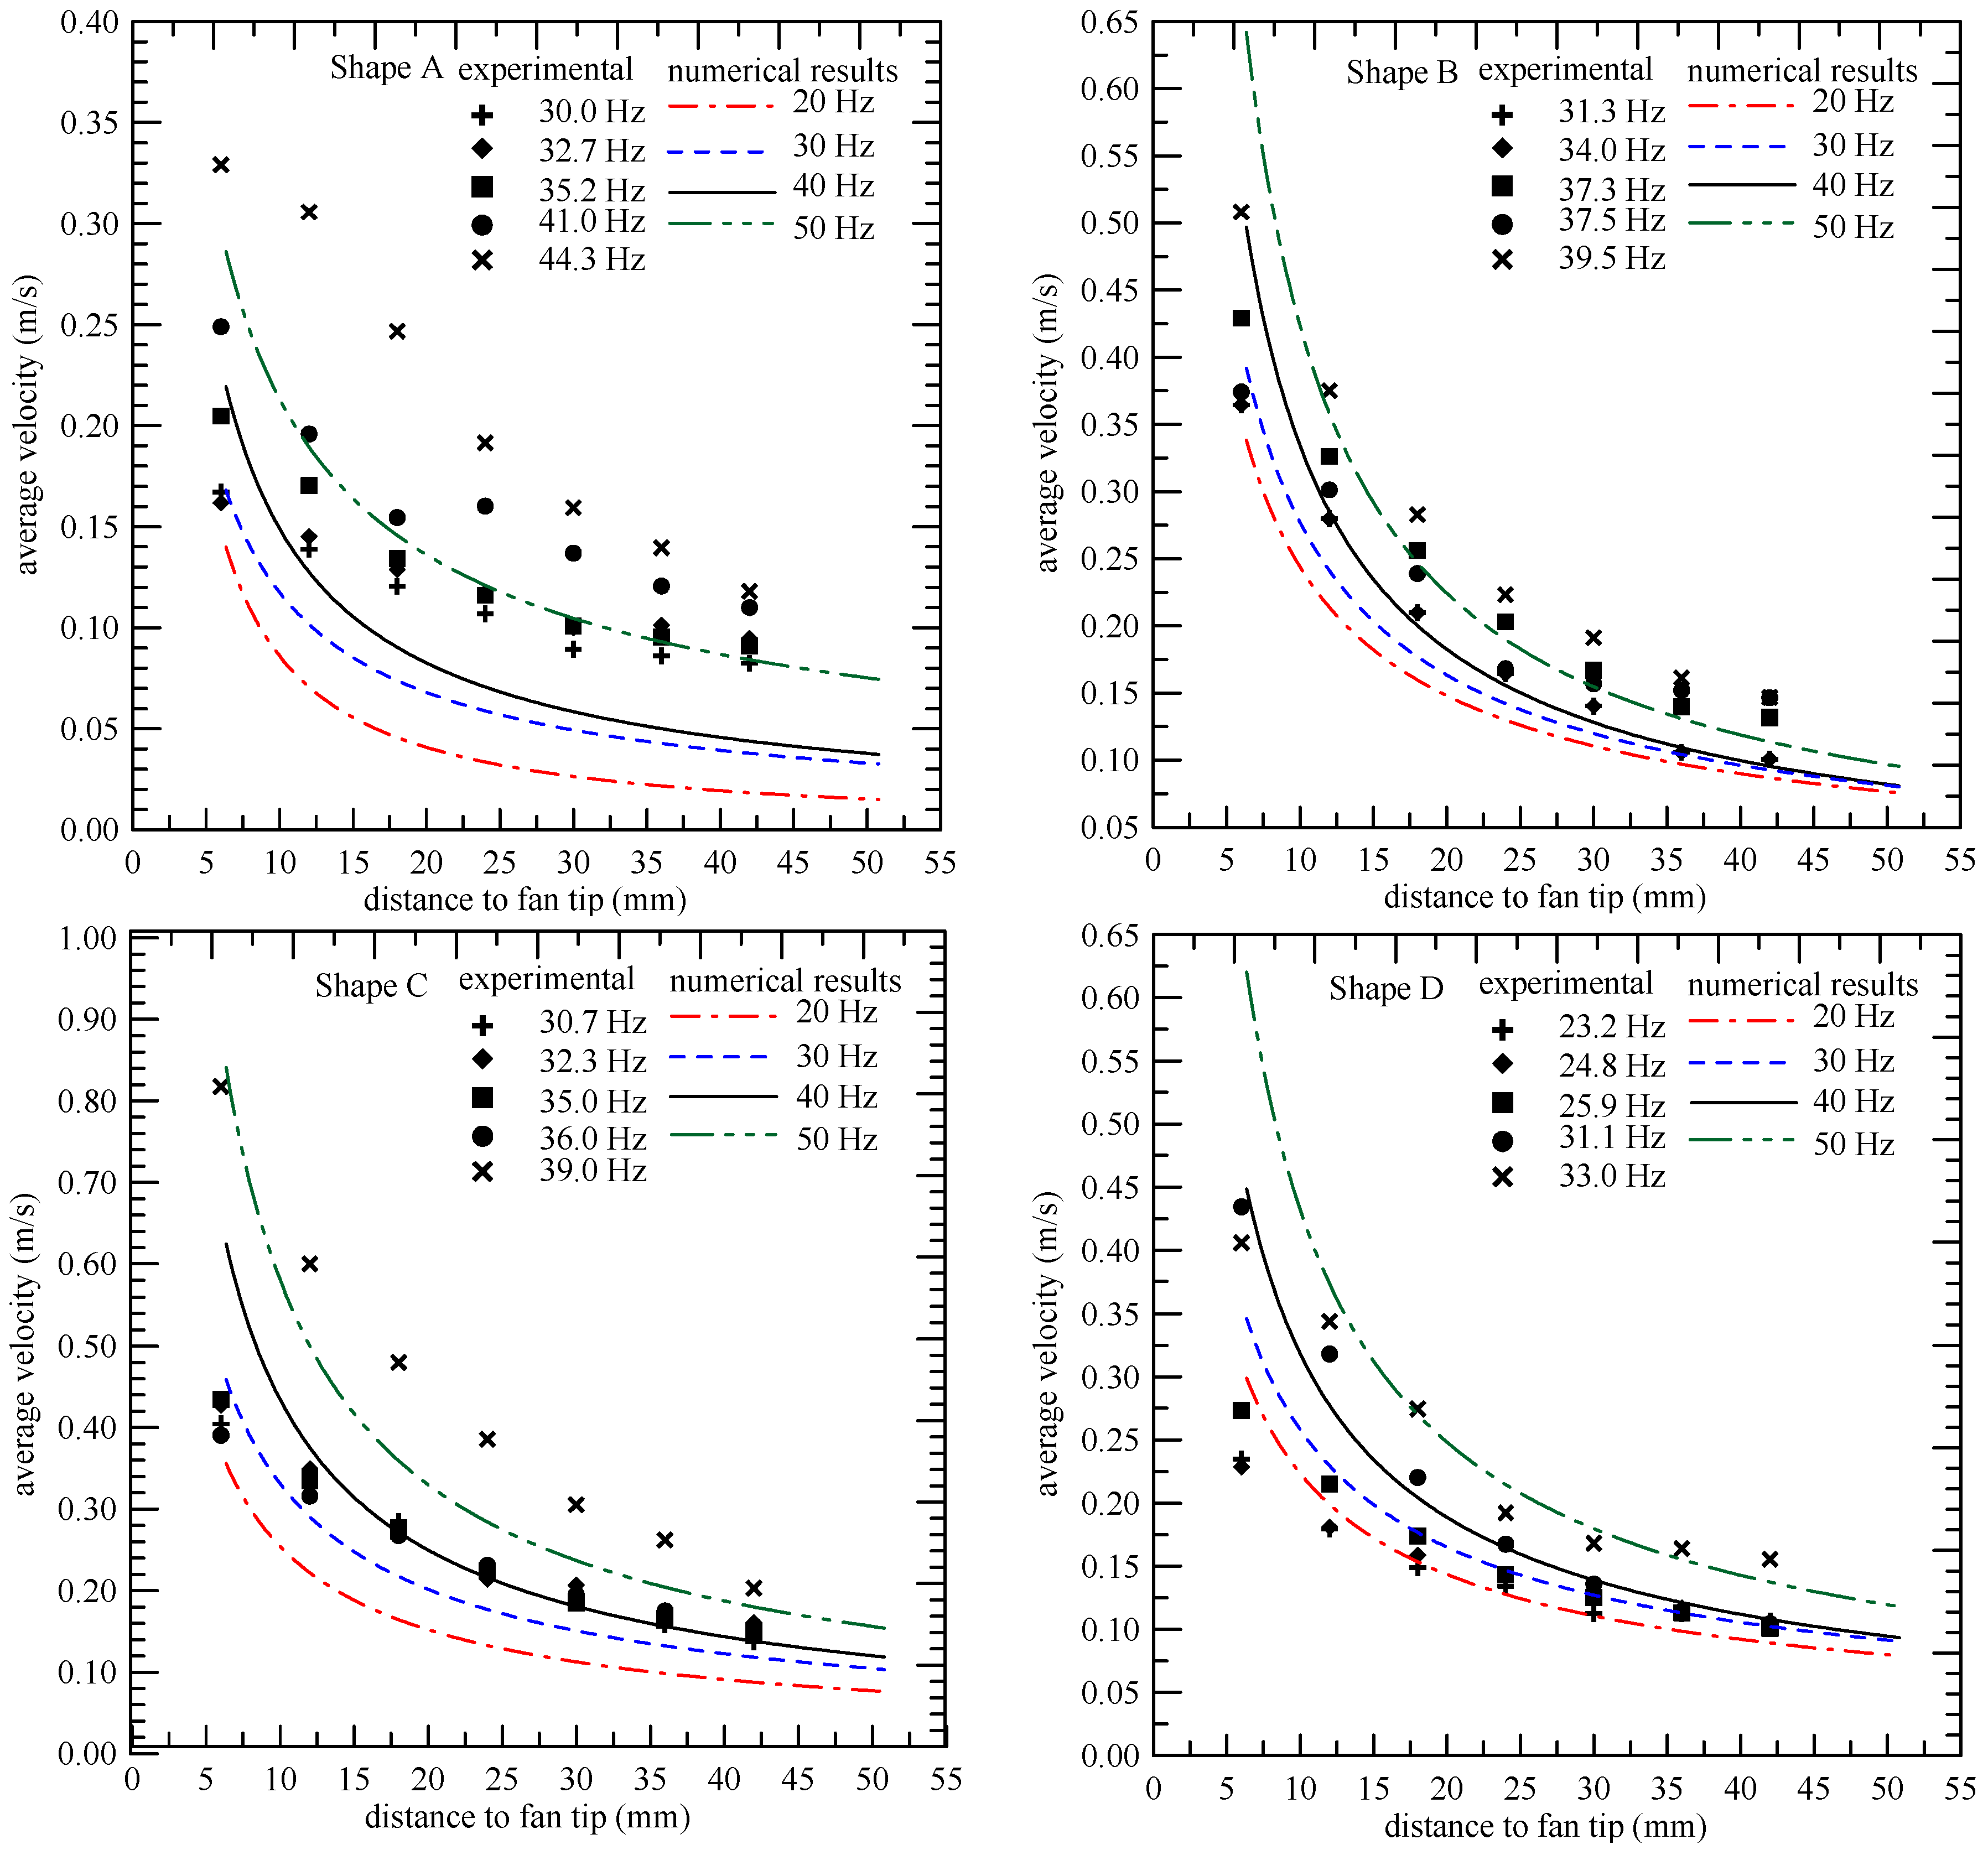
Figure 11 displays the average velocity varying with the distance from the fan tip along the neutral direction of the blade (positive
x-direction). The average velocity was calculated from the grid data within a square area of 45 mm × 45 mm in front of the fan tip. The resonance frequencies used in the numerical simulation are 20, 30, 40 and 50 Hz, respectively. As expected, the velocity decreases with increasing distance away from the fan tip and increases with increasing resonance frequency. The average velocity of the streams decays steeply at a short distance, about 20 mm (δ = 1.5), from the blade tip, and then decreases smoothly at a large distance from the blade tip. The velocity distribution variation with the distance from the blade tip is similar to that of a jet-like flow, but decreases more rapidly. The experimental results are also presented in
Figure 11 to validate the accuracy of the numerical results. The trends of the numerical results are consistent with those of the experimental measurements. The velocities obtained in the experiment are all greater than those of the numerical results. The deviations are 2%–35% for Piezofan A, 5%–25% for Piezofan B, 3%–38% for Piezofan C, 2%–33% for Piezofan D and 2%–32% for piezofan E, respectively. Note that the resonance frequencies used in the experiment for each piezofan cannot be completely the same as the numerical simulation. They depend on the dimensions of the blade and the composite stiffness of the fan blade with the piezoelectric ceramics. Among the five piezofans, Piezofan E (D) had the highest (lowest) resonance frequencies for the given blade material. Accordingly, the resonance frequency increases with decreasing width ratio, W
2/W
1.
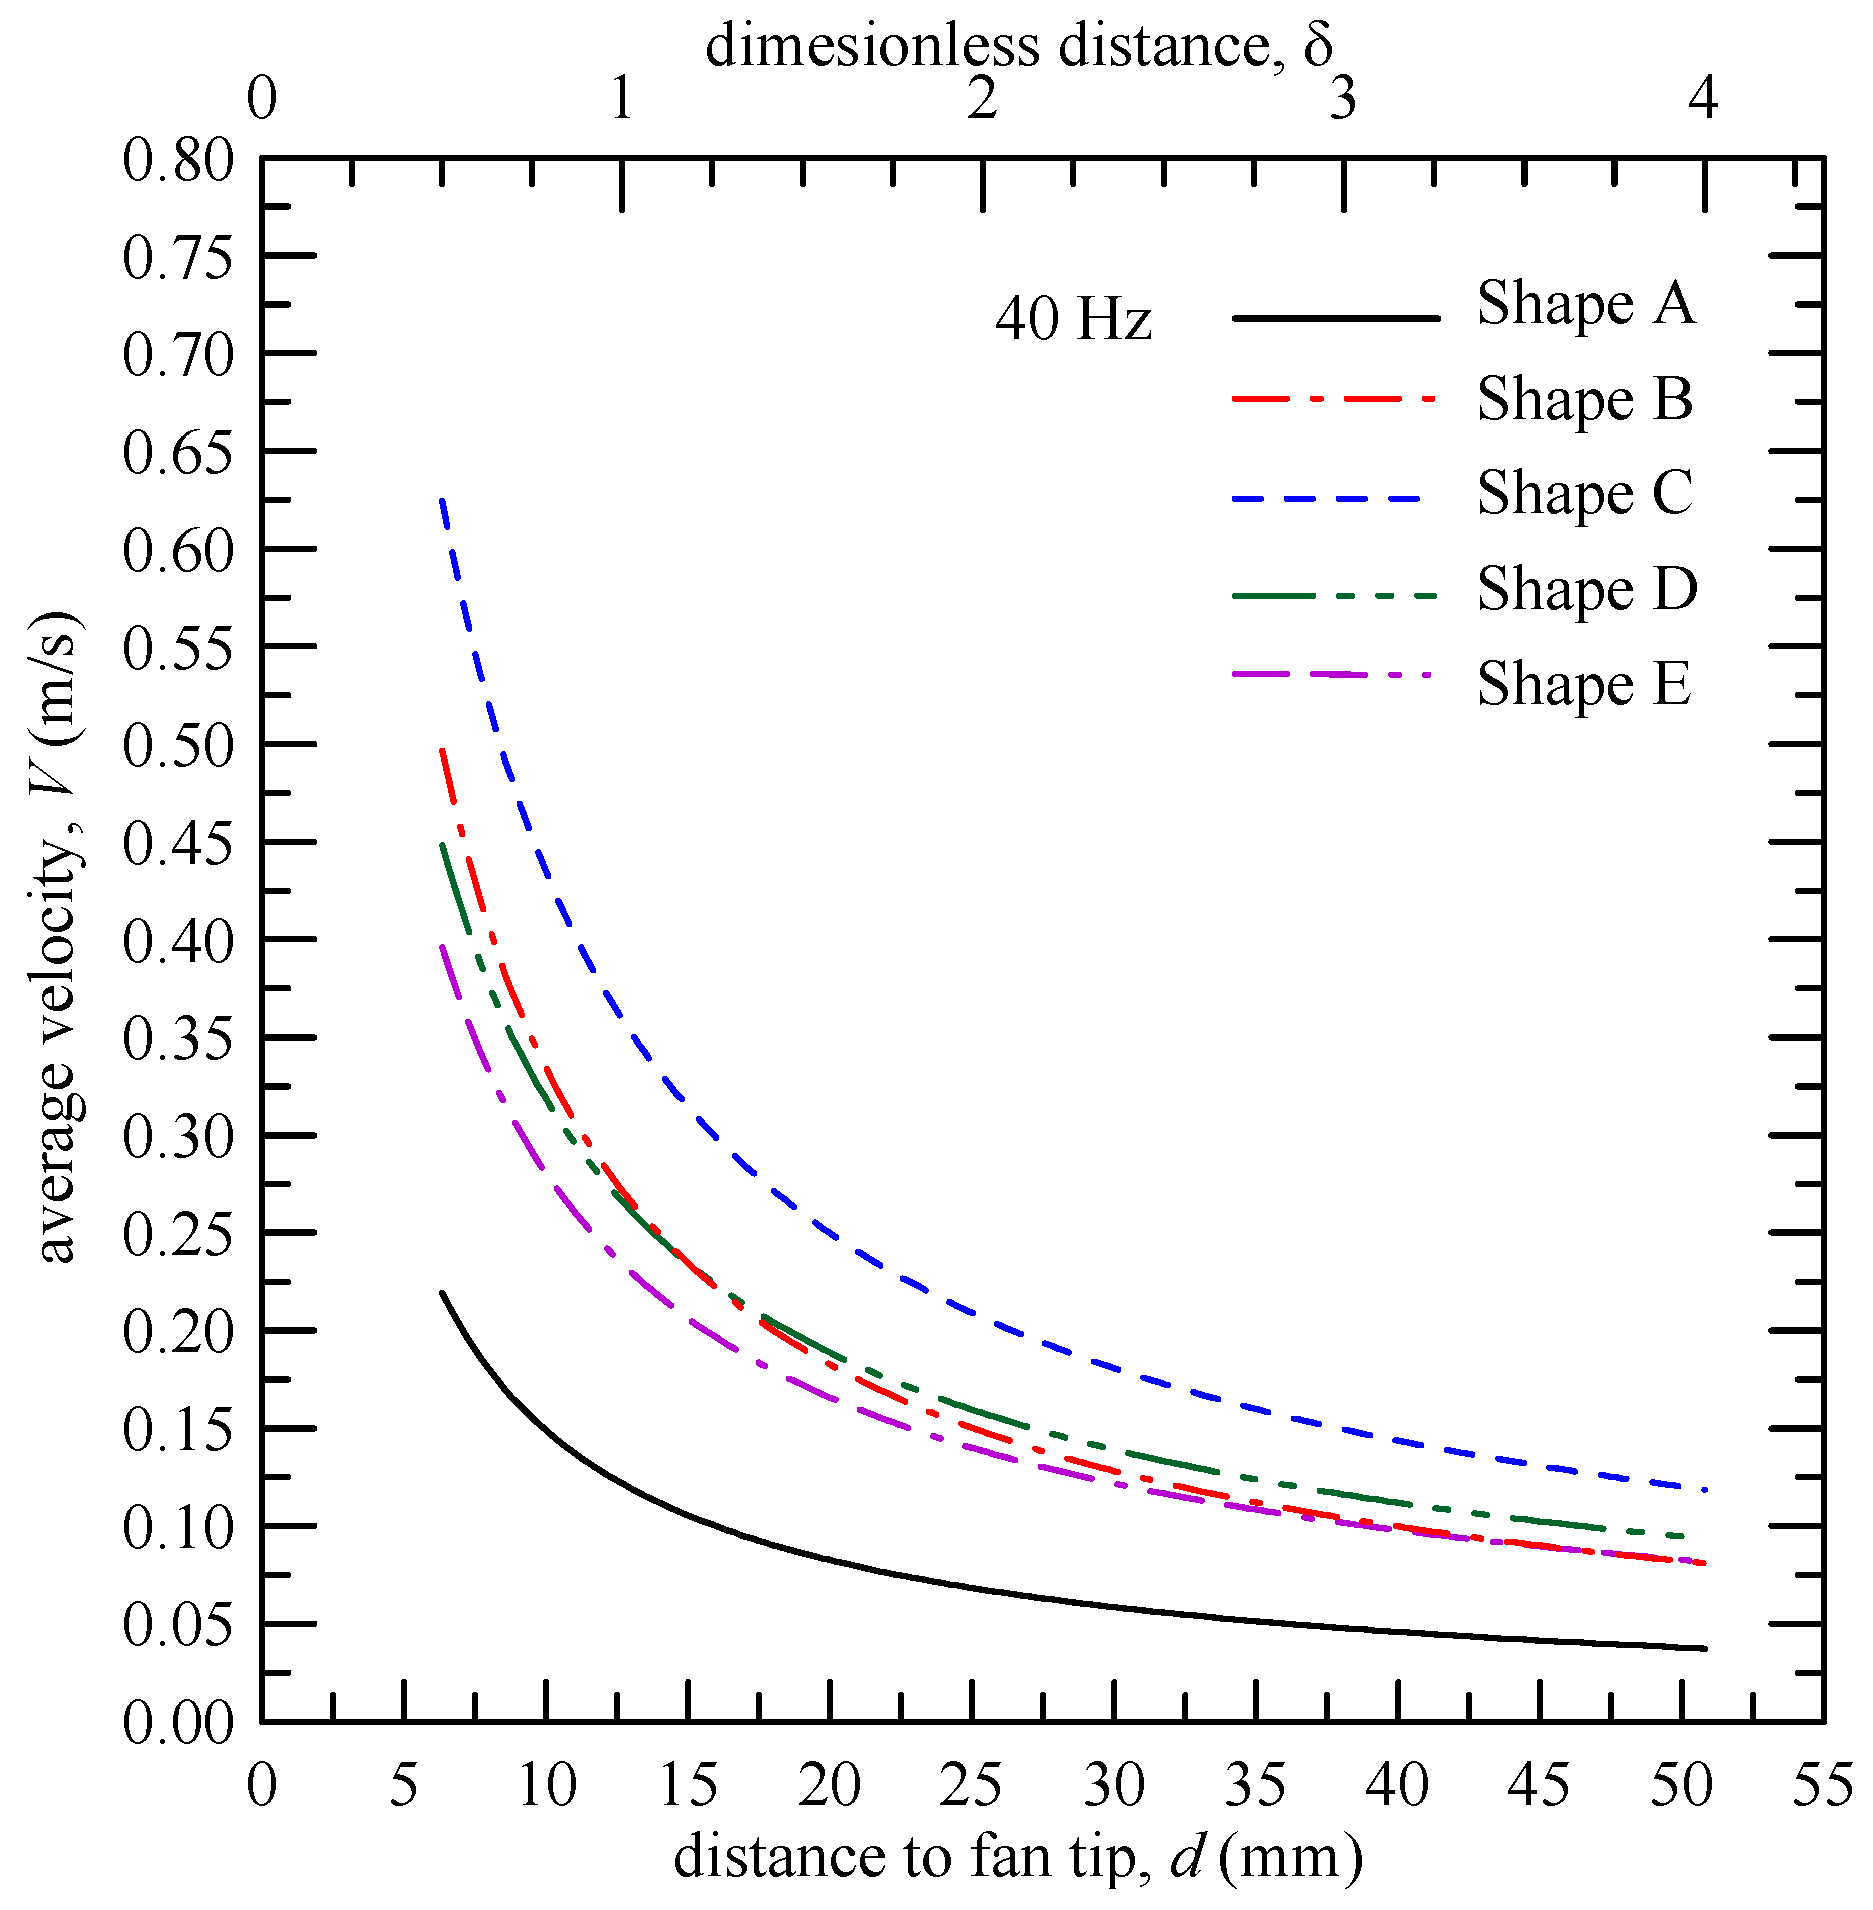
Figure 12 shows the average velocity distribution along the axis of the piezofan for the five fan types at a resonance frequency of 40 Hz. Piezofan C (A) has the highest (lowest) velocity distribution. In general, a blade with a larger width has a larger average velocity, and the divergent shape is better than the convergent one.
Figure 12 shows that the velocity of Piezofan D is slighter greater than that of Piezofan E, but most of the streams released from Piezofan E are confined within a concentrated region ahead of the blade tip. Accordingly, the performance of Piezofan E is similar to that of Piezofan D in the calculated area. Even though Piezofans B, D and E have the same magnitude of blade area, the velocity distribution of Piezofan B is greater than those of Piezofans D and E at a short distance from the fan tip and smaller at a farther distance.


