Article

Investigation of Fracturing Network Propagation in Random Naturally Fractured and Laminated Block Experiments

Key Laboratory of Shale Gas and Geoengineering, Institute of Geology and Geophysics, Chinese Academy of Sciences, Beijing 100029, China
*
Author to whom correspondence should be addressed.
Energies 2016, 9(8), 588; https://doi.org/10.3390/en9080588
Submission received: 4 April 2016 / Revised: 3 July 2016 / Accepted: 13 July 2016 / Published: 28 July 2016

Abstract

:
Researchers have recently realized thatsilty laminas are very developed in naturally fractured continentalsedimentary formations in the Ordos Basin(China). Studies have shown that silty laminas are significant to improve the physical properties and gas storage capacity, and the natural fractures interact with the hydraulic fractures to maximize the fracture network during hydraulic fracturing. However, the influence of silty laminas withrandom fractures on the created hydraulic fracture networkis not well understood. Laboratory experiments are proposed to investigate the evolution of fracture networks in naturally fractured formations with model blocks that contain laminas and random fractures. The influence of dominating factors was studied and analyzed, with an emphasis on stress ratio, injection rate, and laminae strength. Macroscopic failure morphology descriptions combined with meso 3-D laser scanning techniques are both used to reveal the evolution of fracture networks. It is suggested that high injection rate, medium laminae strength, and low stress ratio tend to increase the stimulated reservoir volume (SRV). The interactions between the silty laminae and random natural fractures affect the effect of hydraulic fracturing effectiveness. This work strongly links the production technology and fracability evaluation in the continental shale formation. It can aid in the understanding and optimization of hydraulic fracturing simulations in silty laminae shale reservoirs.

1. Introduction

The great success of marine gas development has led to a great achivement in North America, where it has generated a shale gas exploration boom and encouragedinvestigation into the gas potential of shales worldwide [1,2,3,4,5]. In China, the black shales are from three typical origins, including marine, marine-continental transitional, and continental origins. The fracturing shale reservoirs in the Yanchang exploration area in China have yielded shale gas successfully, which provides a new opportunity to develop continental shale gas production. Recently, more and more attention has been paid to the continental shale hydrocarbons in China. The Yanchang Formation can be subdivided into ten members, named Member Chang1 through Chang10 [6,7]. These Yanchang shales have recently been selected as target plays for shale gas exploration in typical terrestrial strata in China. All members consist of shales, mudstones and sandstones, among which Member Chang 7 of the Yanchang Formation is composed of shales predominantly interbedded with silt sandstones, which is characterized with typical laminae or interbed structures [8,9,10,11,12]. The silty laminae structure in the continental shale plays in the Ordos Basin in China leading to the extraction of shale gas is significantly different from those of marine shales documented in the USA and elsewhere [2,6]. Therefore, there is an urgent need to characterize continental shales and devise a suitable combination of horizontal drilling and multistage hydraulic fracturing technology to improve gas production from the Yanchang Formation gas shale.
Due to the strong anisotropy of a continental fractured shale reservoir, the recoverable reserves depend on the density of silty laminae, combination characteristics, and degree of opening of the fractures. Thus, laminas and fractures arekey factors in the accumulation of shale oil and gas. For a shale reservoir of low porosity and permeability, the very existence of laminaes and fractures is of vital importance [2,13,14]. When a massive fracture system is generated by the interaction of silty laminae and natural fractures during artificial fracturing, theshale reservoir can be fully transformed into an effective stimulated formation of shale-gas aggregation [1,15]. For typical silty laminae structural shale formations, studies were mainly focused on the occurrence of silty laminae [16], depositional environments [17], hydrodynamic conditions [18], origin of silty laminae [19], the shale gas generation and distribution [20]. From the exploration and experimental results of the scholars [12,21], it is obvious that silty laminae forms significant migration conduits and contribute significantly to reservoir storage. How to maximize the total stimulated reservoir volume plays a major role in successful economic gas production for shale gas. Due to the geological setting, the Ordos Basin is located in the central part of the North China plate, and is characterized by weak tectonism, under developed faults, and relief strata [22]. Thus, it differsfrom several other prominent shale distribution areas, includingthe major shale-gas-producing basins in the United States and Sichuan basins. Natural fractures in the silty laminated continental shale are mainly dominated by non-tectonic random fractures. This kind of fractures is always irregular, curved, discontinuous, and has no consistency indifferent directions; the significant features of non-tectonic fracturedarea random distribution, microapertures, and the fact they are not affected by tectonic fields. They are often small scale and the majority present in the form of microfractures [23,24]. The non-tectonic microfractures are small, high-aspect-ratio cracks in shale formations that result from differential stresses [22,23,25]. A detailed discussion of random non-tectonic microfracture generation and how it influences the hydraulic fracturing effectiveness has been presented by Wang et al. [25]; in addition, the effect of silty lamined have been studied using physical modeling experiments, but the effects of natural fractures on hydraulic fracturing have not been introduced in their studied cement models [26]. In the core specimens, medium-angle slip fractures and horizontal bedding cracks were the most common types of fractures, whereas vertical and high-angle fractures and horizontal bedding cracks were under developed. In the thin sections, microfractures arising in organic matter laminations or at their edges as well as those of tectonic origin were the predominant type of fractures, and they were mainly short, narrow, and open [23,24,25]. As a result, considering the non-tectonic fractures in silty laminated model is important to grasp the mechanical properties of hydraulic fracturing, and the associate fracability predication in the continental shale formation.
In this work, first a discussion of random non-tectonic microfracture generation, and laminated model block preparationis presented. Then, experiments were conducted as a function of: (1) the in-situ stress ratio; (2) injection rate; and (3) silty laminae strength. Macroscopic failure morphology descriptions combined with meso 3-D laser scanning techniques are both used to reveal the evolution of fracture networks. A sensitivity study reveals a number of interesting observations resulting from these parameters on the evolution of fracture network during horizontal well hydraulic fracturing. Four types of fracturing network were observed from the studied simulations, and the results also show that high injection rate and laminae strength and low stress ratio tend to increase the complexity of fracture networks. This work canbe helpfulto understand and optimizethe hydraulic fracturing simulations in naturally randomfractured formations.

2. Laboratory Experiments and Methods

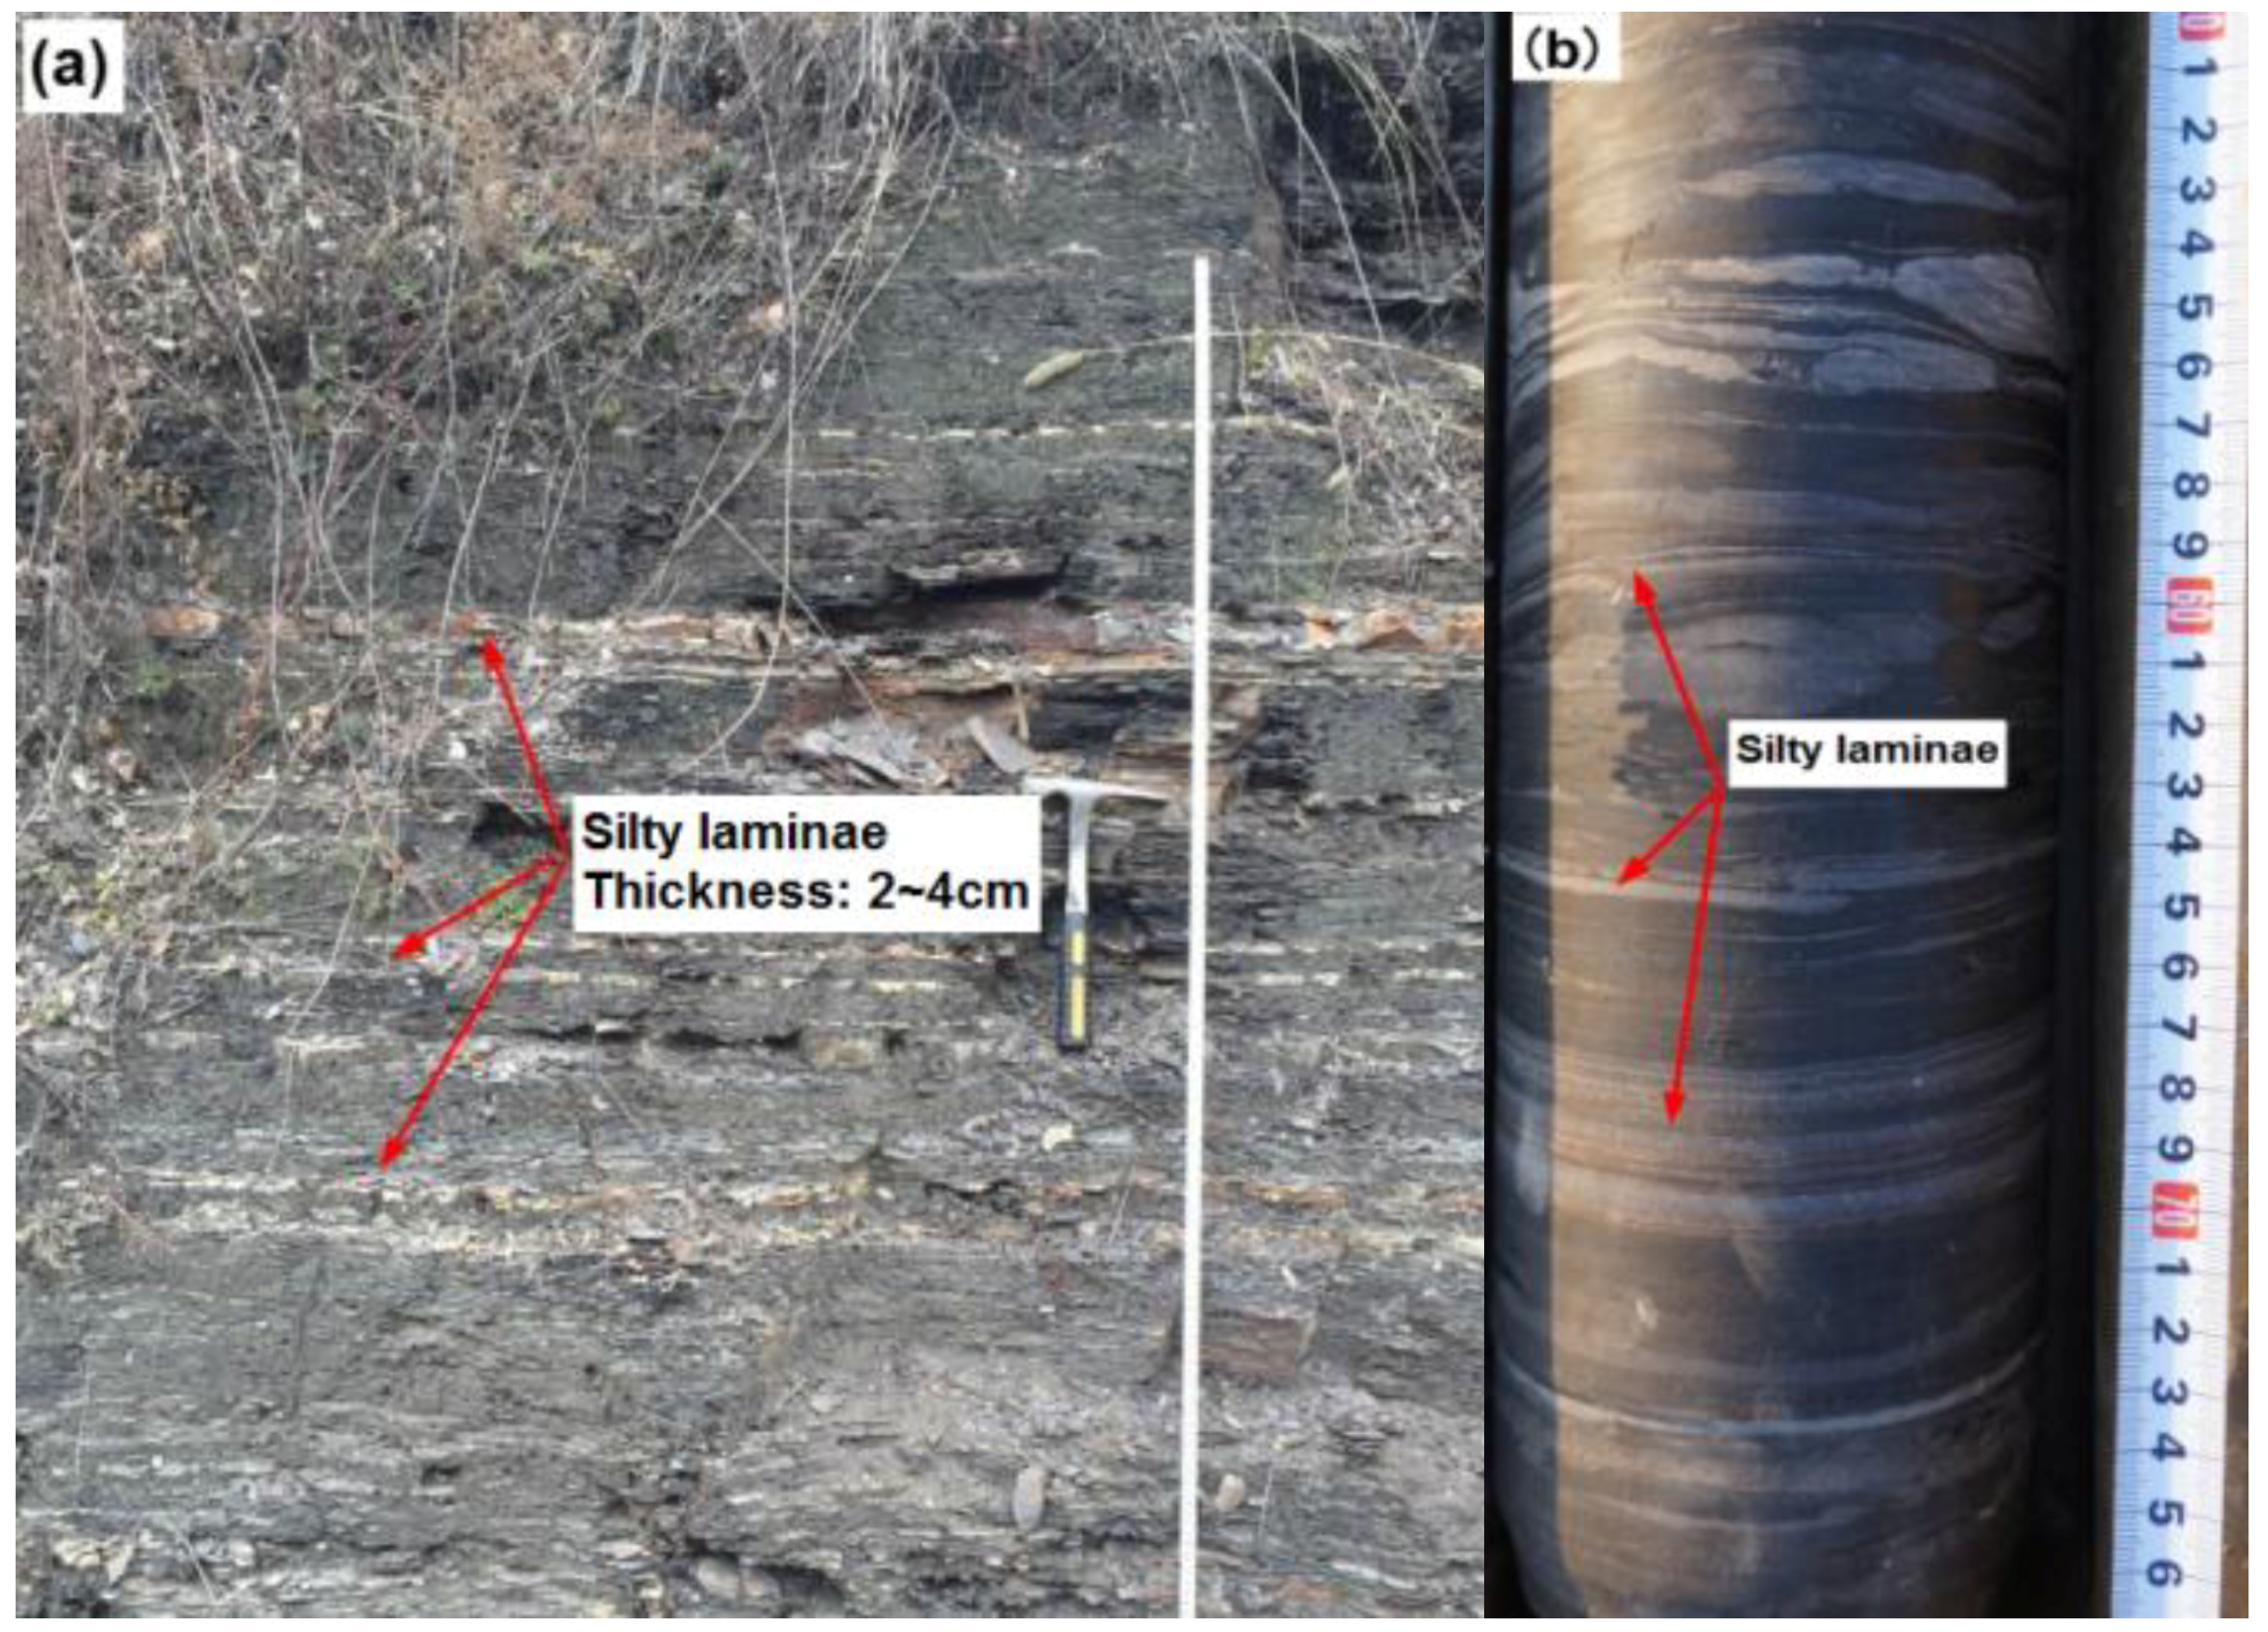
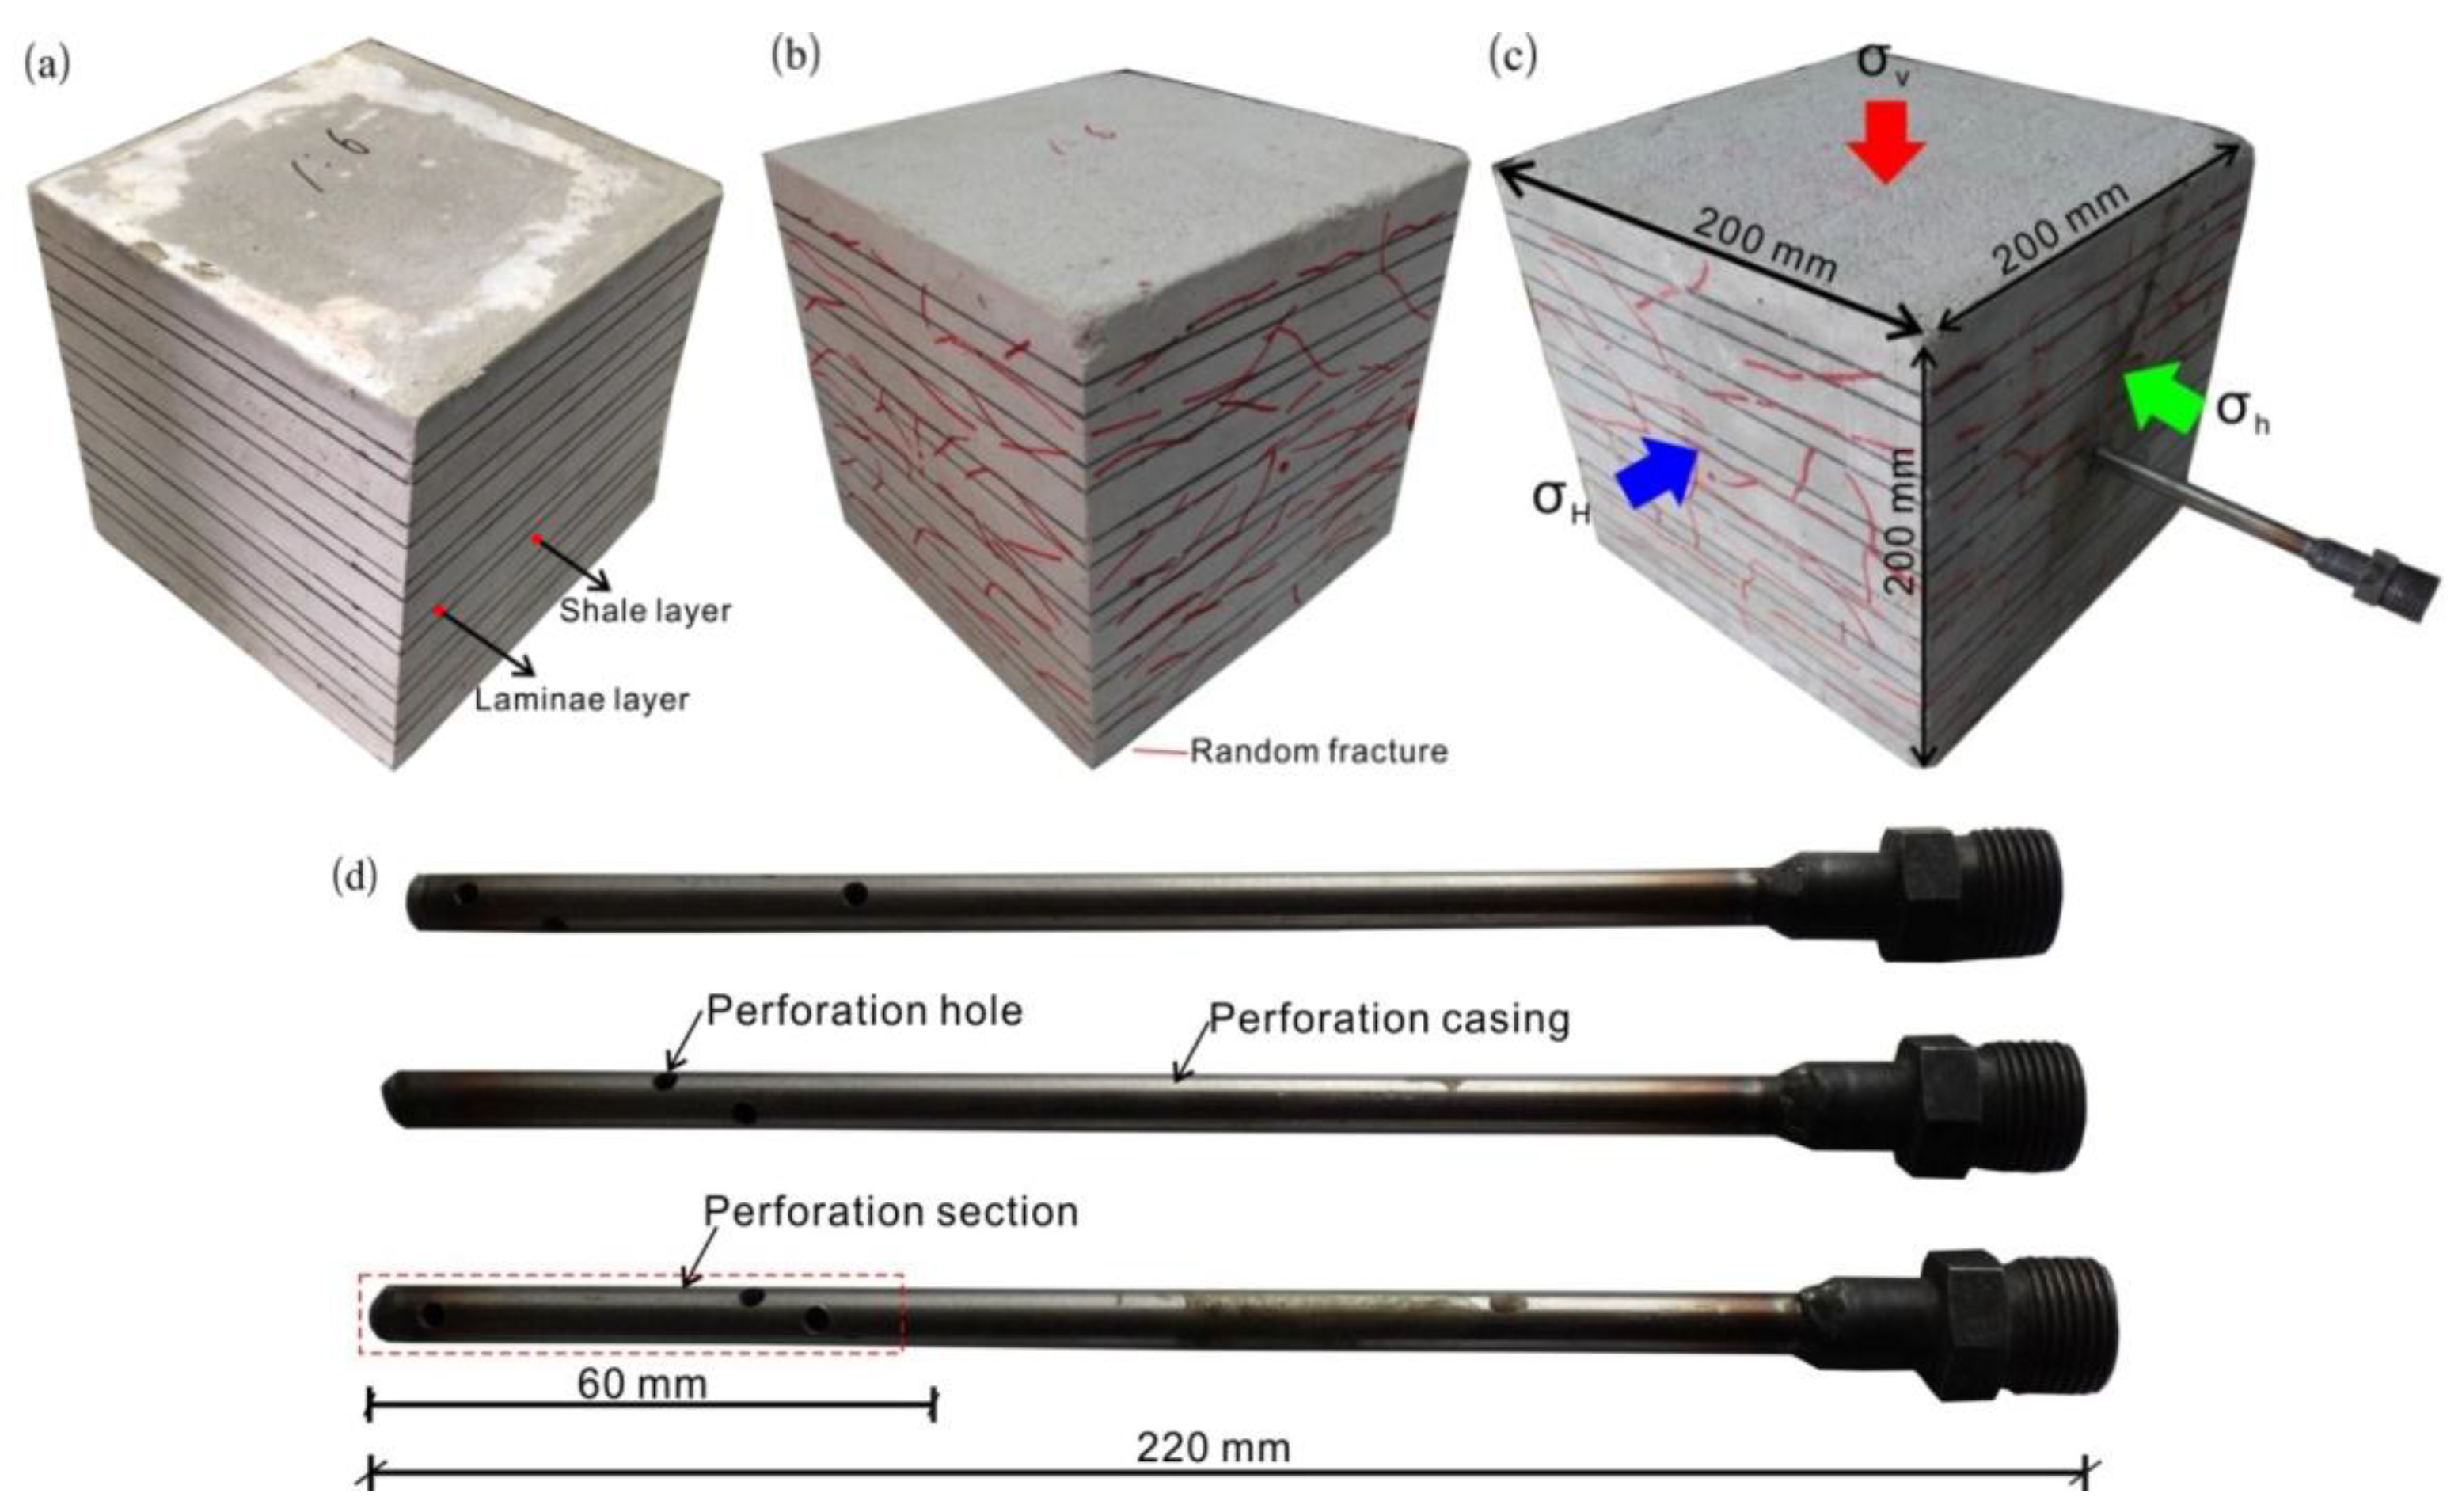
2.1. Model Block Preparation

To reflect the physical and mechanical properties of reservoir rock and to take advantage of their readyavailability to prepare the model blocks, artificial cement blocks were generally selected to perform the hydraulic fracturing experiments [26,27]. According to outcrop observation and core measurements of the typical continental shale in the Ordos Basin, shale and silty laminae are alternatively deposited layer by layer, as shown in Figure 1. For convenience sake, the cement model blocks were prepared according tothe lithological characteristics of the Jinke3 well. The blocks were composed of alternating L1 and L2cement layers. L1 is made of a mixture ofcement and quartz sand in a 1:4 mass ratio to represent the shale layer; and L2 is a mixture of cement and quartz sand in 1:2, 1:3, and 1:6 mass ratios, respectively, to represent different strength properties.
The cement used in this experiment was a Chinese Portland Cement with specification No. 425. The grain size distribution of the sand is shown in Figure 2a. Based on this figure, the coefficient of uniformity (D60/D10) is 4.6. The ratio of materials to water was 50%. Water, sand, and cement were mixed for 5 min. This time was found to be adequate to ensure that the sand grain distribution in a the cement was uniform. The mix was then poured into a 200 mm × 200 mm× 200 mm mold while a vibration table was used to remove the air bubbles trapped in the mix. The vibration time period was chosen in such a way thatsand particles did not precipitate as the mixture viscosity was relatively high enough to suspend them during the course of vibration. During the preparation of model blocks, the shale layer (1:4 mixture) with 20 mm was firstly poured into the mold; when the shale layer comes to initial set, then the silty laminae (1:2, 1:3, and 1:6 mixture, respectively) with 10 mm was poured into the mold, and so forth (Figure 2a). A cylinder shaped specimens of 50 mm diameter and 100 mm height was drilled from the blocks to measure the mechanical properties, the typical uniaxial compressive stress-strain curves for different mixtures are shown in Figure 2b. As shown in Figure 2b, strength of the studied laminae first increases and then decrease from mass ratio 1:2 to 1:6. When the mass ratio of the cement and quartz sand is 1:3 (shale layer in this work), the strength value is the maximum.
After the model blocks cured in their moulds for two weeks, they were slowly heated in an oven. The model blockswereplaced in the oven for 18 h at 200 ℃then cooled with natural air ; and this was conducted alternatively, repeated four times. Different heating time to the model blocks are used to generate random fractures with different density. Due to dehydration, shrinkage cracks form, which represents the natural non-tectonic random fractures in our model blocks (Figure 3b). We drilled the wellbore after the heat treatment to avoid a stress concentration that could influence the shrinkage crack formation. A vertical borehole of 10 mm in diameter was drilled 9 cm deep and parallel to the minimum principal stress. A metal perforation casing with an inside diameter of 8 mm, and spirally distributed perforation holes with 1 cm height difference and 60 degree of angular difference between adjacent holes was inserted into the wellbores, as shown in Figure 3c. The length of the perforation interval was set to 6 cm.

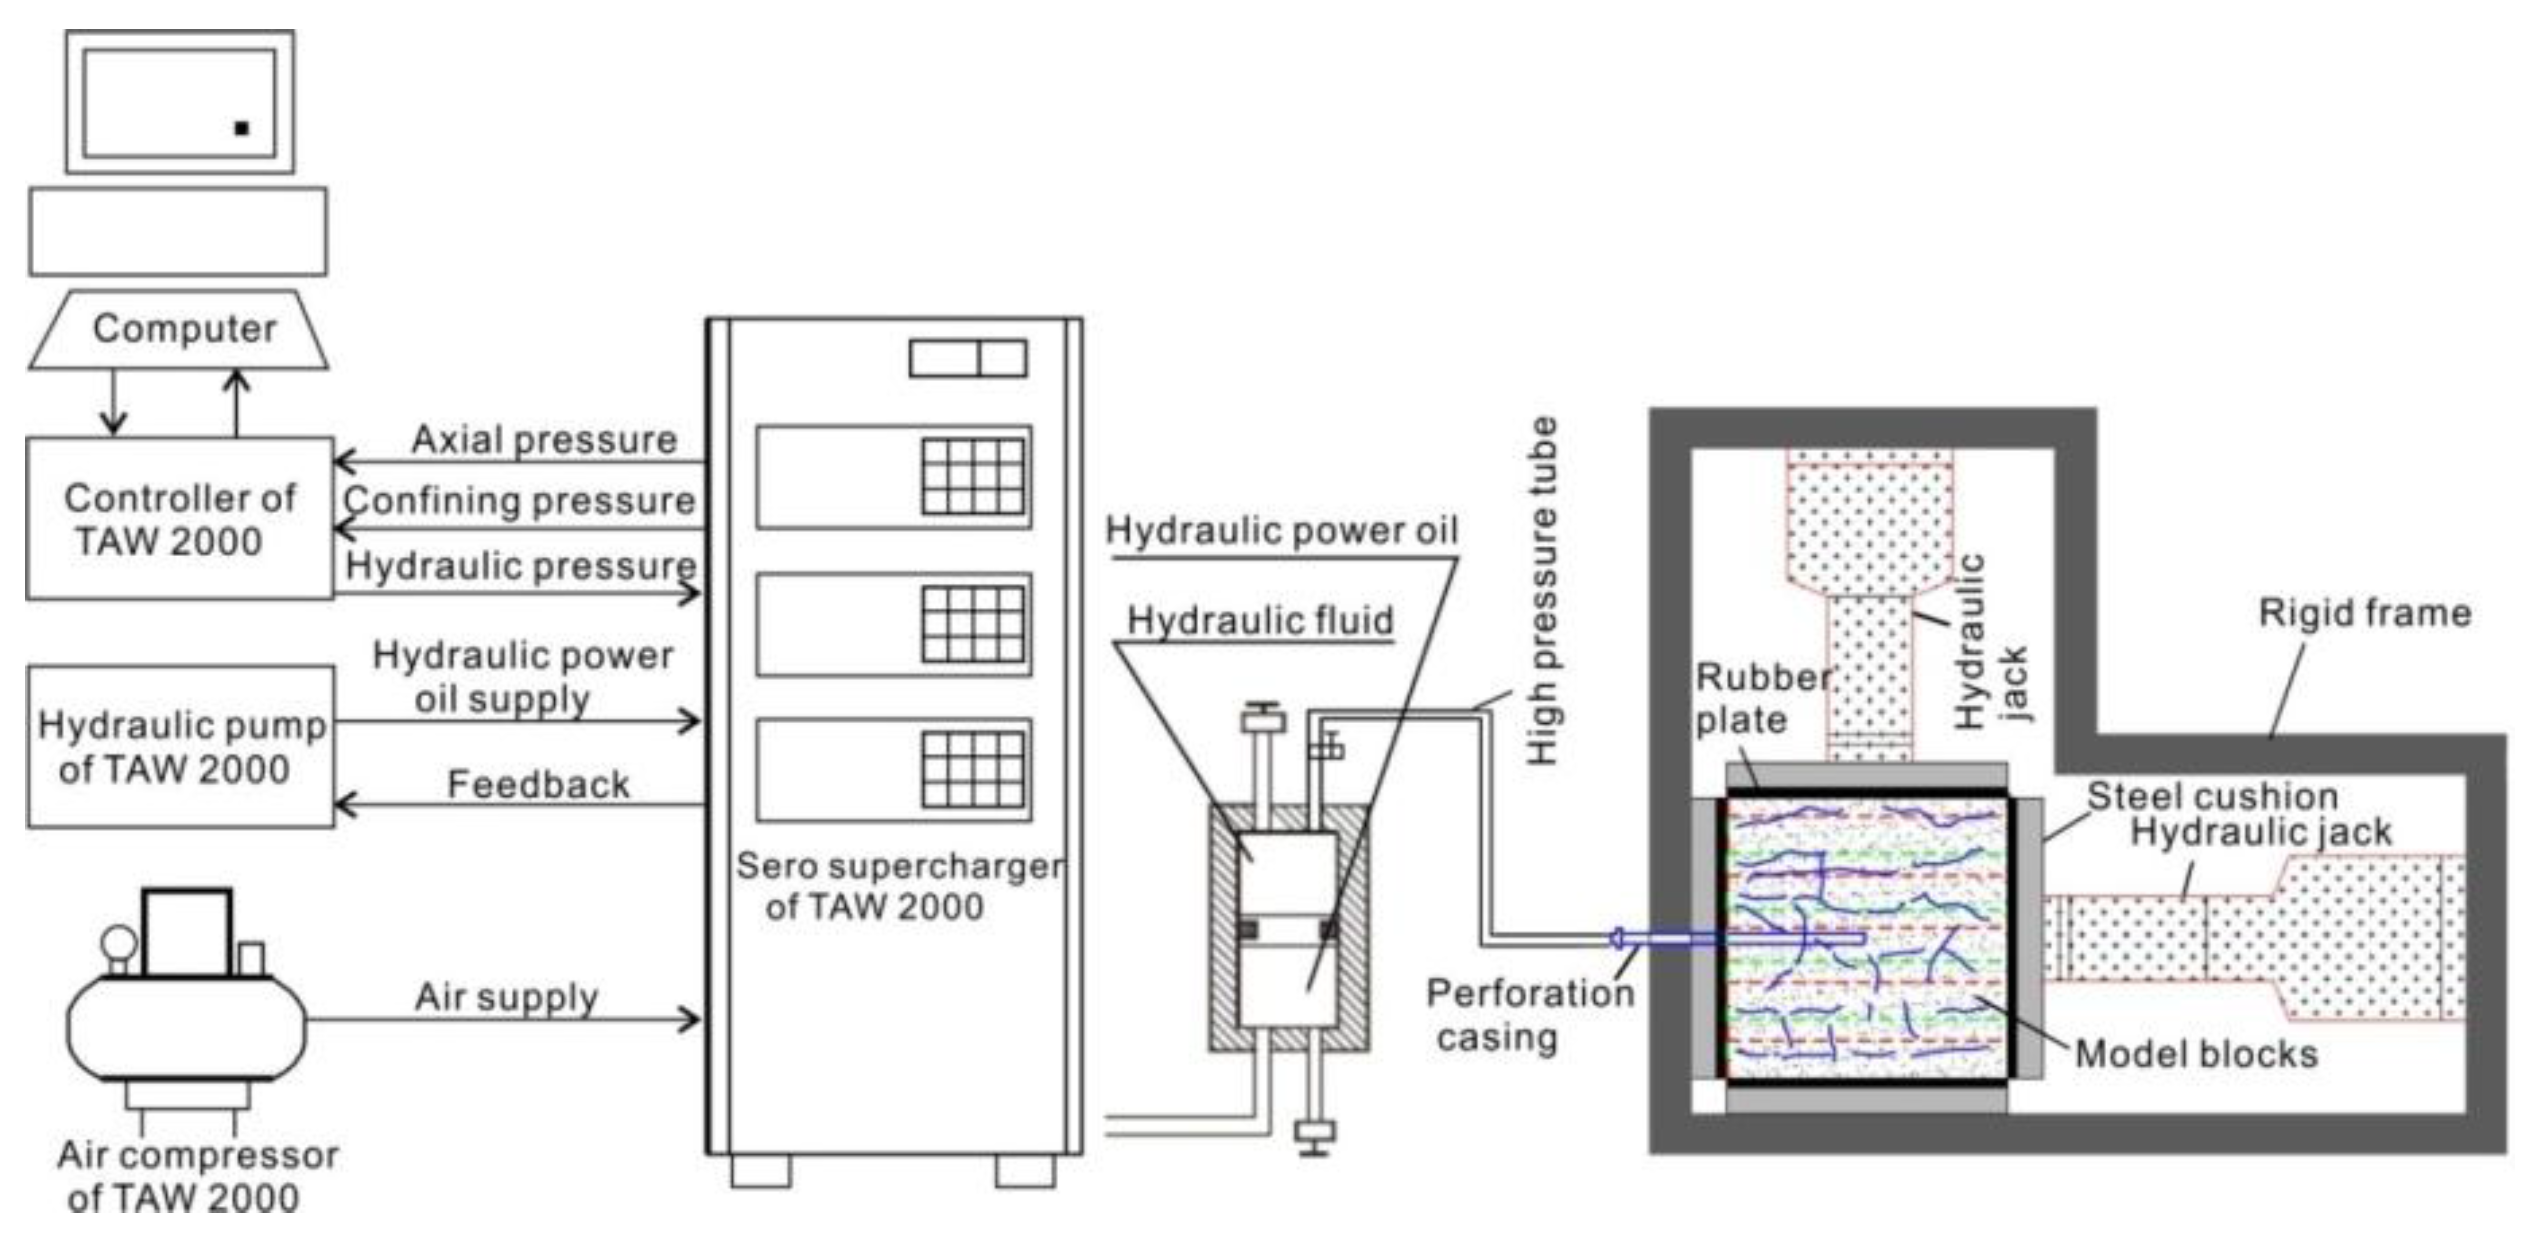
2.2. Experimental Setup

The hydraulic fracturing experiments here were conducted using a simple true tri-axial hydraulic fracturing test system (Figure 4). The test frame of the system has the capacity to apply tri-axial stress condition on a 200 mm × 200 mm× 200 mm cubic model block. All of the in-situ stress conditions (the vertical, maximum horizontal and minimum horizontal stresses) are supplied using a hydraulic jack and the injection pressure is supplied using a servo controlled TAW 2000 hydraulic pump. The pressure platens are equipped with spherical sheets to ensure equal pressure distribution. Between the model block and the pressure platen, we inserted a thin Teflon sheet covered on both sides lubricated with vaseline to prevent shear stress.

2.3. Experimental Design

During the test, three factors including stress ratio, injection rate, and laminae strengthare used to investigate the interaction between hydraulic fractures and random fractures, and the associate effectiveness of fracturing network. All the experiments were stimulated in a normal-fault setting. In order to consider a hydraulic fracture field test being simulated in laboratory scale, scaling laws are applied to scale the fracturing parameters [28,29,30,31]. According to the in-situ field characteristics of Yaoke1 well, for the laboratory experiments, the maximum stress was the vertical stress σv of 4.28 MPa, and its value was kept constant for each experiment. The horizontal well was drilled along the direction of minimum horizontal stress of σh, and its value was 1.42 MPa. The stress ratio (defined as the ratio of the maximum horizontal stress to the minimum horizontal stress) was 1.2, 1.5, and 2.0, respectively. Therefore, the maximum horizontal stress σH equaled to 1.70, 2.13 and 2.84 MPa, respectively. Three injection rates (i.e., 10, 20 and 50 mL/min) were used during the tests. As stated above, three kinds of laminae materials with UCS 34.184 MPa (1:3 mix), and 24.362 MPa (1:2 mix), 13.782 MPa (1:6 mix), respectively, were used. For each experiment, red-dyed water was injected at a constant flow rate. The dye is non-penetrating and therefore highlights the fracture surface generated by the experiment. This can help us observe the fracturing network evolution process easily. The detailed testing program is listed in Table 1. Test No. 1 is the base model. Test No. 1, 2, and 3 are designed to discuss the response of injection ratio; test No. 1, 4 and 5 are designed to discuss the response of stress ratio, and test No. 1, 6 and 7 are designed to discuss the response of laminae strength.
The fluid was injected in the borehole at a constant injection rate while monitoring ofthe pressure increase to reach a maximum value before and after suddenly dropping. During this process, the travel time of ultrasonic wave was recorded. A sudden droppingof the pump pressure usually indicates the breakdown of model blocks. The fracture volume from the injection rate and pressure before and after breakdown pressure was then estimated, to ensure that the fracture was fully developed and still fully contained within the model blocks in real time, before ending the experiment by shutting down the pump (typical pressure curve is shown afterwards). Finally, the bore-hole was depressurized and unloaded from the tri-axial equipment. After a test, the block was opened with a hammer and chisel, to estimate the morphology of the fracture surface.

2.4. Research Idea

To study the influence of multi-factors on fracture network evaluation in laminaed formationswith random natural fractures, qualitative and quantitative analysis are both used in this work. Macroscopic failure morphology descriptions combined with meso 3-D laser scanning techniques are both employed to reveal the evolution of fracture network. To reflect the influence of the various factors on the effectiveness of fracture network, an index should be selected to reflect the degree of interaction between hydraulic fractures and natural fractures. As a result, an insight into the topography of a fracture surface is important for better understanding of the influence of multri-factors on hydraulic fracturing. Apart from the macroscopic description of the failure morphology, a three-dimensional (3-D) laser scanner was used to scan the fracture surface of the model blocks to obtain the section morphology (Wang et al., 2016). The 3-D laser scanner method has great advantage over the SEM method because the SEM method can only obtain partial morphology of fracture surfaces. A resolution of 0.2 mm (distance between pointsin two parallel scanned lines), which is equal to the average particle size of the model blocks, was chosen to scan the surface of the samples. After scanning, raw coordinate data points were reconstructed to a digital replica using the Geomagic-studio software package. A binary object (digital replica) above 4,000,000 data points was obtained from whole fracture surface of each specimen.
Several indices have been proposed to evaluate the hydraulic fracturing effectiveness, such as stimulated reservoir area [32], leak-off ratio [33], stimulated DFN length and hydraulic length [33], etc. However, these method cannot be used to quantify and evaluate the contact areas created by opening and stabilizing natural fractures (e.g., bedding face) in the rock. To quantificationally reflect the hydraulic fracturing effectiveness, an index of Rm(SRA) (roughness of the stimulated reservoir volume) is proposed, which can be defined as the ratio of actual contact area to the projected area of the main fracture surface. The expression is as below:
R m ( S R A ) = A 1 / A 0
where Rm(SRA) is the roughness coefficient ; A1 is the area of the actual fracture surface; A0 is the area of the projected fracture surface, in this work, the A0 value is 40,000 mm2. Figure 5b shows the reconstruction morphology of the half model blocks for the base model. To facilitate the calculation ofthe actual area of the main fracture surfaces, the fracture surface is separately extracted, as shown in Figure 5c.

3. Experimental Observations and Results

3.1. Typical Pump Pressure-Injection Time Curves

Figure 6 plots the typical pump pressure curves for the cement blocks under different stress ratio (Figure 6a), injection rate (Figure 6b), and laminae strength (Figure 6c), respectively. As shown in Figure 6a, the breakdown pressure is the largest at low stress ratio. Also, the curve morphology of post peak is more complex than the model blocks at SR = 1.5, and 1.6. Fluctuation of the curves at post peak stage implies the interaction between hydraulic fractures and natural fractures. Under low stress ratio condition, the injected fluid easily leaks off into the fractures, interaction between hydraulic fractures and natural fractures is the strongest. In this case, the fluid is mostly used to open hydraulic fracture, and stimulate the random fractures, pore pressure drops slowly. Whenthe model block is under high stress ratio, simple penetrating shaped hydraulic fracture is prone to form, the injected fluid flows along the opened fractures, and the injected fluid is difficult to leak off into random fractures. In this case, the pressure curves drop directly after breakdown pressure. These results imply that in relative isotropy in-situ stress field, complex fracturing network is easy to form, the evolution of fracturing network can be reflected in pump pressure curves.
From the result of Figure 6b, breakdown pressure does not increase with the increase of injection rate. The breakdown pressure is the largest at low injection rate. This result is different from the experimental results of intact models [34]. This indicates that the injected fluid rarely leaks off into the random fractures, flow channel of the fluid is blocked by the stronger laminae. It can also be seen that injection time decreases with the increases of injection rate before breakdown pressure. This result implies that with high injection rate, the hydraulic fracture can be drived to propagate easliy, and the hydraulic fractures can be interacted with natural fractures to the maximum degree.
As shown in Figure 6c, breakdown pressure increases with the increase of interbed strength. When the strength of the laminae is larger, hydraulic fractures cannot cross the laminae, and the injected fluid is blocked in this layer, which results in the increase of breakdown pressure.

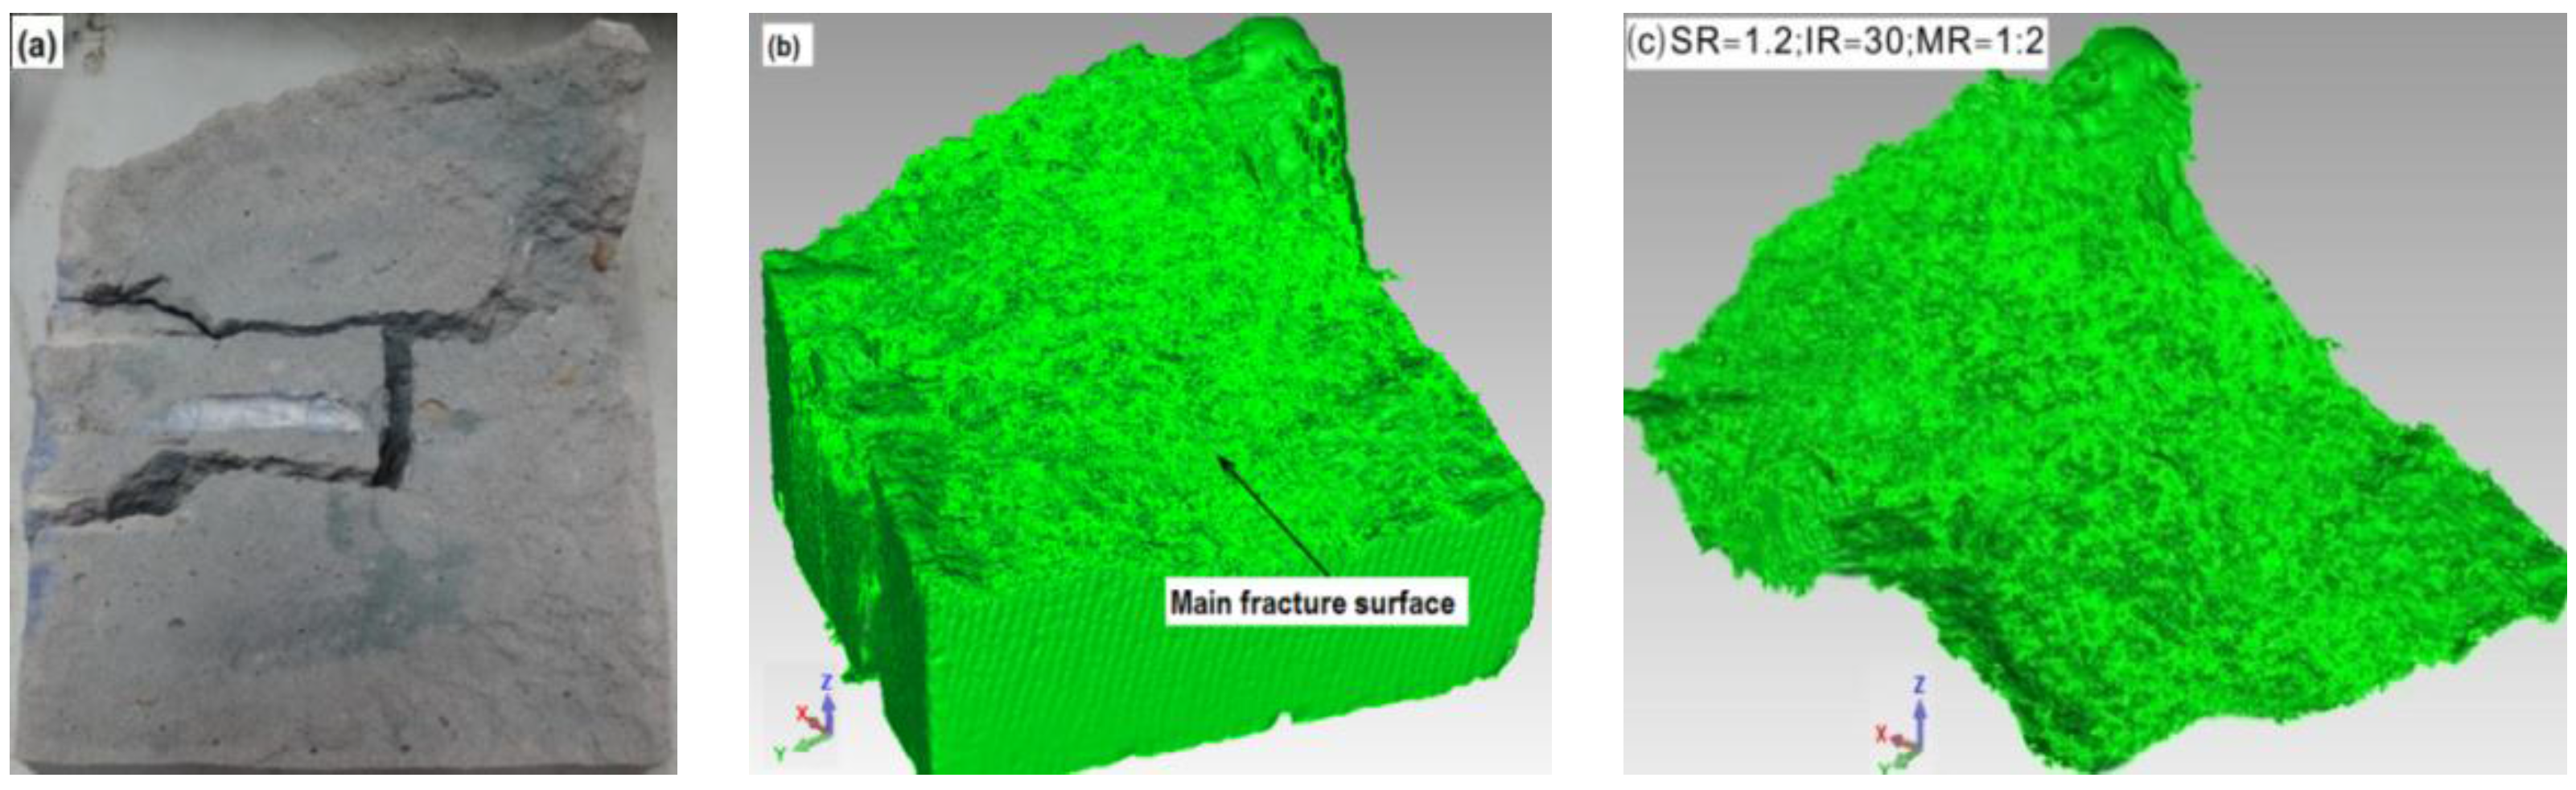
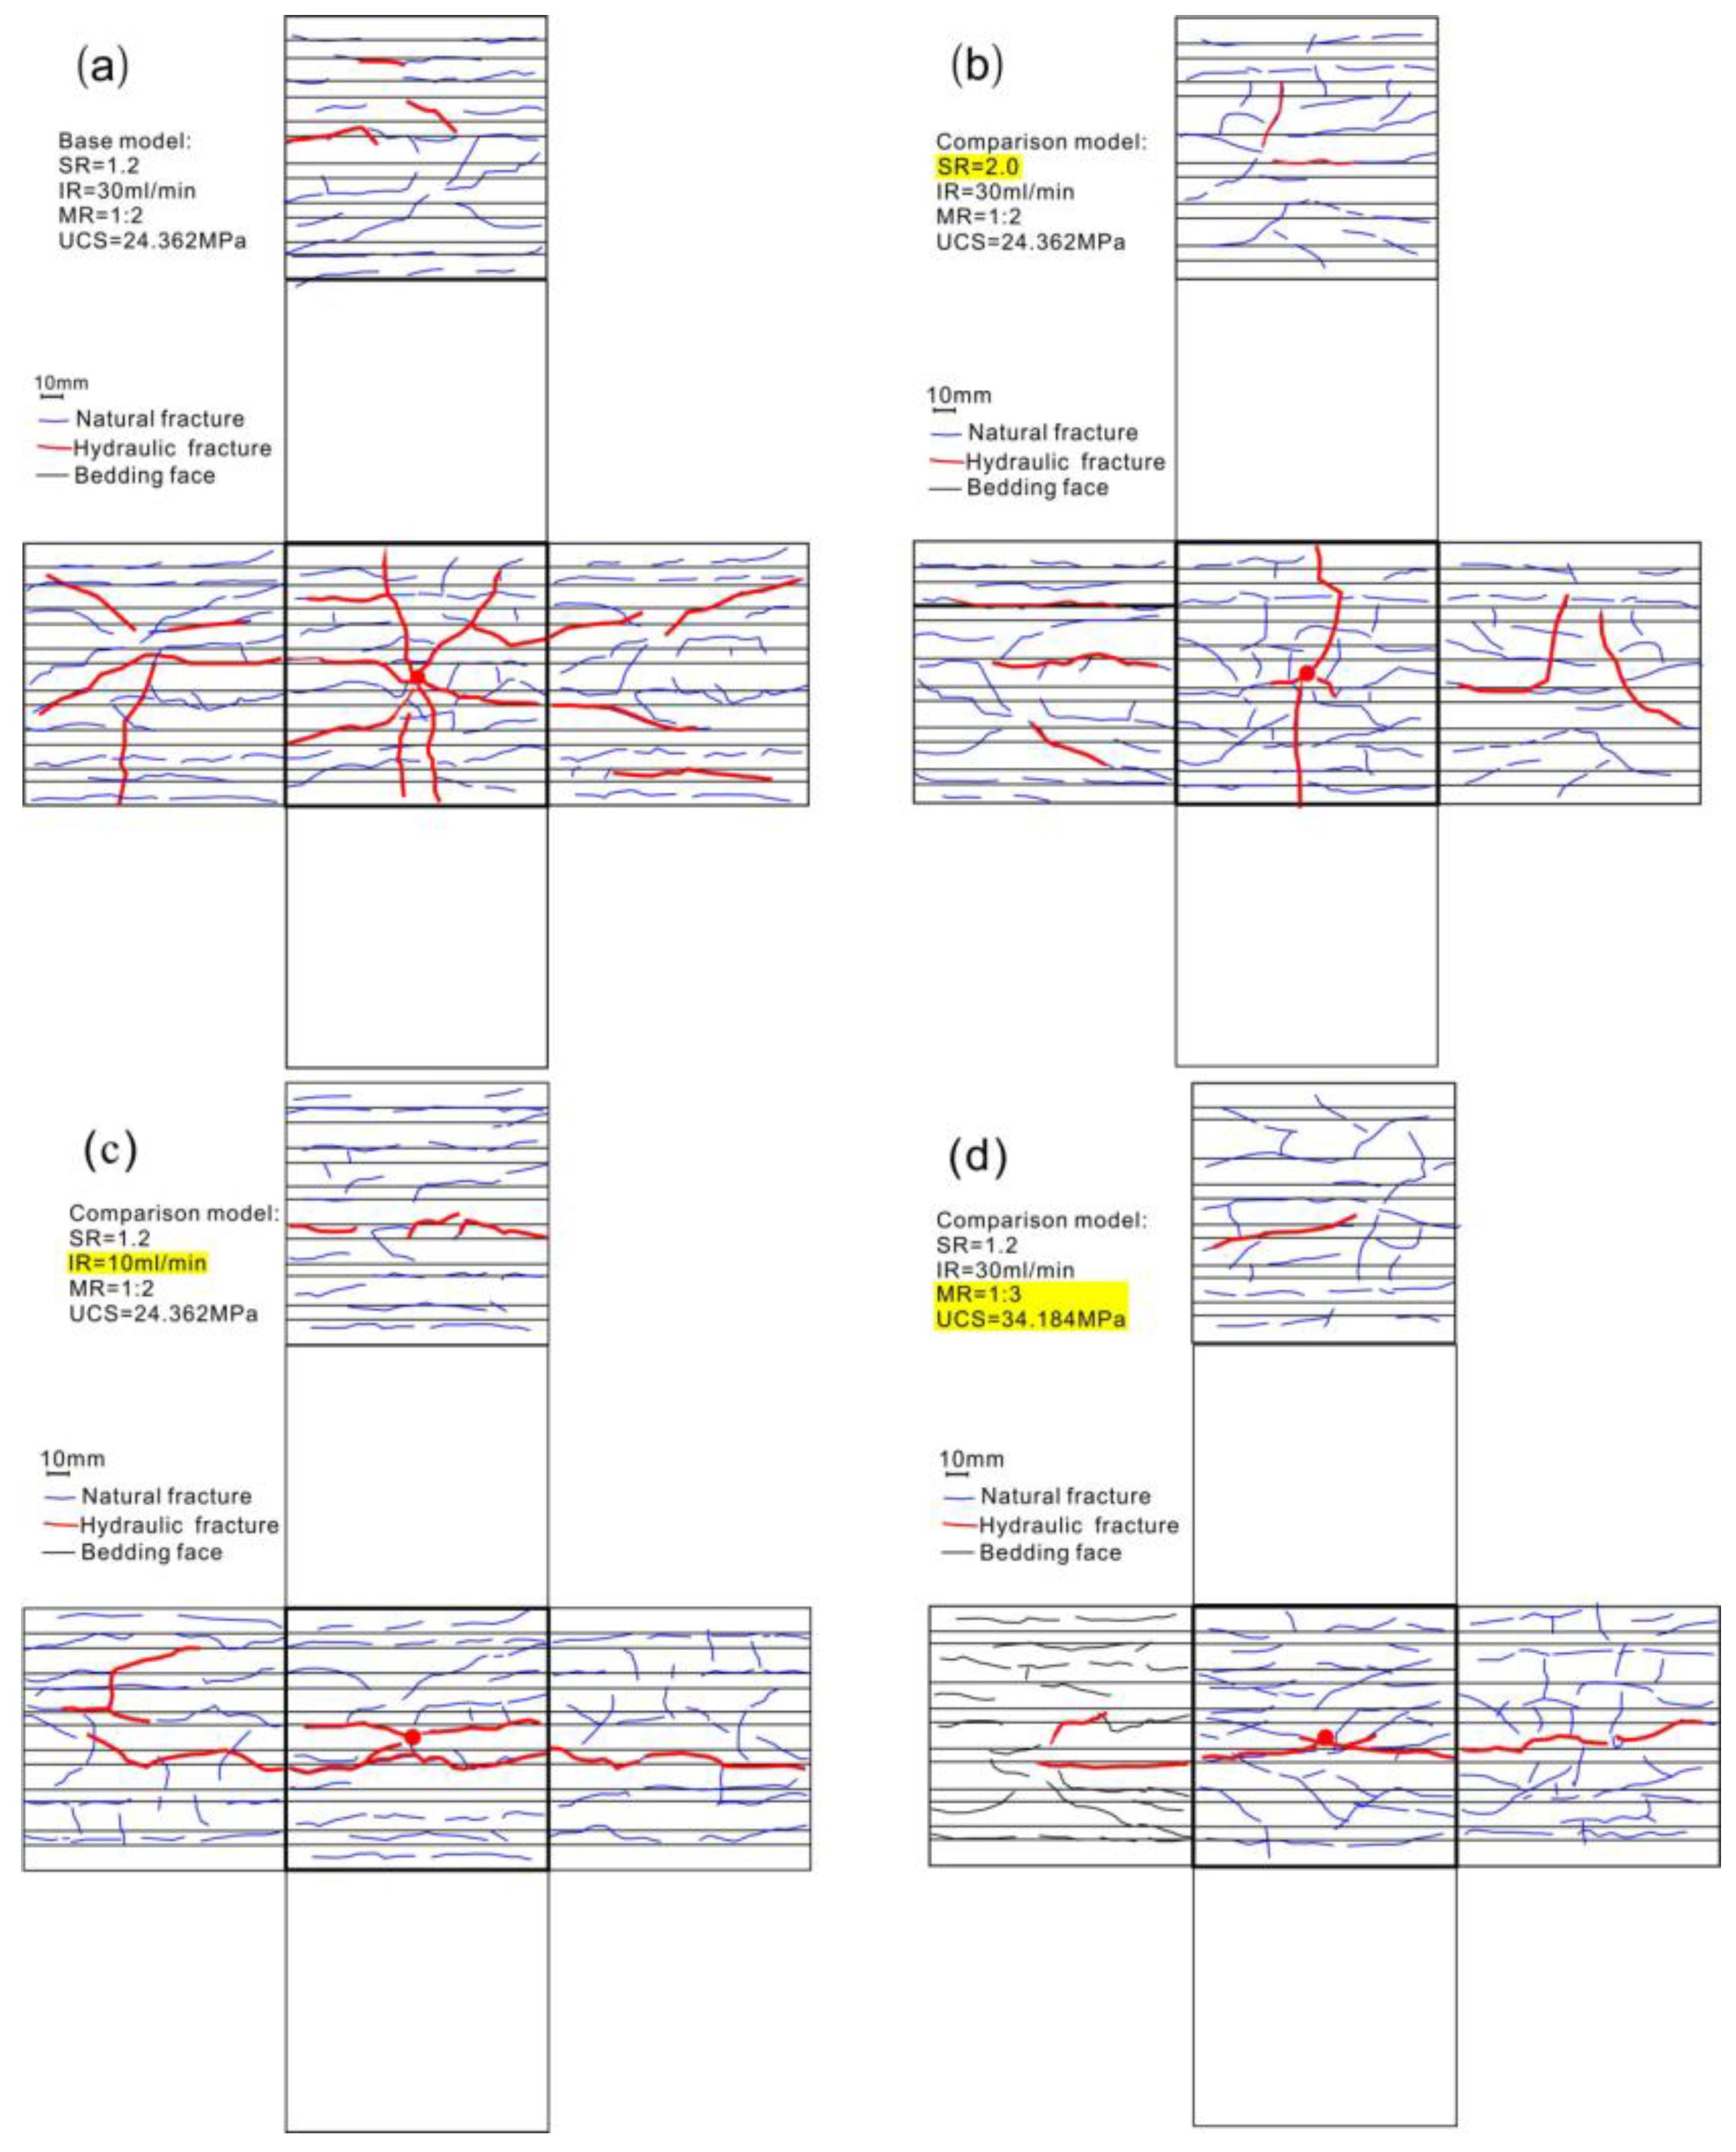
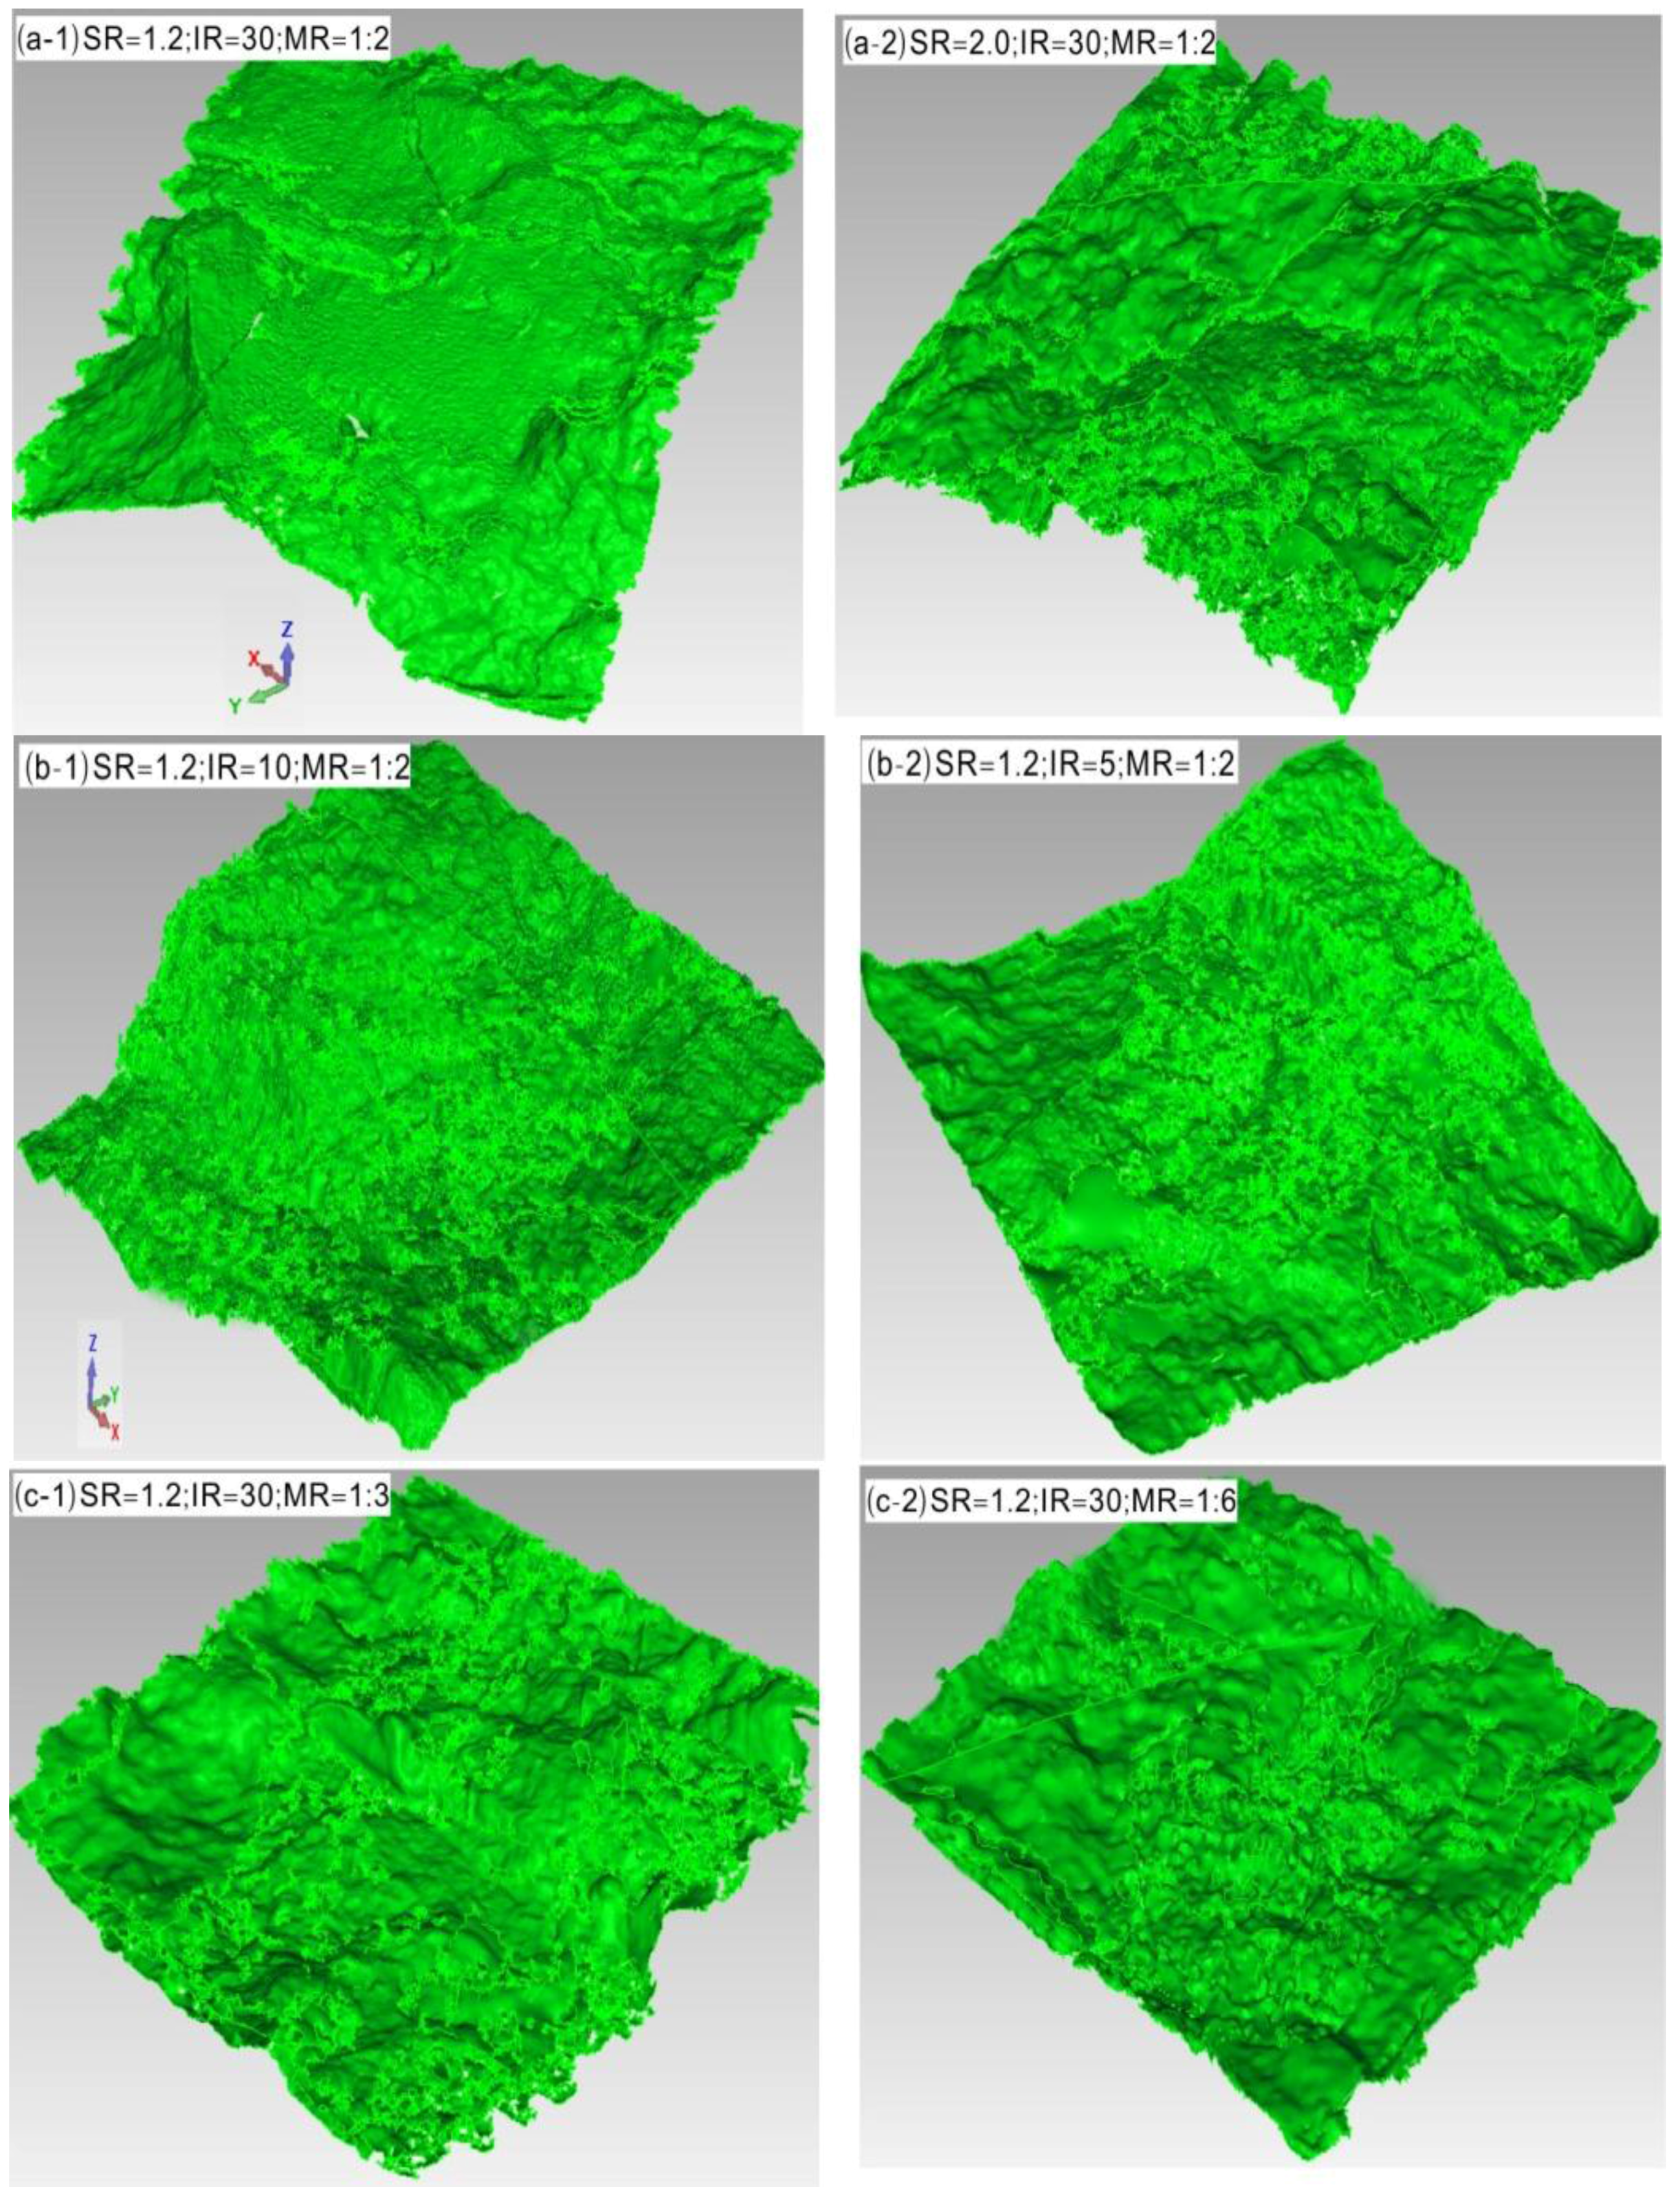
3.2. Macroscopic Morphology Observation

We sketch the morphology of the fractures on the six surfaces of the typical model blocks after experiments, as shown in Figure 6. Figure 6a plots the fracturing network for the base model (SR = 1.2; IR = 30; MR = 1:2), it can be seen that the interaction between hydraulic fractures and the random fractures presents good behaviors, in this case, the effectiveness of fracturing is the best. Figure 6b is designed to illustrate the influence of stress ratio on fracturing network, for this model with SR = 2.0, IR = 30, and MR = 1:2. It can be seen that, at different stress ratio, the morphology of fracturing network is different. Different fracturing network geometry were observed, at low stress ratio (Figure 7a), the radial random net-fractures around the wellbore dominated the geometry of hydraulic fracture; at stress ratio equals to 2.0, main vertical facture with partly branches were formed around the wellbore (Figure 7b). This results show that the minimum horizontal stress contrast between the two overlaying layers is thedominant factor that controls the growth of hydraulic fractures (Warpinski and Teufel, 1987). Figure 7c is designed to illustrate the influence of injection rate on fracturing network, for this model with SR = 1.2, IR = 10 and MR = 1:2. Compared with the geometry of the base model (Figure 7a), the experimental conditionsare the same expect the injection rate, in this case, partly horizontal fracture with random branches can be observed around the wellbore. Under low injection rate, hydraulic fractures are difficult to cross the silty laminae, and easy to propagate along the bedding face, then to communicate with random natural fractures, the fracturing effectiveness is not good. Figure 7d is designed to illustrate the influence of laminae strength on fracturing network, for this model with SR = 1.2, IR = 10, and MR = 1:6. In this case, the UCS of silty laminae is the lowest. After hydraulic facturing, another new kind of fracture network—main horizontal fracture with partly fractures appears. The hydraulic fracture is difficult to cross the laminae and prone to be arrested along bedding faces, the fracturing effectiveness is poor.

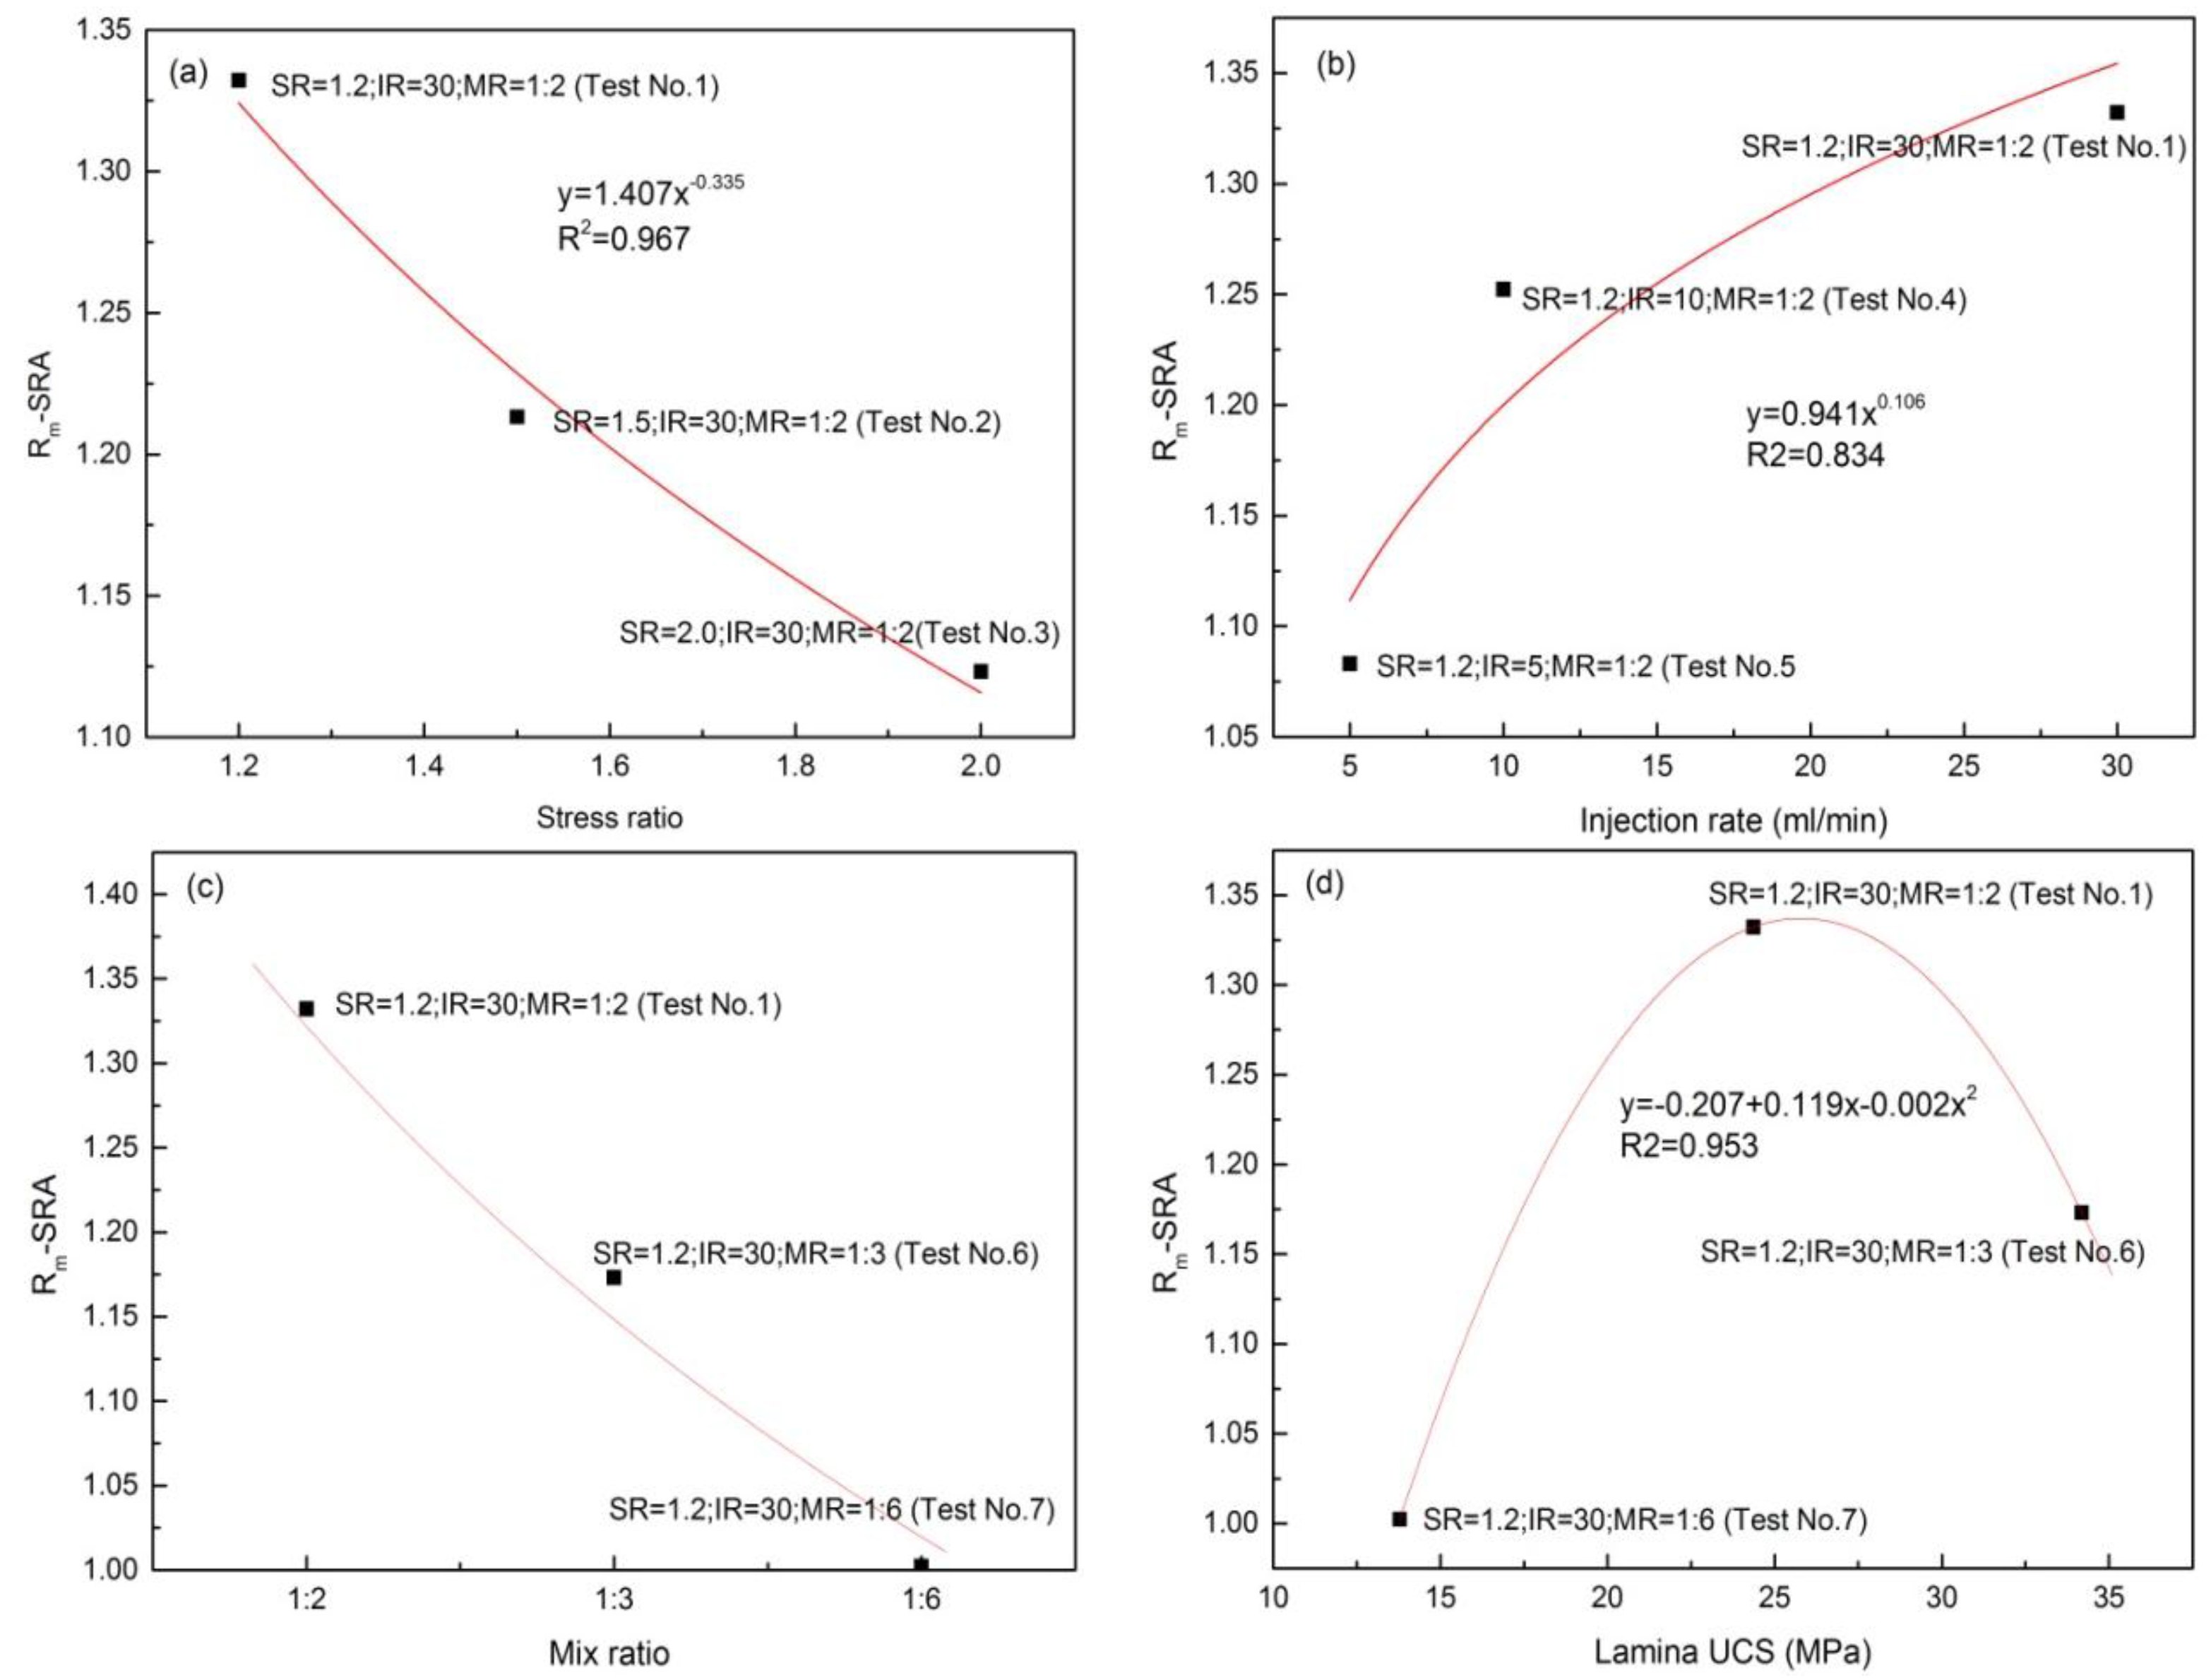
3.3. Quantitative Analysis of Fracturing Effectiveness

From the qualitative analysis above, four geometry morphologies of fracturing network can be summarized. In this section, aquantitative analysis using the defined index of Rm(SRA) is performed. Figure 8 shows the reconstructed morphology for the typical main fracture surfaces. It can be seen that with the increase of stress ratio and laminae strength, and with the decrease of injection rate, the roughness of the stimulated main fracture surface decreases. The result implies that with higher injection rate and lower stress ratio, we can get the best fracturing effectiveness. The roughness coefficient for the studied model blocks are listed in Table 2. Figure 9 plots the relationship between the studied factors and the index of Rm(SRA).
From Figure 9a, the roughness of the stimulated surface decreases with the increasing stress ratio, and the associated fracturing effectiveness gradually decreases. At low stress ratio, the hydraulic fractures are prone to communicate with more natural fractures, the strong interactions between them result in the roughness of main fracture surface.
From Figure 9b, roughness of the fracture surface increases with the increasing injection rate, and the effectiveness of hydraulic fracturing is the best high injection rate. These results indicate that the injected fluid with high flow rate results in stronger pore pressure propagation region. At relative low flow rate, the interaction between hydraulic fracture and the random fractures is weaker than higher flow rate. In this work, the model block has the best hydraulic fracturing effectiveness with higher injection rate. It should be noted that the injection rate is not the only factor that affects the hydraulic fracturing effectiveness. The hydraulic fracturing effectiveness is also closely related to characteristics of formations.
From Figure 9c, we plots the roughness of stimulated surface against the factor of lanimae strength. When the mixture of cement and quartz sand equals to 1:6, the laminae strength is the lowest; however, the hydraulic fracturing effectiveness is the poorest. Our results indicate that containment of a hydraulic fracture within block sections between two layers which requires having an interface capable of arresting the induced fracture. Although, the minimum horizontal stress difference between the two layers is thedominant factor that controls the growth of hydraulic fractures [35]. The contrast in material properties is anther dominant factor. Interface slippage can result in immediate termination of fracture growth between two adjacent layers with high mismatch of elasticity. It is not the case that when the laminae strength is low, the hydraulic fractures areeasy to cross the bedding faces. When the laminae with high strength, the hydraulic fracture is differicult to across the laminae and is arrested at the interfaces; offset, divertion behaviors become weak in this condition, it is adverse to generate complex fracturing network. When the laminae with low strength, the specimen is easy to be hydraulic fractured, and the injected fluid pressure and energy cannot be accumulated in the model block, and hydraulic fracture is prone to propagate along the interfaces of low laminae and cement matrix, communication degree of hydraulic fractures and laminas is weak, therefore, it is also not good to form complex fracturing network.

3.4. Discussion

Three dominating factors of stress ratio, injection rate, and laminae strength on the propagation of hydraulic fracture were studied based on the triaxial hydraulic fracturing experiments. Stress ratio also plays an important role in the generation of fracturing networks, as it controls the geometry of fracturing network. Wang et al. [25] studied the influence of non-tectonic micro-fractures on hydraulic fracturing, but for their studies, thesilty laminae structure is not introduced into the modeling. Under different stress ratio, two different morphology of fracturing network are observed. When the stress contrast between adjacent zones is large enough, the growth offracture height is expected to decline and ultimately stop (i.e., fracture is contained). If the minimum horizontal stress in the next layer is greater than the minimum horizontal stress in the former layer, the new layer can contain a hydraulic fracture with anoverpressure equal to the minimum horizontal stress contrast [36,37]. This overpressure isindeed the difference between the fracture propagation pressure and the minimum horizontal stress in the former layer.
Fluid injection rate is critical to the overall response of the formation during hydraulic fracturing. The qualitative analysis results further prove that high injection rate is good to form complex fracturing network. This conclusion is consistent with the results of King [38] and Fan et al. [39]. Injection rate has different influences on fracturing network during hydraulic fracturing. When the pump rate is low, the fracturing fluid flows usually along the bedding faces and natural fractures [40]. With the increasing pump rate, the free deviation of the injected fluid from the maximum horizontal direction becomes very easy for hydraulic fractures. At this conditions, the hydraulic fracture can communicate natural fractures and greatly increases the stimulated reservoir volume. At high injection rate, radial random net-fractures are easy to form, and the associate fracturing network is the most complicated.
When introducing the laminae into the model blocks, elasticity mismatch occurs between the two different materials, the shale layer and laminae layer. A contrast of material properties in large-differencial soft-hard interfaces is likely to govern thefracture containment [41]. Interface slippage can result in immediate termination of fracture growth. However, depending on the condition, interface slippage along with offsetting may occur [42], our experimental results also confirm this viewpoint. Strength chacacteristics of silty laminae is crucial to the fracturing network evolution, its mechanical properties control the propagation behaviors of hydraulic fractures, such as cross, arrest, offset and deivertion. A most significant finding in this work is that too high and too low strength properties of silty laminaeare not good to generate complex fracturing network.

4. Conclusions

According to outcrop observation and core measurement of Chang 7-2 formation in Ordos Basin, China, a series of cement model blocks were prepared to conduct the hydraulic fracturing experiments. The model blocks are laminated with random fractures, to study the affact of stress ratio, injection rate, and laminae strength on the evolution of fracturing network. From the macroscopic failure morphology descriptions combined with meso 3-D laser scanning techniques, the main conclusions from this study are summarized in the following points:
(1)
According to the macroscopic failure morphology description, four kinds of typical fracture network geometry are summarized, namely, the radial random net-fractures, main vertical factures with partly branches, partly horizontal fracture with random branches, and main horizontal fractures with partial branches. The geometry of the fracturing network is determined by the studied factors. The effectiveness of fracturing network is best with the radial random net-fractures, and worst with the main horizontal fracture with partial branches.
(2)
The hydraulic fractures are prone to communicate with natural fractures under the circumstances of high injection rate and low stress ratio. Laminae strength as a dominant factor, and it is not the case that the lower the strength, the better fracturing effectiveness is. The proposed index of Rm(SRA) can well quantitatively reflect the interaction between hydraulic fracture and natural fractures. Complexity or network fracturing is a combination for establishing main fractures with high conductivity and adding immense contact areas in the rock.
(3)
Laminae as a typical geological structure in continental shale hydrocarbons in China, its structure and strength properties strongly influence the propagation of hydraulic fractures. A contrast in material properties at soft-hard interfaces governs the fracture containment, interface slippage can result in the offsetting and arresting behaviors of hydraulic fractures. If the laminae have relative low strength, it is not benefit to form complex networks.

Acknowledgments

We thank the editors and the anonymous reviewers for their helpful and constructive suggestions and comments. This work was supported by the National Natural Science Foundation of China (Grants Nos. 41502294,41330643, 41227901), Beijing Natural Science Foundation of China (Grants Nos. 8164070), China Postdoctoral Science Foundation Funded Project (Grants Nos. 2015M571118), and the Strategic Priority Research Program of the Chinese Academy of Sciences (Grants Nos. XDB10030000, XDB10030300, and XDB10050400).

Author Contributions

Yu Wang and Xiao Li contribute to design the theoretical framework; Yu Wang performes the hydraulic fracturing experiments and wrote the manuscript, Jianming He contributes to correct the structure of the manuscript, Zhiheng Zhao contributes to revise the figures.

Conflicts of Interest

The authors declare no conflict of interest.

References

  1. Bowker, A.K. Barnett shale gas production, Fort Worth Basin: Issues anddiscussion. AAPG Bull. 2007, 91, 523–533. [Google Scholar] [CrossRef]
  2. Curtis, J.B. Fractured shale-gas systems. AAPG Bull. 2002, 86, 1921–1938. [Google Scholar]
  3. Chalmers, G.R.L.; Bustin, R.M. Lower Cretaceous gas shales in northeastern British Columbia, Part I: Geological controls on methane sorption capacity. Bull. Can. Pet. Geol. 2008, 56, 1–21. [Google Scholar] [CrossRef]
  4. Chalmers, G.R.; Bustin, R.M.; Power, I.M. Characterization of gas shale pore systems by porosimetry, pycnometry, surface area, and field emission scanning electron microscopy/transmission electron microscopy image analyses: Examples from the Barnett, Woodford, Haynesville, Marcellus, and Doig units. AAPG Bull. 2012, 96, 1099–1119. [Google Scholar]
  5. Nie, H.K.; Zhang, J.C. Types and characteristics of shale gas reservoir. Pet. Geol. Exp. 2011, 33, 219–225. [Google Scholar]
  6. Tang, X.; Zhang, J.C.; Wang, X.Z.; Yu, B.S.; Ding, W.L. Shale characteristics in the southeastern Ordos Basin, China: Implications for hydrocarbon accumulation conditions and the potential of continental shales. Int. J. Coal Geology 2014, 128, 32–46. [Google Scholar] [CrossRef]
  7. Tang, X.; Zhang, J.; Shan, Y.; Xiong, J. Upper Paleozoic coal measures and unconventional natural gas systems of the Ordos Basin, China. Geosci. Front. 2012, 3, 863–873. [Google Scholar] [CrossRef]
  8. Chen, Q.H. The Study on the Sedimentary System and Stratigraphic Sequence of Trassic Yanchang Formation in the Southern Part of the Ordos Basin. Master’s Thesis, The Northwest University, Shaanxi, China, 2014. [Google Scholar]
  9. Guo, Y.Q. Research on Reservoir Microscopic Characteristic of Yanchang Formation in Fuxian Exploration of the Odros Basin. Ph.D. Thesis, The Northwest University, Shaanxi, China, 2006. [Google Scholar]
  10. Wang, Y.; Li, X.; Zhang, B.; Zhao, Z.H. Optimization of multiple hydraulically fractured factors to maximize the stimulated reservoir volume in silty laminated shale formation, Southeastern Ordos Basin, China. J. Petro. Sci. Eng. 2016, 145, 370–381. [Google Scholar] [CrossRef]
  11. Dong, G.L. The Evaluation of Chang7 Shale Gas Reservoir Characteristics of YanChang Formation in ZhenYuan and JingChuan Area. Master’s Thesis, Chengdu University of Technology, Sichuan, China, 2012. [Google Scholar]
  12. Lei, Y.H.; Luo, X.R.; Wang, X.Z.; Zhang, L.X.; Jiang, C.F.; Yang, W.; Yu, Y.X.; Cheng, M.; Zhang, L.K. Characteristics of silty laminae in Zhangjiatan Shale of southeastern Ordos Basin, China: Implications for shale gas formation. AAPG Bull. 2015, 99, 661–687. [Google Scholar] [CrossRef]
  13. Hill, D.G.; Nelson, C.R. Gas productive fractured shales-an overview and update. Gas Tips 2000, 6, 4–13. [Google Scholar]
  14. Hill, D.G.; Nelson, C.R. Reservoir properties of the Upper Cretaceous Lewis Shale, a new natural gas play in the San Juan Basin. AAPG Bull. 2000, 84, 1240. [Google Scholar]
  15. Montgomery, S.L.; Jarvie, D.M.; Bowker, K.A. Mississippian Barnett Shale, Fort Worth Basin, north-central Texas: gas-shale play with multi-trillion cubic foot potential. AAPG Bull. 2005, 89, 155–175. [Google Scholar] [CrossRef]
  16. Anderson, R.Y. Seasonal sedimentation: A framework for reconstructing climatic and environmenta change. Geol. Soc., Lond., Spec. Publ. 1996, 116, 1–15. [Google Scholar] [CrossRef]
  17. Kemp, A.E.S. Laminated sediments as palaeo-indicators. Geol. Soc., London, Spec. Publ. 1996, 116, 7–12. [Google Scholar] [CrossRef]
  18. Schieber, J. Common themes in the formation and preservation of porosity in shales and mudstones: Illustrated with examples across the Phanerozoic. In Proceedings of Society of Petroleum Engineers Unconventional Gas Conference, Pittsburgh, PA, USA, 23–25 February 2010.
  19. Reineck, H.E.; Singh, I.B. Genesis of laminated sand and graded rhythmites in storm-sand layers of shelf mud. Sedimentology 2006, 18, 123–128. [Google Scholar]
  20. Hammes, U.; Hamlin, H.S.; Ewing, T.E. Geologic analysis of the Upper Jurassic Haynesville shale in east Texas and west Louisiana. AAPG Bull. 2011, 95, 1643–1666. [Google Scholar] [CrossRef]
  21. Scott, E.D.; Bouma, A.H. Depositional processes and characteristics of siltstones, mudstones and shale. Gulf Coast Assoc. Geol. Soc. Trans. 2002, 52, 1115–1118. [Google Scholar]
  22. Ding, W.; Zhu, D.; Cai, J. Analysis of the developmental characteristics and major regulating factors of fractures in marine–continental transitional shale-gas reservoirs: A case study of the Carboniferous-Permian strata in the southeastern Ordos Basin, central China. Marine Pet. Geol. 2013, 45, 121–133. [Google Scholar] [CrossRef]
  23. Ding, W.L.; Xu, C.C.; Jiu, K. The research progress of shale fractures. Adv. Earth Sci. 2011, 26, 135–144. [Google Scholar]
  24. Ding, W.L.; Zhang, B.W.; Li, T.M. Formation of non-tectonic fractures in mudstones in Gulong depression. Oil Gas Geol. 2003, 24, 50–54. [Google Scholar]
  25. Wang, Y.; Li, X.; Zhao, Z.H.; Zheng, B.; Zhang, B. Contributions of non-tectonic micro-fractures to hydraulic fracturing—A numerical investigation based on FSD model. Sci. China Earth Sci. 2016, 59, 1–15. [Google Scholar] [CrossRef]
  26. Dan, X.U.; Hu, R.L.; Gao, W. Effects of laminated structure on hydraulic fracture propagation in shale. Pet. Explor. Dev. 2015, 42, 573–579. [Google Scholar]
  27. Olson, J.E.; Bahorich, B.; Holder, J. Examining hydraulic fracture: Natural fracture interaction in hydrostone block experiments. In Proceedings of Society of Petroleum Engineers (SPE) Hydraulic Fracturing Technology Conference, The Woodlands, TX, USA, 6–8 February 2012.
  28. Dehghan, N.A.; Goshtasbi, K.; Ahangari, K.; Jin, Y. The effect of natural fracture dip and strike on hydraulic fracture propagation. Int. J Rock Mech. Min. Sci. 2015, 75, 210–215. [Google Scholar] [CrossRef]
  29. Adachi, J.I. Fluid-Driven Fracture in Impermeable and Permeable Rock. Ph.D. Thesis, University of Minnesota, Twin Cities, MN, USA, 2011. [Google Scholar]
  30. Casas, L.A.; Miskimins, J.L.; Black, A.; Green, A. Laboratory Hydraulic Fracturing Test on a Rock With Artificial Discontinuities. In Proceedings of Society of Petroleum Engineers (SPE) Annual Technical Conference and Exhibition, SanAntonio, TX, USA, 24–27 September 2006.
  31. Pater, C.J.; Cleary, M.P.; Quinn, T.S.; Barr, D.T.; Johnson, D.E.; Weijers, L. Experimental verification of dimensional analysis for hydraulic fracturing. Soc. Pet. Eng. (SPE) 1994, 9, 230–238. [Google Scholar]
  32. Hou, B.; Chen, M.; Li, Z.M.; Wang, Y.H.; Diao, C. Propagation area evaluation of hydraulic fracture networks in shale gas reservoirs. Petrol. Explor. Develop. 2014, 41, 833–838. [Google Scholar] [CrossRef]
  33. Wang, Y.; Li, X.; Zhou, R.Q.; Zheng, B.; Zhang, B.; Wu, Y.F. Numerical evaluation of the effect of fracture network connectivity in naturally fractured shale based on FSD model. Sci. China Earth Sci. 2015, 58, 1–14. [Google Scholar]
  34. Barker, J.A. A generalized radial flow model for hydraulic tests in fractured rock. Water Resources Res. 1988, 24, 1796–1804. [Google Scholar] [CrossRef]
  35. Warpinski, N.R.; Tuefel, L.W. Influences of geologic discontinuities on hydraulic fracture propagation. J. Pet. Technol. 1987, 12, 209–220. [Google Scholar] [CrossRef]
  36. Sarmadivaleh, M.; Rasouli, V. Studying the controlling parameters in hydraulic fracturing and fracture containment in tight formations. APPEA J. 2010, 50, 581–591. [Google Scholar]
  37. Sarmadivaleh, M.; Rasouli, V.; Nabipour, A. DEM simulation of controlling parameters in hydraulic fracture and natural interface interaction. In Proceeding of 2nd International Fast Lagrangian Analysis of Continua (FLAC)/Discrete Element Method (DEM) Symposium, Melbourne, Australia, 14–16 February 2011.
  38. King, G.E. Thirty years of gas shale fracturing: What have we learned? In Proceedings of Society of Petroleum Engineers (SPE) Annual Technical Conference and Exhibition, Florence, Italy, 19–22 September 2010.
  39. Fan, T.G.; Zhang, G.Q. Laboratory investigation of hydraulic fracture networks in formations with continuous orthogonal fractures. Energy 2014, 74, 164–173. [Google Scholar] [CrossRef]
  40. Guo, T.; Zhang, S.; Qu, Z. Experimental study of hydraulic fracturing for shale by stimulated reservoir volume. Fuel 2014, 128, 373–380. [Google Scholar] [CrossRef]
  41. Wu, H.; Dudley, J.W.; Wong, G.K.; Chudnovsky, A. A map of fracture behavior in a vicinity of interface. In Proceedings of the 6th North American Rock Mechanics Symposium Symposium (NARMS), Houston, TX, USA, 6–10 June 2004.
  42. Zhang, X.; Jeffrey, R.G.; Thiercelin, M. Escape of fluid-driven fractures from frictional bedding interfaces: A numerical study. J. Struct. Geol. 2008, 30, 478–490. [Google Scholar] [CrossRef]
Figure 1. The outcrop observation and core measurement of the typical continental shale in the Ordos Basin, where shale and silty laminae are alternatively deposited layer by layer. (a) Outcrop of silty laminae in Chang 7-2 stratum; (b) Core sample of Chang 7-2 formation with typical silty laminae structure.
Energies 09 00588 g001
Figure 2. (a) Grain size distribution of the sand particles used for preparing the cement blocks; (b) Uniaxial compressive stress-strain curves for typical specimens with different mass ratio.
Energies 09 00588 g002
Figure 3. The preparation of the tested model blocks. (a) The block was produced layer by layer, and cured for two weeks; (b) Block blasting to generate random fractures, it is in the oven 8 h at 200 ℃ followed by natural air cooling; and conducted alternatively, repeated four times; (c) Installing a perforation casing in the model block; (d) Photo of the perforation casing used to simulate horizontal well fracturing, with an inside diameter of 8 mm, and spirally distributed perforation holes with 1 cm height difference and 60 degree angular difference between adjacent holes, so the effective perforation section is 60 mm, the diameter of the perforation hole is 3 mm, and total length is 220 mm.
Energies 09 00588 g003
Figure 4. Schematic of the simple true tri-axial hydraulic fracturing testing system for the experiment.
Energies 09 00588 g004
Figure 5. Reconstruction morphology of the stimulated main surface for the base model with SR = 1.2, IR = 10, and L-UCS = 24.362. (a) Failure morphology of the model blocks; (b) Reconstruction morphology of the half model blocks for the base model; (c) Extracting the stimulated fracture surface for the base model.
Energies 09 00588 g005
Figure 6. Relationship between pump rate and injection time for the tested model blocks. (a) Influence of the stress ratio (i.e., 1.0, 1.2, 1.6) on pump pressure curves; (b) Influence of the injection rate (i.e., 10, 30, 50 mL/min) on pump pressure curves; (c) Influence of the laminae strength on pump pressure curves.
Energies 09 00588 g006
Figure 7. Sketch mapping the evolution of fracturing network for typical model blocks (the yellow words in the figures indicate the studied factors). (a) Geometry of fracturing network for the base model, a radial random net-fractures plays a dominate role; (b) Geometry of fracturing network for the comparison model, to study the effectof stress ratio on fracturing network evolution, a main vertical facture with partly branches plays a dominate role; (c) Geometry of fracturing network for the comparison model, to study the effectof injection rate on fracturing network evolution, a partly horizontal fracture with random branches plays a dominant role; (d) Geometry of fracturing network for the comparison model, to study the effectof laminae strength on fracturing network evolution, a main horizontal fracture with partly branches plays a dominantrole.
Energies 09 00588 g007
Figure 8. Reconstruction morphology of the stimulated main surface for the typical model blocks. (a1-a2) Illustrate to the influence of stress ratio on fracture surface, and (a1) corresponds to the base model; (b1-b2) Illustrate to the influence of injection rate on fracture surface; (c1-c2) Illustrate to the influence of laminae strength on fracture surface.
Energies 09 00588 g008
Figure 9. The relationships between roughness of stimulated fracture surface and the studied factors: (a)Plot of factor stress ratio to fracture surfacw roughness coefficient; (b) Plot of factor injection rate to fracture surfacw roughness coefficient; (c) Plot of factor mix ratio to fracture surfacw roughness coefficient; (d) Plot of factor laminae strength to fracture surfacw roughness coefficient.
Energies 09 00588 g009
Table 1. The experimental conditions and results for the hydraulic fracturing tests on random fractured cement blocks.
Test No.SR(/)aIR(mL/min) bLaminae Material
MR(/)cUCSd
11.2301:224.362
21.5301:224.362
32.0301:224.362
41.2101:224.362
51.251:224.362
61.2301:334.184
71.2301:613.782
a SR is defined as the ratio of maximum horizontal stress σH to minimum horizontal stress σh; b The injection rate of fracturing fluid, mL/min; cMR is define as the ratio of cement to quartz sand, a mss ratio;dUniaxial compressive strength of model blocks with different mix ratio.
Table 2. Qualitative and quantitative description of the evolution of fracture network.
Test No.Rm(SRA)(/)eGeometry Morphology Descriptions of Fracturing Network
11.3322Radial random net-fractures
21.2132Main vertical facture with partly branches
31.1232Main vertical facture with partly branches
41.3023Partly horizontal fracture with random branches
51.0931Partly horizontal fracture with random branches
61.1732Main vertical facture with partly branches
71.0323Main horizontal fracture with partly fractures
eAn newindex proposed to reflect the fracturing effectiveness, defined as roughness coefficient of the main fracture.

