Article

Study on the Criteria for the Determination of the Road Load Correlation for Automobiles and an Analysis of Key Factors

1
Korea Automobile Testing & Research Institute, Hwaseong-si, Gyeonggi-do 18247, Korea
2
School of Mechanical Engineering, Korea University, 145, Anam-ro, Seongbuk-gu, Seoul 02841, Korea
*
Author to whom correspondence should be addressed.
Energies 2016, 9(8), 575; https://doi.org/10.3390/en9080575
Submission received: 2 May 2016 / Revised: 6 July 2016 / Accepted: 14 July 2016 / Published: 25 July 2016

Abstract

:
To determine the fuel economy and emissions of a vehicle using a chassis dynamometer, the load to which the vehicle is subjected when it actually runs on a road, or the road load specifications, must be simulated when the dynamometer is applied. The most commonly used method to measure road load specifications is coastdown testing. Currently, road load is measured and provided by the manufacturer of the vehicle. Verification of the accuracy of the manufacturer’s reported road load specifications by a third party may reveal that the specifications are inaccurate, possibly because of different testing locations, test drivers or test equipment. This study aims at identifying key factors that can affect a vehicle’s road load correlation by using experimental design and deriving criteria for determining the correlation based on the energy difference.

Graphical Abstract

1. Introduction

Regulations on fuel economy and carbon dioxide (CO2) emissions around the world amid global warming will continue to be tightened until 2020. In the meantime, an improvement in fuel economy approximately 4% will be required per year [1]. As automakers have undertaken tremendous efforts to develop vehicles with higher fuel efficiency, the overall fuel economy of vehicles has improved continuously over the last five years [2,3]. Such a demand for high fuel efficiency has stimulated greater interest among researchers regarding the analysis and reduction of road load, which had received only a fraction of the attention directed to the overall enhancement of engines or transmissions on the subject of improving fuel economy [4,5,6,7].
Although road load is one element of a vehicle’s fundamental performance, accurate and comprehensive analysis thereof has been highly difficult because the factors influencing it are spread throughout the vehicle. Studies of road load in vehicles began in earnest in the 1950s. In the 1970s, the society of automotive engineers (SAE) issued a more systematic, standardized method of performing a road load test—J1263—based on findings from previous studies. Subsequently, SAE issued J2263 based on the results of studies conducted in the 1980s and 1990s to enhance the accuracy of road load and raise the overall reliability of the test. Currently, J2263 serves as the standard norm for road load testing in North America. Both test methods are based on the same method: accelerating the test vehicle over a certain speed on a sufficiently long, straight, and flat road; shifting the gear to neutral and letting the vehicle run via inertia only; measuring the duration of deceleration; and translating it into road load [5,7,8,9].
Once the road load is determined, the vehicle’s fuel economy and emissions can be evaluated using such modes as federal test procedure 75 (FTP-75), highway fuel economy test (HWFET), or new european driving cycle (NEDC) by replicating the value on a chassis dynamometer. Previous studies, however, show that inconsistencies often exist between certification test results and actual test results and point to the use of the flexibility allowed in the manufacturer’s road load test procedures as being the cause of such inconsistencies [3,10,11,12,13,14,15].
Additionally, a number of literature sources reveal that a vehicle consumes a lesser amount of fuel for the test, and emits less CO2 when realistic road load values instead of the official ones are applied on a chassis dynamometer [16,17,18]. One of the reasons for a rapidly growing discrepancy between official and real-world fuel economy and emission values of new passenger cars is weaknesses in the certification testing schemes and in the compliance protocols. These weaknesses have allowed vehicle manufacturers to be increasingly able to misuse tolerances and flexibilities, leading to downward-trending type-approval emission levels that are not matched by a similar decrease in real-world emission levels—indeed, the real-world values contradict the type-approval results [19,20]. This discrepancy can occur from various factors, such as driving style and conditions [21,22,23]. However, about one-third of this gap is explained by vehicle manufacturers systematically exploiting technical tolerances and inaccurate definitions in the procedures specified for the coastdown tests that provide conclusive data used to set up the lab equipment for type-approval tests [24,25].
In fact, coastdown testing depends on, among other things, the road surface conditions, any local change in the flattening or gradient of the road, wheel and tire specifications, vehicle preparation, tire pressure, test weight, brake drag, air condition, delicate operation of the steering system by the driver, test equipment, and the data processing method [3,10,11,26,27,28]. For reducing the use of these flexibilities, it is necessary to devise a method of how to calculate, quantitatively, the road load values using coastdown tests.
However, there is no global law or regulation to quantitatively calculate the differences in road load, which are caused by many different factors. In the U.S., the Environmental Protection Agency (EPA) states in its guidance letter Compliance Division (CD)-15-04 that it will verify the road load force specified by manufacturers based on energy loss in the FTP-75 and HWFET modes by using their production vehicles starting in the 2017 model year [29]. United Nations (UN) global technical regulation (GTR) No. 15 worldwide harmonized light vehicle test procedures (WLTP—Phase 1(b)) states in the general requirements section that each manufacturer is responsible for the accuracy of the road load values it specifies [30]. Although the document does not provide criteria for confirming road load specifications, it is expected that WLTP Phase 2 will step up its efforts to develop such criteria. In Korea, the applicable regulation regarding fuel economy states that the road load should be calculated based on energy differences considering fuel economy modes, but fails to provide any specific method of calculation [31].
Currently, road load data are measured and provided by the vehicle manufacturer. Regardless of whether the manufacturer uses the allowed flexibility given in the test procedures, testing by a third party to verify the data provided by the manufacturer may result in different road load data because of different test sites, test drivers, test devices, and/or methods of data processing.
The main objective of this study is to identify key factors that affect a vehicle’s road load correlation based on data obtained via road load correlation test between two test bodies after considering evaluation criteria for determining the correlation based on the energy difference, and give the compliance protocol concept for precise verification of the road load values specified by manufacturers. Thus, we removed the flexibility elements that may cause differences in road load data, such as the condition of the test vehicle; identified three key factors for determining the correlation between road load data provided by two test bodies (test site, test driver, and test devices); determined the orthogonal array based on design of experiment (DOE) full factorial design; and conducted a coastdown test according to the order and the J2263 test standard before statistically analyzing the results of the test. For the analysis, we derived criteria for determining the road load correlation based on energy differences.

2. Theoretical Approach

2.1. Coastdown Analysis Model

The coastdown analysis model, according to the J2263 test standard used in this study, is very well-known and expressed as shown in Equation (1), and preliminary analysis depending on this model is conducted using linear regression to identify individual coefficients (Am, Bm, Cm, a0, a1, a2, a3, a4) with minimum errors based on Me, dV/dt, V, Vr, dh/ds, and R, given all measured data. Data with excessive deviations are then excluded before linear regression analysis is performed again to calculate the individual coefficients. These coefficients are subjected to compensation for temperature and ambient pressure in accordance with regulations to be translated into final ones [26,31,32]. Meanwhile, road grade effect was not considered because coastdown testing was performed on a flat road in this study.
M e ( d V d t ) =   A m + B m V + C m V 2 + 1 2 R A V r 2 ( a 0 + a 1 Y + a 2 Y 2 + a 3 Y 3 + a 4 Y 4 ) ± M g ( d h d s )
where:
MeEffective vehicle mass (kg)
dV/dtAcceleration (m/s2)
VVehicle velocity (km/h)
AmCoefficient of mechanical drag (N)
BmCoefficient of mechanical drag (N/(km/h))
CmCoefficient of mechanical drag (N/(km/h)2)
RAir density (kg/m3)
AFrontal area (m2)
Vrapparent wind speed relative to vehicle (km/h)
YYaw angle of apparent wind relative to direction of vehicle travel (deg)
a0, …, anCoefficients for aerodynamic drag, as a function of yaw angle (degn)
MMass of vehicle (kg)
gGravitational constant 9.80665 m/s2
dh/dsSine of slope
Equation (1) above is based on studies conducted in the 1980s or 1990s and a paper published in 1995 (ABCD-method) [33]. This modeling is designed to enhance the degree of the test and distinguish mechanical resistance and aerodynamic drag by measuring wind in real-time with an onboard anemometer installed 2 m ahead of the test vehicle and correcting the influence of wind to a greater extent.

2.2. Criteria for Confirming Road Load Correlation

2.2.1. Five Criteria for Determining Road Load Correlation

In this study, we considered five criteria for determining road load tolerance that can be used when a third party verifies road load specifications provided by a manufacturer [34,35]. Table 1 shows the criteria. The first criterion relates to the individual energy differences depending on the FTP-75 and HWFET modes, which are fuel economy test modes used in the U.S. and Korea, whereas the second relates to the energy loss difference calculated by combining 55% of the energy loss from the FTP-75 mode and 45% of the energy loss from the HWFET mode.
Figure 1 shows how the energy loss considering the FTP-75 and HWFET test modes is calculated based on the first and second evaluation criteria given in Table 1 for determining road load tolerance. Additionally, this one explains that power loss is calculated by multiplying the driving mode’s target speed (profile) by the road load force and then integrating it against time to determine the final energy loss due to the road load.
The third criterion is related to the difference between the average road load forces (or road energy) calculated at 21 speed points set by dividing the range of 15–115 km/h, which is used for this study, into 5 km/h segments. The fourth criterion relates to the difference in road load horsepower (RLHP) under a condition of 50 mph used by the EPA in the U.S., and the fifth criterion relates to the difference in rolling resistance coefficient f0 and aerodynamic coefficient f2 among the road load coefficients.
To compare how the five criteria listed above are different, author-defined road load values were used for both the target and confirmed cases. Table 2 shows the results from the comparison. During the calculation, driving speeds of less than 10 mph were regarded as zero. This is because the analysis of the vehicle’s full force can be performed only at speeds over 10 mph because the road load coefficient f0 is merely a result that is determined by extrapolation.
Table 2 shows calculation example of the energy difference between the target road load and the value from the verification by a third party. When the first criterion for determining the road load tolerance is applied, energy loss is 14.9% in the FTP-75 mode and 10.6% in the HWFET mode, respectively. When the second criterion is applied, it is 12.6%. When the third and the fourth criteria are applied, energy losses are 12.2% and 10.8%, respectively. When the fifth is applied, differences of 29.6% and 0% occur at f0 and f2, respectively.
This suggests that the calculation may produce different results depending on which criteria are used for determining road load tolerance. Consequently, criteria for determining road load tolerance must be specified before the manufacturer’s road load data are to be verified by a third party.

2.2.2. Limitations of Methods Using a Fuel Economy Test Mode

Methods for calculating energy loss using fuel economy test modes (the first and second criteria given in Table 2) may produce different results when the manufacturer and third-party verification body apply different driving schedules, durations of driving, speed sections where speed is regarded as zero, methods of unit translation, or otherwise. To address such inconsistencies and present an unambiguous method for determining road load tolerance, this study derived the constant of a road load coefficient.

2.2.3. Deriving the Constant of Road Load Coefficients

To test the fuel economy and emissions using a chassis dynamometer, the road load of the test vehicle is expressed as a quadratic function of vehicle speed:
R L   ( Road Load ) = f 0 + f 1 v + f 2 v 2
Energy ( E R L ) loss due to road load while the test vehicle runs on a driving schedule on a chassis dynamometer can be calculated as follows:
E R L = ( f 0 + f 1 v + f 2 v 2 ) × d S = ( f 0 v + f 1 v 2 + f 2 v 3 ) d t   = f 0 × v d t + f 1 × v 2 d t + f 2 × v 3 d t = f 0 × ( v Δ t ) + f 1 × ( v 2 Δ t ) + f 2 × ( v 3 Δ t )
where S is the distance of travel, and t is time.
In Equation (3), if the FTP-75 and HWFET test modes used by the EPA and in Korea, respectively, are applied as driving schedules and the units of road load coefficient—f0, f1, and f2—are N, N/km, and N/km2, respectively, the energy loss due to road load during the FTP-75 and HWFET modes can be calculated as follows. Here, speeds less than 10 mph are regarded as zero (0) as well.
Energy loss in the FTP-75 test mode ( E FTP 75 ) :
E FTP 75 ( kJ ) = 0 2477 ( f 0 + f 1 v F + f 2 v F 2 ) × v F d t = 0 2477 ( f 0 v F + f 1 v F 2 + f 2 v F 3 ) d t = f 0 × 0 2477 v F d t + f 1 × 0 2477 v F 2 d t + f 2 × 0 2477 v F 3 d t = A f 0 , F × f 0 + B f 1 , F × f 1 + C f 2 , F × f 2 = 17.4 × f 0 + 944.5 × f 1 + 58910.7 × f 2
Energy loss in the HWFET test mode ( E HWFET ):
E HWFET   ( kJ ) = 0 765 ( f 0 + f 1 v H + f 2 v H 2 ) × v H d t = 0 765 ( f 0 v H + f 1 v H 2 + f 2 v H 3 ) d t = f 0 × 0 765 v H d t + f 1 × 0 765 v H 2 d t + f 2 × 0 765 v H 3 d t = A f 0 , H × f 0 + B f 1 , H × f 1 + C f 2 , H × f 2 = 16.5 × f 0 + 1338.1 × f 1 + 110677.6 × f 2
Table 3 shows the constants of the road load coefficients derived considering the FTP-75 and HWFET test modes. We compared the energy losses calculated using the first determination criteria given in Table 2 with those calculated using the constants of the road load coefficients given in Table 3. The energy losses were almost identical, with differences of 0.1% in the FTP-75 mode and 0.0% in HWFET mode (Table 4). For this comparison, the road load coefficients given in Table 2 were used as the load resistance values.

3. Test Equipment, Method, and Analysis Procedures

3.1. Test Equipment

A compact sedan with a 2.4 L gasoline engine and a six-speed automatic transmission was used. The test vehicle conditions and test conditions, including the vehicle's run-in, tire wear, and weight, were based on “regulation for test procedures for energy efficiency, greenhouse gas emissions and fuel economy for motor vehicles” [31]. Coastdown testing was conducted under similar outdoor air conditions, with the vehicle's tire tread being not lower than 50% of its original state and the reference weight being the equivalent test weight (ETW) after 6500 km of run-in. Table 5 shows the specifications of the vehicle and its engine used by two test bodies for this study.
For the calculation of road load in accordance with the J2263 test standard, the distance, time, vehicle speed, direction, and speed of wind, and air temperature and pressure must be measured. For the calculation of distance, a noncontact speedometer that emits a digital pulse signal at regular intervals was used. For the calculation of time, a precision clock within the data acquisition device (with a resolution of 0.025 µs) was used. The vehicle speed was calculated from the distance traveled and time elapsed. For the measurement of the direction and speed of wind, an AQ 05305 model (R. M. Young Co., Traverse, MI, USA), a propeller-type wind monitor, was used to capture signals in an analogous manner. Air temperature and pressure were measured using a K-type thermocouple and a barometric pressure sensor incorporating piezoelectric elements. Figure 2 shows the measurement instruments for coastdown testing as configured.

3.2. Test Method

In this study, identical conditions were applied with respect to factors that can be controlled by humans, including run-in distance, tire conditions, test weight, tire pressure, warm-up conditions, range of speed, “split” runs, number of tests for each direction, and rotational inertia weight, among those that may influence the road load correlation between two different test bodies. For related factors, such as ambient temperature, the most similar conditions were applied during the test. However, the two test bodies applied different methods to correct the direction and speed of wind against the vehicle blockage effect and different methods of measuring air temperature and pressure.
For a comparison of the road load correlations between the two test bodies, the test site, test driver and test device were switched after their respective tests before another round of testing to collect and save data from each round. Upon completion of all tests, their data were analyzed using a data analyzer to calculate the road load applied to the vehicle during each test.
Owing to the unavailability of a sufficiently long test road for both test bodies, coastdown testing was conducted such that the test road was divided into high-speed and low-speed sections.
During the road load correlation test, the test driver, test device, and test site, which are bound to be different when verification is made independently by a third party, were identified as major factors. The levels of such factors were set at 2 for the test. Table 6 shows the factors and their levels. All three factors consist of discrete variables, and the response factor (Y) represents energy (
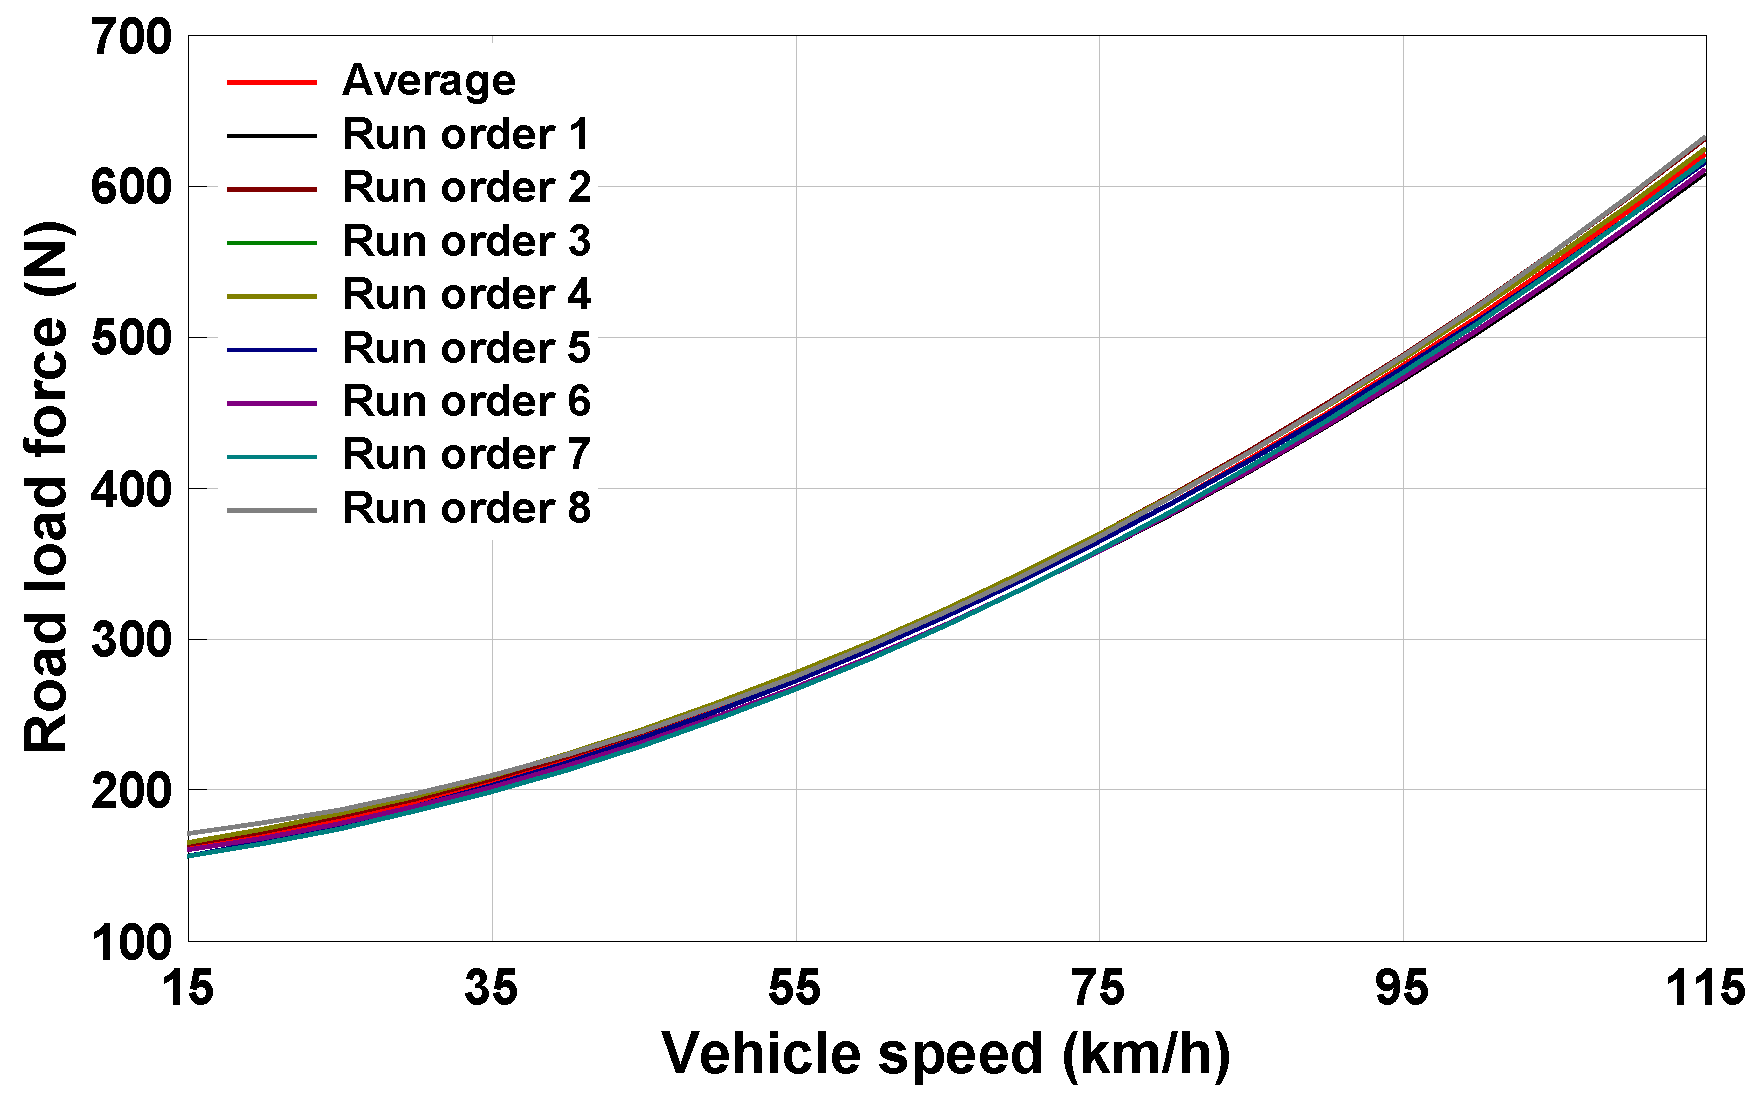
E) calculated for the road load values derived sequentially from the series of coastdown tests considering the fuel economy test mode. Fr represents the road load force from the coastdown test, and Vt and T represent the target speed for the fuel economy test and time, respectively.

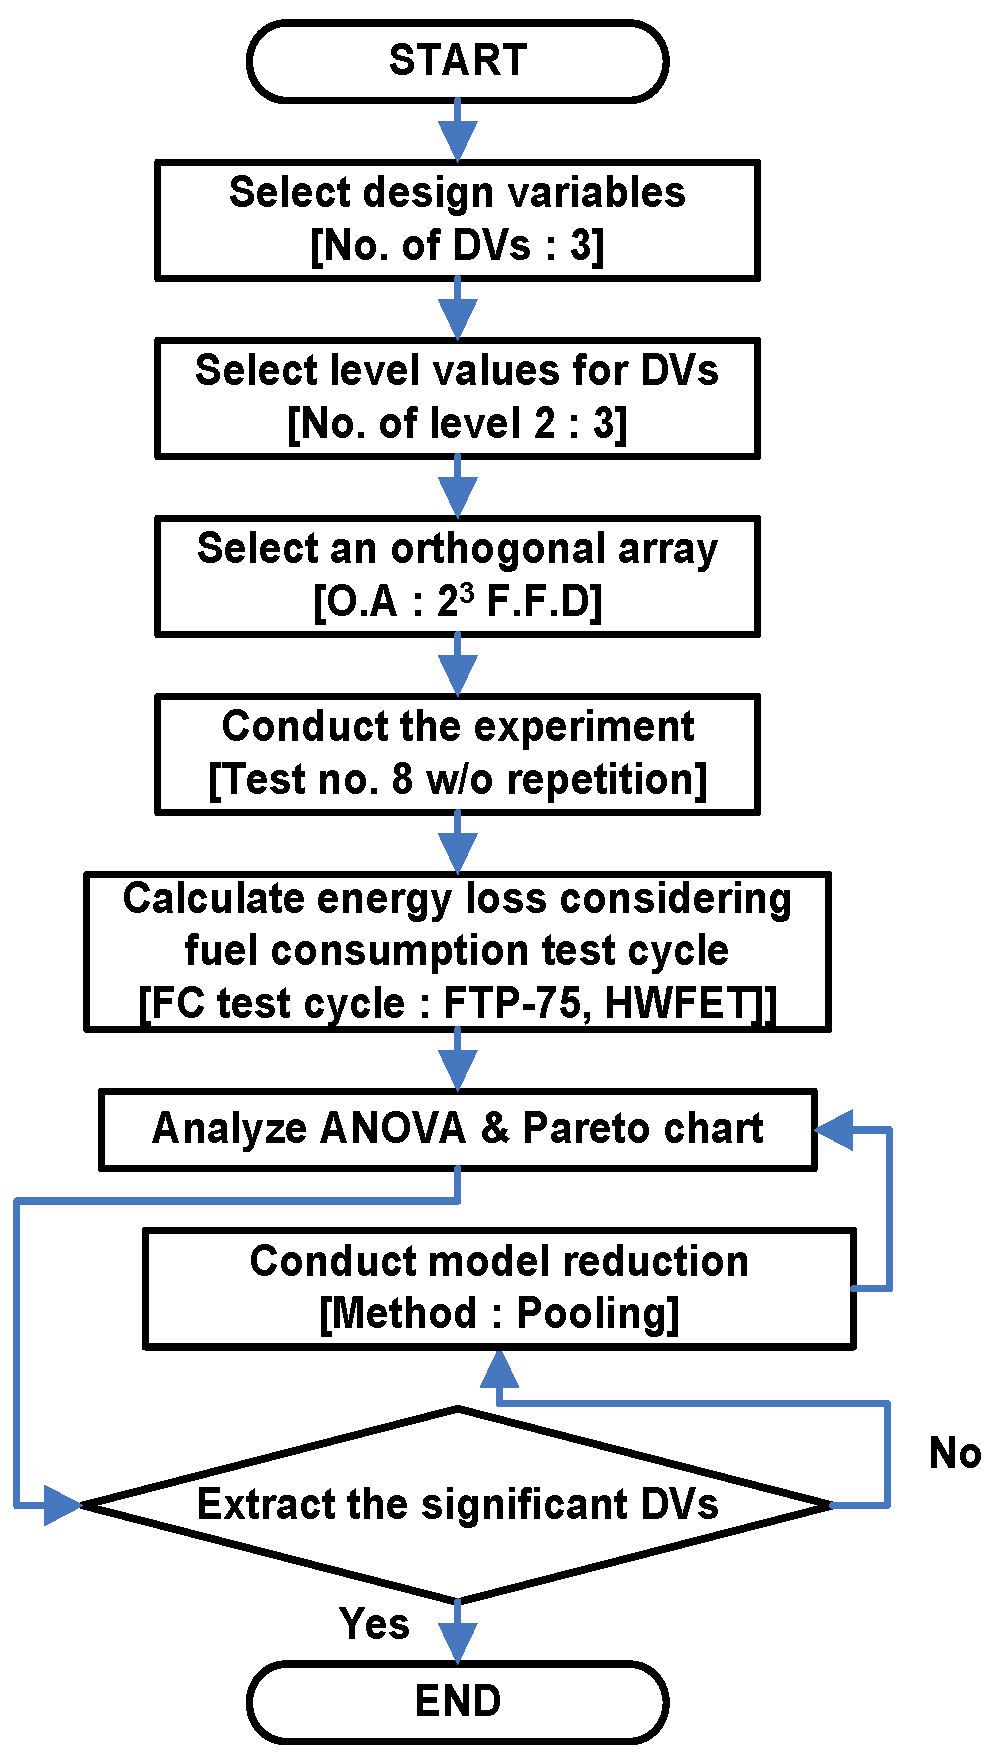
3.3. Procedures for Test Result Analysis

To identify a significant factor (s) among those considered for this study, we determined the orthogonal array (L8) based on a DOE full factorial design using Minitab version 16 (Minitab, State College, PA, USA). Coastdown testing was conducted according to the order and the J2263 test standard to derive test road values and calculate energy considering the fuel economy test mode. Table 7 shows the orthogonal array used for the test.
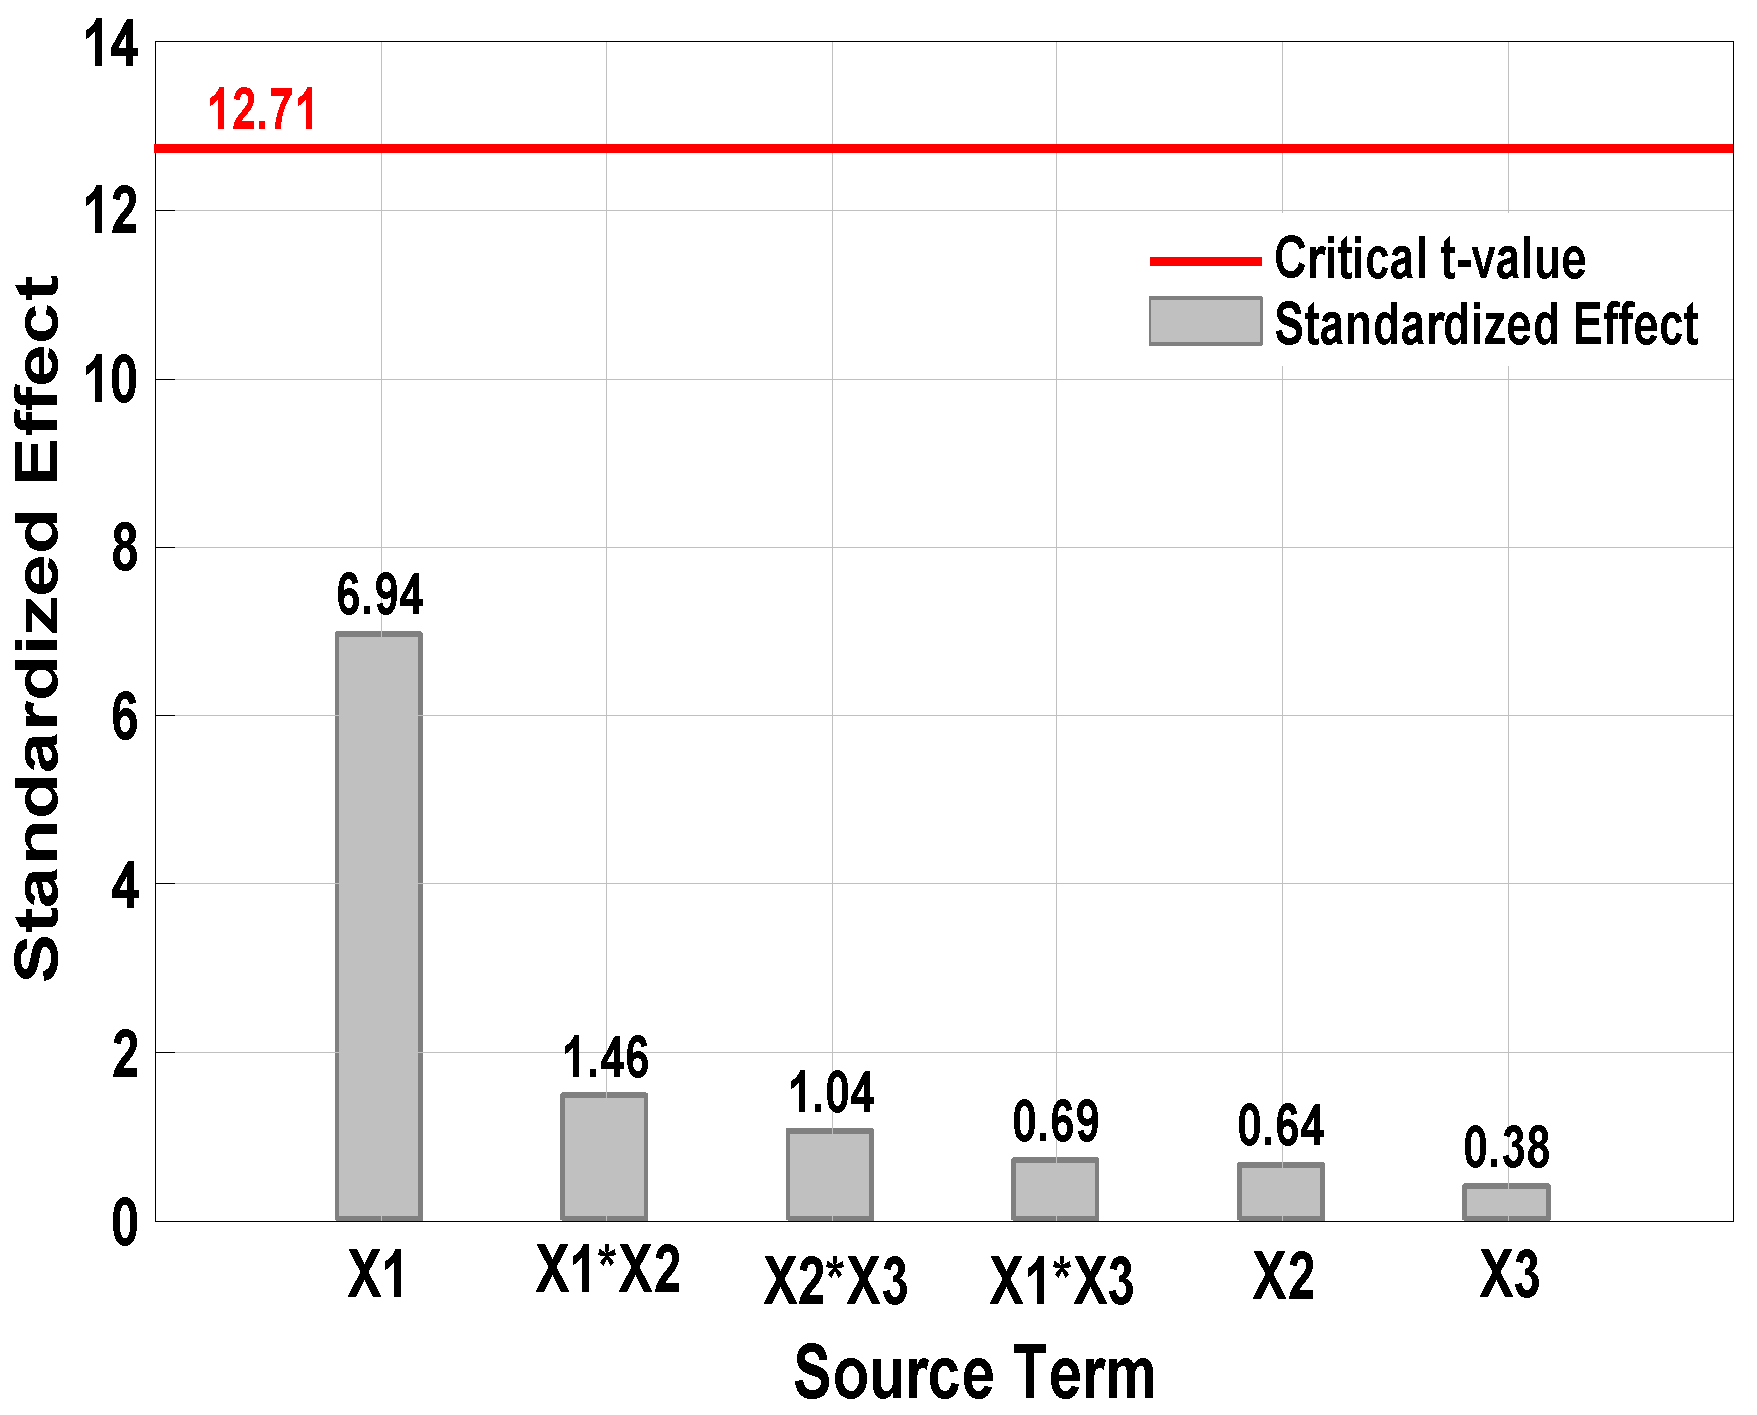
We performed analysis of variance (ANOVA) on the calculated energy to determine which factors have a significant impact on the test for final road load correlation. If identifying significant factors using ANOVA were impossible, we performed pooling in which interaction factors of higher degrees with many noise factors are transferred to the error term to scale down the model and, ultimately, estimate the effect of each factor independently [36]. Figure 3 shows the design scenario to determine which factors have a significant impact on the road load correlation among those identified in this study.

4. Results and Discussion

4.1. Road Load Coefficients and Energy Losses

In this study, using the results from the orthogonal array (L8) order based on DOE full factorial design, the J2263 test standard and Equation (1), we calculated road load coefficients f0, f1, and f2 and drew a road load graph for a speed range of 15–115 km/h, as shown in Figure 4.
In addition, the first of the five determination criteria given in Table 2 was used to calculate the energy loss considering the FTP-75 and HWFET modes for each run order. The results from the calculation are given in Table 8.

4.2. Road Load Correlation Analysis

4.2.1. Correlation Analysis Considering the Fuel Economy Mode (FTP-75 and HWFET)

Figure 5 shows the energy loss due to the road load for each run order in the FTP-75 mode. Run orders 1, 3, 5, and 7 represent energy loss due to the road load measured at test site A, with the average energy loss being 4824.4 kJ. Run orders 2, 4, 6, and 8 represent energy loss due to the road load measured at test site B, with the average energy loss being 4961.5 kJ. Test site A shows an average energy loss that is 2.8% lower than that recorded at test site B. The deviation between the highest and lowest losses for all run orders is 3.6% (run order 4 versus run order 7). The average energy loss for run orders 1–8 is 4892.9 kJ, with the maximum deviation being 2.0% at run order 7, which shows optimal case in terms of minimum energy loss (4794.2 kJ) among all run orders. Run order 1 represents the road load measured by test body A, whereas run order 8 represents the road load measured by test body B. The energy difference between the two is 3.2%. If we assume that the road load from run order 1 has been specified by the manufacturer, whereas the road load from run order 8 is from third-party verification, they can be used for confirmatory testing to verify road load specifications provided by the manufacturer afterward.
ANOVA was conducted to determine the statistical significance based on energy loss due to the road load in the FTP-75 mode for each run order. Judgment of significance for the key factors was made using the F-test and p-value at a confidence level of 95%. If the p-value for a key factor is less than 0.05, then the factor is statistically significant. Initially, the main effect factors, the two-way interaction term and the three-way interaction term, were both included in the model to perform ANOVA, but the F- and p-values could not be calculated because the number of terms in the model was the same as the number of degrees of freedom. This suggests that identification of significant factors using ANOVA is impossible. The asterisks in Table 9 indicate this impossibility.
To address this problem, we scaled down the model by performing pooling in which the three-way interaction term was transferred to the error term with priority and then performed ANOVA again. Table 10 shows the results from the analysis. The results are not statistically significant because all three factors have p-values greater than 0.05. This suggests that none of them have an impact on the road load correlation.
However, given the critical value of the t-statistic marked with a red line in Figure 6 showing a Pareto chart, 12.71, it cannot be concluded that statistical judgment has been made at a confidence level of 95%. This means that one cannot conclude that a factor is not necessarily significant just because its p-value is greater than 0.05.
Likewise, we again performed pooling on two-way or higher interaction terms to scale down the model to include only main effects before performing ANOVA to arrive at the results given in Table 11. The results in Table 11 show that only the test site among the three main effect factors has a p-value less than 0.05. This suggests that the test site is the only factor that has a significant influence over road load correlation.
In general, if the critical value of the t-statistic is between 2 and 3 and a factor’s t value is greater than the t-critical value, the factor is deemed to be significant. Among the standardized effects in the Pareto chart in Figure 7, the standardized effect of the test site is 6.420, which is greater than the t-critical value 2.776 marked with a red line. This confirms that the test site is the only significant factor.
The first and second rounds of scaling-down of the model could be performed because the DOE full factorial design features orthogonality, which makes it possible to estimate the effect of each factor independently regardless of two-way and three-way interaction terms. This study has confirmed that regarding the city mode (FTP-75), only the test site is significant among the three factors considered for determination of road load correlation between test bodies. In addition, energy loss due to road load under each set of test conditions during the FTP-75 test mode can be estimated using the regression model below:
Energy loss during a run-in the FTP-75 test mode = 4892.93 + 68.5250 × 1 − 6.30 × 2 + 3.80 × 3
where significance level α = 0.05, R-Sq = 91.25%.
To confirm the validation of the result from the earlier analysis, the normal distribution, consistency of variance, and randomness of time must be ascertained. To this end, a normal probability plot, residuals versus fits, and residuals versus orders were reviewed in that order and produced affirmative results. In particular, the p-value during the analysis of the normal probability plot was 0.792, which means that the normal distribution requirement is met.
Figure 8 shows the main effect plot in FTP-75 mode for the three key factors considered in this study. This indicates that the slope of the test site is much greater than those of the test driver and test devices with respect to the road load correlation test. This is consistent with the earlier result from ANOVA that the test site is the only factor that has a significant influence over road load correlation. In addition, a comparison of energy losses in FTP-75 mode from the two test bodies reveals that the test site of test body A shows a lower road load value than that of test body B.
ANOVA performed using energy loss during a run in the HWFET test mode reveals that the test site is a key factor that has a significant impact, as it is with the FTP-75 mode. Table 12 shows the ANOVA results.

4.2.2. Analysis of Road Load Correlation at Low, Medium, and High Speed Points

Figure 9 shows a comparison for the relative sizes of road load horsepower of each run order compared with the average road load horsepower of run orders 1–8 at three speed points—20, 65, and 110 km/h, which represent the low-, medium-, and high-speed sections of coastdown, respectively, as defined in J2263. In the same way, Figure 9 also includes a comparison of the relative scale of energy losses due to road load in the FTP-75 and HWFET modes. The ranges of the relative sizes of road load horsepower at the low-, medium- and high-speed points for run orders 1–8 are 96.7%–104.9%, 98.2%–101.6%, and 98%–101.7%, respectively, whereas the ranges of relative scale of energy loss in FTP-75 mode and HWFET mode are 98.0%–101.6% and 98.1%–101.5%, respectively.
Figure 10 shows the difference between the maximum and minimum relative scales of road load for each of the run orders given in Figure 9 in the order of low speed, medium speed, high speed, FTP-75 mode and HWFET mode. The levels of difference are approximately 8.2%, 3.4%, 3.7%, 3.6%, and 3.4% from front to rear and, except for the section representing low speed, all sections show almost the same difference between the maximum and minimum relative scales of road load. This result suggests that the low-speed section produces a larger road load deviation than the medium speed, high speed, FTP-75 mode, and HWFET mode. This indicates that a small amount of road load horsepower in the low-speed section is more sensitive to the impact of a test deviation than larger horsepower in the high-speed section.
Thus, third-party verification of the road load specifications provided by the manufacturer by comparing energy differences based on the criteria for determining road load tolerance considering the fuel economy test mode will require thorough consideration before deciding to use comparisons at a specific speed point and making decisions on the range of tolerance.
Table 13 shows the ANOVA results as set out in Section 3.3 to identify key factors that affect the road load correlation among test bodies by using road load horsepower calculated for the three speed points of 20 km/h, 65 km/h, and 110 km/h representative of the low-, medium-, and high-speed sections, respectively.

5. Conclusions

For the speed representing the medium-speed section and the speed representing the high-speed section, the test site was found to be the only significant factor, as in the results derived from the FTP-75 and HWFET modes, and for the speed representing the low-speed section, no key factor was found to have a significant difference at the 95% confidence interval. This can be attributed to the fact that road load horsepower has a relatively large deviation in the low-speed section.
In this study, we calculated road load by identifying the test site, test driver and test devices as key factors, which can be changed depending on who performs the road load correlation test, and performing coastdown testing according to the order of orthogonal array based on DOE full factorial design. For the statistical analysis of the results, we reviewed the criteria for determining the energy-based road load correlation and analyzed key factors that may affect the road load correlation among different test bodies to conclude the following:
(1)
Review of five criteria for the determination of road load correlation reveals that energy deviation occurred at a minimum of 10.8% to a maximum of 14.9% and that energy loss depends on which criteria are applied.
(2)
A comparison of the energy loss calculated considering the fuel economy mode and that calculated by using constants derived from road load coefficients reveals that the losses are almost the same, with the difference being 0.1% in the FTP-75 mode and 0.0% in the HWFET mode.
(3)
The constants derived from the road load coefficients f0 (N), f1 (N/km), and f2 (N/km2) are 17.4 km, 944.5 km2/h, and 58,910.7 km3/h2 in FTP-75 mode and 16.5 km, 1338.1 km2/h, and 110,677.6 km3/h2 in HWFET mode, respectively.
(4)
Statistical analysis using energy losses calculated considering the fuel economy test modes reveals that the test site is the only key factor that has an impact on the road load correlation for the tested vehicle in this study, and energy losses analysis for each run order in the FTP-75 mode reveals that road condition of test site A is better than that of test site B.
(5)
In the distribution of relative sizes of road load horsepower, the difference between the maximum and minimum was approximately 8.2% at 20 km/h, which is indicative of the low-speed section and is relatively large compared with its counterparts in the medium- and high-speed sections that range from 3.3% to 3.7%.
(6)
ANOVA was conducted to identify key factors that affect the road load correlation among test bodies by using the road load horsepower calculated for the three speed points of 20 km/h, 65 km/h, and 110 km/h representing the low-, medium-, and high-speed sections, respectively, reveals that the test site is the only significant key factor at the speeds representing medium- and high-speed sections, whereas no key factor having any significant difference could be found for the speed representing the low-speed section at a 95% confidence interval for the tested vehicle in this study.
(7)
Procedures were developed for analyzing key factors that have an impact on the road load correlation by means of testing the road load correlation among test bodies, and the method of using constants derived from road load coefficients considering the fuel economy test mode was devised for use by a third party during the verification of road load specifications provided by the manufacturer.

Acknowlegments

This study was funded by the 2014 R&D Project for Land and Transportation Technologies under the Ministry of Land, Infrastructure and Transportation.

Author Contributions

All of the authors contributed to this work. Charyung Kim and Hyunwoo Lee performed a vehicle experiment for the determination of the road load and correlation tests and also wrote the major part of this article. Youngsung Park, project manager, analyzed the statistical calculation on the experimental data. Cha-Lee Myung analyzed the road load coefficient over FTP-75 and HWFET modes. Professor Simsoo Park provided the academic advice for the statistical correlations on all equations.

Conflicts of Interest

The authors declare no conflict of interest.

References

  1. Dings, J. How Clean are Europe’s Cars. An Analysis of Carmaker Progress towards EU CO2 Targets in 2014; European Federation for Transport and Environment (T&E): Brussels, Belgium, 2015. [Google Scholar]
  2. Kasab, J.J.; Velliyiur, S.; Shepard, D.; Casadei, A.; Huang, H.; Brandao, F. Project Report: Analysis of Greenhouse Gas Emission Reduction Potential of Light Duty Vehicle Technologies in the European Union for 2020–2025; International Council on Clean Transportation: Van Buren, MI, USA, 2012. [Google Scholar]
  3. Kadijk, G.; Verbeek, R.; Smokers, R.; Spreen, J.; Patuleia, A.; Van Ras, M. Supporting Analysis Regarding Test Procedure Flexibilities and Technology Deployment for Review of the Light Duty Vehicle CO2 Regulations; European Commission: Brussel, Belgium, 2012. [Google Scholar]
  4. Guan, D.; Yam, L.; Zhang, A.; Shang, J. Modeling of tire rolling properties by using experimental modal parameters. SAE Tech. Pap. 2000. [Google Scholar] [CrossRef]
  5. Motor Vehicle Road Load-Determination under Reference Atmospheric Conditions and Reproduction on Chassis Dynamometer; ISO 10521:1992; International Organization for Standardization: Geneva, Switzerland, 1992.
  6. White, R.A.; Korst, H.H. The determination of vehicle drag contributions from coast-down tests. SAE Tech. Pap. 1972. [Google Scholar] [CrossRef]
  7. Yasin, T.P. The analytical basis of automobile coastdown testing. SAE Tech. Pap. 1978. [Google Scholar] [CrossRef]
  8. Chapin, C. Road Load Measurement and Dynamometer Simulation Using Coastdown Techniques. SAE Tech. Pap. 1981. [Google Scholar] [CrossRef]
  9. Engineers, S.O.A. Road Load Measurement Using Onboard Anemometry and Coastdown Techniques: SAE J2263 DEC2008; SAE Technical Paper; Society of Automotive Engineers: Warrendale, PA, USA, 2008. [Google Scholar]
  10. Schmidt, H.; Johannsen, R. Future Development of the EU Directive for Measuring the CO2 Emissions of Passenger Cars—Investigation of the Influence of Different Parameters and the Improvement of Measurement Accuracy; Technischer Überwachungseverein Nord: Hanover, Germany, 2010. [Google Scholar]
  11. Kadijk, G.; Ligterink, N. Road Load Determination of Passenger Cars; Toegepast Natuurwetenschappelijk Onderzoek: Delft, The Netherlands, 2012. [Google Scholar]
  12. Fontaras, G.; Kouridis, H.; Samaras, Z.; Elst, D.; Gense, R. Use of a vehicle-modelling tool for predicting CO2 emissions in the framework of European regulations for light goods vehicles. Atmos. Environ. 2007, 41, 3009–3021. [Google Scholar] [CrossRef]
  13. Fontaras, G.; Samaras, Z. On the way to 130g CO2/km—Estimating the future characteristics of the average European passenger car. Energy Policy 2010, 38, 1826–1833. [Google Scholar] [CrossRef]
  14. Mellios, G.; Hausberger, S.; Keller, M.; Samaras, C.; Ntziachristos, L.; Dilara, P.; Fontaras, G. Parameterisation of Fuel Consumption and CO2 Emissions of Passenger Cars and Light Commercial Vehicles for Modelling Purposes; European Commission Joint Research Centre Institute for Energy and Transport: Ispra, Italy, 2011. [Google Scholar] [CrossRef]
  15. Hausberger, S. Fuel Consumption and Emissions of Modern Passenger Cars; Graz University of Technology: Graz, Austria, 2010. [Google Scholar]
  16. Myung, C.L.; Ko, A.; Lim, Y.; Kim, S.; Lee, J.; Choi, K.; Park, S. Mobile source air toxic emissions from direct injection spark ignition gasoline and LPG passenger car under various in-use vehicle driving modes in Korea. Fuel Process. Technol. 2014, 119, 19–31. [Google Scholar] [CrossRef]
  17. Park, S.; Myung, C.L.; Kim, W.; Lee, K.; Lee, Y. Next Generation Vehicle Activity in Korea. In Proceedings of the World Engineering Conference and Convention 2015, Kyoto, Japan, 29 November–2 December 2015.
  18. Ligterink, N.E.; Kraan, T.C.; Eijk, A.R.A. Dependence on technology, drivers, roads, and congestion of real-world vehicle fuel consumption. In Proceedings of the Driving the Green Agenda on Sustainable Vehicle Technologies, Gaydon, UK, 14–15 November 2012.
  19. Mock, P.; German, J. The future of vehicle emissions testing and compliance. In Proceedings of the International Council on Clean Transportation Europe, Berlin, Germany, 23 November 2015.
  20. Tietge, U.; Zacharof, N.; Mock, P.; Franco, V.; German, J.; Bandivadekar, A.; Lambrecht, U. From Laboratory to Road: A 2015 Update of Official and “Real-World” Fuel Consumption and CO2 Values for Passenger Cars in Europe; ICCT White Paper; International Council on Clean Transportation Europe: Berlin, Germany, 24 September 2015. [Google Scholar]
  21. Brace, C.J.; Burke, R.; Moffa, J. Increasing accuracy and repeatability of fuel consumption measurement in chassis dynamometer testing. Proc. Inst. Mech. Eng. D J. Automob. Eng. 2009, 223, 1163–1177. [Google Scholar] [CrossRef] [Green Version]
  22. Burton, J.; Walkowicz, K.; Sindler, P.; Duran, A. In-use and vehicle dynamometer evaluation and comparison of class 7 hybrid electric and conventional diesel delivery trucks. SAE Tech. Pap. 2013, 6, 545–554. [Google Scholar] [CrossRef]
  23. Stichter, J.S. Investigation of Vehicle and Driver Aggressivity and Relation to Fuel Economy Testing. Master’s Thesis, University of Iowa, Iowa, IA, USA, 2012. [Google Scholar]
  24. Kühlwein, J. The Impact of Offical Versus Real-World Road Loads on CO2 Emissions and Fuel Consumption of European Passenger Cars; ICCT White Paper; International Council on Clean Transportation Europe: Berlin, Germany, 9 May 2016. [Google Scholar]
  25. Riemersma, I.; Mock, P. Influence of Rolling Resistance on CO2; ICCT Working Paper; International Council on Clean Transportation Europe: Berlin, Germany, 9 November 2012. [Google Scholar]
  26. Hur, N.K.; Ahn, I.K.; Petrushov, V. High-accuracy coastdown test method by distance-time measurement: I. Theoretical background and discussions on accuracy improvement. Trans. Korean Soc. Automot. Eng. 1995, 3, 51–61. [Google Scholar]
  27. Hur, N.K.; Ahn, I.K.; Petrushov, V. High-accuracy coastdown test method by distance-time measurement: II. Development of a short distance method and its evaluation. Trans. Korean Soc. Automot. Eng. 1995, 3, 1–8. [Google Scholar]
  28. Han, T.; Kim, Y. Aerodynamic shape improvement based on surface pressure gradients in the stream-wise and the transverse directions. SAE Tech. Pap. 2010. [Google Scholar] [CrossRef]
  29. Byron, B. Determination and Use of Vehicle Road-Load Force and Dynamometer Settings, 2015. Available online: https://iaspub.epa.gov/otaqpub/display_file.jsp?docid=34102&flag=1 (accessed on 23 February 2015).
  30. Proposal for amendments to global technical regulation No. 15 on worldwide harmonized light vehicles test procedure (WLTP). In Proceedings of the 72nd Session Economic Commission for Europe on World Forum for Harmonization of Vehicle Regulations, Geneva, Switzerland, 12–15 January 2016.
  31. Infrastructure and Transport: Regulation for Test Procedures for Energy Efficiency, Greenhouse Gas Emissions and Fuel Economy for Motor Vehicles; Ministry of Land, Infrastructure and Transport: Sejong-si, Korea, 2015.
  32. Kim, S.; Shin, S.-K.; Kim, K.-Y. Study on the Vehicle Road-Load Affecting Factors. In Proceedings of the KSAE 30th Anniversary Conference, Seoul, Korea, 22–24 April 2008; pp. 803–809.
  33. Buckley, F.T. ABCD—An improved coast down test and analysis method. SAE Tech. Pap. 1995. [Google Scholar] [CrossRef]
  34. Oh, Y.; Park, S. Modeling and parametrerization of fuel economy in heavy-duty vehicles (HDVs). Energies 2014, 7, 5177–5200. [Google Scholar] [CrossRef]
  35. Ben-Chaim, M.; Shmering, E.; Kuperman, A. Analytic modeling of vehicle fuel consumption. Energies 2013, 6, 117–127. [Google Scholar] [CrossRef]
  36. Design of Experiments; Educational Paper; Eretec Inc.: Gunpo-si, Korea, 2014.
Figure 1. Calculation procedure of energy loss.
Energies 09 00575 g001
Figure 2. Measurement device configuration for coastdown.
Energies 09 00575 g002
Figure 3. Design procedure of significant factor distinction. ANOVA: analysis of variance.
Energies 09 00575 g003
Figure 4. Road load graph from 15 km/h to 115 km/h.
Energies 09 00575 g004
Figure 5. Energy loss and difference graph over FTP-75 test cycle.
Energies 09 00575 g005
Figure 6. Pareto chart with main factors and two-way interactions.
Energies 09 00575 g006
Figure 7. Pareto chart with only main factors.
Energies 09 00575 g007
Figure 8. Main effects plot for the FTP-75 test cycle.
Energies 09 00575 g008
Figure 9. Relative scale compared with the average value in each road load condition.
Energies 09 00575 g009
Figure 10. Results of min–max difference (%) in each speed condition.
Energies 09 00575 g010
Table 1. Evaluation criteria of road load tolerance. RLHP: road load horsepower.
No.Evaluation CriteriaRemark
1Energy loss difference considering the fuel economy test cycle (individual)-
2Energy loss difference considering the fuel economy test cycle (combined)-
3Road load force difference considering the coastdown speed range15–115 km/h
4RLHP difference at 50 mph-
5Each road load coefficient difference (f0, f2)-
Table 2. Calculation example for the evaluation criteria of road load tolerance. FTP-75: federal test procedure 75; and HWFET: highway fuel economy test.
Evaluation CriteriaBrief DescriptionCalculation Result Over Target Road Load Coefficient (A)Calculation Result Over Confirmed Road Load Coefficient (B)Road Load Difference (%) ((BA)/A × 100)Remarks
Target Road Load CoefficientConfirmed Road Load Coefficient
Coefficientsf0 (N)120.1155.7----
f1 (N/(km/h))0.6360.691
f2 (N/(km/h)2)0.03090.0309
1. Energy loss difference (individual)FTP-75 test cycle4505.7 (kJ)5175.6 (kJ)14.9Most important criterion
HWFET test cycle6251.1 (kJ)6911.6 (kJ)10.6
2. Energy loss difference (combined)0.55 × FTP-75 energy loss + 0.45 × HWFET energy loss5291.1 (kJ)5956.8 (kJ)12.6-
3. Road load force difference (15–115 km/h)Averaged road load force for 21 points considering coastdown speed range6726.7 (N)7549.3 (N)12.2-
4. RLHP diference at 50 mph (EPA)RLHP at 50 mph8.3 (kW)9.2 (kW)10.8-
5. Each road load coefficient differencef0 coefficient120.1 (N)155.7 (N)26-
f2 coefficient0.0309 (N/(km/h)2)0.0309 (N/(km/h)2)0
Table 3. Constant of road load coefficients.
Test ModeAf0 (km)Bf1 (km2/h)Cf2 (km3/h2)
FTP-7517.4944.558,910.7
HWFET16.51338.1110,677.6
Table 4. Energy loss comparison for the derived constant.
Energy Loss1st Criterion of Table 2Derived Constant Criterion
TargetConfirmedTargetConfirmed
EFTP-75 (kJ)4505.75175.64510.8 (0.1%)5182.2 (0.1%)
EHWFET (kJ)6251.16911.66252.6 (0.0%)6913.6 (0.0%)
Table 5. Specifications of the test engine and vehicle. CW: curb weight; and ETW: equivalent test weight.
TypeItemsSpecifications
VehicleWeight (CW/ETW)1575/1701 kg
GearboxSix-speed auto
Model year2015
Length and height (mm)4920/1470
Tire specification225/55R17
EngineCylinder number/Displacement4/2359 cc
Rated power/Engine speed190 ps/6000 rpm
FuelGasoline
Table 6. Design variables.
VariablesIndexLevel 1Level 2
Test siteX1AB
Test driverX2AB
Test deviceX3AB
Energy lossY (E = Fr × Vt × T)
Table 7. Orthogonal array L8 (23) based on design of experiment (DOE) full factorial design.
Run OrderX1X2X3YFTP-75 (E)YHWFET (E)
1111EF1EH1
2211EF2EH2
3121EF3EH3
4221EF4EH4
5112EF5EH5
6212EF6EH6
7122EF7EH7
8222EF8EH8
Table 8. Results of the road load correlation test program, corresponding to data as represented in Figure 4. Diff.: difference.
Run OrderX1X2X3Road Load CoefficientsFTP-75 Test CycleHWFET Test Cycle
f0 (N)f1 (N/(km/h))f2 (N/(km/h)2)EFTP-75 (kJ)Diff. (%)EHWFET (kJ)Diff. (%)
1111143.460.597760.0298714814.4−1.66471.1−1.9
2211147.240.575830.0315124956.01.36685.71.4
3121143.460.570220.0302944813.2−1.66481.0−1.7
4221146.570.703020.0299574972.91.66672.81.2
5112135.010.914710.0283214875.8−0.46584.4−0.2
6212137.350.900980.0291234950.71.26693.41.5
7122139.130.587200.0309724794.2−2.06507.6−1.3
8222158.540.250510.0335704966.21.56664.61.1
Average (1–8)143.840.637530.0304534892.9-6595.1-
Table 9. ANOVA result including two-way and three-way interactions. DF: degree of freedom; SS: sum of squares; MS: mean square; F: F-ratio; p: p-value.
SourceDFSSMSFp
X1137,565.437,565.4**
X21317.5317.5**
X31115.5115.5**
X1 × X211658.91658.9**
X1 × X31369.9369.9**
X2 × X31836.4836.4**
X1 × X2 × X31780.1780.1**
Table 10. ANOVA results including only two-way interactions.
SourceDFSSMSFp
X1137,565.437,565.448.150.091
X21317.5317.50.410.638
X31115.5115.50.150.766
X1 × X211658.91658.92.130.383
X1 × X31369.9369.90.470.616
X2 × X31836.4836.41.070.489
Table 11. ANOVA results with only main factors in the FTP-75 mode.
SourceDFSSMSFp
X1137,565.437,565.441.220.003
X21317.5317.50.350.587
X31115.5115.50.130.740
Table 12. ANOVA results with only main factors in HWFET mode.
SourceDFSSMSFp
X1156,51556,51550.390.002
X21147414741.310.315
X31242924292.170.215
Table 13. ANOVA result with only main factors at three speed points.
SpeedSourceDFSSMSFp
20 km/hX110.00255970.00255977.310.054
X210.00034450.00034450.980.377
X310.00015930.00015930.450.537
65 km/hX110.04422340.044223428.090.006
X210.00213200.00213201.350.309
X310.00072960.00072960.460.533
110 km/hX110.4091510.40915147.310.002
X210.0000050.0000050.000.982
X310.0310500.0310503.590.131

