1. Introduction
Concentrated Solar Power (CSP) uses lenses or mirrors to generate heat from solar radiation, which is then employed to drive a conventional thermodynamic cycle for power generation. At present, over 90% of the CSP capacity installed worldwide is located in two countries: Spain and the USA. In 2015, Spain accumulated around 2300 MWe in the form of 50 commercial power plants ranging in size between 10 and 50 MWe. Forty-five of these plants were based on parabolic trough technology, while three plants were based on central tower technology and two more on Fresnel solar collectors. CSP power capacity in the USA reached 1600 MWe in 2014 [
1]. Additional projects totalling a further 2200 MWe have been reported to be in operation or under construction in various other countries like India, China, Chile, Australia, Mexico, the Kingdom of Saudi Arabia (KSA), Israel, Egypt, South Africa and Morocco [
2]. All these countries not only have the availability of the solar resource and extensive land areas for the installation of the solar fields in common, but also favourable national policies promoting the deployment of renewable energies [
3].
In spite of the increasing interest in CSP, these plants are still criticized for their high costs and inability to produce power on demand. To this purpose, a research project titled HYSOL (funded by the European Commission under its 7th Framework Program) is developing and testing a new hybrid configuration for CSP plants intended to achieve higher energy efficiency, reduced economic costs, and improved firmness and dispatchability in the generation of power on demand. Furthermore, HYSOL plants may operate using biomethane as auxiliary fuel, resulting in the generation of 100% renewable electricity [
4,
5].
The design and operation of HYSOL can be adapted to the requirements of the location regarding power demand profile, availability of solar resource and also availability, cost and characteristics of auxiliary fuels, which may be of fossil or renewable nature. The HYSOL concept is based on a CSP plant with Thermal Energy Storage (TES) in the form of molten salts, and may be applied both to parabolic trough or solar tower systems. The plant incorporates a Brayton cycle that operates in combination with a conventional Rankine cycle, which makes use of the thermal energy contained in the exhaust gases of the gas turbine. By doing so, the plant is able to maximize the share of electricity produced by a solar resource and also to optimize the efficiency in the transformation of the auxiliary fuel into electricity, so that power is produced in a dispatchable, firm, and efficient manner with optimized fuel consumption [
6].
Despite its renewable nature, solar power also generates environmental impacts that need to be identified, quantified and evaluated. Life Cycle Assessment (LCA) is an appropriate methodology to evaluate the environmental performance of renewable technologies, as has been proven in scientific literature [
7,
8,
9]. The environmental impacts of conventional CSP plants have been previously evaluated by the scientific community [
10,
11,
12,
13,
14,
15,
16,
17,
18,
19,
20]. These analyses are all based on LCA methodology, and evaluate the environmental performance of CSP plants of varying capacity, operating with different technologies (parabolic trough/Fresnel reflectors, central tower, Stirling dish), including specific component characteristics (air/wet cooling, thermal storage technology) and hybridization with different fuels. The influence of the geographic location of CSP plants has not been addressed, although it has a significant effect on the availability of the solar energy resource. Average annual irradiance values and its distribution over daily and seasonal periods are affected not only by the latitude and altitude of the location but also by weather conditions (atmospheric moisture, clouds, precipitations, and particulate matter). All these elements have a decisive influence on the size and design of the solar field, the thermal storage system, the capacity of the power block, and the operating hours of the installation. In turn, these items dictate the amount of electricity generated by the system, which determines its economic viability and its environmental impacts, which are calculated on the basis of its functional unit. In addition, the geographic location also has an effect on a range of other issues that may also have a notable effect on the economic and environmental performance of the system. For instance: the local capacity to fabricate the plant components (including structural elements, basic components such as mirrors, pumps or piping, and more technological elements like electronic systems); the origin of the raw materials employed to produce them; the characteristics of the electricity mix employed in the CSP plant and also for the fabrication of the plant components; the waste management options considered at the end of their useful lives (including recycling rates); the average efficiency in the transformation of primary energy to electricity, and the distances involved for the transportation of both raw materials and plant components. Geographic location may also affect the availability and transportation strategies of auxiliary fuels employed in hybrid CSP plants.
HYSOL technology claims to produce clean energy in an efficient and effective way. However, this assertion must be supported by the identification, quantification and evaluation of the environmental impacts produced during the life cycle of the technology. Therefore, the main objective of this investigation is to evaluate the environmental performance of a CSP plant based on HYSOL configuration using LCA methodology according to ISO standards and SimaPro software. This study also aims to compare the effect of using natural gas or biomethane as auxiliary fuels and to compare for the first time the environmental performance of a HYSOL CSP plant located in five countries around the world: Spain, Chile, KSA, Mexico, and South Africa. The geographic locations were selected considering technical, economic, and market information provided by promoters and engineering companies involved in the design and commercialization of this technology.
2. Materials and Methods
2.1. Description of the HYSOL Plant
The CSP plant under study is based on the HYSOL configuration developed in the European project Innovative Configuration of a Fully Renewable Hybrid CSP Plant lead by the Spanish engineering company ACS-COBRA and funded by the European Commission under its 7th Framework Programme (FP7-ENERGY-2012-1, CP 308912). The design and operating conditions of the power plant considered in this study have been modelled by IDie (Investigación, Desarrollo e innovación energética, S.L.), an engineering firm participating in the HYSOL project. Electricity generation is adapted to the Spanish electricity demand curve and amounts to 928,620 MWh/yr of gross electricity output and 797,423 MWh/yr of net electricity poured into the grid. This latter figure takes into consideration efficiency losses due to grid/plant availability and curtailment, annual degradation of components, as well as parasitic electricity consumption.
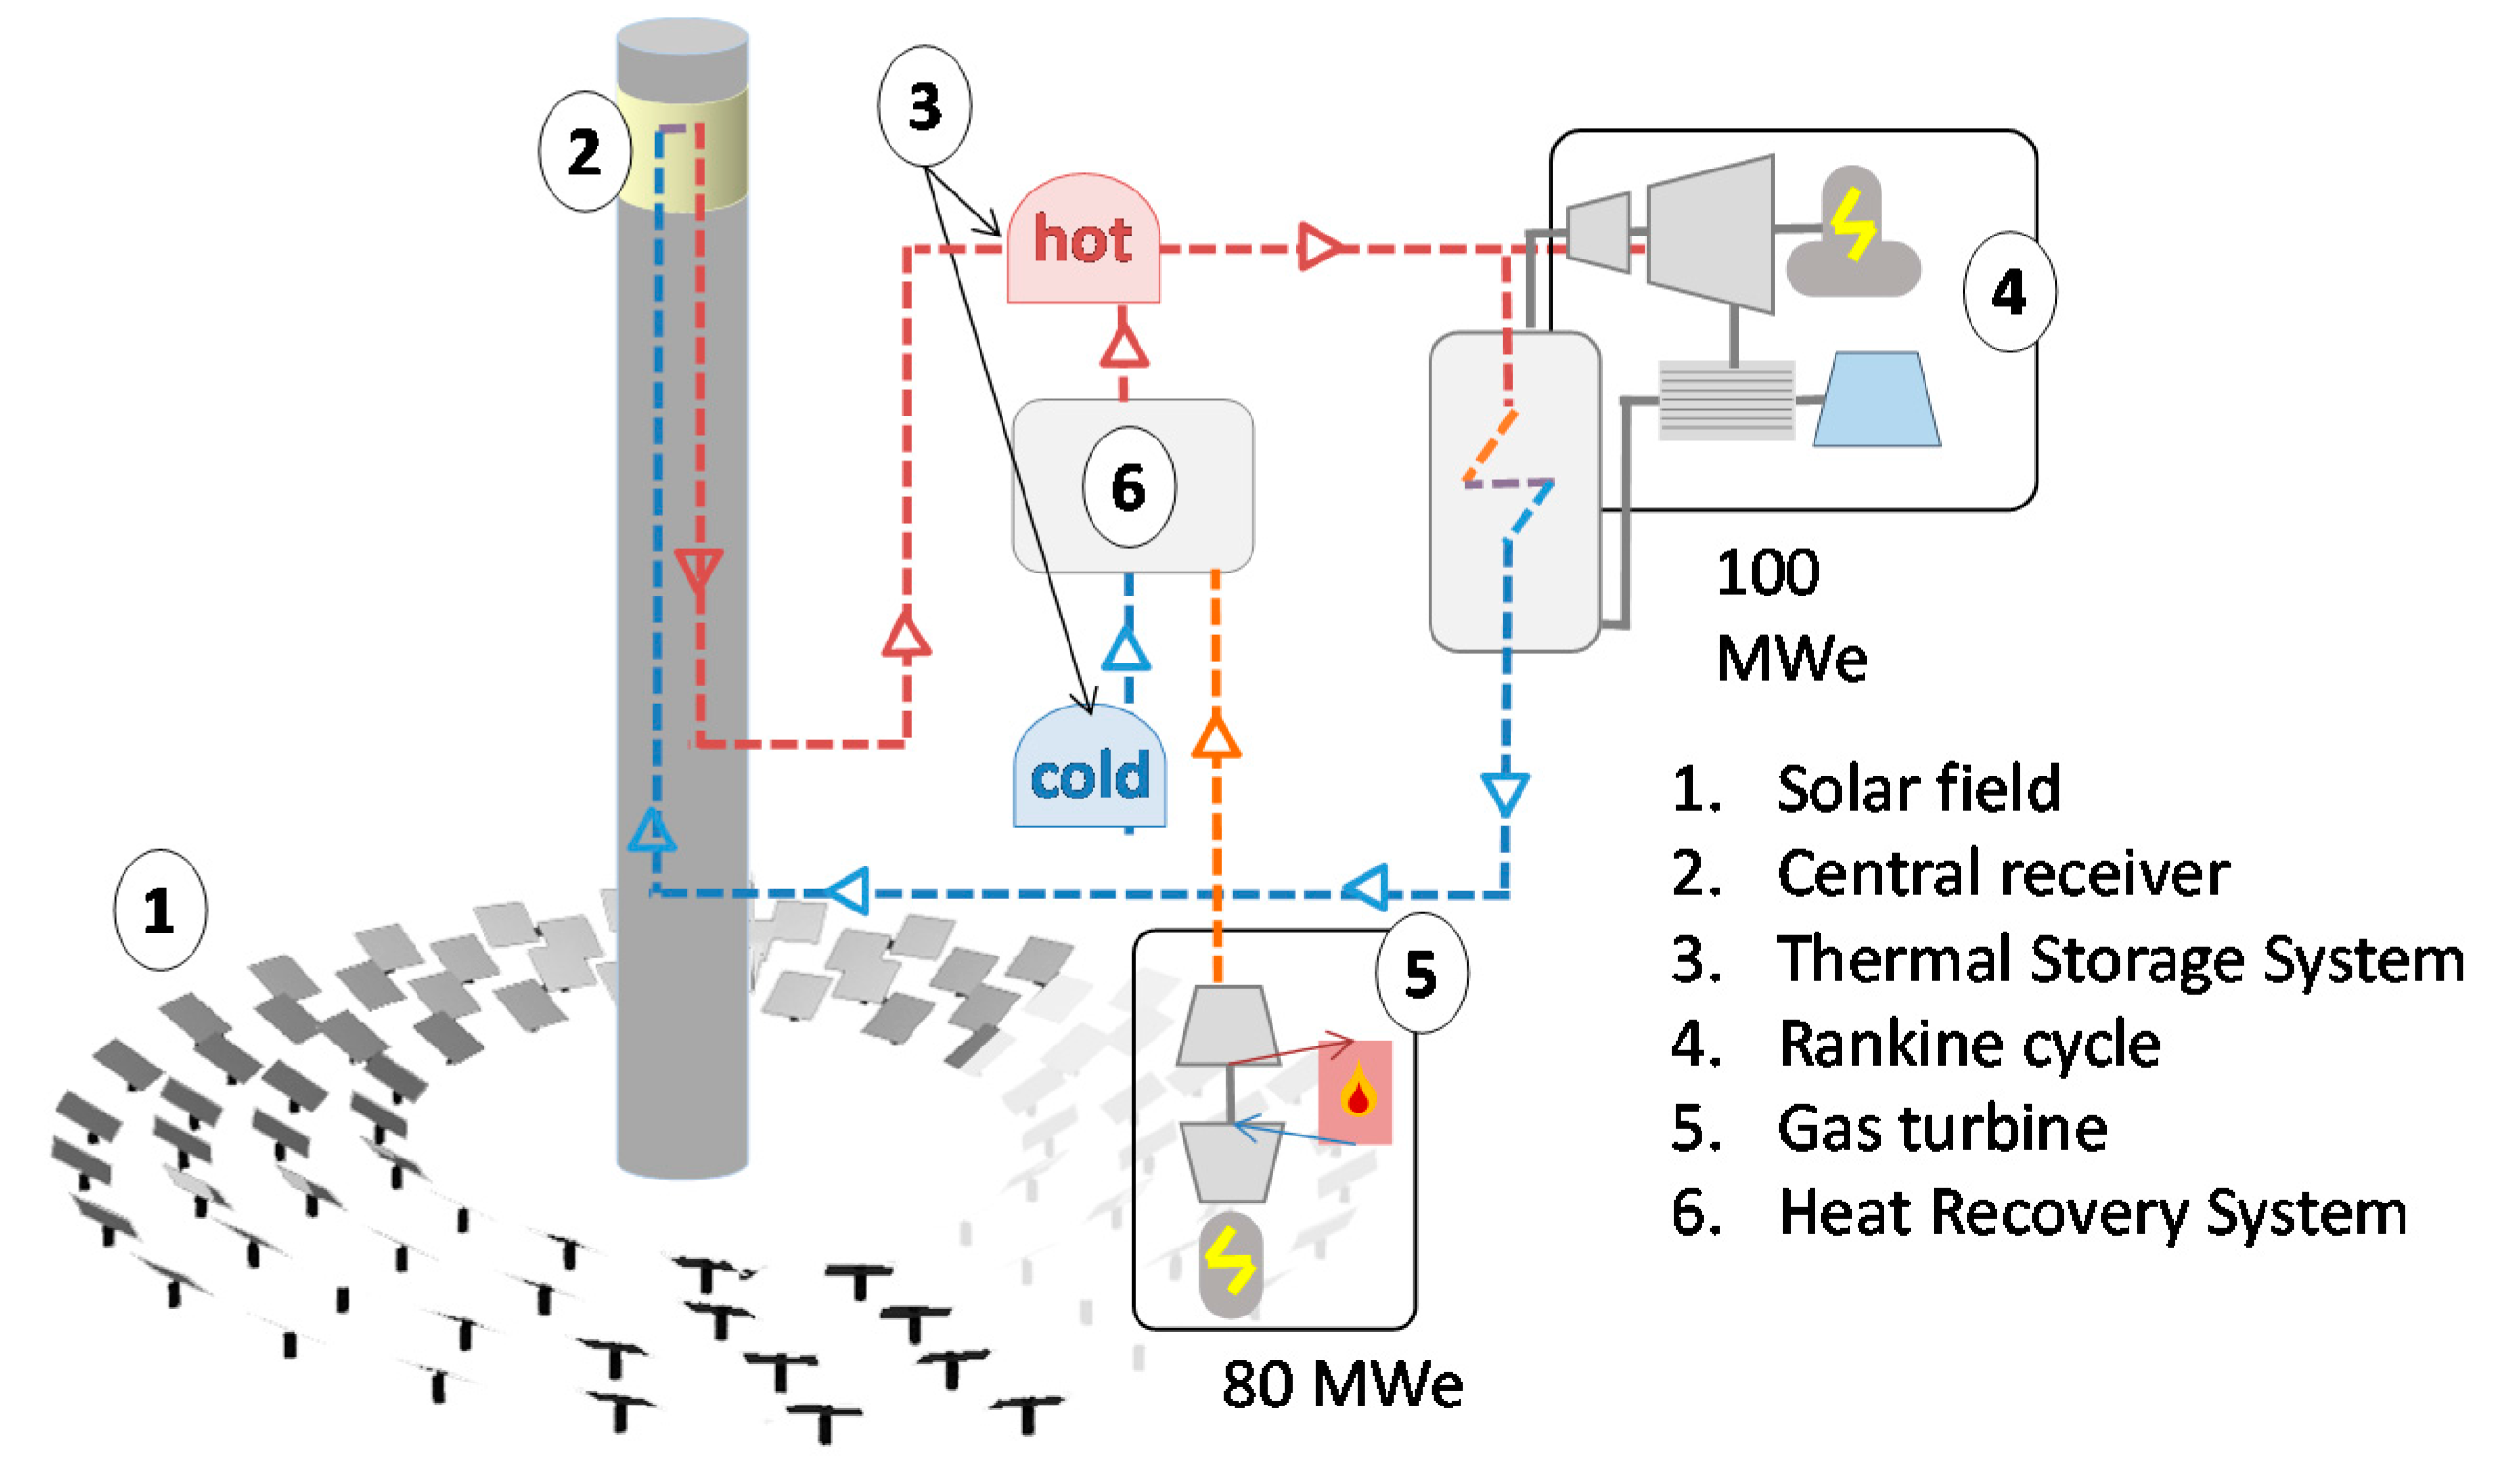
The HYSOL plant considered in this study is based on tower technology and consists of 9151 heliostats presenting a surrounding layout (number 1 in
Figure 1). The solar radiation reflected by the heliostats is directed to an external central receiver (2) increasing the thermal energy contained in a Heat Transfer Fluid (HTF). This HTF consists of binary nitrate molten salts and fulfils two objectives: transporting the heat to the steam generation system, and storing thermal energy using TES. HYSOL configuration comprises a 14 hours indirect two-tank TES (3) used to support dispatchability and increase electricity generation. The thermal energy gathered by the HTF is subsequently used to drive the thermodynamic Rankine cycle (4) based on air cooling technology for reduced water consumption (at the expense of lower electricity generation efficiencies and higher economic costs). The aero derivative gas turbine (5) consumes biomethane as auxiliary fuel and it is used to support electricity generation when thermal storage is empty or to increase electricity generation at peak-base. Exhaust gases from the gas turbine are driven to a Heat Recovery System where the HTF is reheated (6), thus improving fuel utilization efficiency and storage dispatchability. Additional characteristics of the reference HYSOL plant are described in
Table 1, under the column “Spain (Talarrubias)”.
The biomethane life cycle included in the analysis follows a “cradle to grave” approach, starting from the transport of biowaste and ending with its transportation into the natural gas grid. The processes considered include pre-treatment of biowaste, fermentation and post-fermentation, upgrading from raw biogas to biomethane, and activities associated with construction and decommission of the biomethane plant and equipment. The lifetime of the biomethane plant is assumed to be 20 years.
Biowastes used for biogas production are classified into three categories: agri-food waste (such as slaughterhouse waste and expired food), sewage sludge (from municipal waste water and dairy industry), and manure (from pig and cow). Burden allocation for the incoming biowaste was made according to the “Polluter Pays Principle” by which residues from upstream life cycles must be considered free from any environmental impacts.
Solid and liquid digestate obtained in the processing of biogas is considered to be a co-product of the biogas system and it is returned to the environment in the form of fertilizer, which is offered free of charge to local farmers. Not having economic value, the digestate can be considered as a waste of the biomethane system (the burdens associated with transportation and application of digestate were not included in the scope of the study).
2.1.1. HYSOL Plant in Different Locations
The effect of geographic location on the environmental performance of the HYSOL plant is analysed by considering four locations in addition to Spain: Chile, KSA, Mexico, and South Africa. All the HYSOL plants considered in this analysis share the same maximum distance between the tower and the furthest heliostat, set at 1500 m.
Table 1 describes the availability of solar resources in the locations considered in terms of Direct Normal Irradiation (DNI), the main characteristics of the power plant, and also the amount of electricity generated by the plant and supplied to the electricity grid in each case. In all scenarios, biomethane is assumed to be injected into the natural gas grid from various facilities located in the country.
2.1.2. HYSOL Alternative Scenarios
The environmental performance of the reference HYSOL plant was compared against two alternative scenarios: (A) Biomethane alternative modelling scenario, and (B) HYSOL configuration using natural gas as auxiliary fuel (instead of biomethane).
Scenario A contemplates an alternative modelling procedure which could affect the environmental performance of the HYSOL plant. In the base case scenario, solid and liquid digestate obtained in the processing of biowaste is returned to the environment in the form of fertilizer, which is offered to local farmers free of charge. However, following ISO 14040-14044 recommendations, digestate could also be treated as a co-product of the biomethane pathway substituting the production of synthetic fertilizers. Therefore, scenario A was modelled considering a system expansion approach where the environmental burdens associated with the production of equivalent synthetic fertilizers were deduced from those of the biomethane life cycle. The digestate fraction from sewage sludge and pig/cow manure is excluded from the system expansion, since these biowastes are also applied as fertilizers in conventional management—i.e., without biogas production. Therefore, system expansion was applied only for the digestate fraction produced from the agrifood wastes in the alternative scenario.
The use of natural gas instead of biomethane for scenario B was considered to be a likely scenario in countries where natural resources for biogas production are scarce, since the amount of biomethane required per year (3.40 × 10
9 MJ/yr) exceeds the capacity of most of the biogas facilities installed to date [
17]. Environmental impacts derived from the natural gas life cycle were determined by the Ecoinvent v.3 database, adapting the original CORES data to Spanish natural gas imports [
21] as follows: 69% of Algeria; 16% of Nigeria; 10.9% of Norway and 3.9% of Netherlands.
The power plants considered in scenarios A and B have the same characteristics and configuration as the reference plant, since the quality, heating value and efficiencies for natural gas and biomethane were considered to be the same.
2.2. Scope and Inventory
The LCA was conducted according to standard methods ISO 14040:2006 and ISO 14044: 2006. The functional unit to which all the impacts are referred to is 1 MWh of electricity poured into the grid and sold to the electricity market. The lifetime of the plant has been assumed to be 25 years. The analysis was based on a comprehensive inventory of CSP technology covering the following life cycle phases: Material extraction and manufacturing (E&M), Construction (C), Operation and maintenance (O&M), Dismantling and disposal (D&D). Ecoinvent v.3 [
22] was used to obtain generic environmental information about the following elements: processing of raw materials; manufacturing of plant components; construction activities and transport processes. The foreground inventory of the technology (processes, operation and maintenance, infrastructures, and plant components) was provided by IDie and Cobra Technology and Innovation (T&I).
The HYSOL inventory was adapted to the specific conditions of the five geographic locations considered in terms of solar resource availability, characteristics of the national electricity mix (including imports/exports), and average transportation distance of components and materials. It was assumed in all cases that the natural resources required to produce infrastructures and plant components are extracted globally while the transformation of the materials (steel, glass, and concrete) into plant components (collector, heliostats, foundations, tower,
etc.) is done in the country where the solar plant is located using the local electricity mix. An exception is made with the steam turbine and pumps, the gas turbine, and the molten salts, which were assumed to originate from Germany, Italy, and Chile, respectively. Each of these components was transported from the fabrication location by lorry and shipped to the nearest port to the CSP plant, and then by lorry from the port to the plant. Elementary water flows were assigned for each location taking into account direct water consumption during the operation and maintenance of the CSP plant, including water used for mirror washing and the Rankine cycle. The electricity mix for each of the countries considered was obtained from the Ecoinvent database v.3, except for Spain, which was updated to the official mix published for 2013. Biowaste conversion to biogas is modelled considering a system expansion approach as recommended by ISO 14040-14044. Thus, the biomethane life cycle takes into consideration savings in the emission of CH
4 and N
2O, avoiding conventional biowaste treatment (storage in an uncovered tank before field application as fertilizer), as described by Giuntoli
et al. [
23].
2.3. Impact Assessment Methods
SimaPro 8.0.3 software was used for calculations. Recipe Midpoint World (H perspective) was used for classification, characterization, and normalization of environmental impacts [
24]. The Cumulative Energy Demand (CED) v9 method [
25] was applied to determine primary energy demand for each scenario. The water stress index was calculated taking into account direct water consumption during the operation and maintenance of the CSP plant and the corresponding regional water stress index published by Pfister
et al. [
26]. The water stress index, defined as the ratio of total annual freshwater withdrawals to hydrological availability, ranges from 0 (no water stress) to 1 (extreme water stress). The Pfister
et al. method implemented in Google Earth [
27] indicated the following water stress indexes for the locations under study: Spain (Talarrubias) 0.9927; Chile (Copiapó) 1; KSA (Riad) 1; México (La Paz) 0.0106; South Africa (Upington) 0.7834.
3. Results
Table 2 shows the characterized environmental impacts of the reference HYSOL plant (which refers to the one located in Spain and is operating with biomethane as auxiliary fuel) considering the four life cycle phases considered: E&E, C, O&M, and D&D. These results have been produced considering specific operating conditions of the HYSOL plant in each location, as described in the Materials and Methods section. The selection of impact categories is based both on their environmental significance in this energy system and on international environmental concern.
Environmental impacts in the selected categories are as follows: climate change 45.9 kg CO2 eq/MWh; acidification 509 g SO2 eq/MWh; eutrophication 16.09 g P eq/MWh; human toxicity 27.5 kg 1.4-DB eq/MWh; freshwater ecotoxicity 1033 g 1.4-DB eq/MWh; marine ecotoxicity 1028 g 1.4-DB eq/MWh; water stress 0.164 m3/MWh.
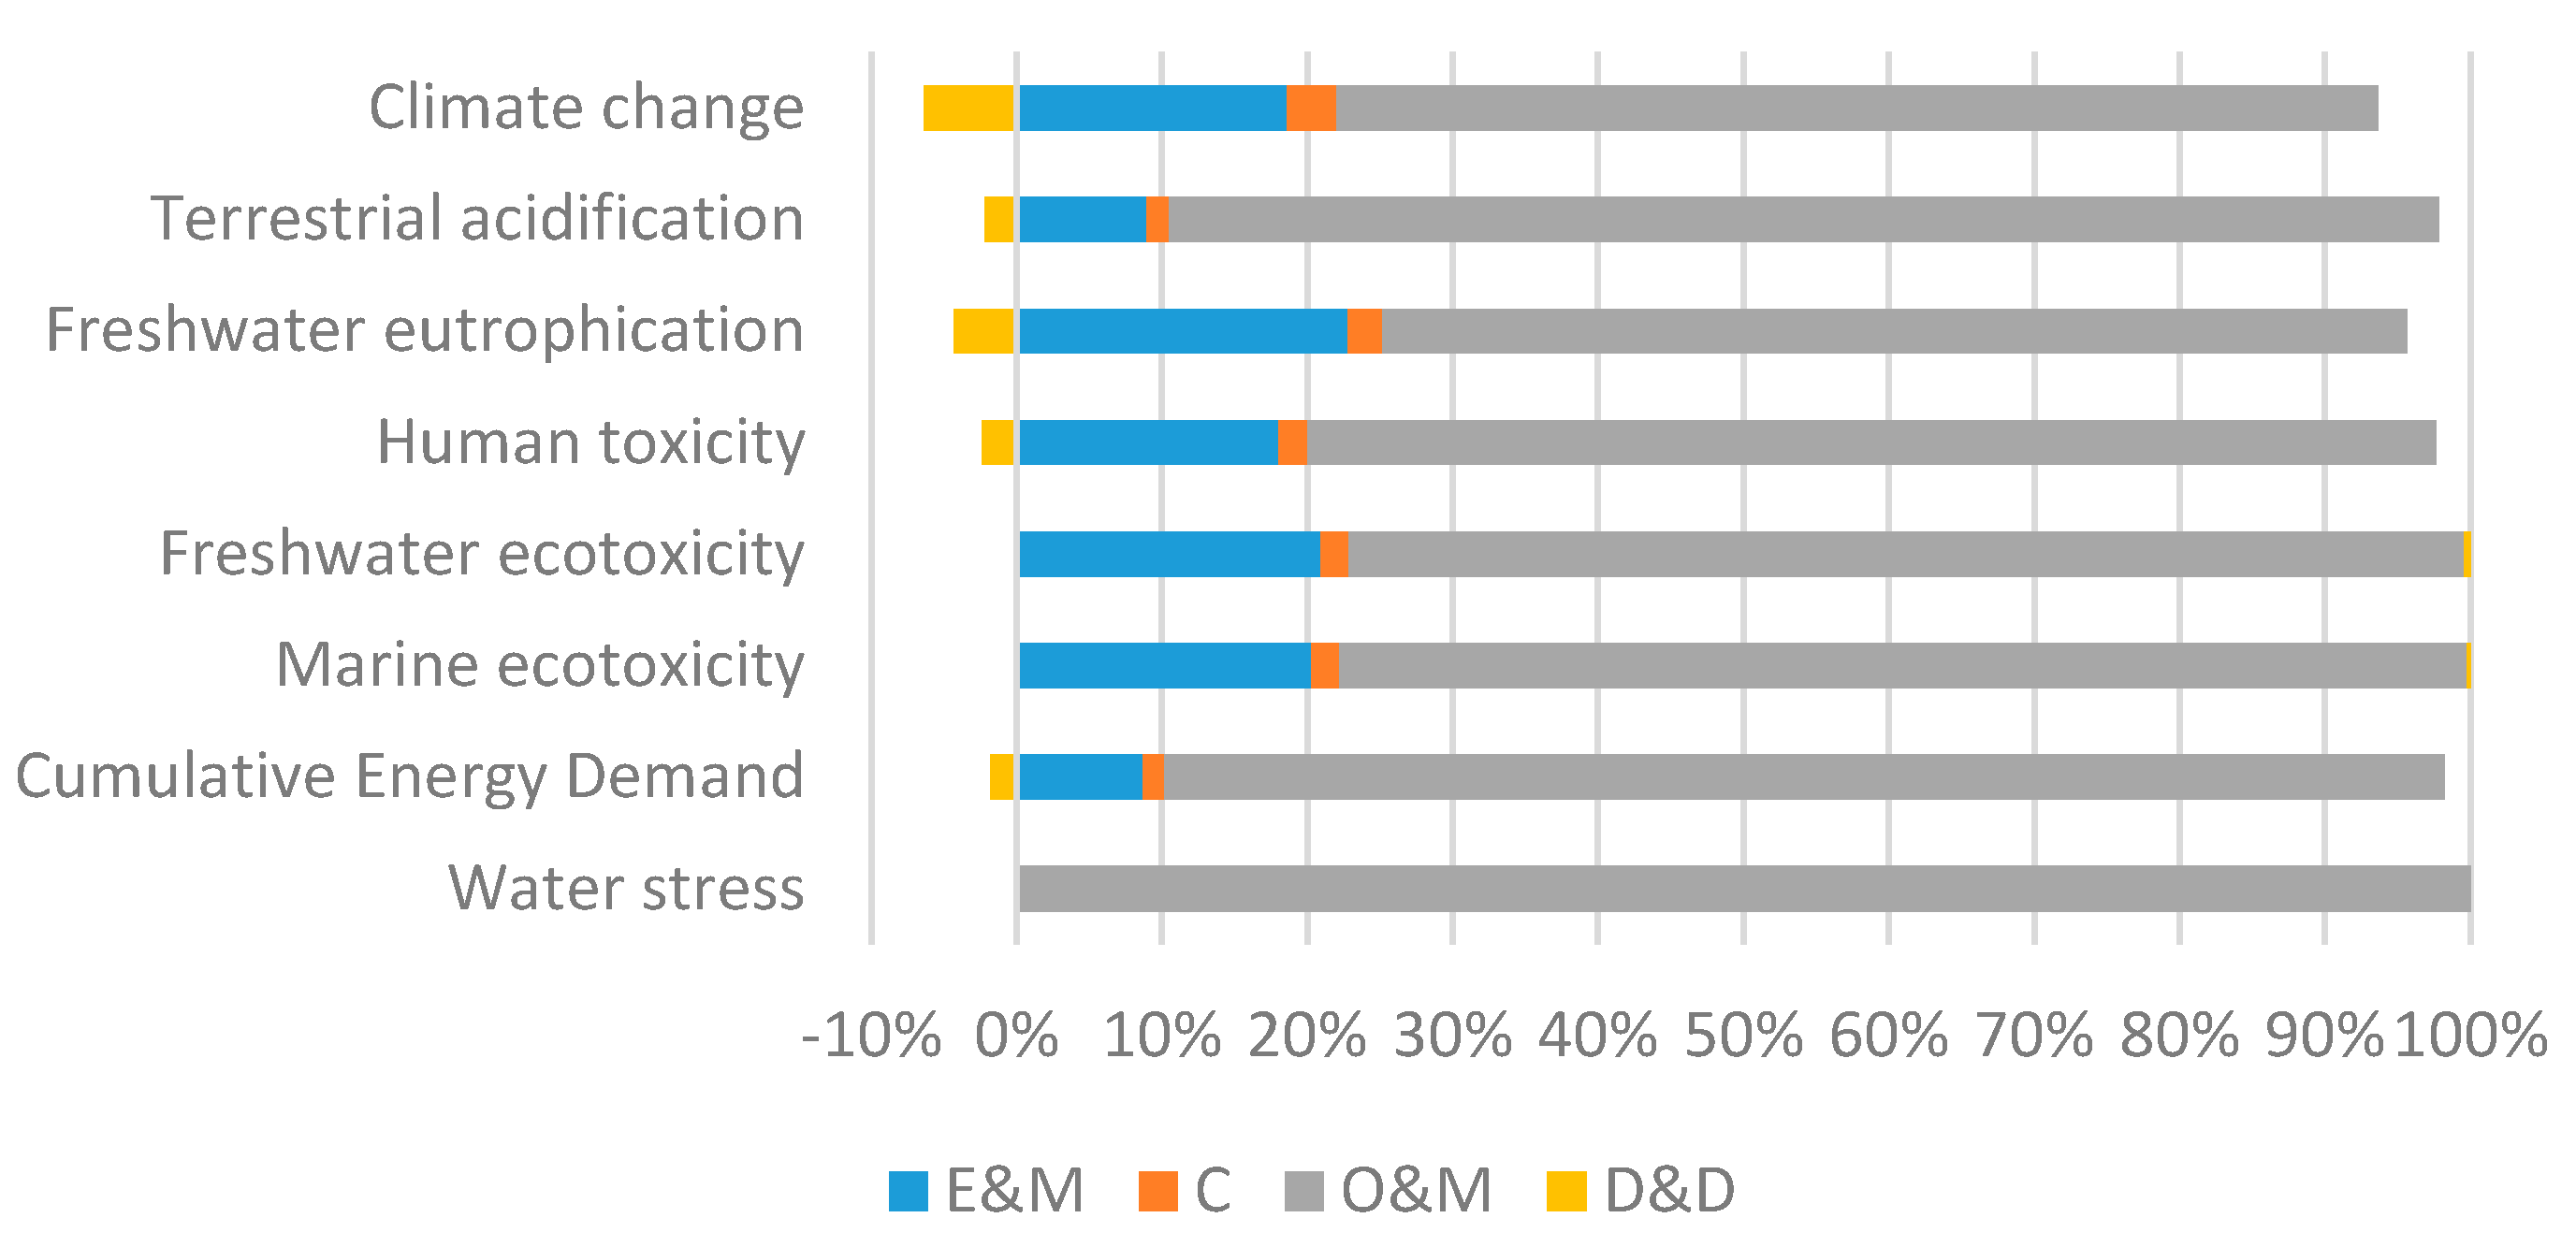
Figure 2 shows the relative contribution of each phase to the impact categories. Most of the environmental impacts of the refrence HYSOL plant are attributed to the O&M phase, since the impacts derived from the production and combustion of the auxiliary fuel (biomethane) are higher than those attributable to the manufacturing of power plant components. The results suggest that the production of biomethane represents between 69% and 92% of the life cycle environmental impact on every category, except for water stress, whose contribution is 8.4%. The highest contributions of the biomethane life cycle to the total effects were observed in the CED, human toxicity, and climate change categories (92%, 84%, and 83% respectively). Human toxicity impacts for biomethane production are mainly due to the higher electricity consumption during upgrading and biogas generation, since the disposal of mining spoils and uranium tailings (from fossil fuels contributing to the electricity mix) have emissions with high toxicity to humans. Climate change impacts from biomethane production are associated mainly with energy consumption during biogas production and CH
4 emissions during the upgrading process. Biomethane combustion in the gas turbine represents 23% of the life cycle impact on the acidification category, and less than 0.2% on the rest of the categories. This higher impact on the acidification category from biomethane combustion is associated with direct emissions of sulfur oxides during the combustion process (0.281 g SOx/GJ burned).
The CED associated with the life cycle of the reference HYSOL plant was calculated to be 1337 MJ/MWh, which means that the consumption of external energy (considering the entire life cycle of the technology) represents 35% of all the electricity poured into the grid. O&M is the most energy intensive phase (32% of the electricity poured into the grid), due mainly to the consumption of biomethane for power generation, maintenance, and start-up operations. This is followed by E&M (2.9%) due to energy use associated with extraction of raw materials involved in the construction of the plant. Consumption of external energy in the construction (C) and Dismantling and Decommissioning (D&D) phases is very limited (below 1%).
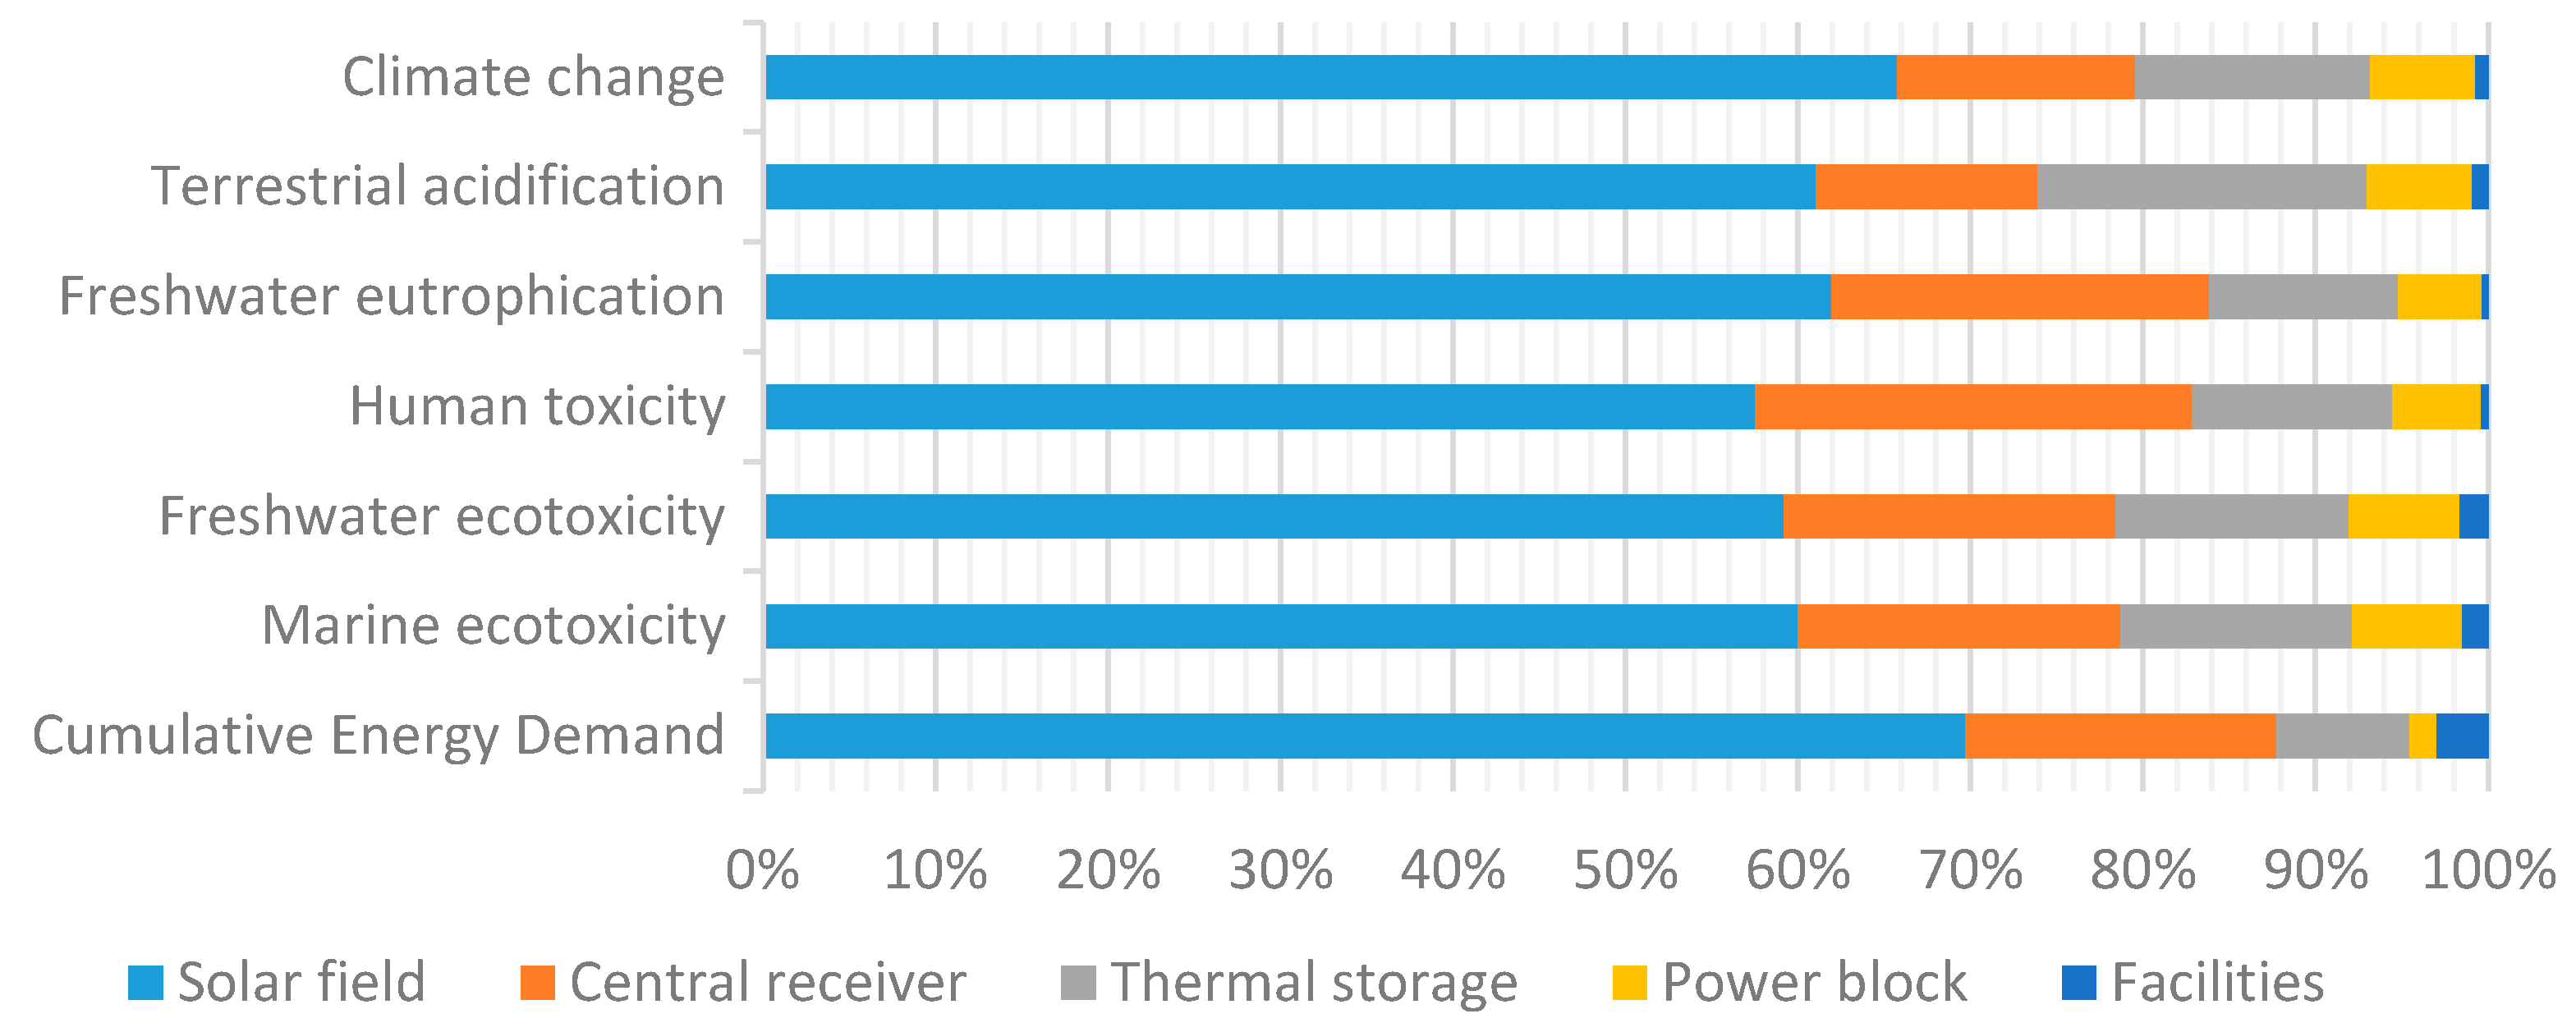
The E&M phase is the second most impacting life cycle phase.
Figure 3 shows the contribution of each sub-system of components to the E&M characterized impacts. The graph shows that the solar field is the system generating most of the environmental impacts, ranging between 68%–77% of impacts within the E&M phase (depending on the category).
The environmental impact of the solar field is produced primarily by the manufacturing of heliostats, mainly from the use of steel in the structure (24%–59% impact of manufacturing the heliostats are attributed to the manufacturing of steel and 16%–48% to steel processing). Between 9% and 22% (depending on the category) of the heliostat manufacturing impacts are associated with the manufacturing of mirrors. The following sub-system of components with the greatest impact is the TES system, mainly due to the manufacturing of nitrate salts and of steel used for the storage tanks.
Results suggest that the environmental impact associated with the construction of the Brayton cycle and the Heat Recovery System required to operate the reference HYSOL plant are negligible compared to the total life cycle impacts of the power plant. Negative emissions in the D&D phase derive from the credits associated with the recycling and waste recovery of the power plant components.
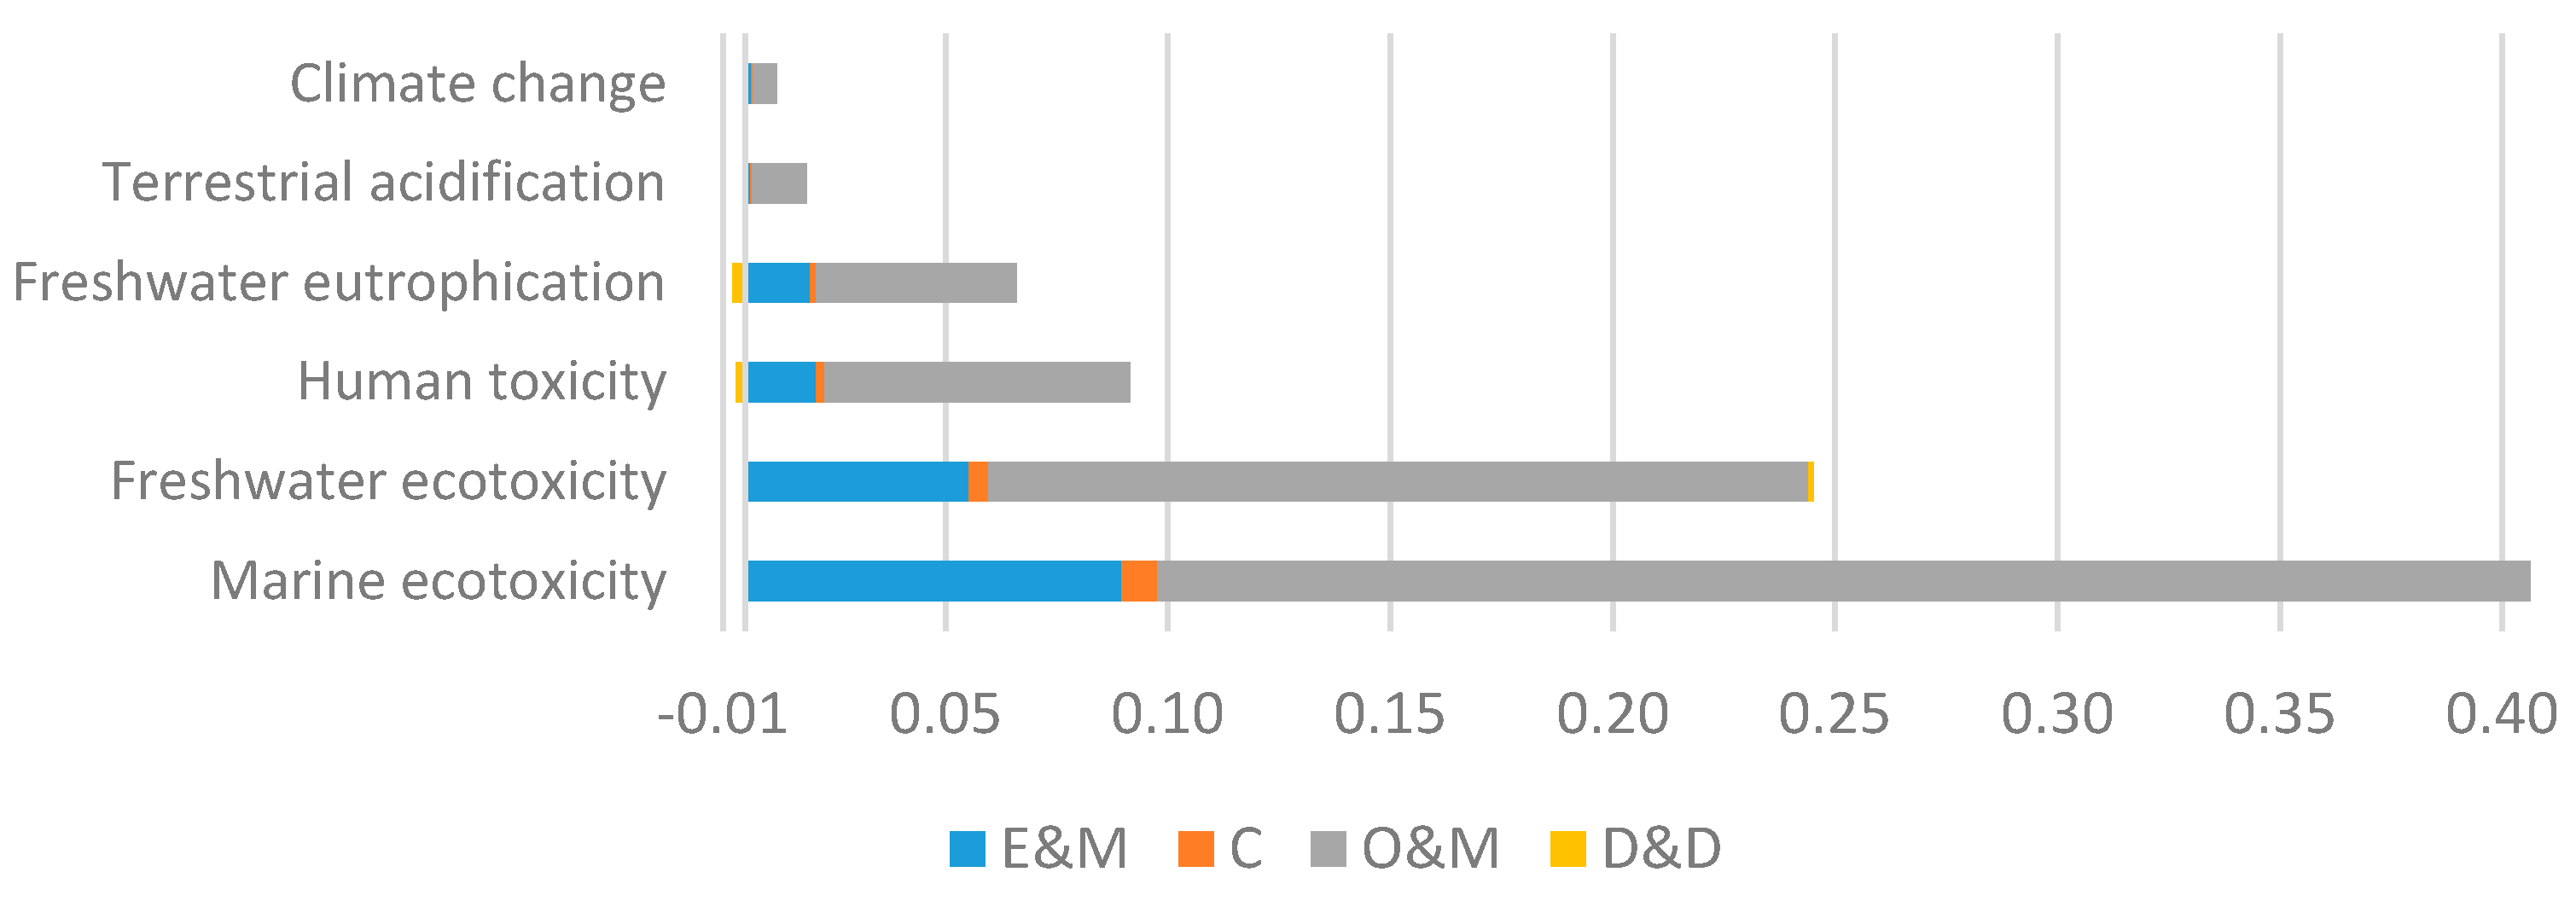
The normalized results in
Figure 4 show that the most impacted category in the O&M phase (and also in the whole life cycle) is marine ecotoxicity, followed by freshwater ecotoxicity and human toxicity. The impact on marine ecotoxicity in the E&M phase is associated primarily with the use of reinforcing steel in various elements of the plant, the utilization of copper in the TES and power block, the use of steel in the solar field, and the production of the nitrate salts. The impact on marine and freshwater ecotoxicity in the O&M phase is associated mainly with the production of biomethane (79% of the life cycle impact in the category). The normalized impacts on other environmental categories like climate change and terrestrial acidification are significantly lower.
3.1. HYSOL Configuration in Different Locations
Table 3 shows the characterized impacts of the HYSOL plant in the five locations considered: Spain (Talarrubias), Chile (Copiapó), KSA (Riad), Mexico (La Paz) and South Africa (Upington).
The characterized environmental impacts for the climate change category range between 28.8 (for Chile) and 45.9 kg CO2 eq/MWh (for Spain). The results also evidence significant differences in other environmental impact categories. According to these results, the location with the lowest environmental impacts is Chile, for every category except for water stress, whose impacts are the highest. On the contrary, Spain is the location with highest environmental impacts in all categories except for water stress, whose impacts are considerably lower than in Chile. Compared to the HYSOL plant located in Spain, the environmental impacts in Chile are 43% lower in the terrestrial acidification category, 35% lower in freshwater eutrophication, 37% lower in human toxicity, 35% lower in freshwater ecotoxicity, 36% lower in marine ecotoxicity and 43% lower in terms of Cumulative Energy Demand (CED). In contrast, savings (negative impact) of the plant located in Mexico in the water stress are more than 10 times lower than in Chile.
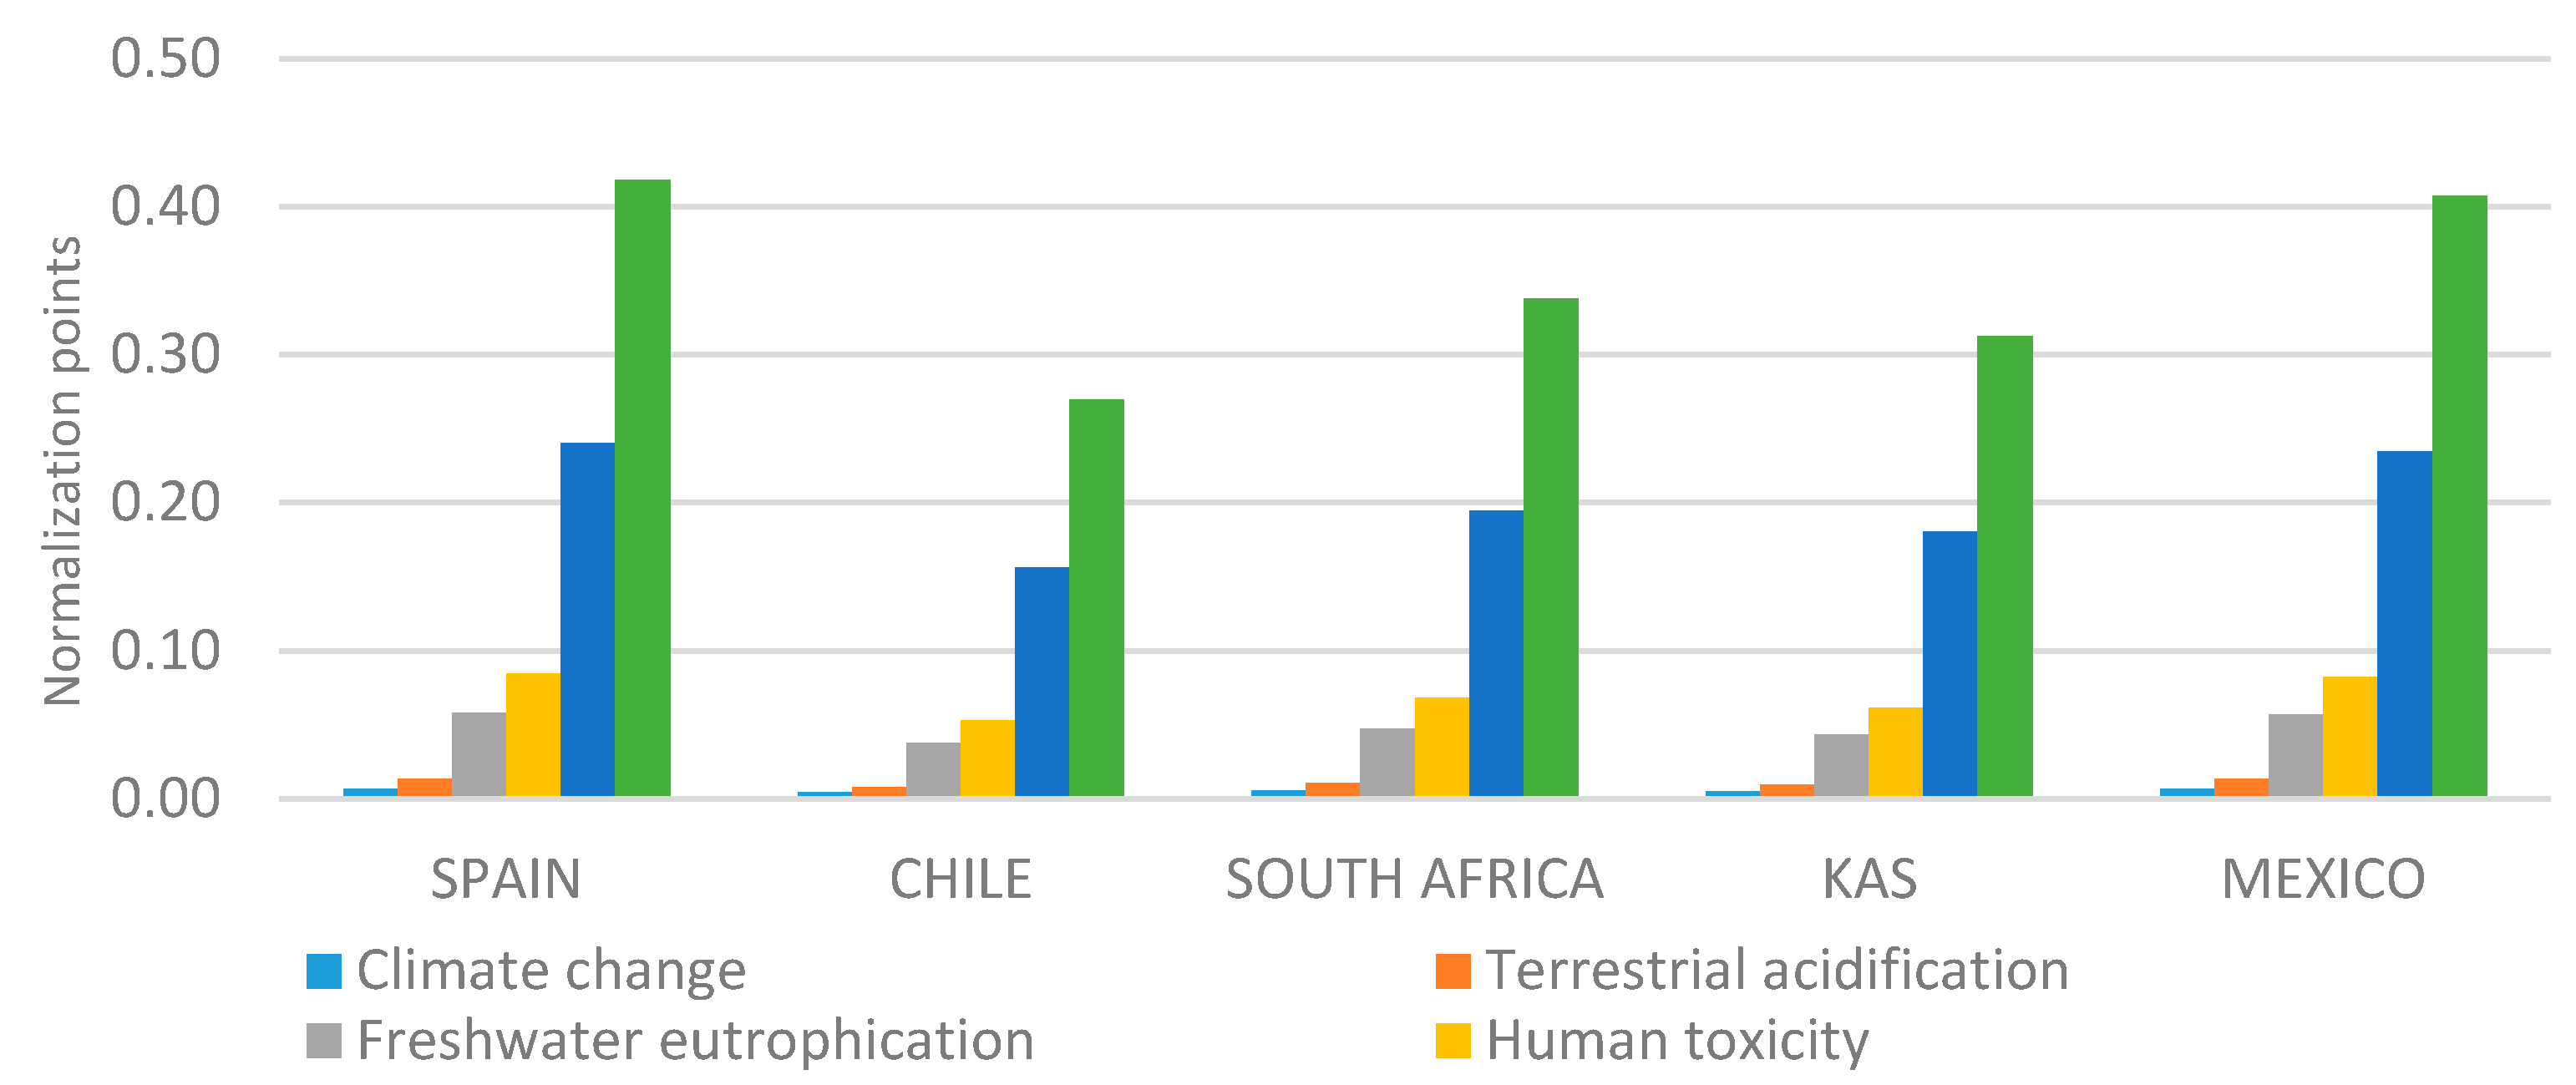
Figure 5 shows the normalization profile of the HYSOL plants in each of the locations considered. The results show that the environmental categories with the highest significance in every location are related to toxicity (especially marine ecotoxicity, but also freshwater ecotoxicity and human toxicity). These impacts are mainly associated with the production of biogas, energy use required for its upgrading into biomethane, and the manufacturing of metals (mainly steel but also aluminum) employed in the fabrication of the components and structures in the power plant.
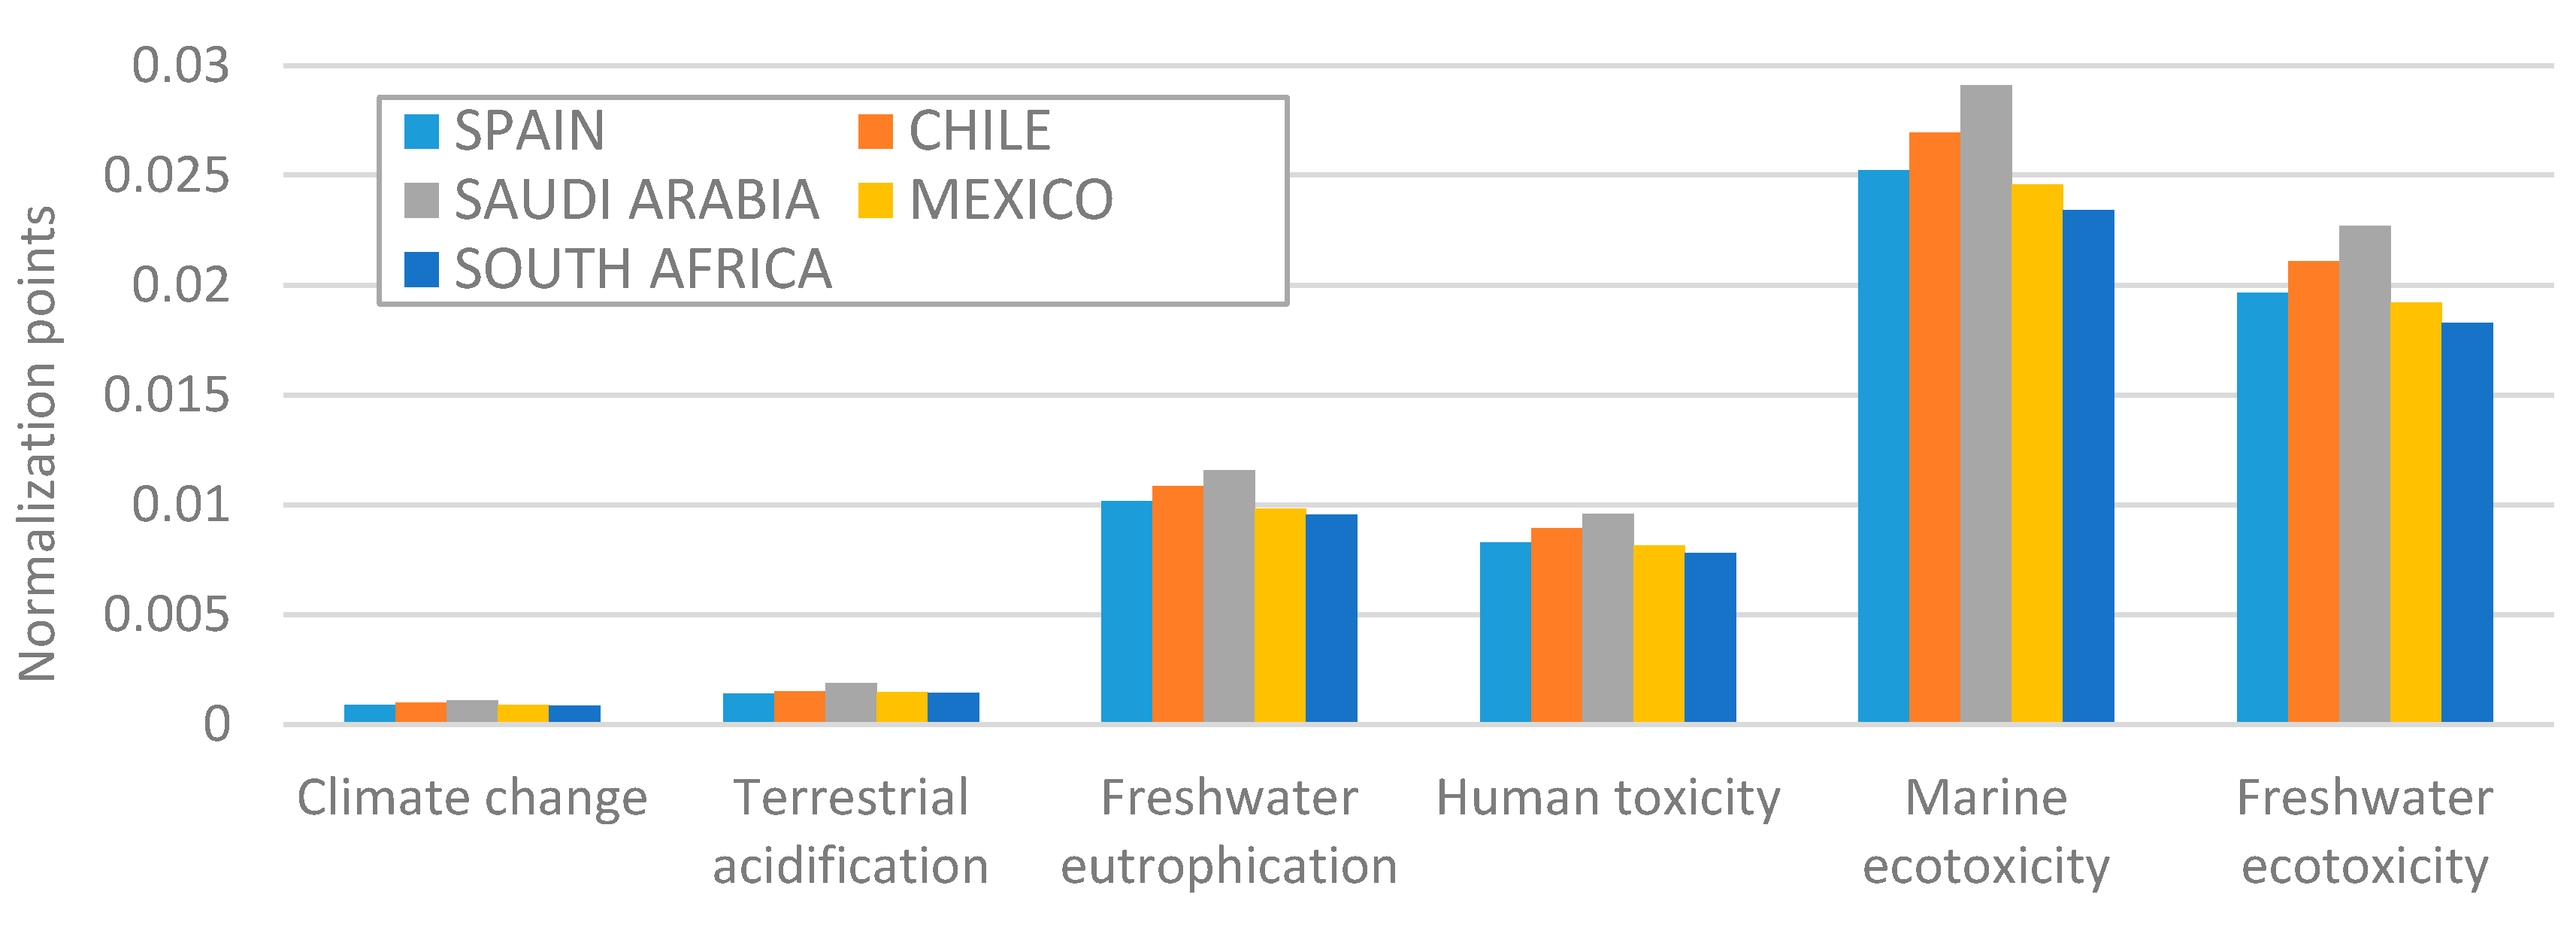
Figure 6 shows the normalization profile (per functional unit and impact category) for the E&M phase of the HYSOL plant in different locations. The location showing the highest impact values in the E&M phase in every category is KSA, due to the higher oil share in the national electricity mix (57%) and the larger number of heliostats required (determined by the solar fraction of the plant and Direct Normal Irradiation of the location). The location with the lowest E&M impacts in climate change, acidification and human toxicity is Spain, whose lower Direct Normal Irradiation (DNI) is compensated by the share of renewable energies in the electricity mix (approx. 40% renewable energies). The location presenting the lowest E&M impacts in acidification, marine ecotoxicity, and freshwater ecotoxicity is Mexico, whose configuration consists of less heliostats and the electricity mix of the country has a low share of renewable energies (approx. 19%) but a high share of natural gas (50%) with respect to other more polluting fossil fuels. Differences in the E&M phase between the location with the lowest impacts in this phase (Spain or Mexico) and the one with the highest impacts (KSA) range between 12% and 27% for each category with respect to the total life cycle impacts in each location. Transport of components in each location has a very limited influence on the environmental profile of the different locations.
Water consumption per unit of power generated by the HYSOL plant deployed in different locations was calculated to be as follows: (0.164 m3/MWh), Chile (0.262 m3/MWh), KAS (0.277 m3/MWh), Mexico (0.016 m3/MWh), and South Africa (0.123 m3/MWh). These changes are attributable to various elements. Firstly, water consumption taking place in the power block, which is affected by the solar fraction of the system. This is because operation of the combined cycle (gas turbine plus steam turbine) involves lower water requirements per unit of power generated than operation of the Rankine cycle alone. Secondly, water requirements for washing mirrors are affected by meteorological and geographical considerations, which are site specific. These values are higher in KSA and Chile due to the desert nature of the terrain where the plant is located. Water consumption values are multiplied by the water stress index in each of the locations considered in order to determine the water stress impact. The water stress indices associated with the locations of the HYSOL plants in KAS, Chile, and Spain are very similar (1, 1, and 0.9927) due to lack of water resources availability. Water stress index in the location of the HYSOL plant in México (La Paz, Mexico) is significantly lower (0.0106) due to a higher water accessibility. Considering all these elements, the location with lowest impact in the water stress category is Mexico, followed by Spain, South Africa, Chile, and KAS.
The CED for each of the locations considered ranges from 757 MJ/MWh in Chile to 1338 MJ/MWh in Spain. This means that, depending on the location, the ratio of primary energy consumed to electricity produced in the life cycle of the HYSOL BIO plant varies between 21% (Chile) and 37% (Spain). This ratio does not include the demand for renewable energy sources as primary energy.
3.2. HYSOL Alternative Scenarios
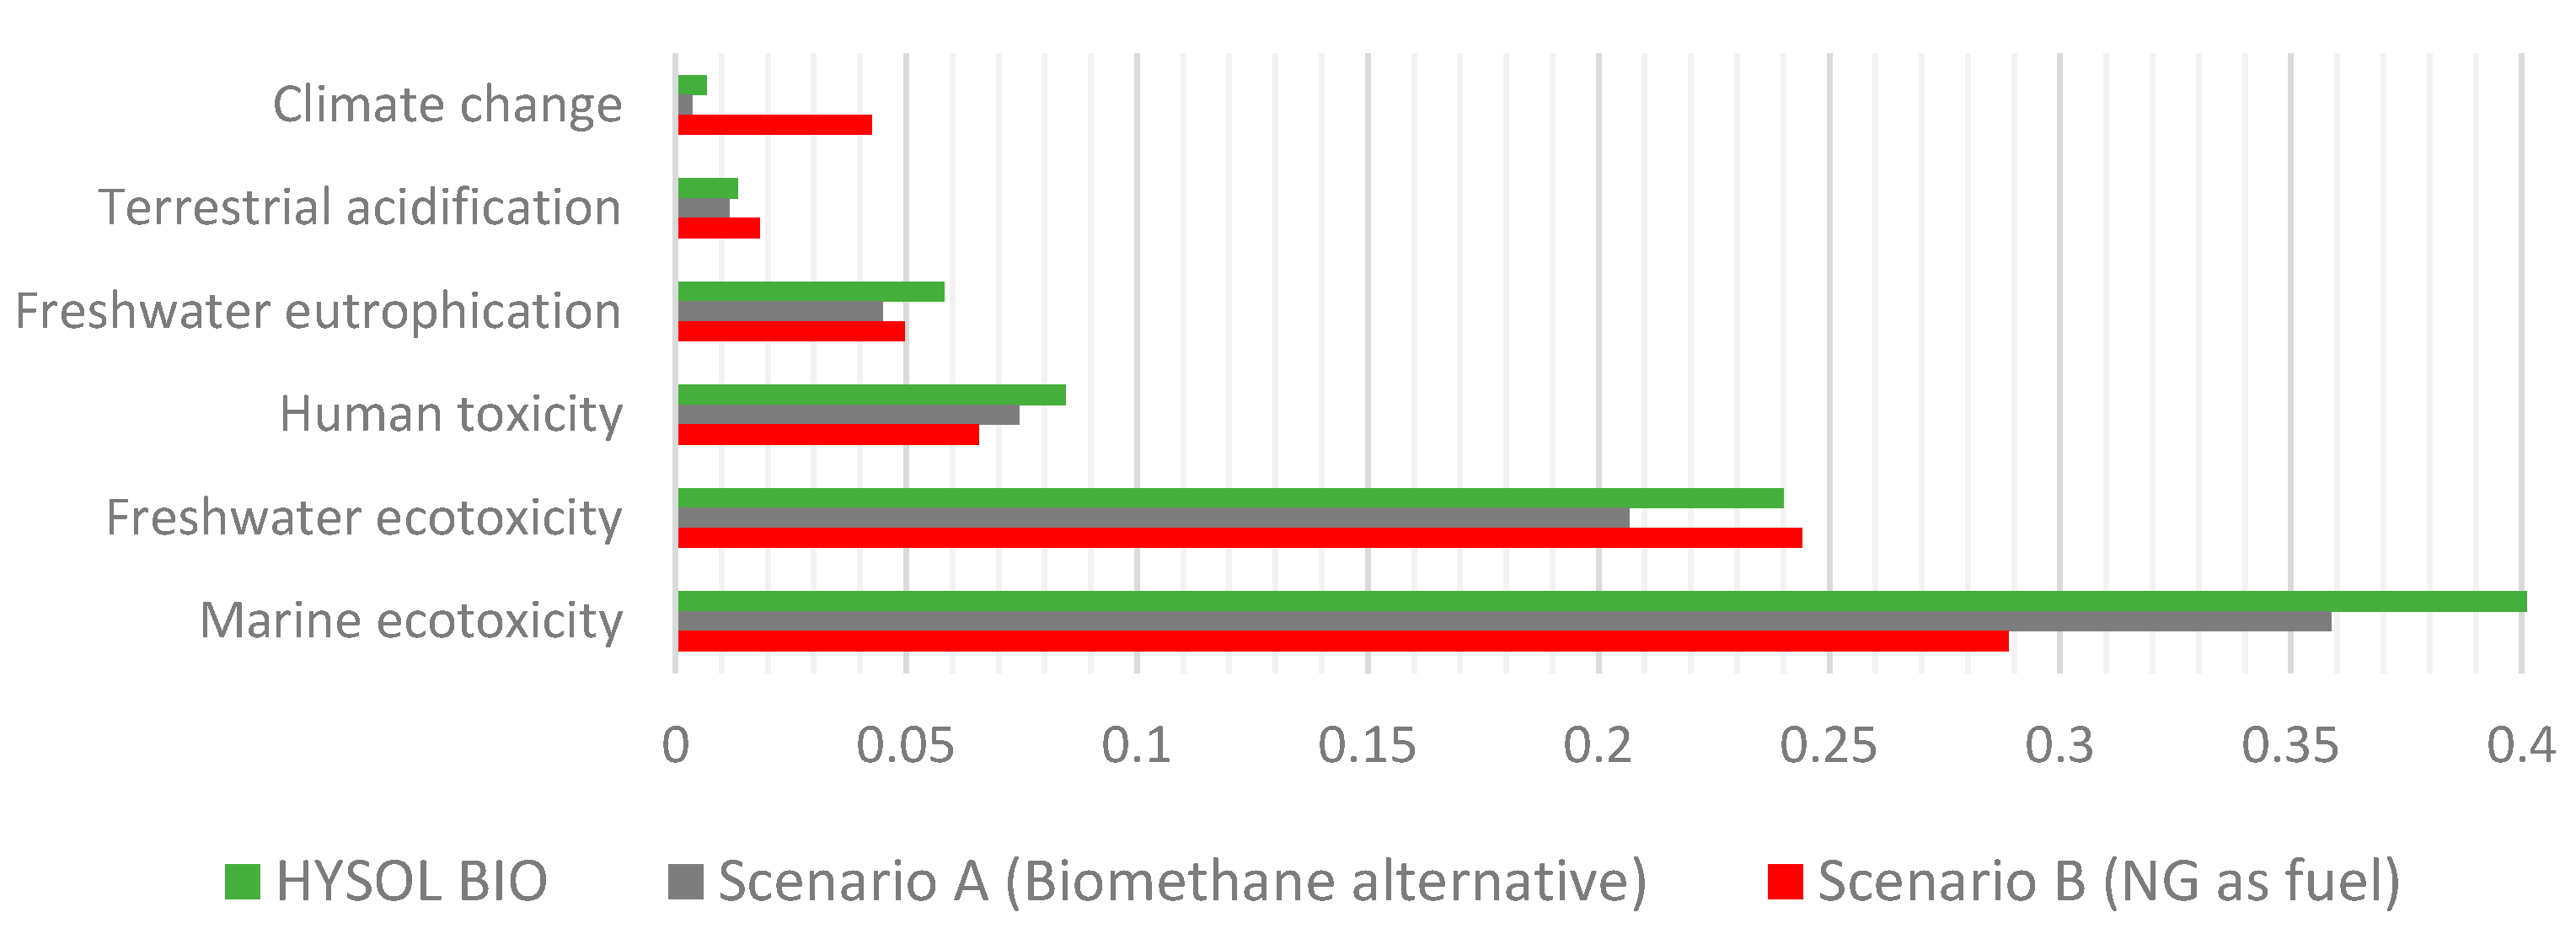
Table 4 and
Figure 7 show the characterized and normalized results obtained for the alternative scenarios A (Biomethane alternative scenario) and B (natural gas, NG, as auxiliary fuel) compared to the reference plant.
Power plant and fuel characteristics of scenario A are the same as in the reference HYSOL plant, but the biomethane life cycle has been modelled differently than in the reference scenario (modelling assumptions are described in Section 2.1). The substitution of digestate for synthetic fertilizers considered in this scenario contributes to savings in the climate change category with a prevention of 17.4 kg CO2 eq/MWh. It also decreases the impact on other categories, such as CED and human toxicity, while impact values for other categories are reduced slightly.
Scenario B evaluates a CSP plant with HYSOL configuration using natural gas as auxiliary fuel instead of biomethane. The results (in
Table 4) evidence a deterioration in the climate change and CED categories (per functional unit of electricity) when operating with natural gas. Climate change results for scenario B are six times higher than the reference plant, and 10 times higher than Scenario A. This difference is mainly due to the combustion emissions of natural gas in Scenario B (which presents 73% of the life cycle impacts in climate change category) compared to the biomethane combustion emissions of the reference plant, since the nature of the second one is biogenic and does not contribute to climate change impacts.
CED results indicate that the primary energy consumed during the life cycle of the power plant in scenario B is almost four times higher than that of the reference plant. Besides, the CED obtained for Scenario B exceeds in 2744 MJ/MWh the electricity produced during the life cycle of the HYSOL CSP plant. The difference observed between the reference plant (1264 MJ/MWh) and scenario B (4908 MJ/MWh) is attributable to the changes in primary energy demand associated with the life cycle of biomethane and natural gas, since the former is less energy intensive than the latter.
Differences on other impact categories such as acidification and water stress were less significant. The lower impact for water stress in this scenario compared to the reference HYSOL plant is due to methodology issues. This category only takes into account direct water consumption associated with O&M of the HYSOL plant and the biomethane production. Since natural gas was considered as an upstream process, direct water consumption during natural gas production was not considered.
It should be noted that the environmental impact on the freshwater eutrophication, human toxicity, and marine ecotoxicity categories in scenario B are lower than in the reference plant and scenario A. This is due to the higher toxicity and eutrophication potential of the biomethane life cycle with respect to the natural gas life cycle, which is associated with the upgrading process, the transport activities during slurry waste management, and the materials employed in the construction of the biomethane plant.
4. Discussion
The normalized analysis of the HYSOL system suggests that the environmental categories most significantly affected by the technology are those related to toxicity (human, freshwater, and marine), followed by freshwater eutrophication and terrestrial acidification. This profile is rather different to the one observed in conventional CSP plants currently operating in Spain due to two issues: first, the renewable nature of the auxiliary fuel (biomethane in HYSOL compared to natural gas in conventional CSP) and also to the significantly lower solar fraction of the HYSOL technology required to improve firmness and dispatchablility in the generation of power.
The results obtained for the HYSOL configuration located in different countries presented significant differences (between 35% and 43%, depending on the category), especially in climate change and water stress categories. The differences observed in the characterized results are mainly due to the following factors:
Availability of solar irradiation at the location: The solar irradiation determines the amount of energy collected by the heliostats. Higher electricity generation involves less environmental impacts per functional unit. The location with lowest DNI is Mexico, which is the second location with the highest environmental impacts in every category except for water stress. The next location with the lowest DNI is Spain (which presents the highest environmental impacts), followed by KAS and Chile.
Solar fraction of the HYSOL plant: The solar fraction determines how much electricity comes from solar resources and how much electricity is produced from the combustion of the auxiliary fuel. The location with the highest solar fraction is Chile, which is the location with the lowest environmental impacts in every category except for water stress. The next location with the highest solar fraction is KAS, followed by Mexico and Spain. In fact, Spain is the location with the lowest solar fraction and the highest environmental impacts in every location except for water stress. In general, the higher the solar fraction, the lower the environmental impact in all categories, as the life cycle of the auxiliary fuel adds environmental impacts to the life cycle of the power plant.
Number of heliostats and local electricity mix in the E&M phase: Differences in the environmental impacts associated with the manufacturing of power plant components in the E&M phase are mainly attributable to the size of the solar field (number of heliostats) and the national electricity mixes. The location showing the highest impact values in the E&M phase in every category is KAS, followed by Chile. Both locations present a higher number of heliostats and an electricity mix with a high share of fossil fuels. Differences in the E&M phase between the location with the lowest impacts in this phase (Spain or Mexico) and the one with the highest impacts (KAS) range between 12% and 27% for each category with respect to the total life cycle impacts in each location. Transport of components in each location has a very limited influence on the environmental profile of the different locations.
Water stress index: The water consumption value is multiplied by the water stress index in each location to determine the water stress impact. The water stress indices associated with KAS, Chile and Spain are very similar (1, 1, and 0.9927), while the value allocated to South Africa (0.7834) and especially Mexico are significantly lower (0.0106) due to higher water availability. For this reason, Mexico presents the most favourable water stress result.
The environmental performance of the HYSOL plant is improved significantly (27.9 kg CO
2 eq/MWh compared to 45.9 kg CO
2 eq/MWh in the climate change category) when the analysis considers that the digestate obtained in the production of the biomethane fuel is used as a replacement for synthetic fertilizer. However, this scenario may only be applied if the digestate had a market demand and real commercial value, which is not the case in Spain and Europe to the best of our knowledge. On the contrary, the environmental impact of the HYSOL plant increases significantly when it is operated with natural gas as the auxiliary fuel. Still, the carbon footprint of the HYSOL configuration operating with 55% of natural gas hybridization resulted to be 294 kg CO
2 eq/MWh, which is lower than the 311 kg CO
2 eq/MWh obtained for a conventional hybrid parabolic trough CSP plant hybridized with only 35% of natural gas and also lower than conventional power plants based on the combustion of natural gas using combined cycle technology (365–425 kg CO
2 eq/MWh) [
18,
28,
29].


