
Combined Turbine and Cycle Optimization for Organic Rankine Cycle Power Systems—Part B: Application on a Case Study

 , and
, and
Abstract
:1. Introduction
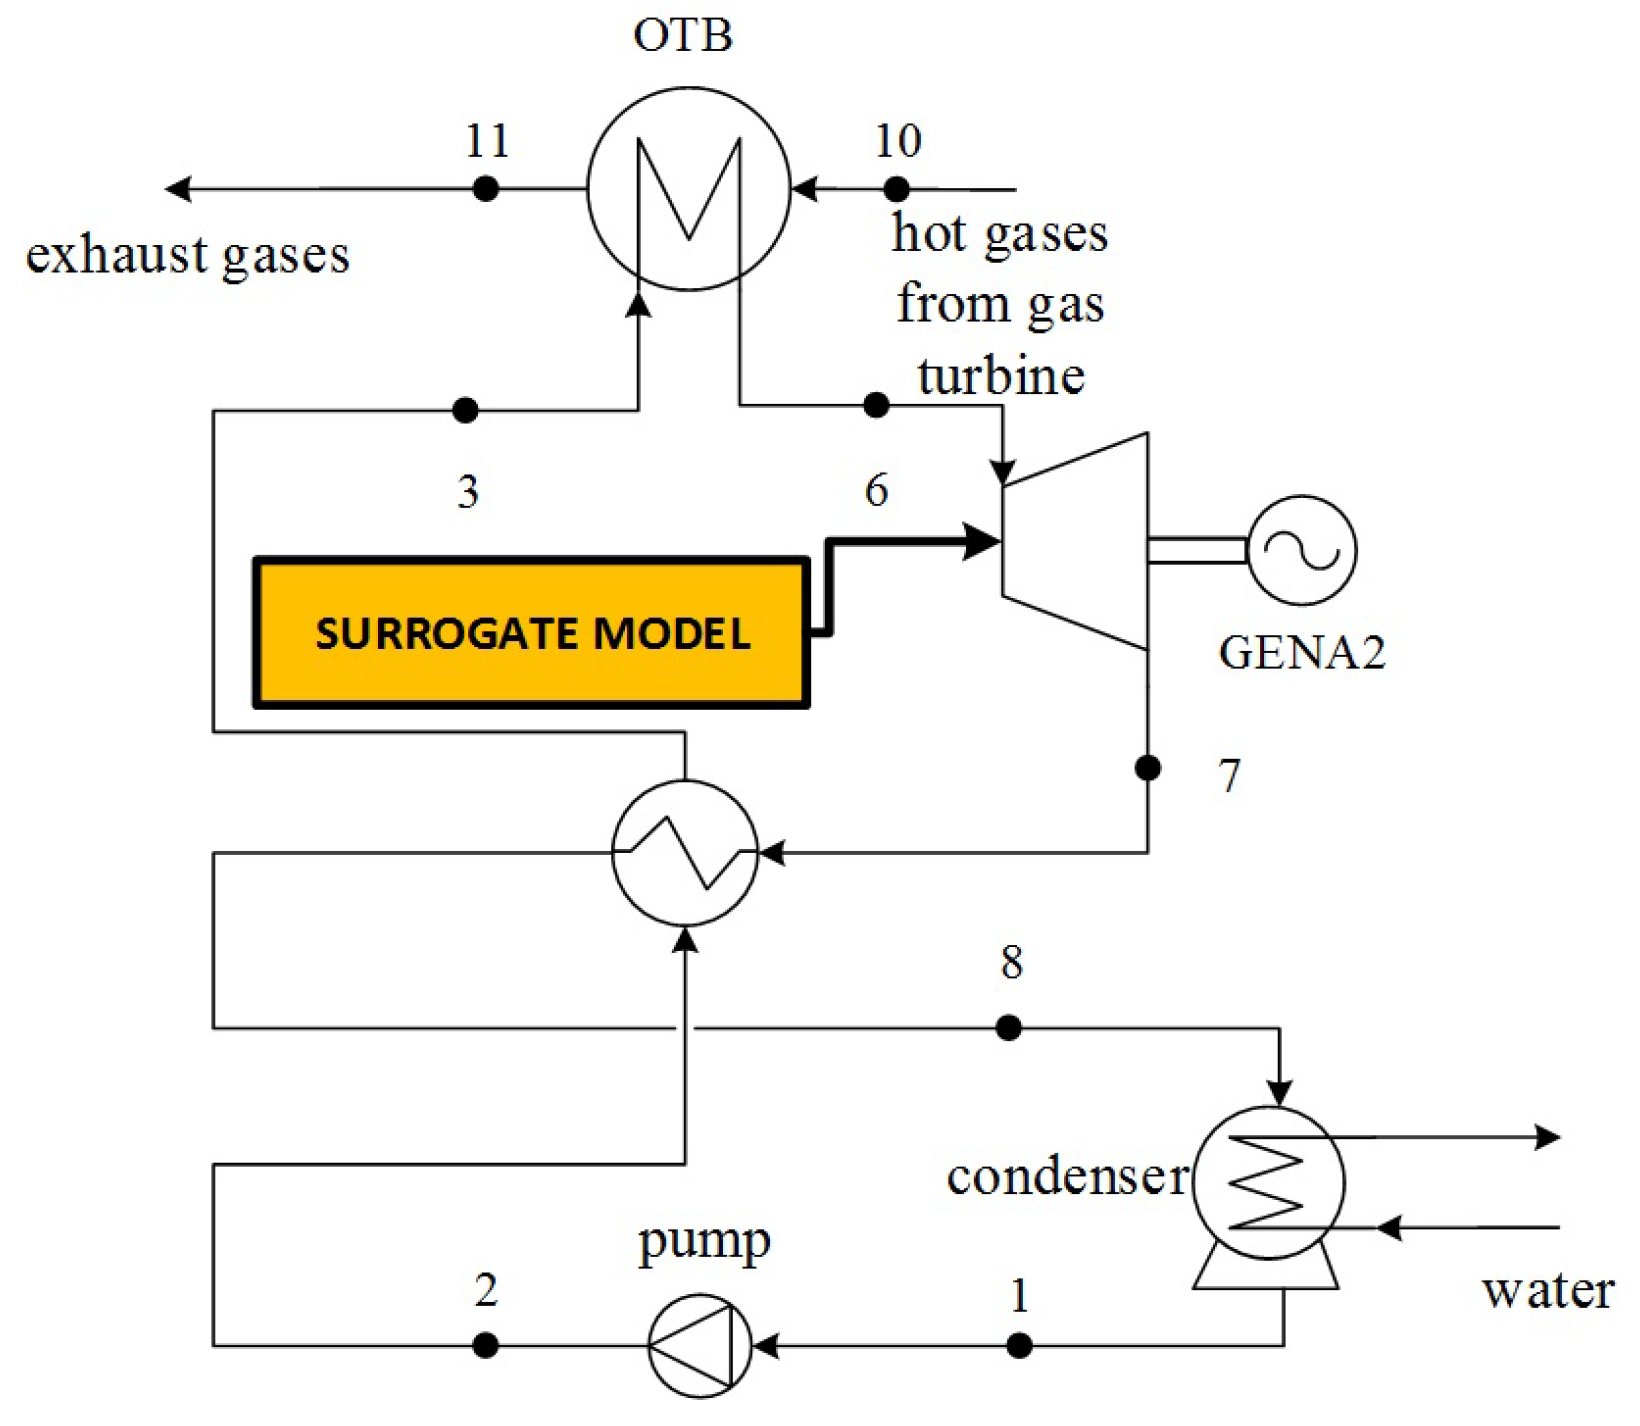
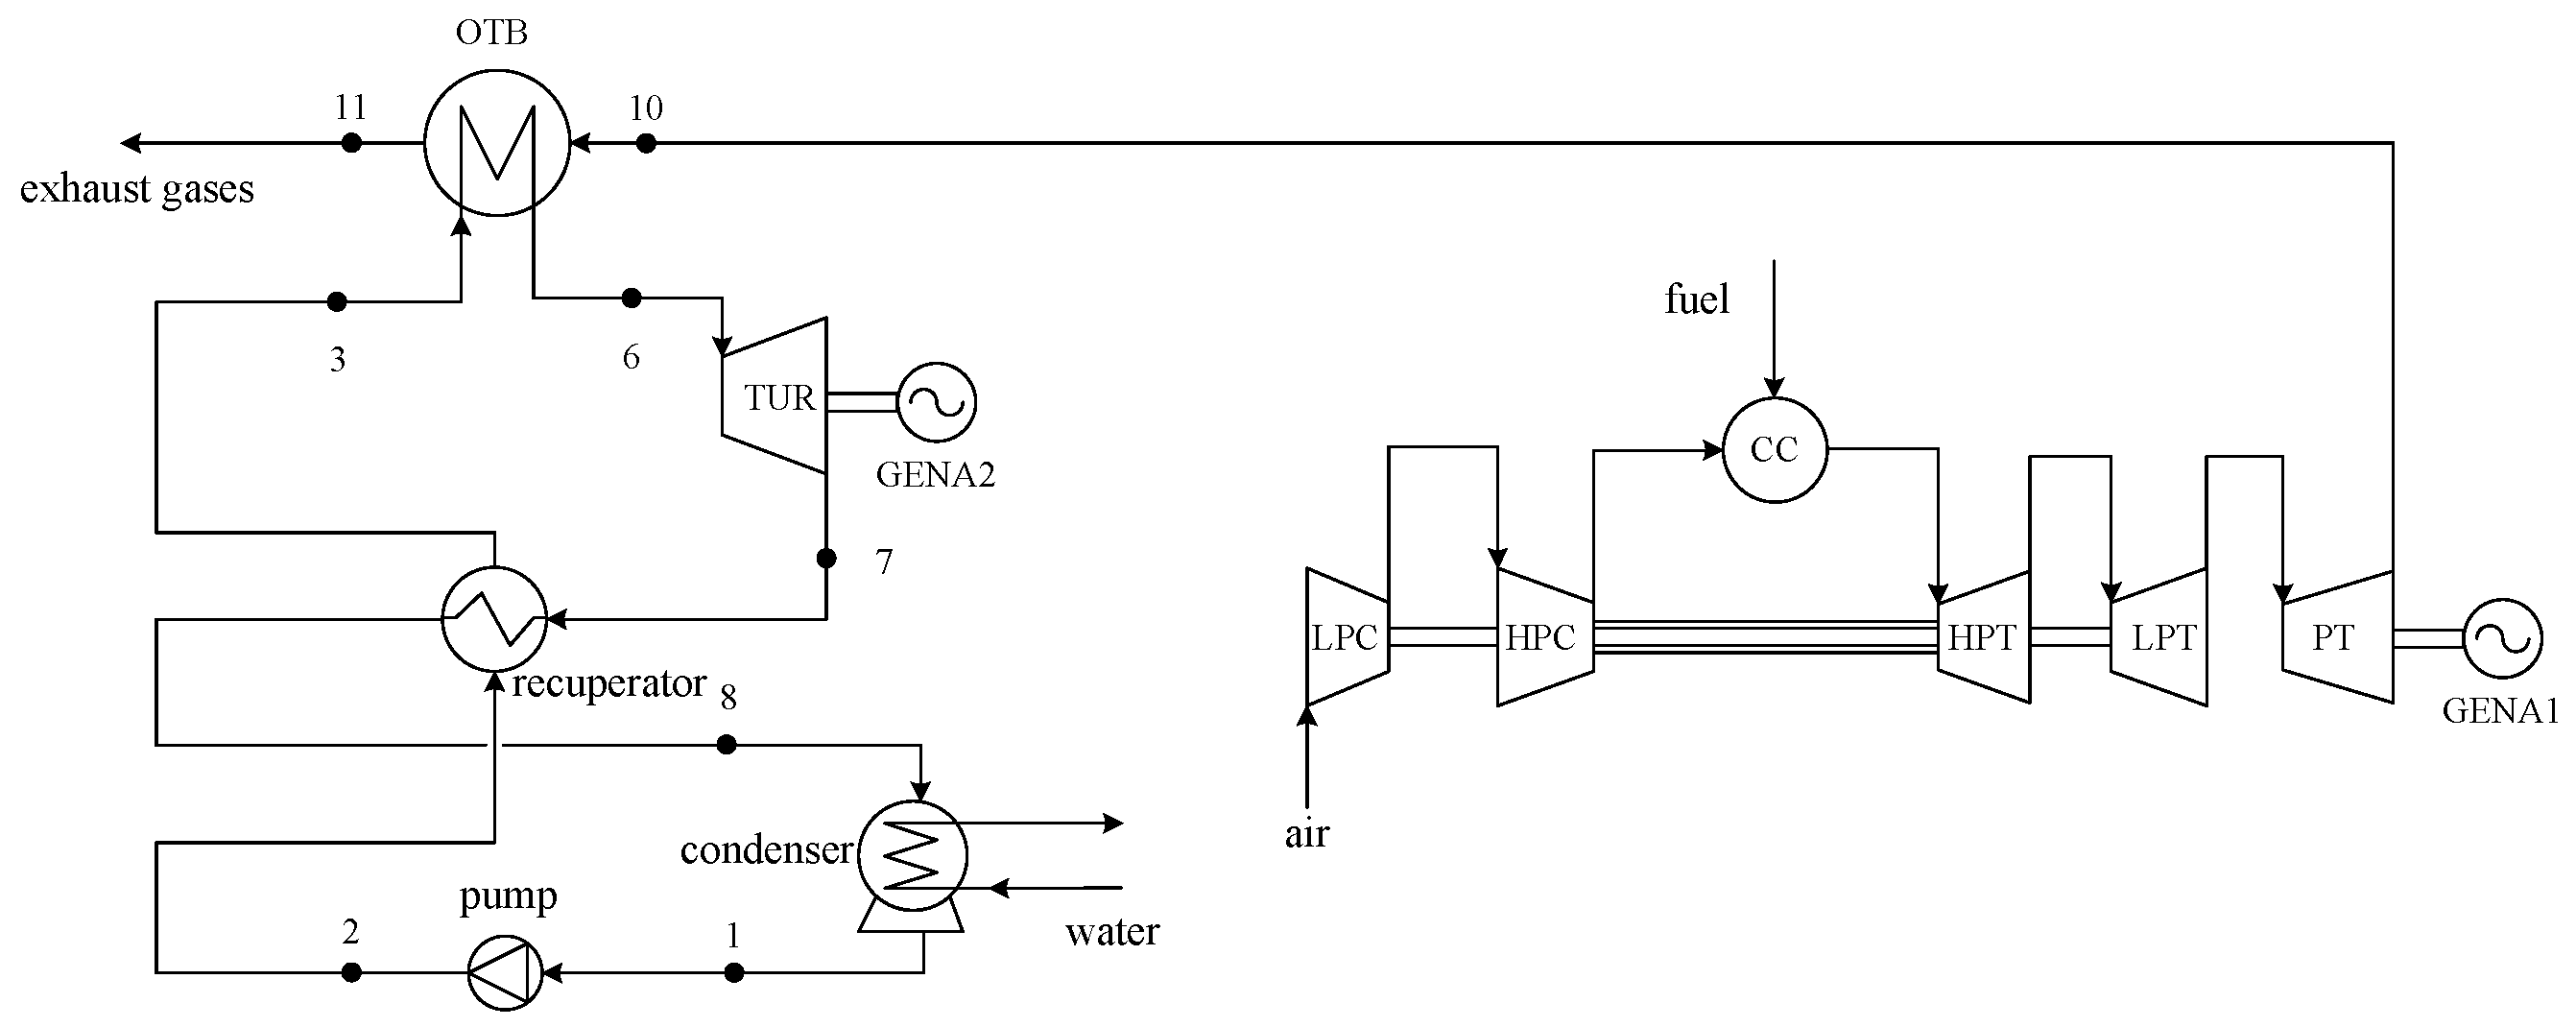
2. The Case Study
3. Methods
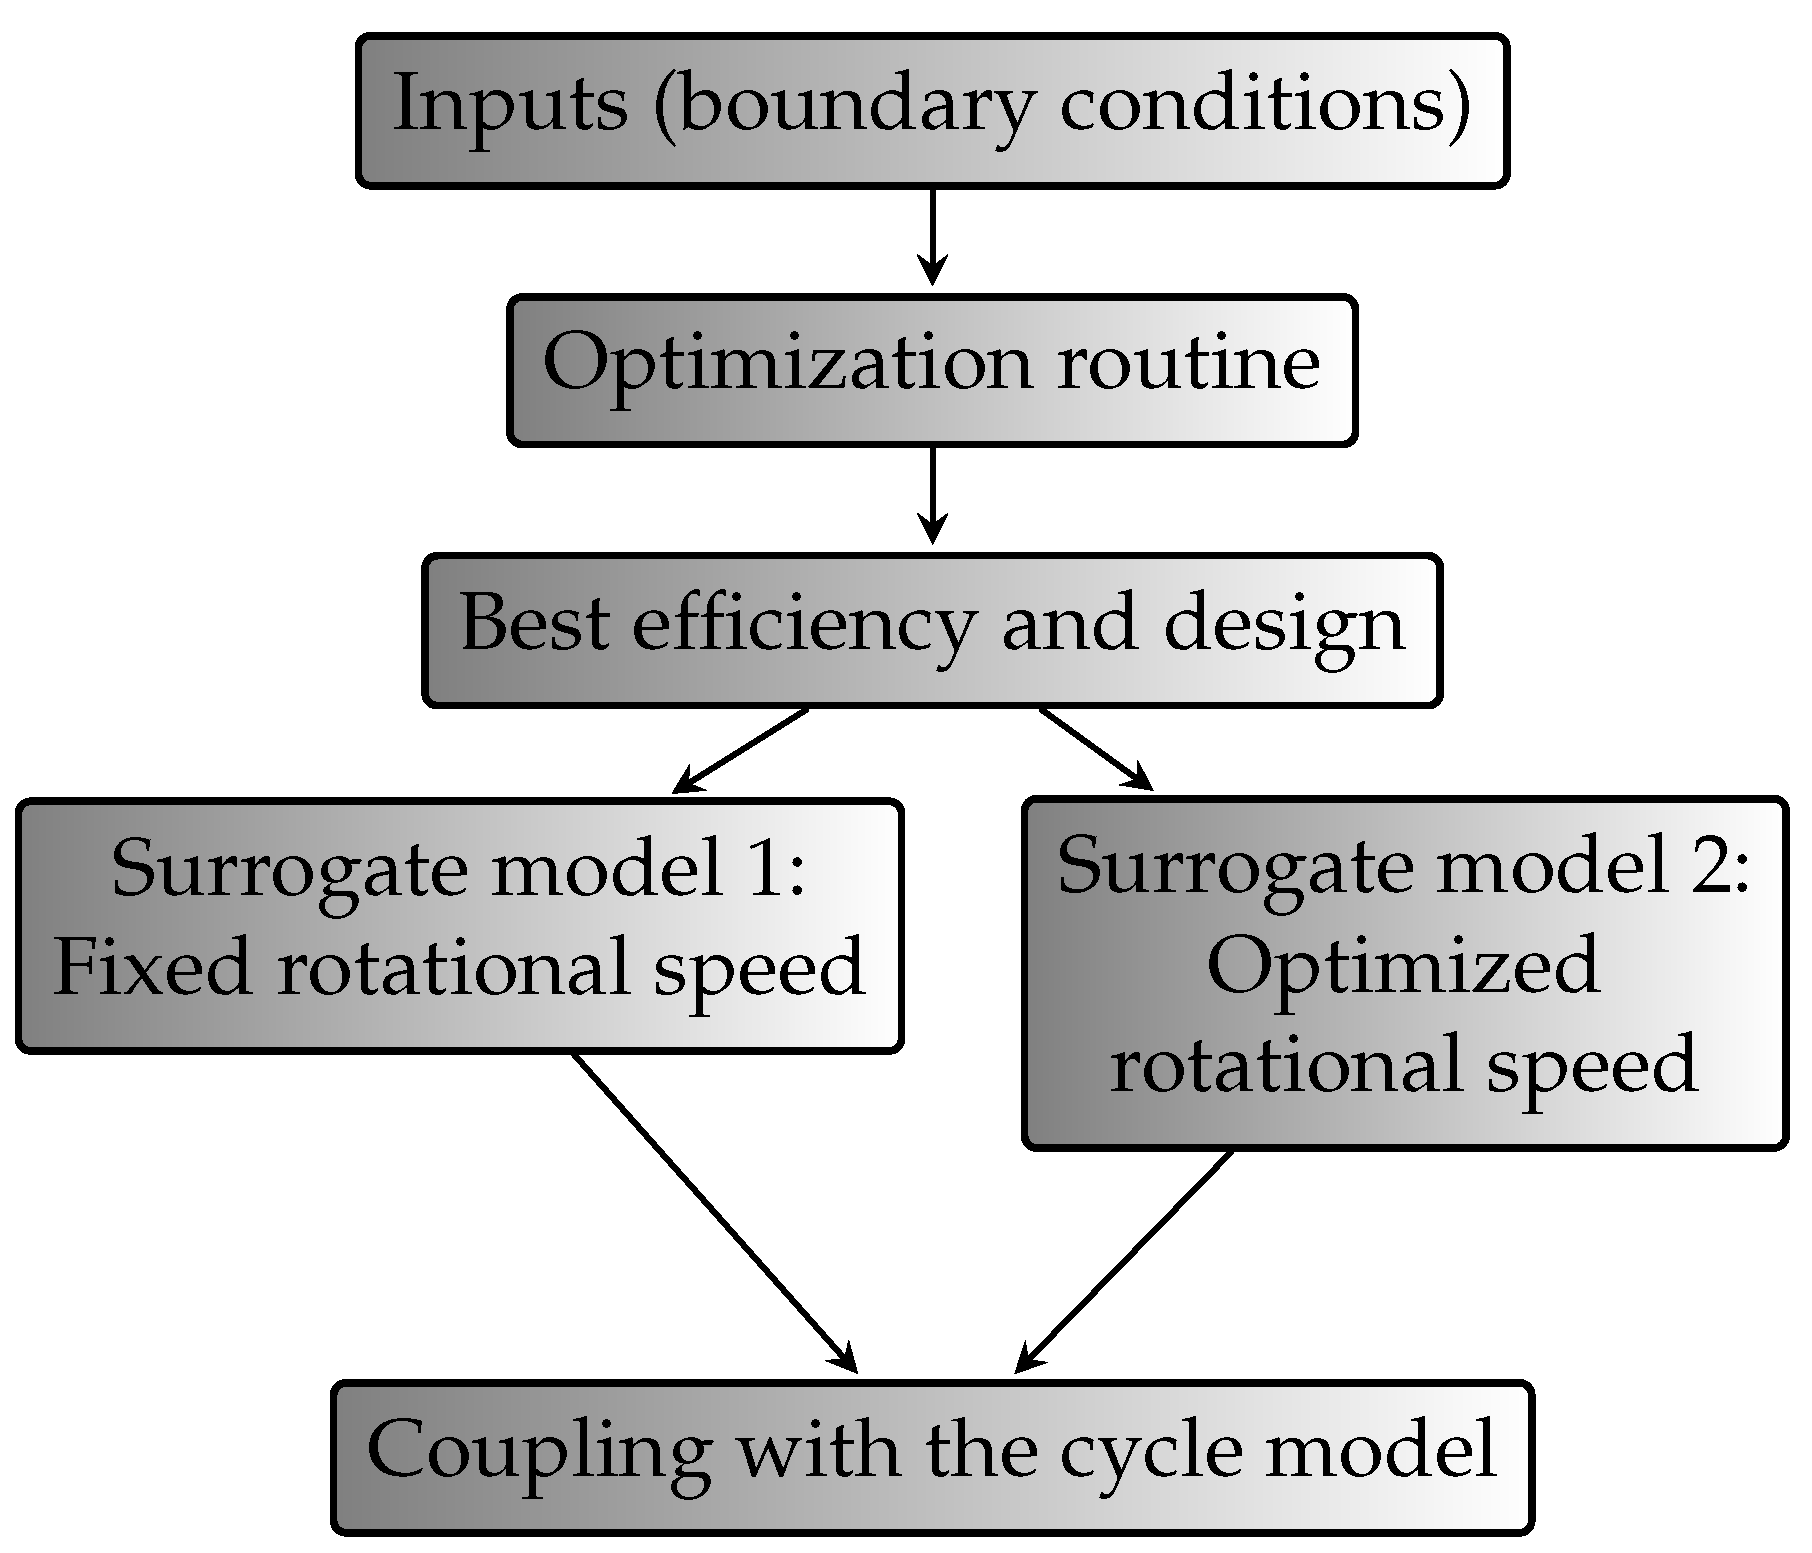
3.1. Optimization Tools
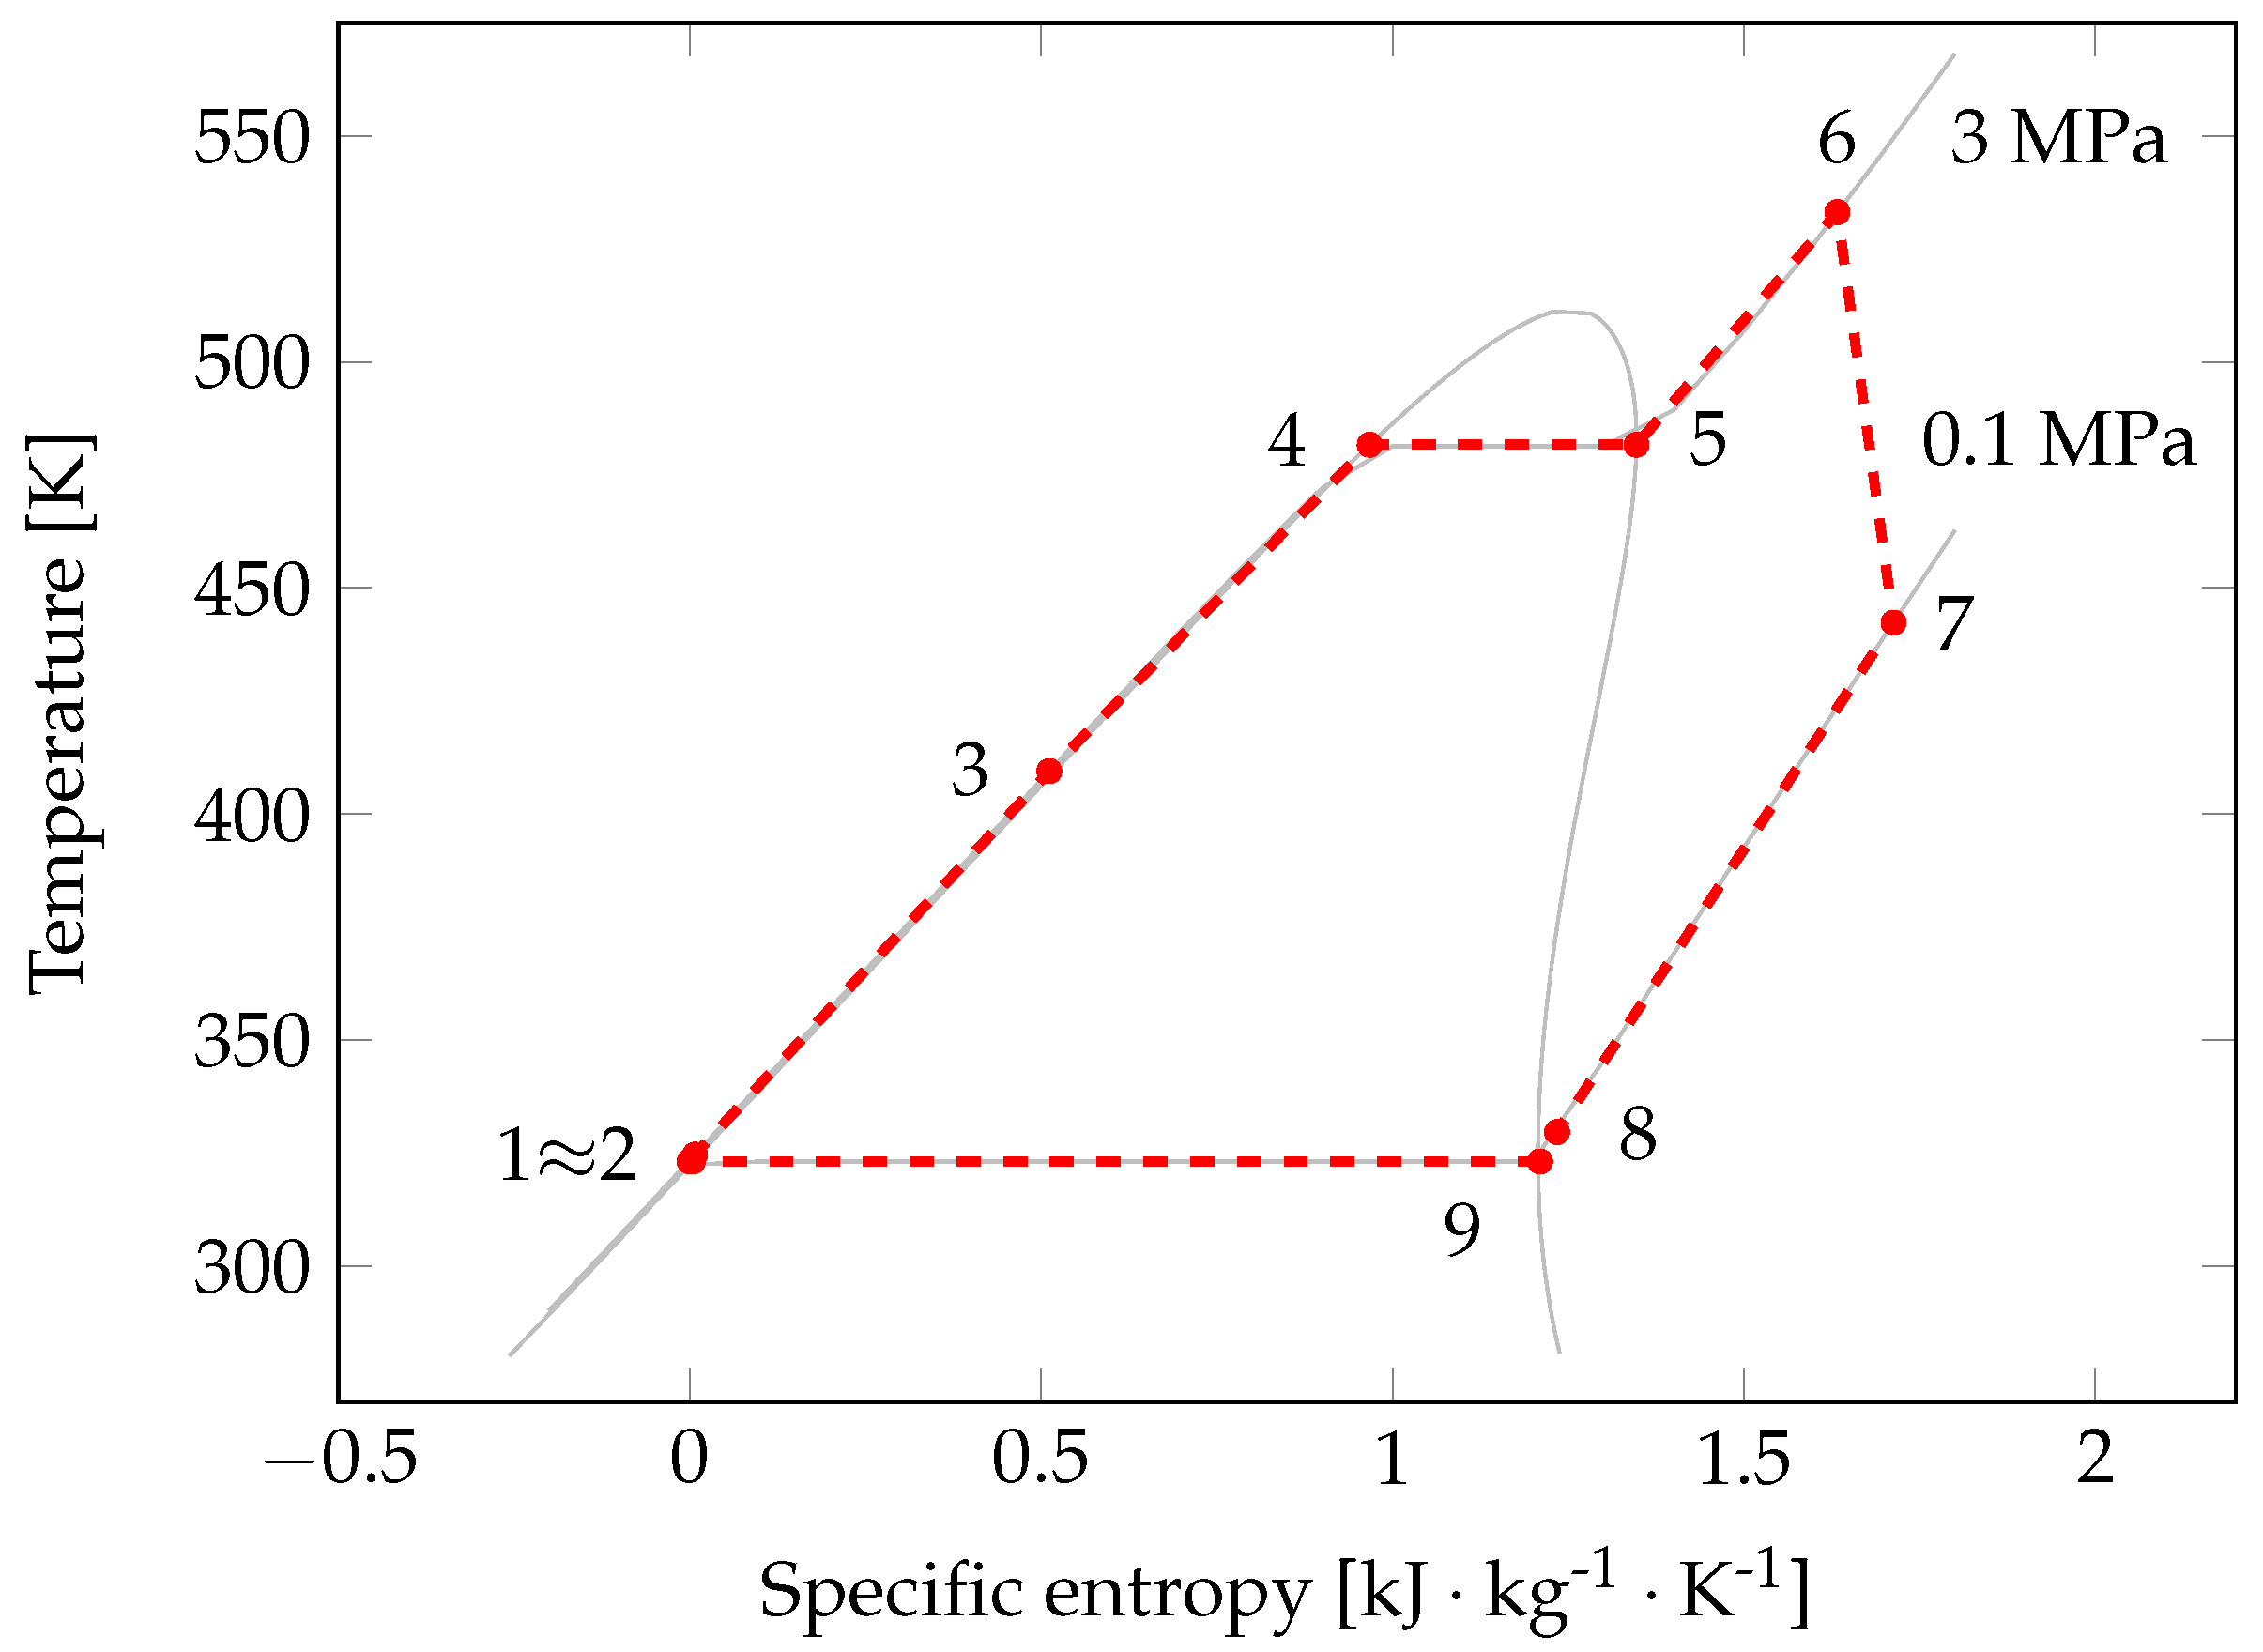
3.2. Thermodynamic Cycle Calculation
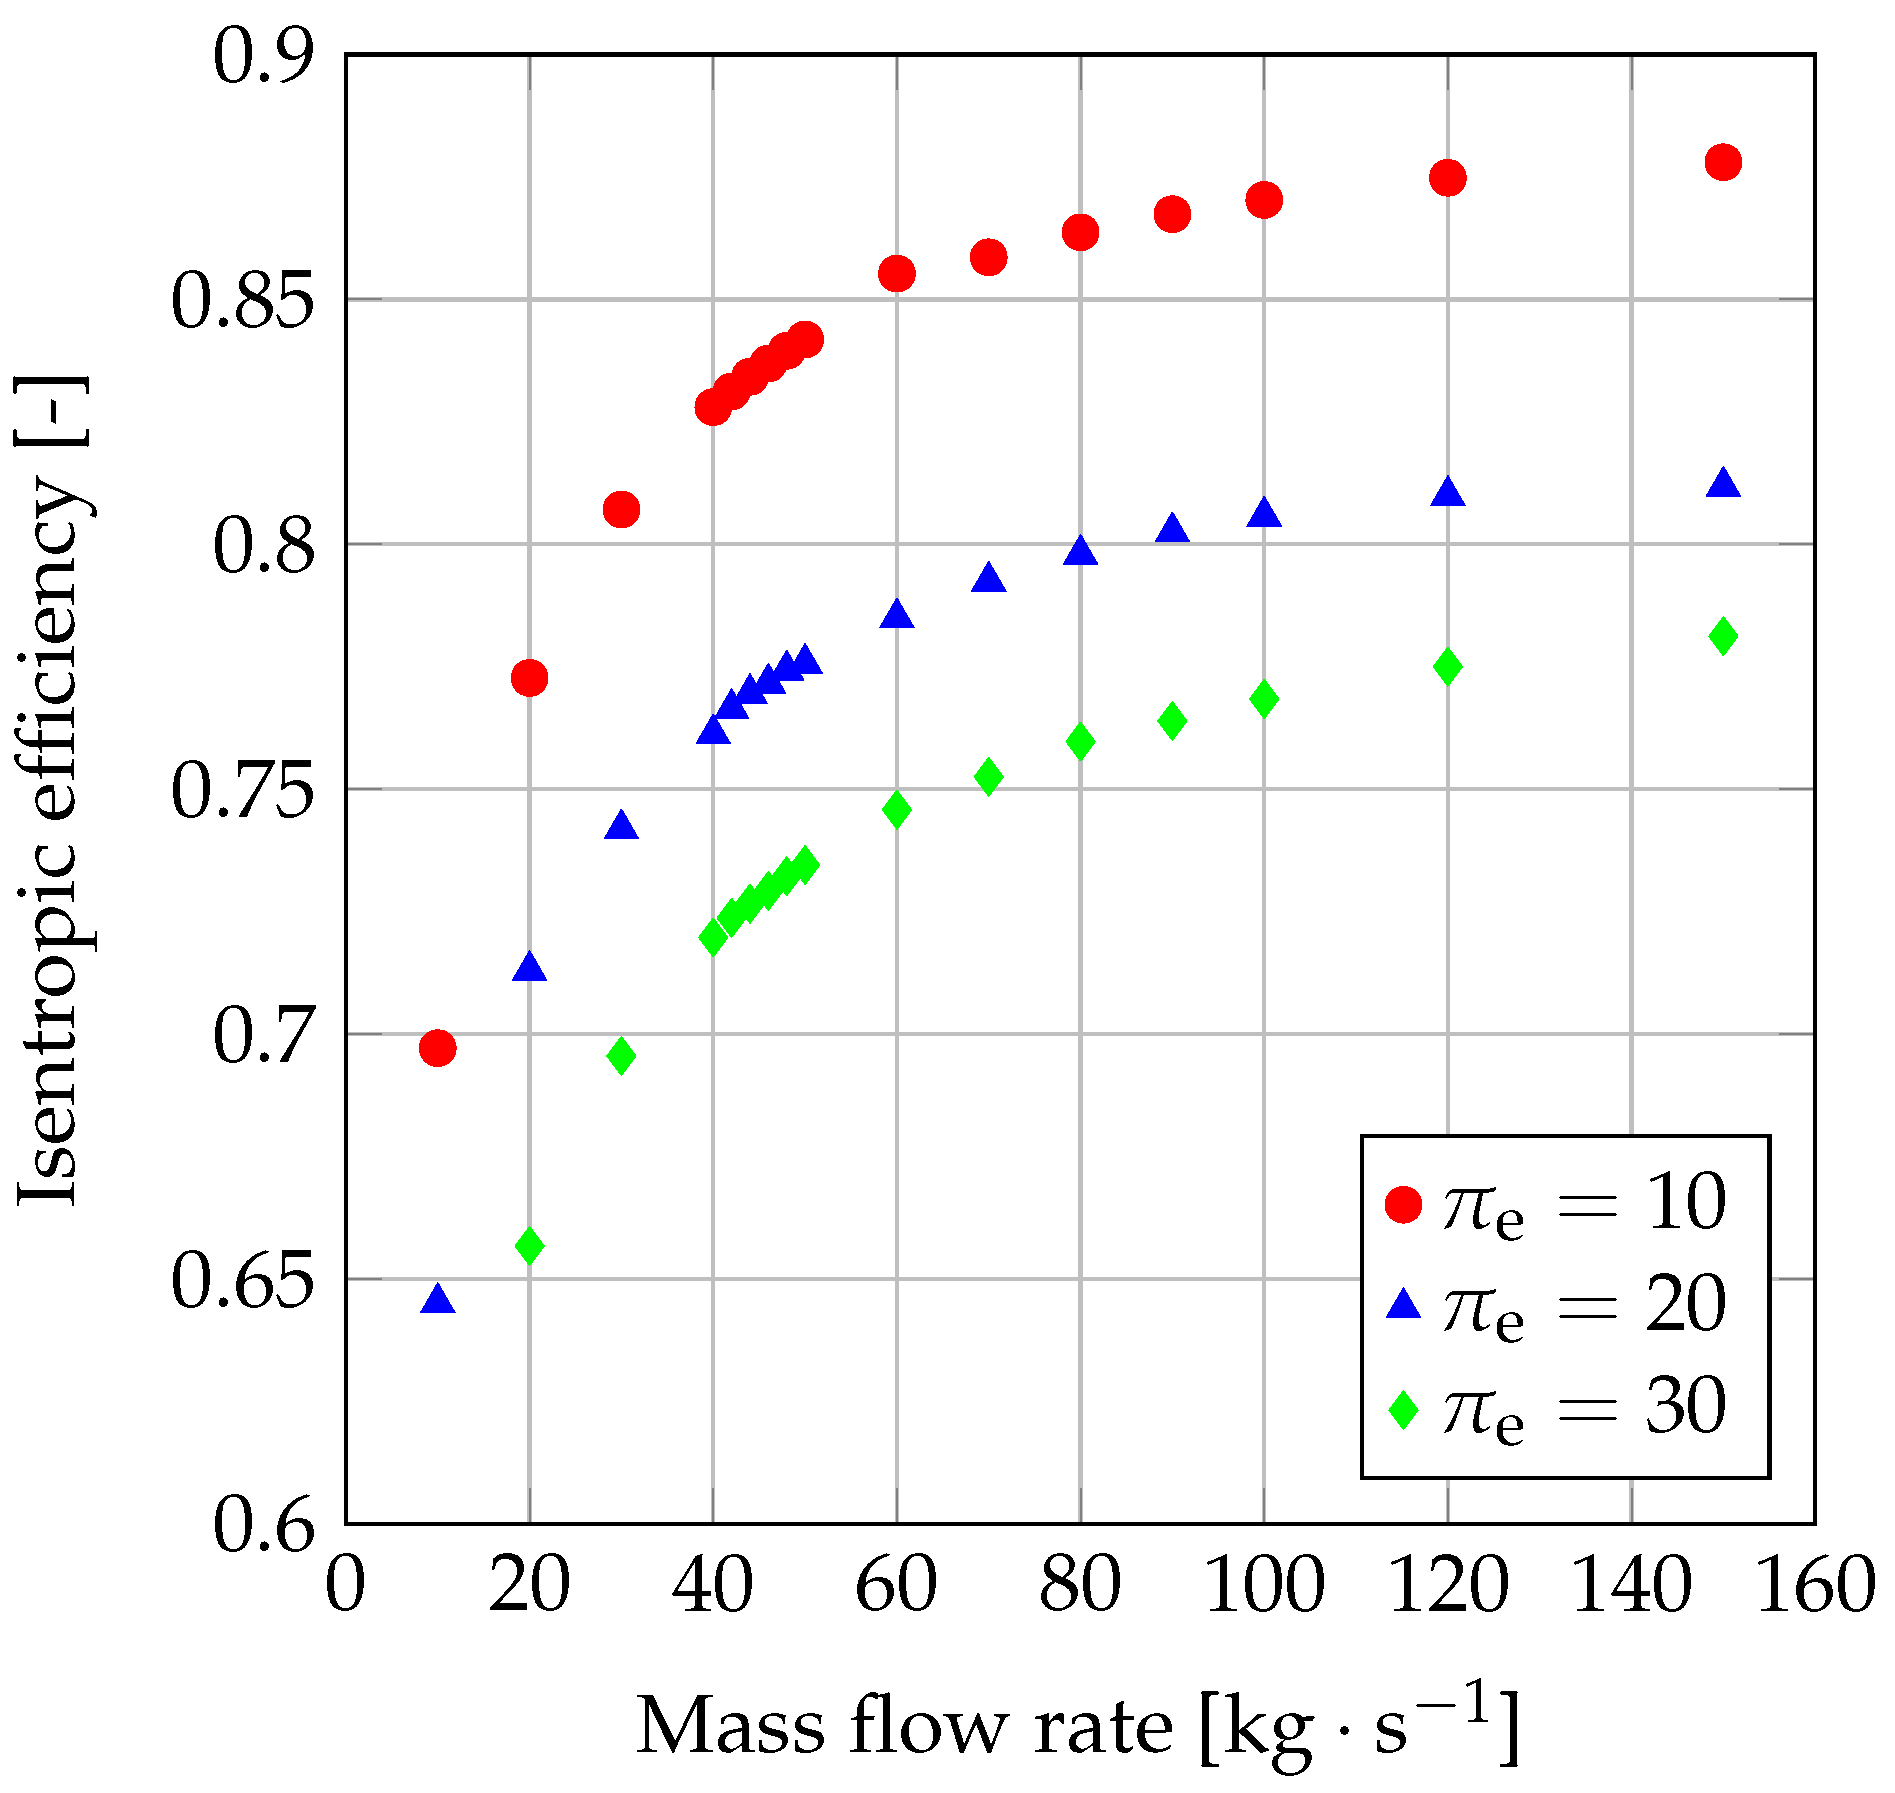
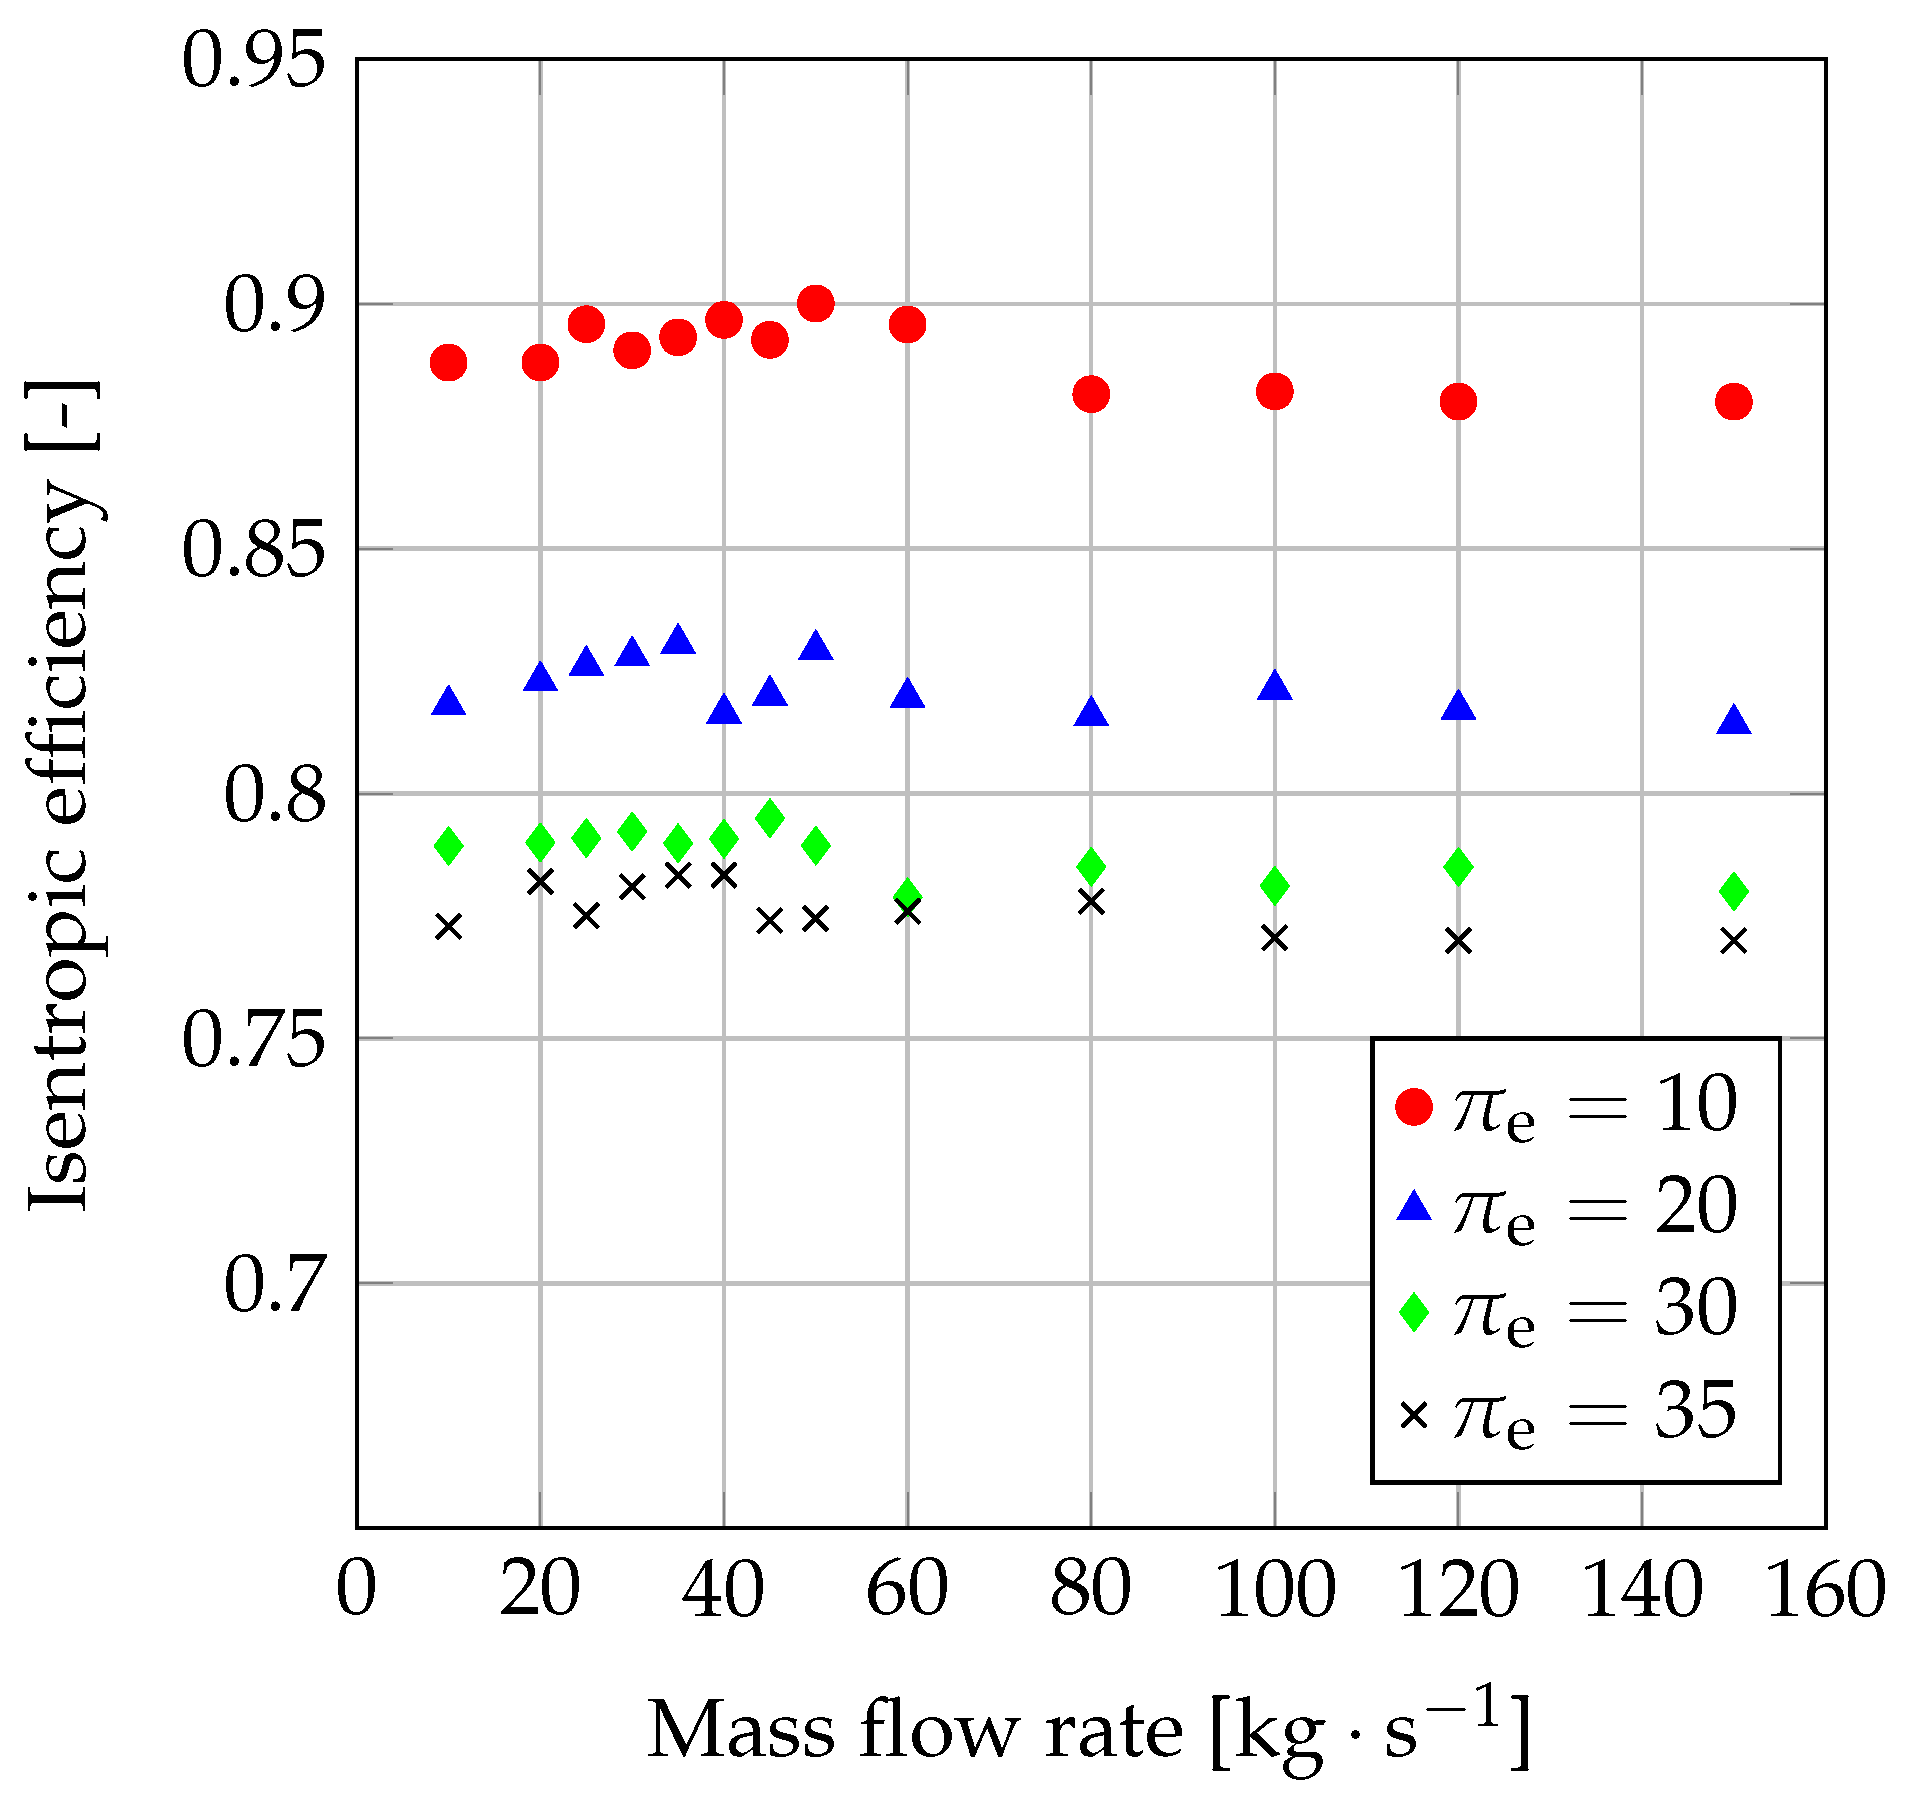
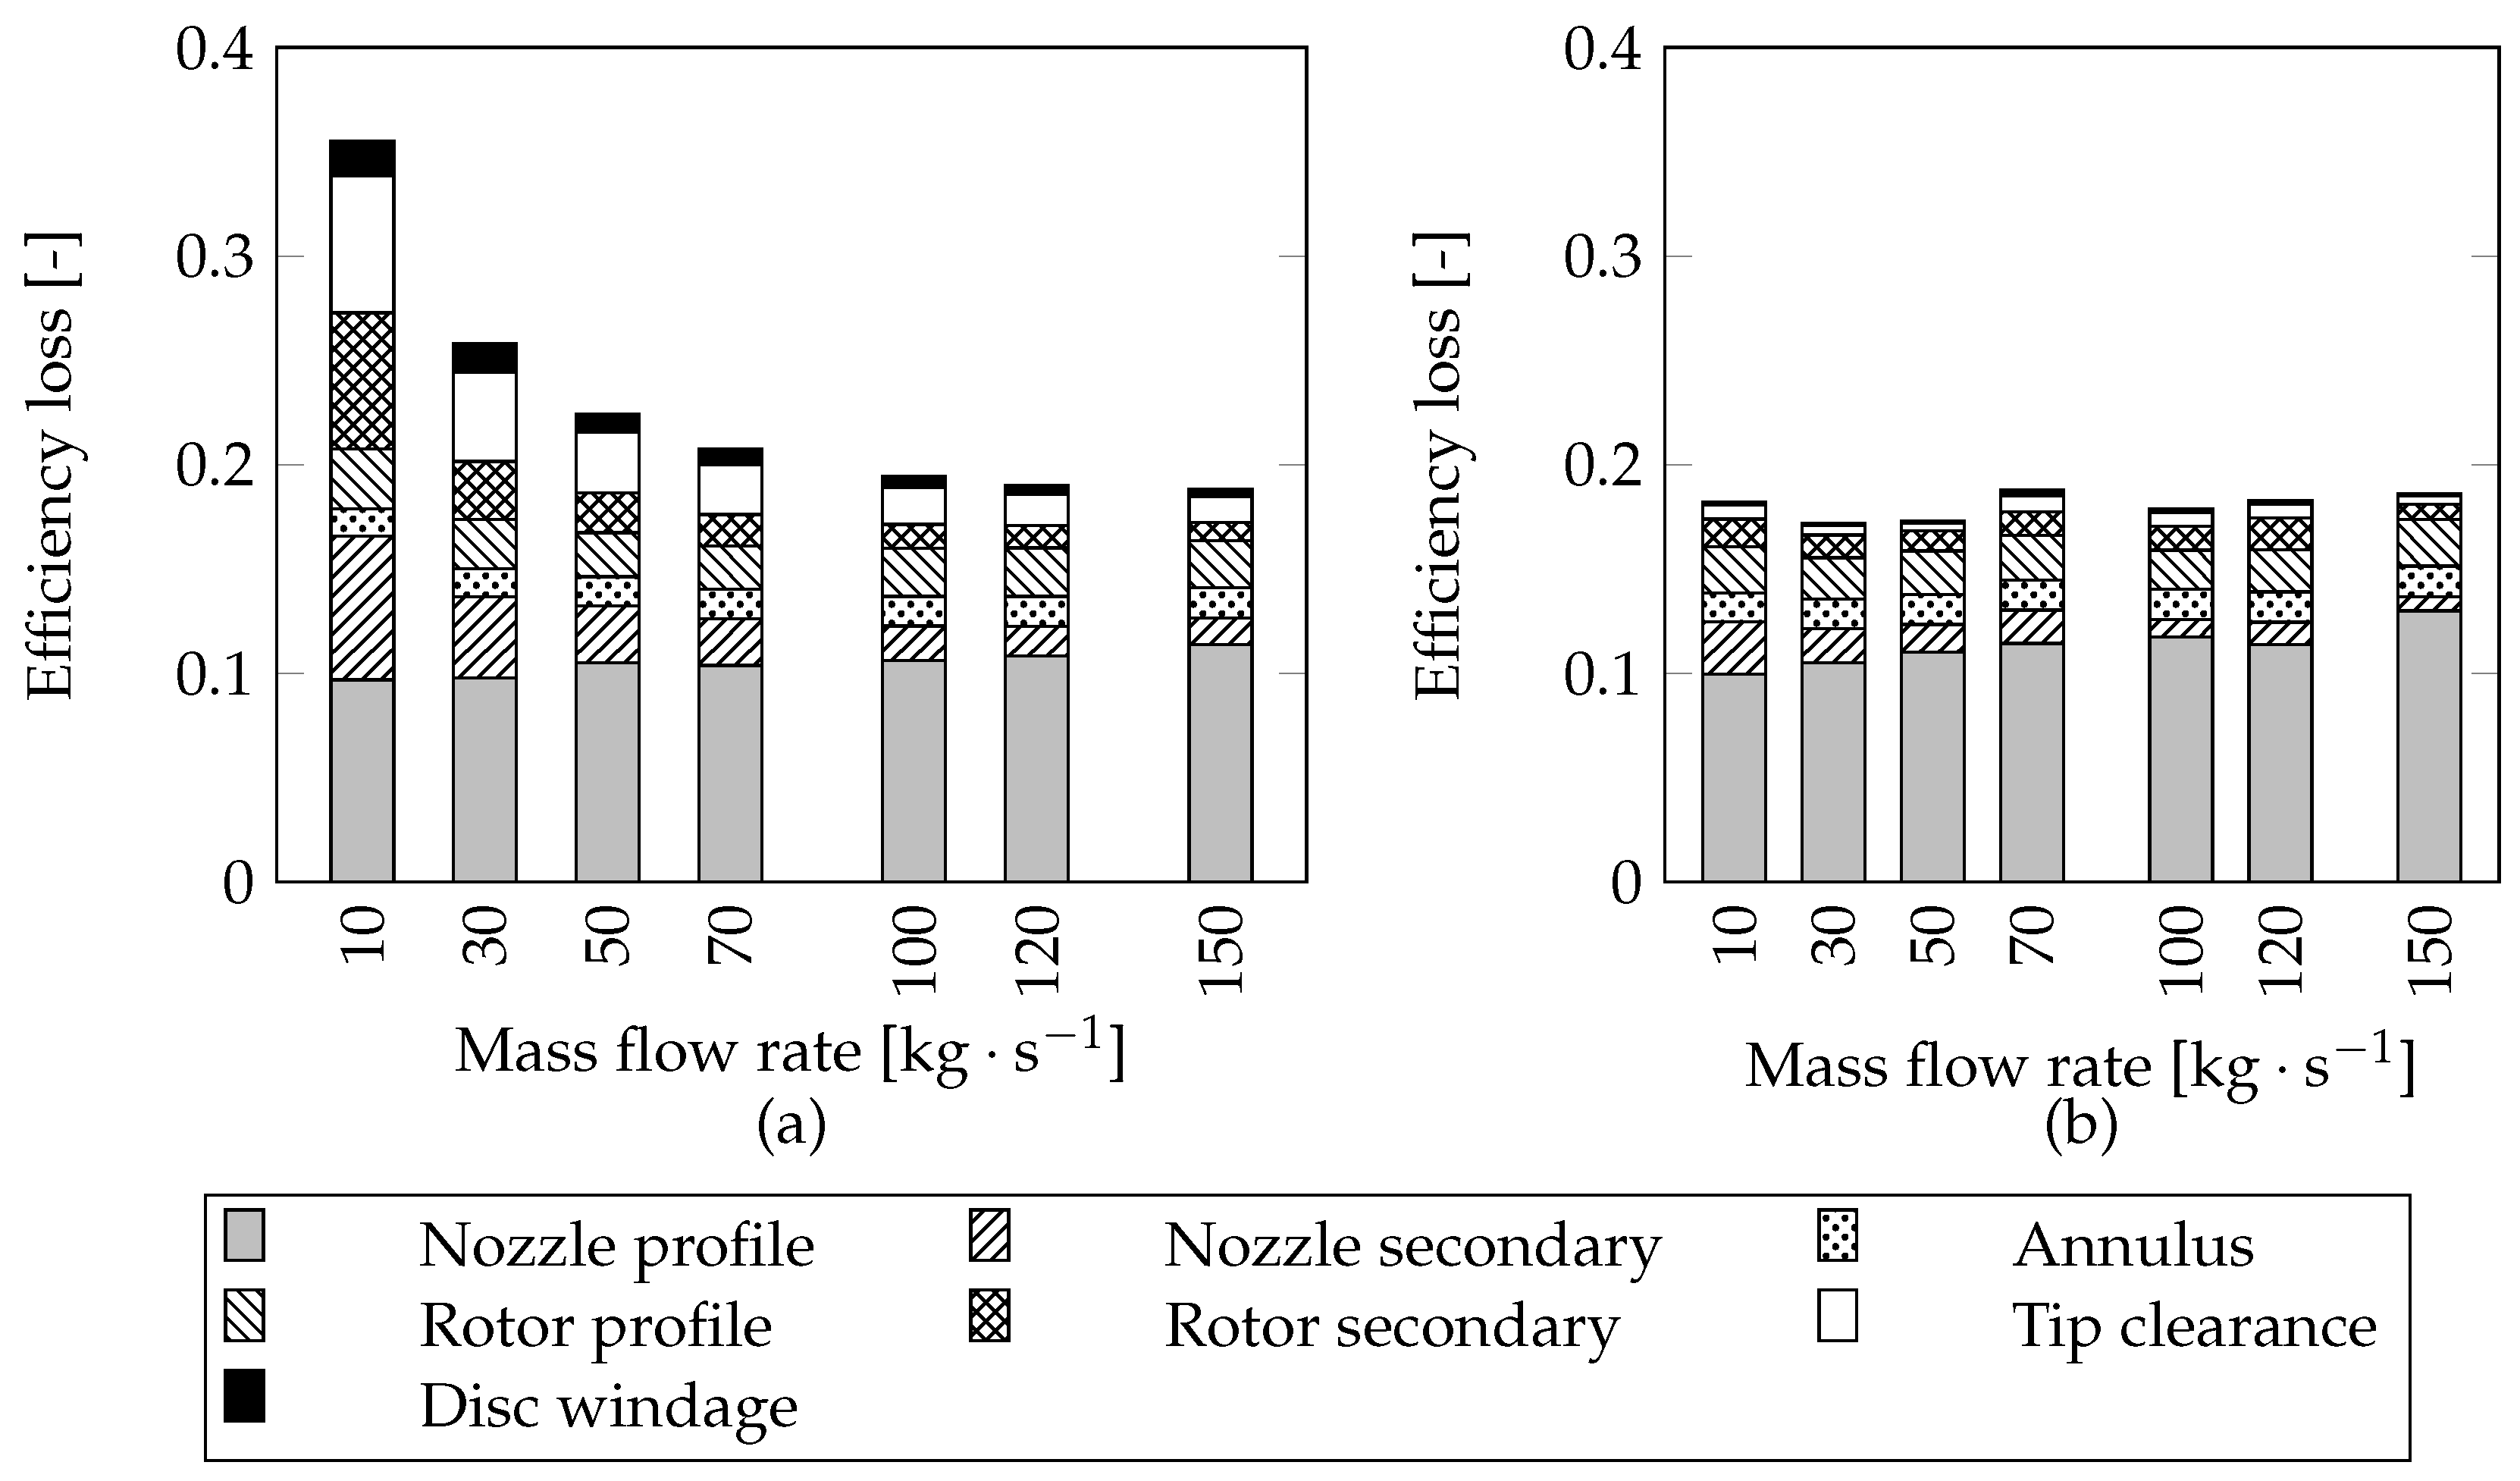
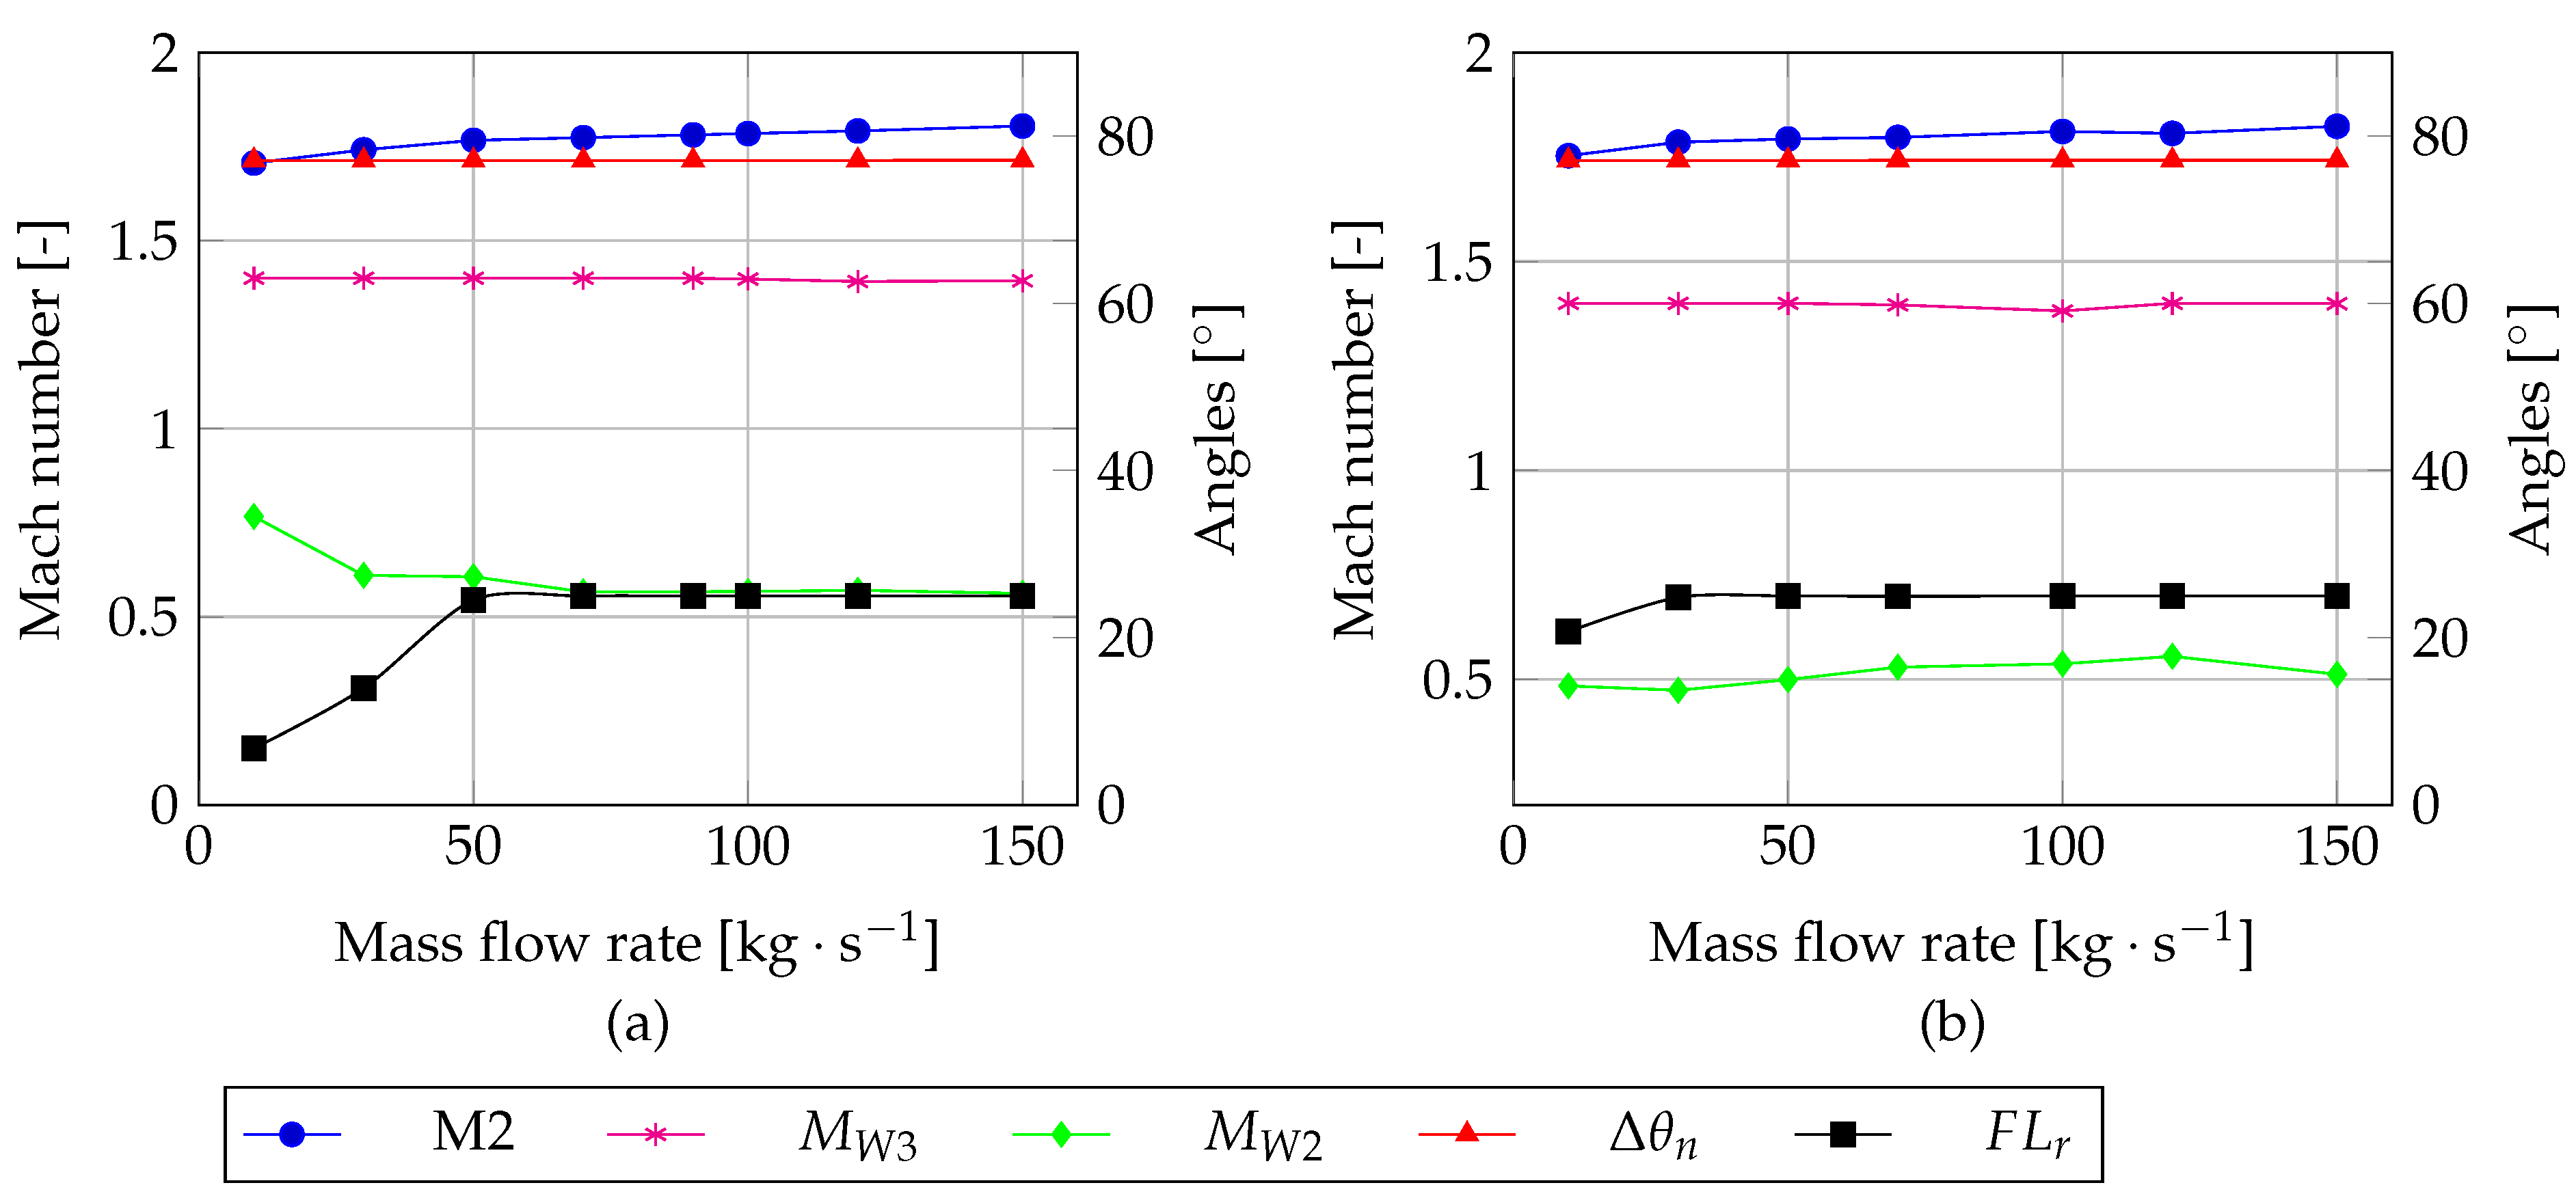
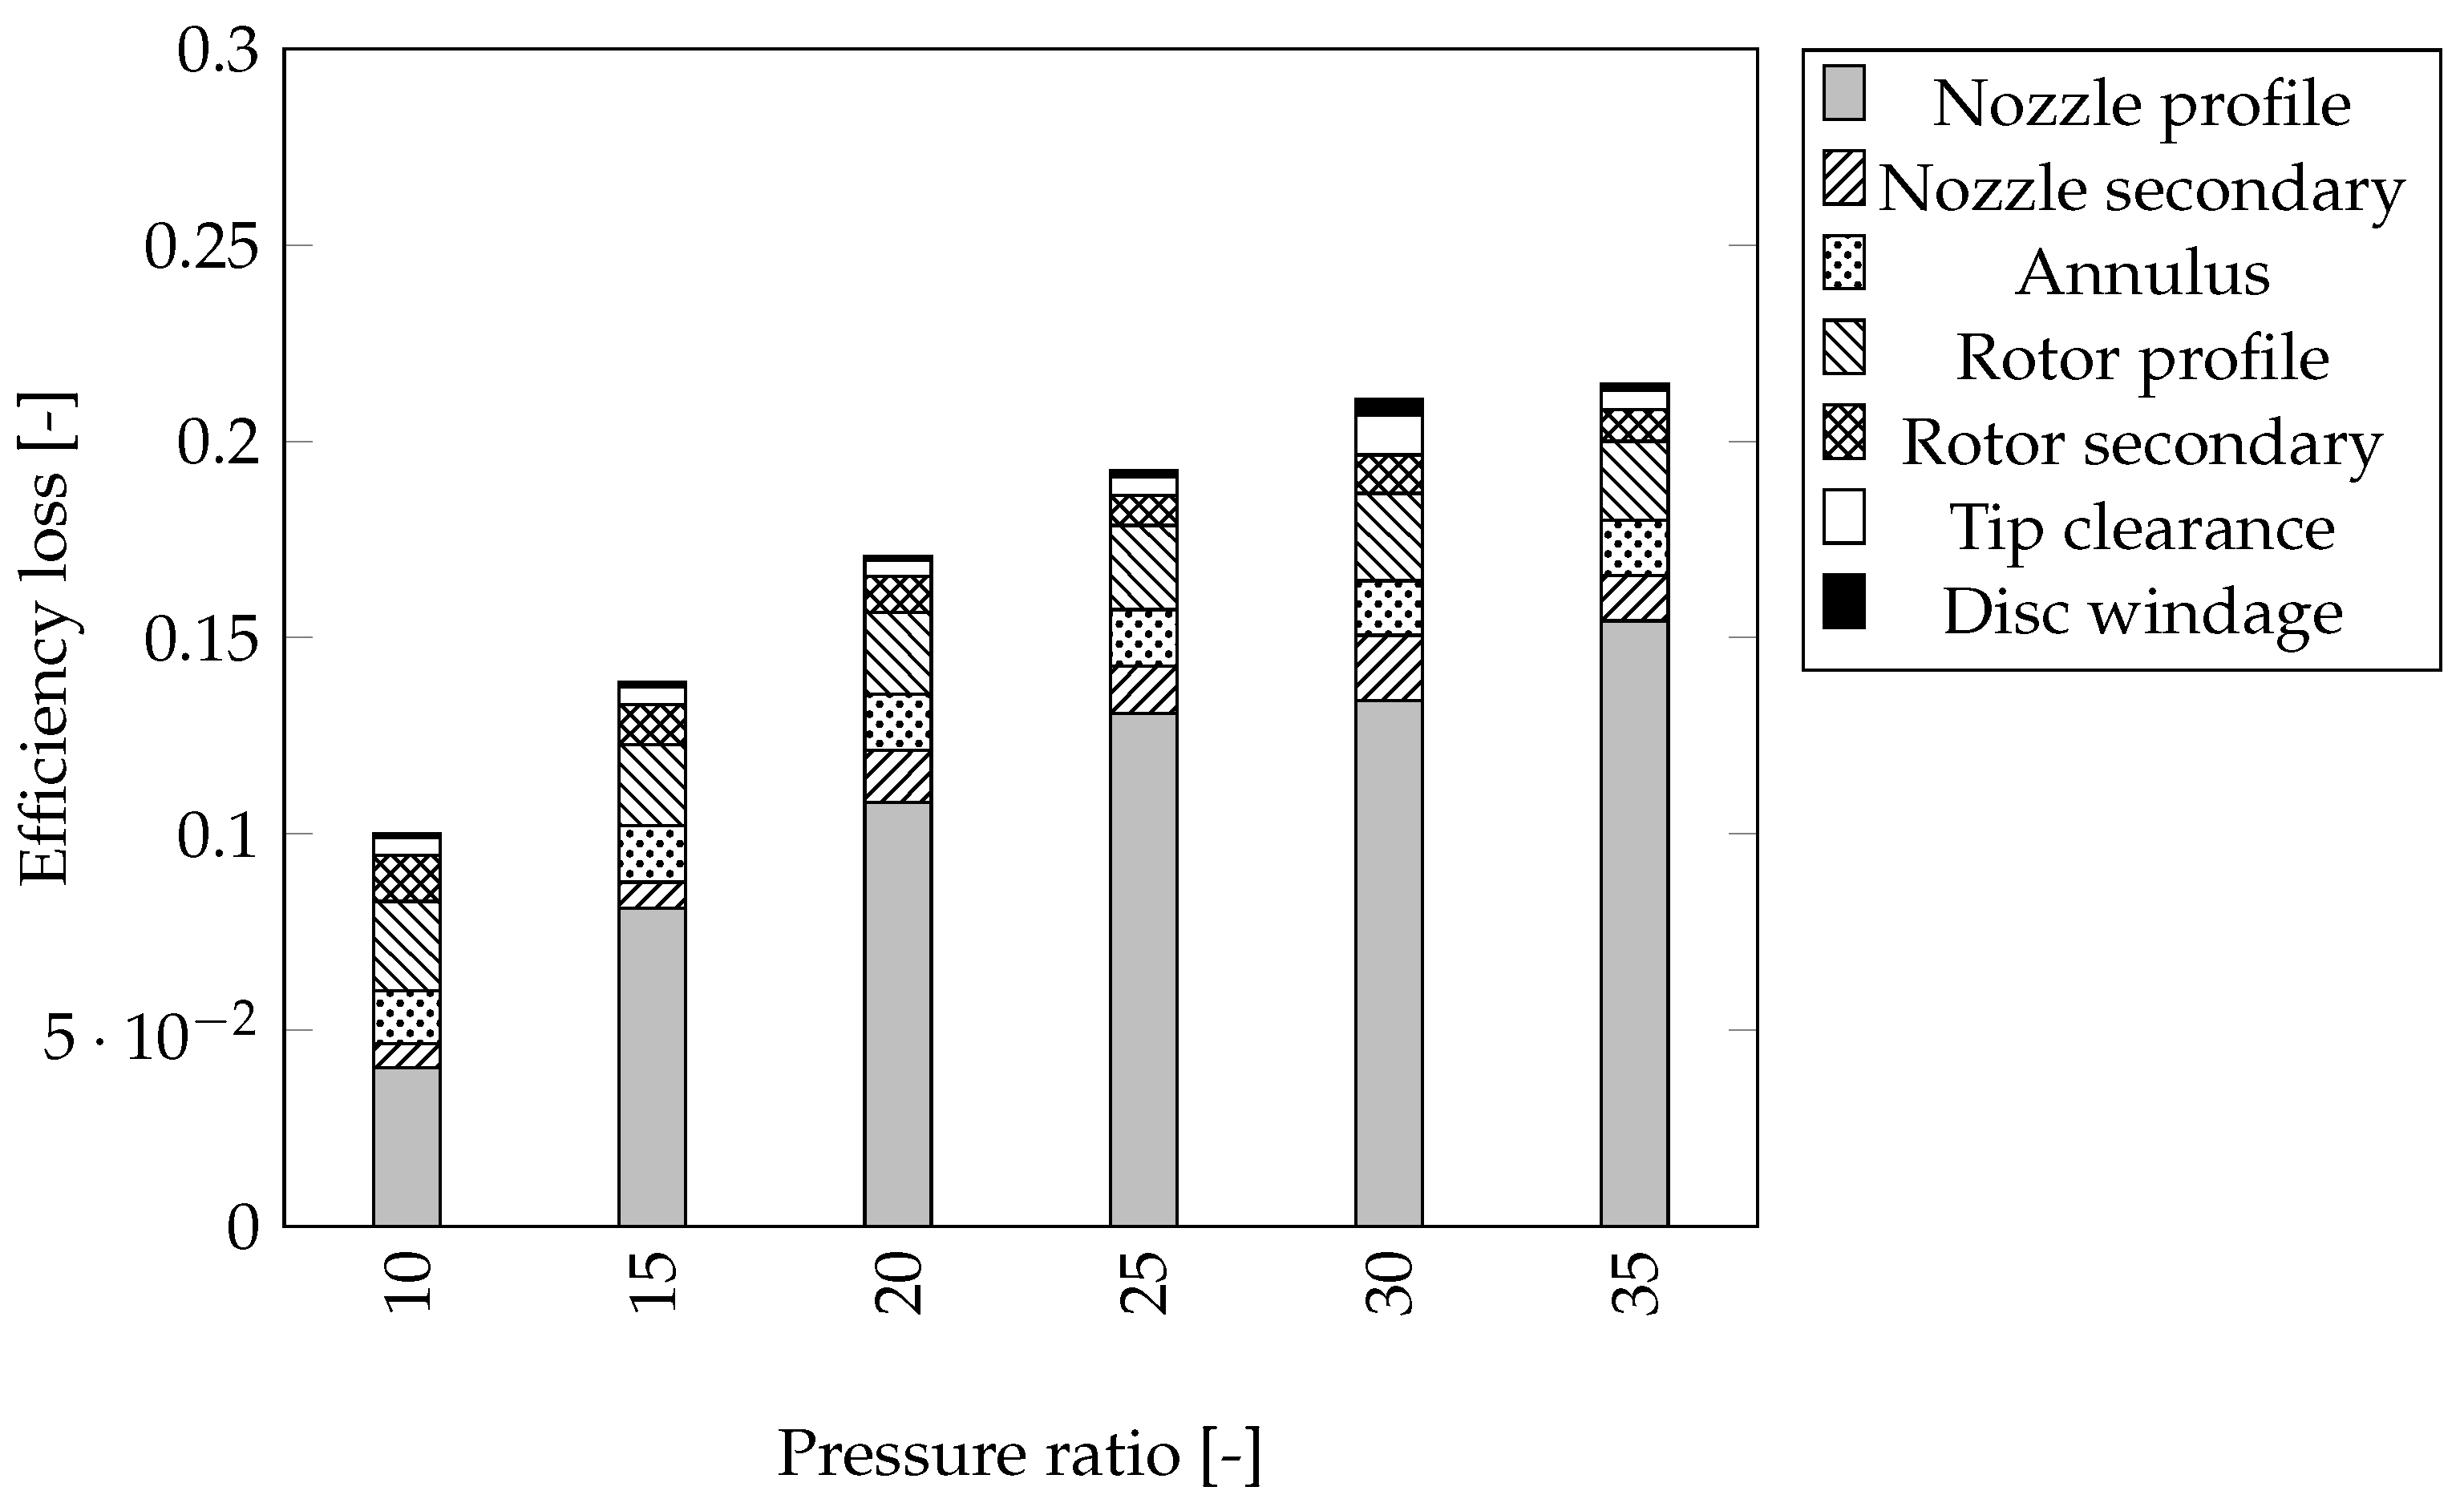
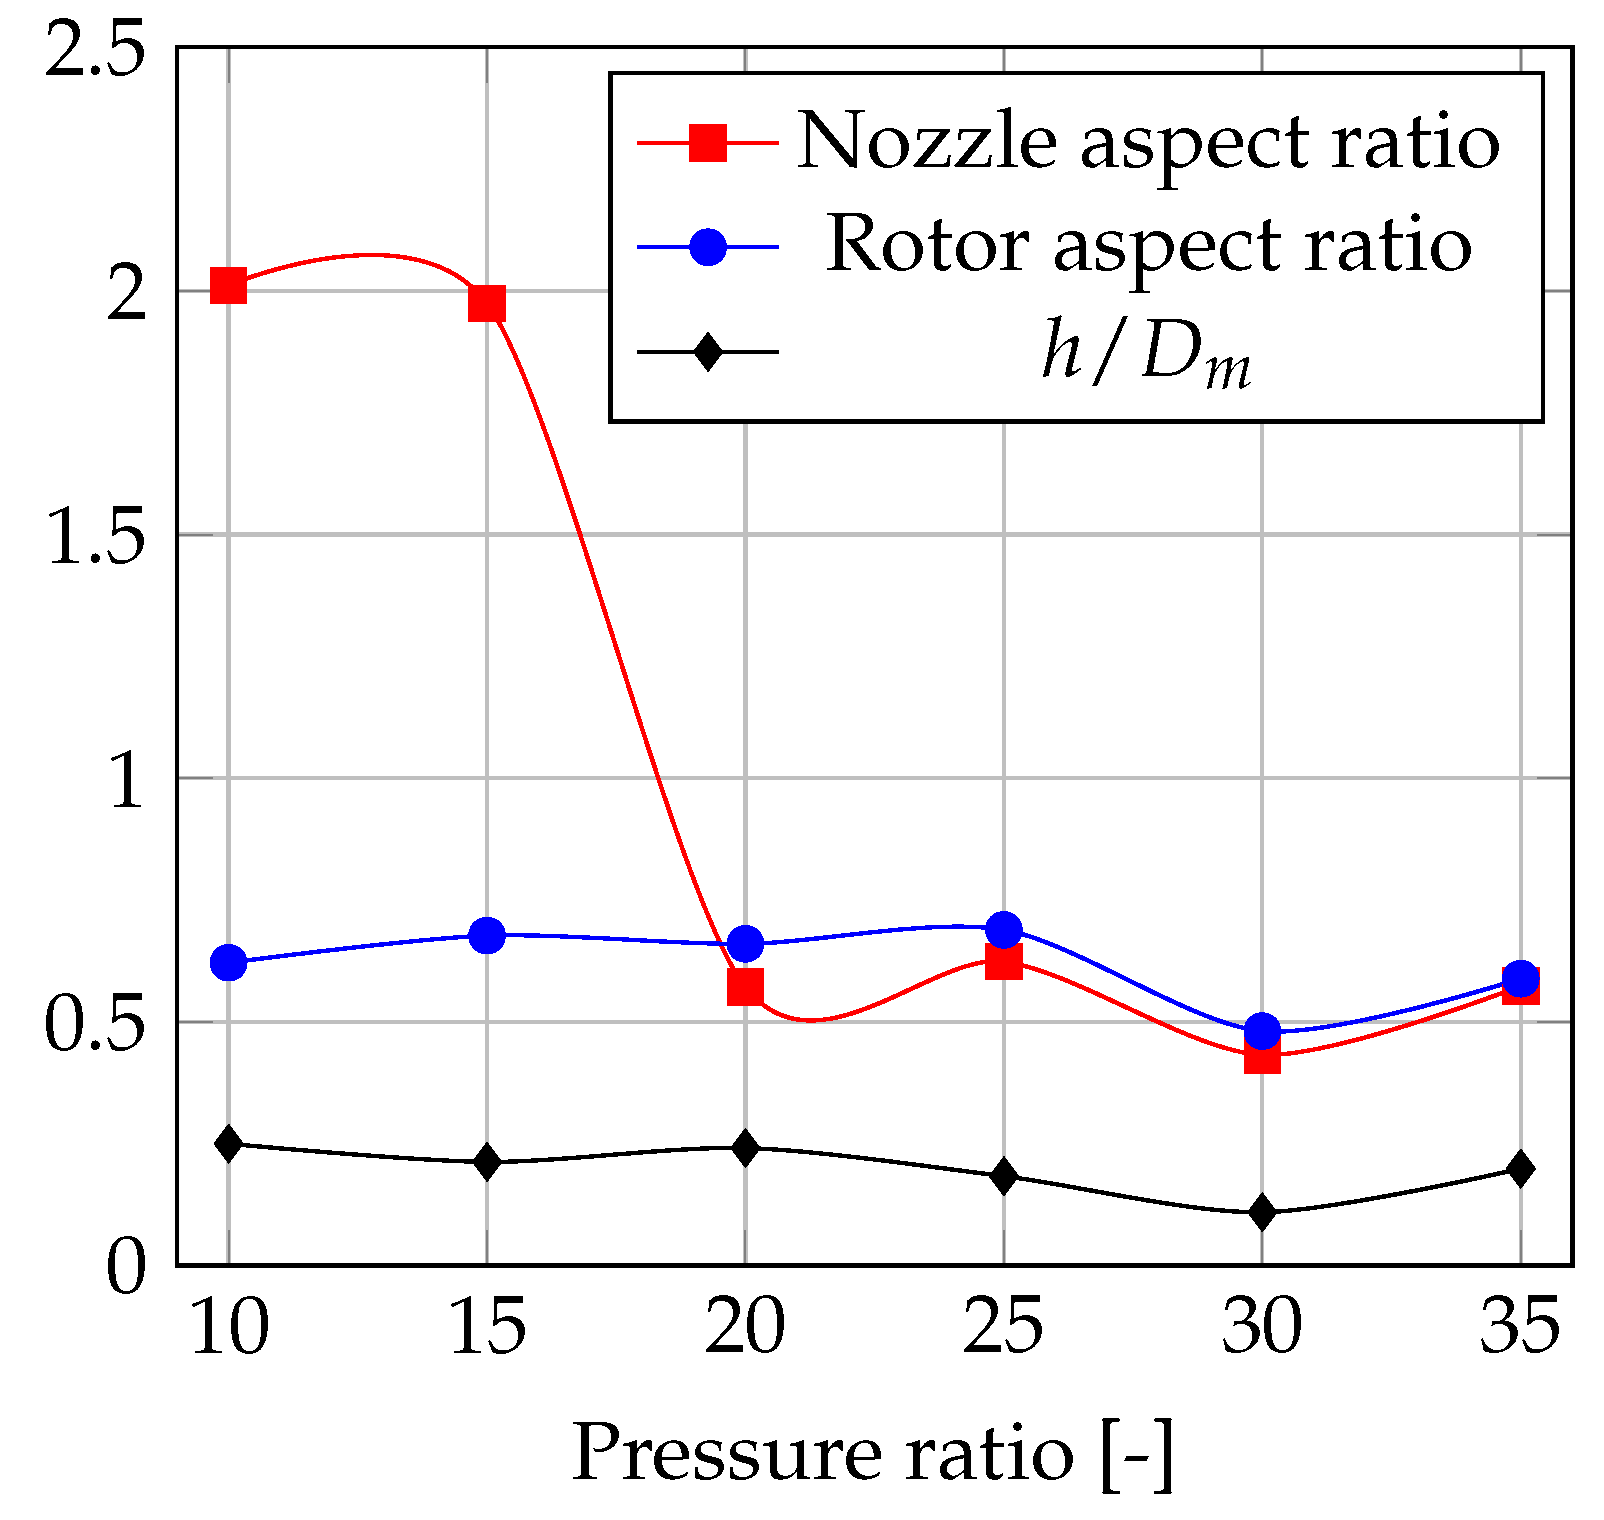
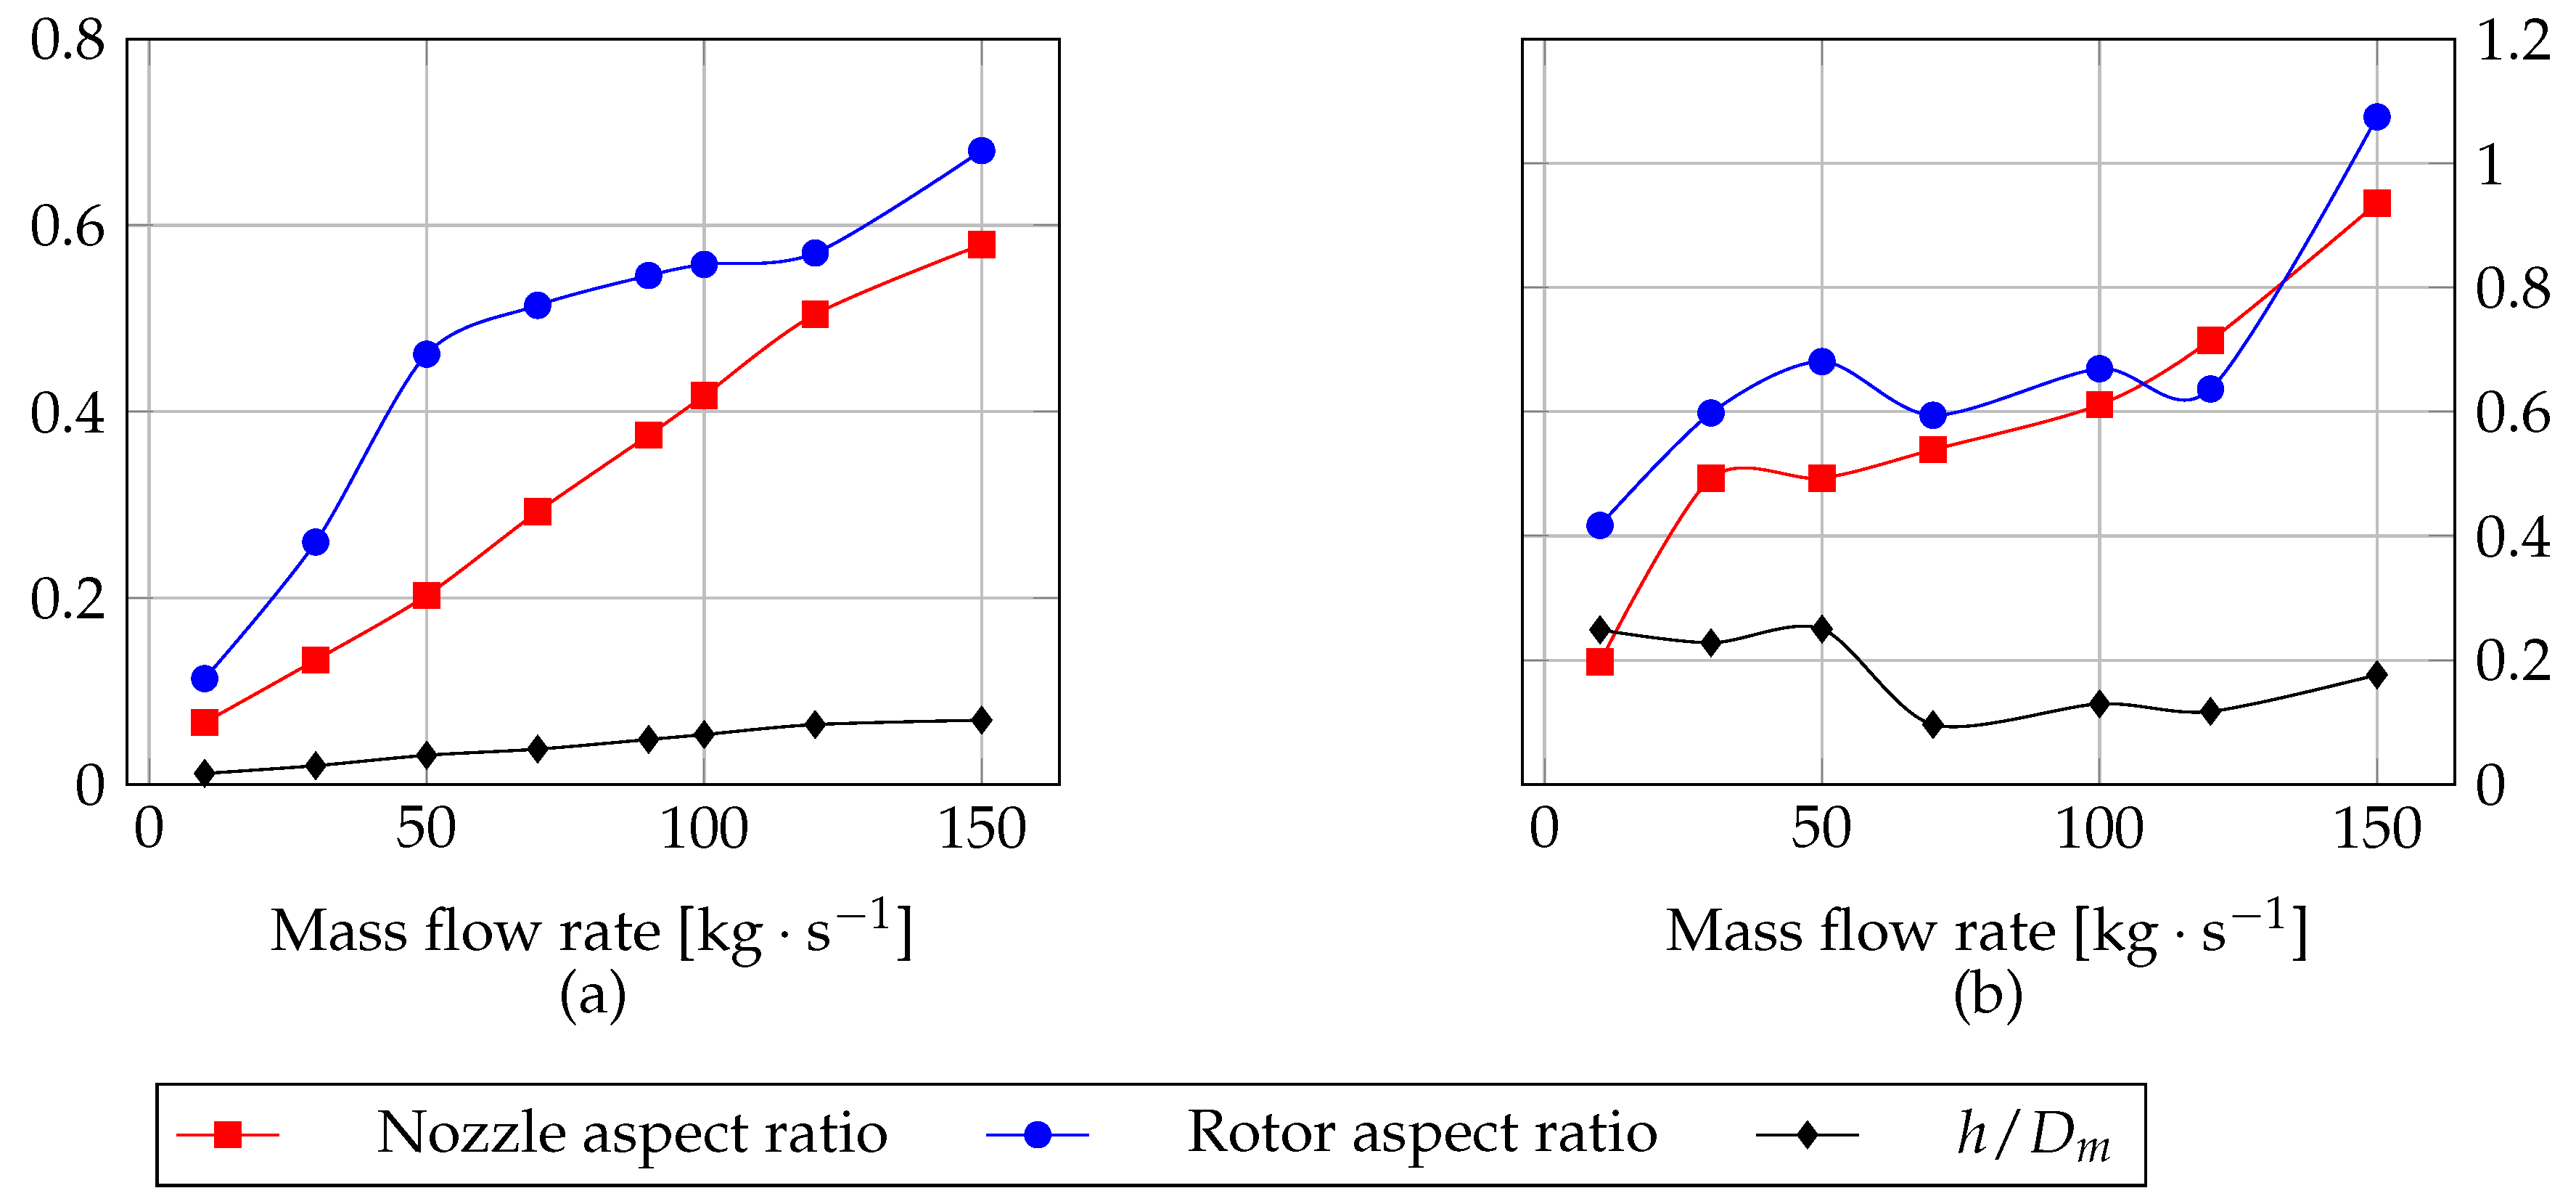
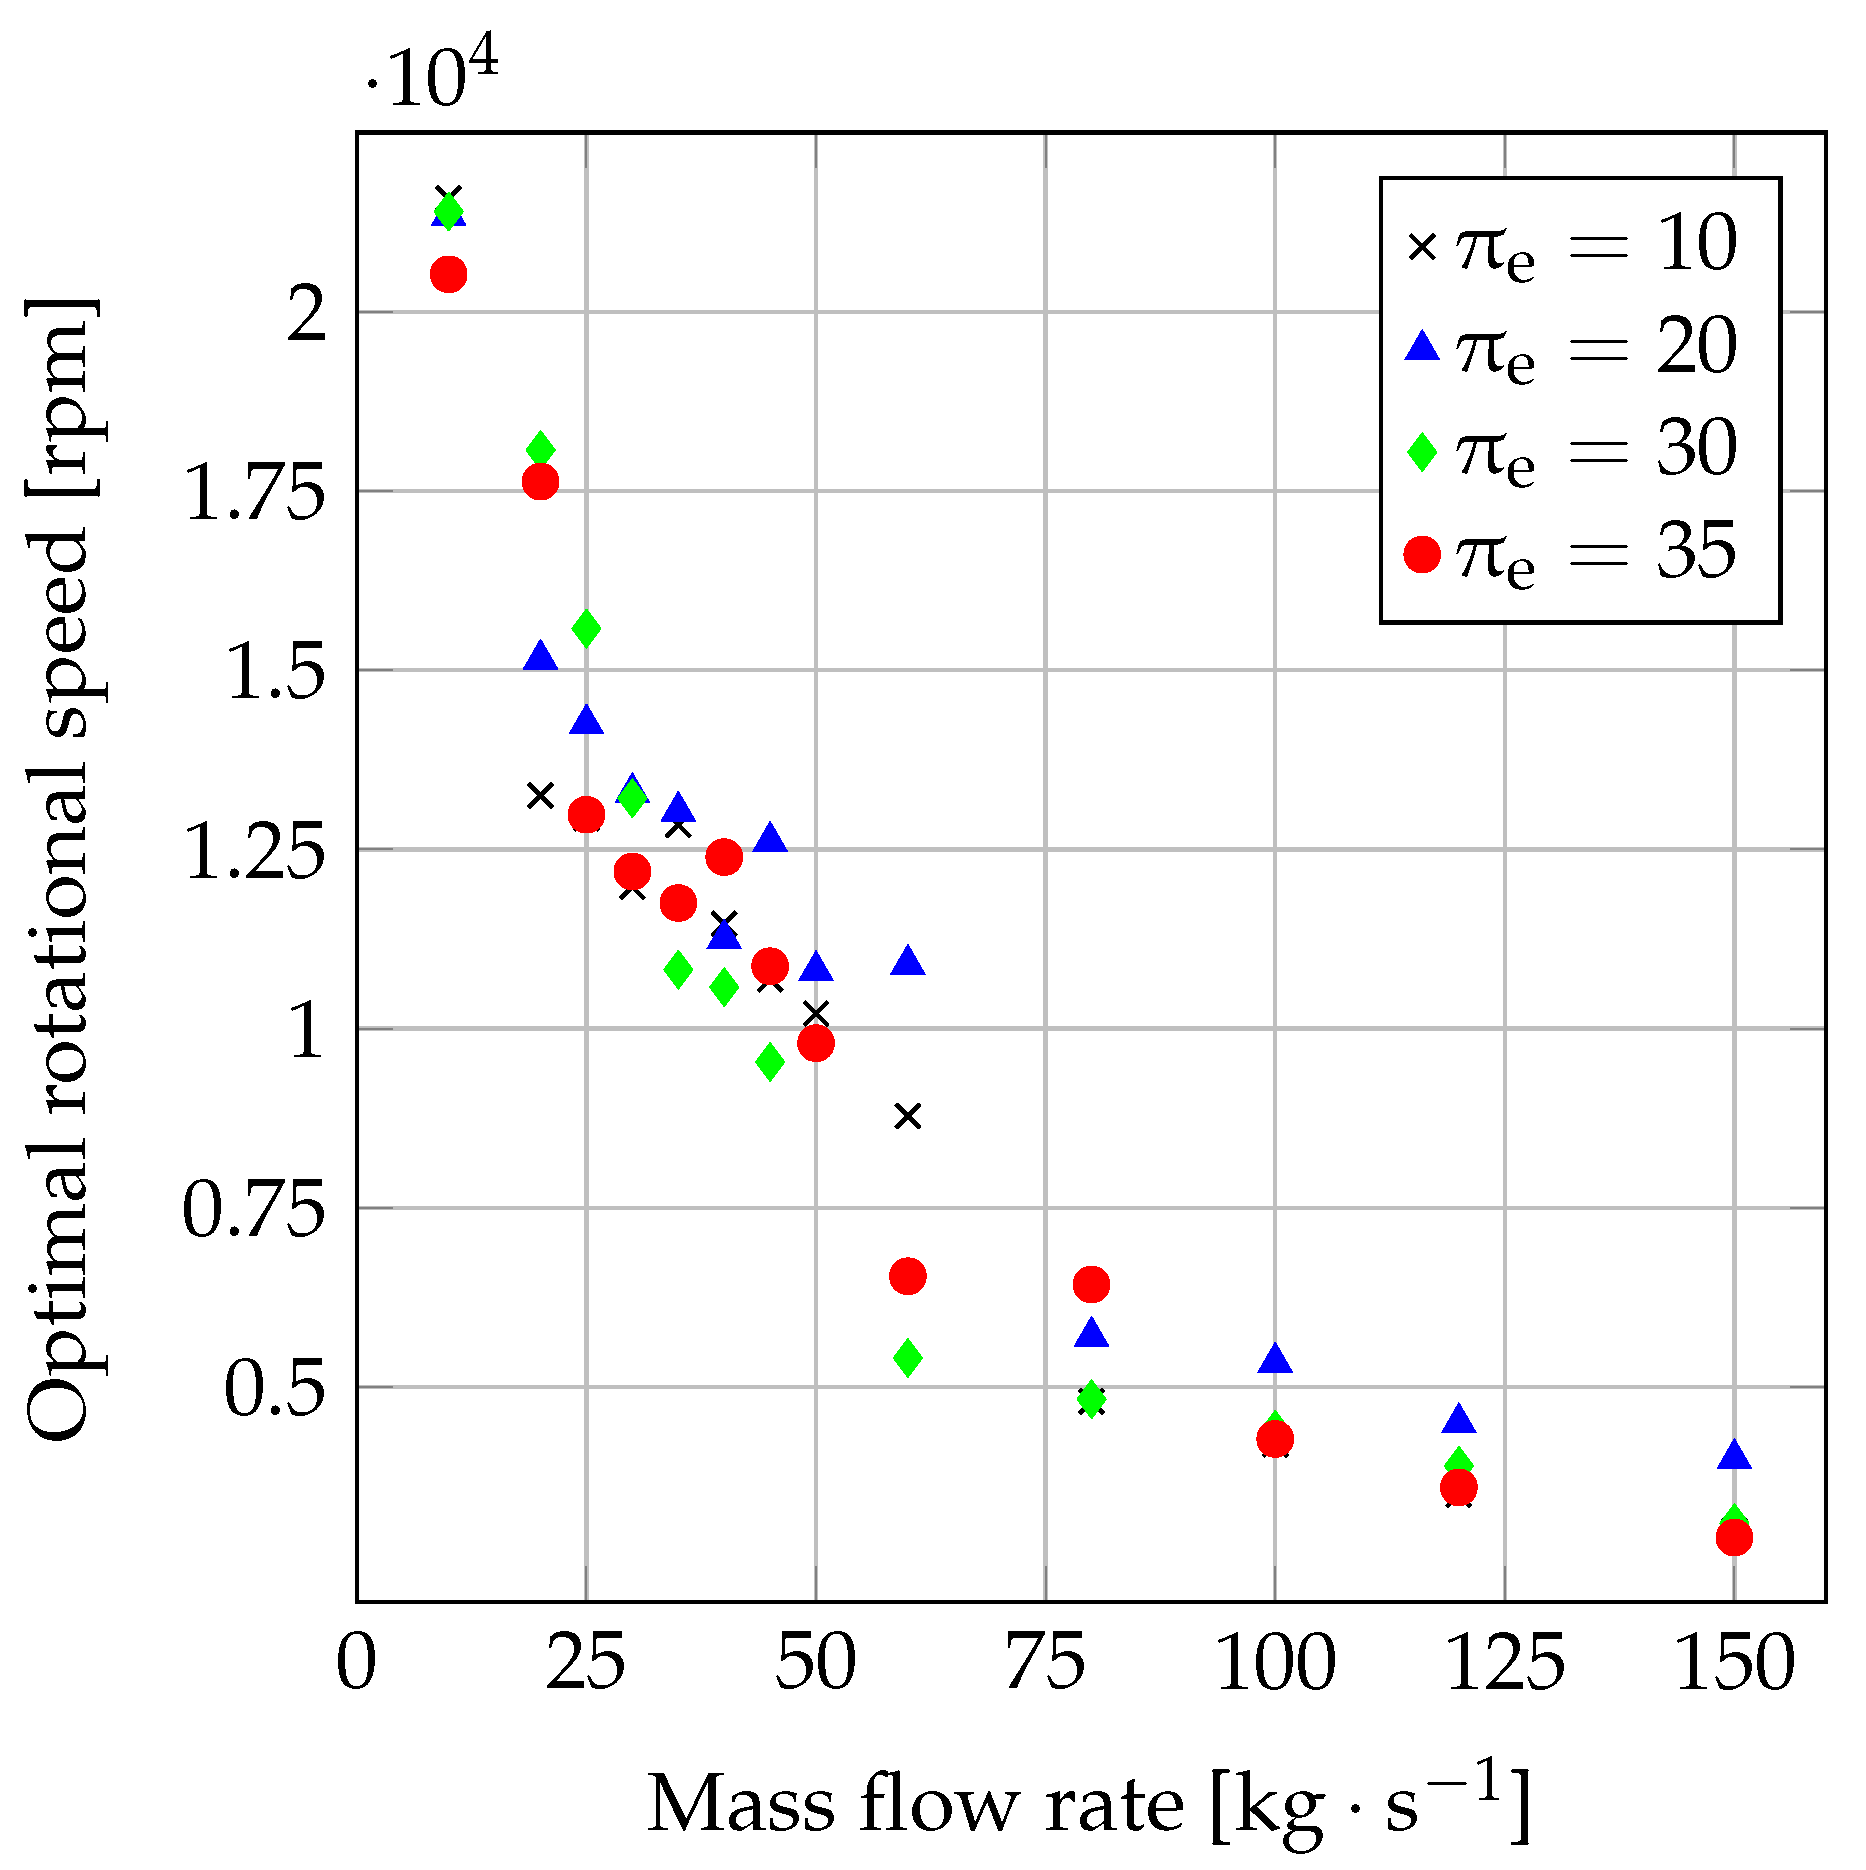
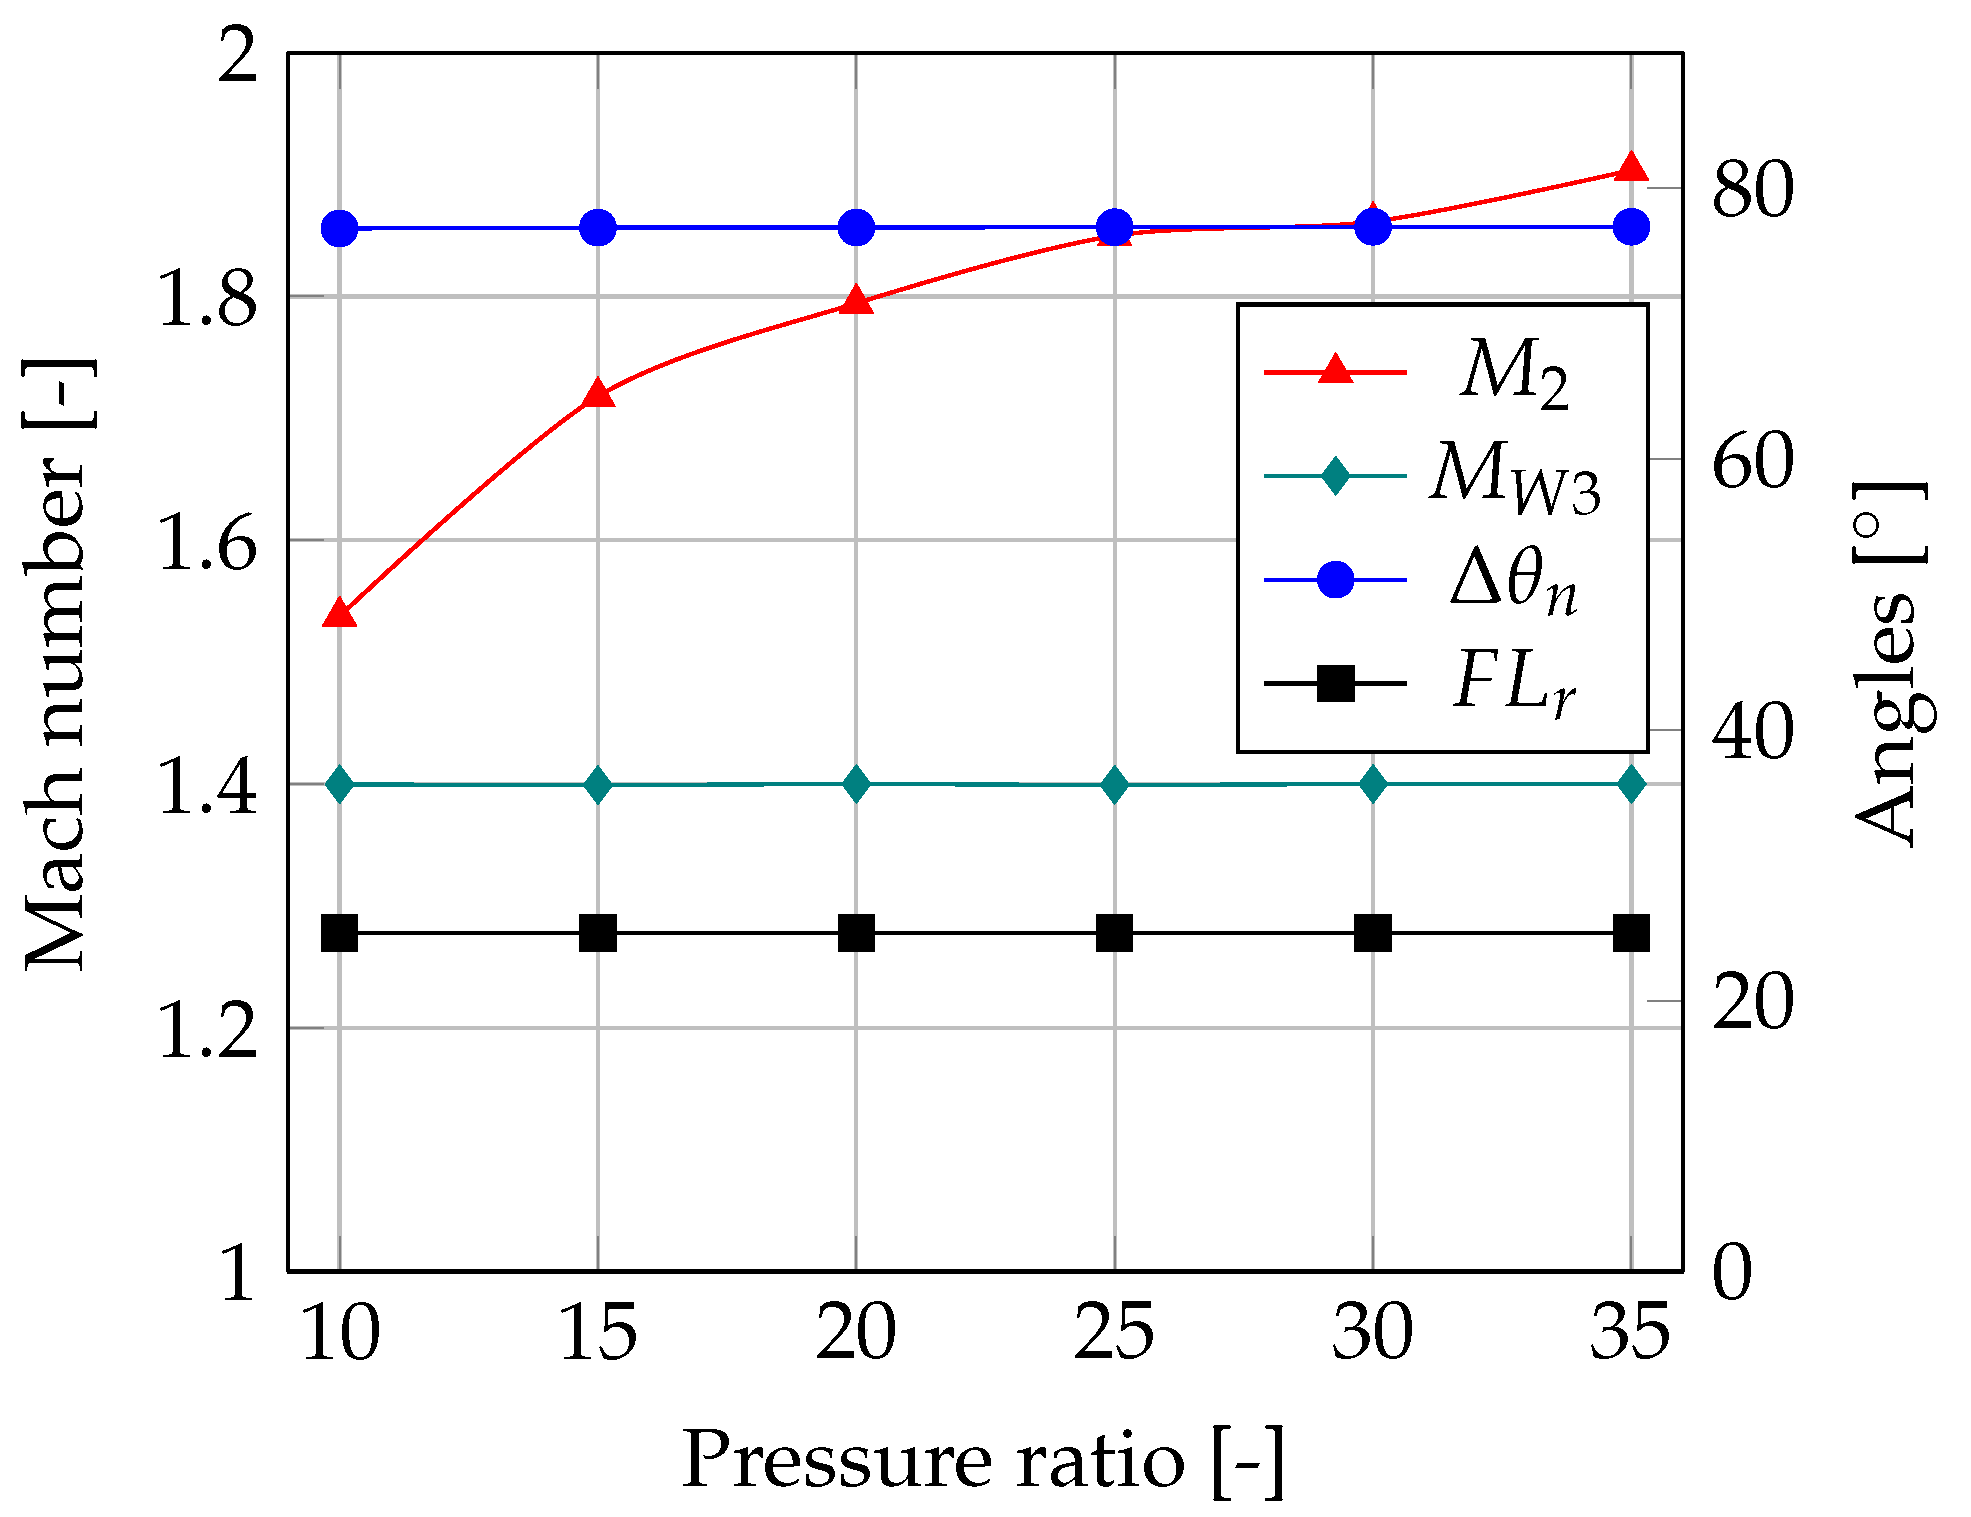
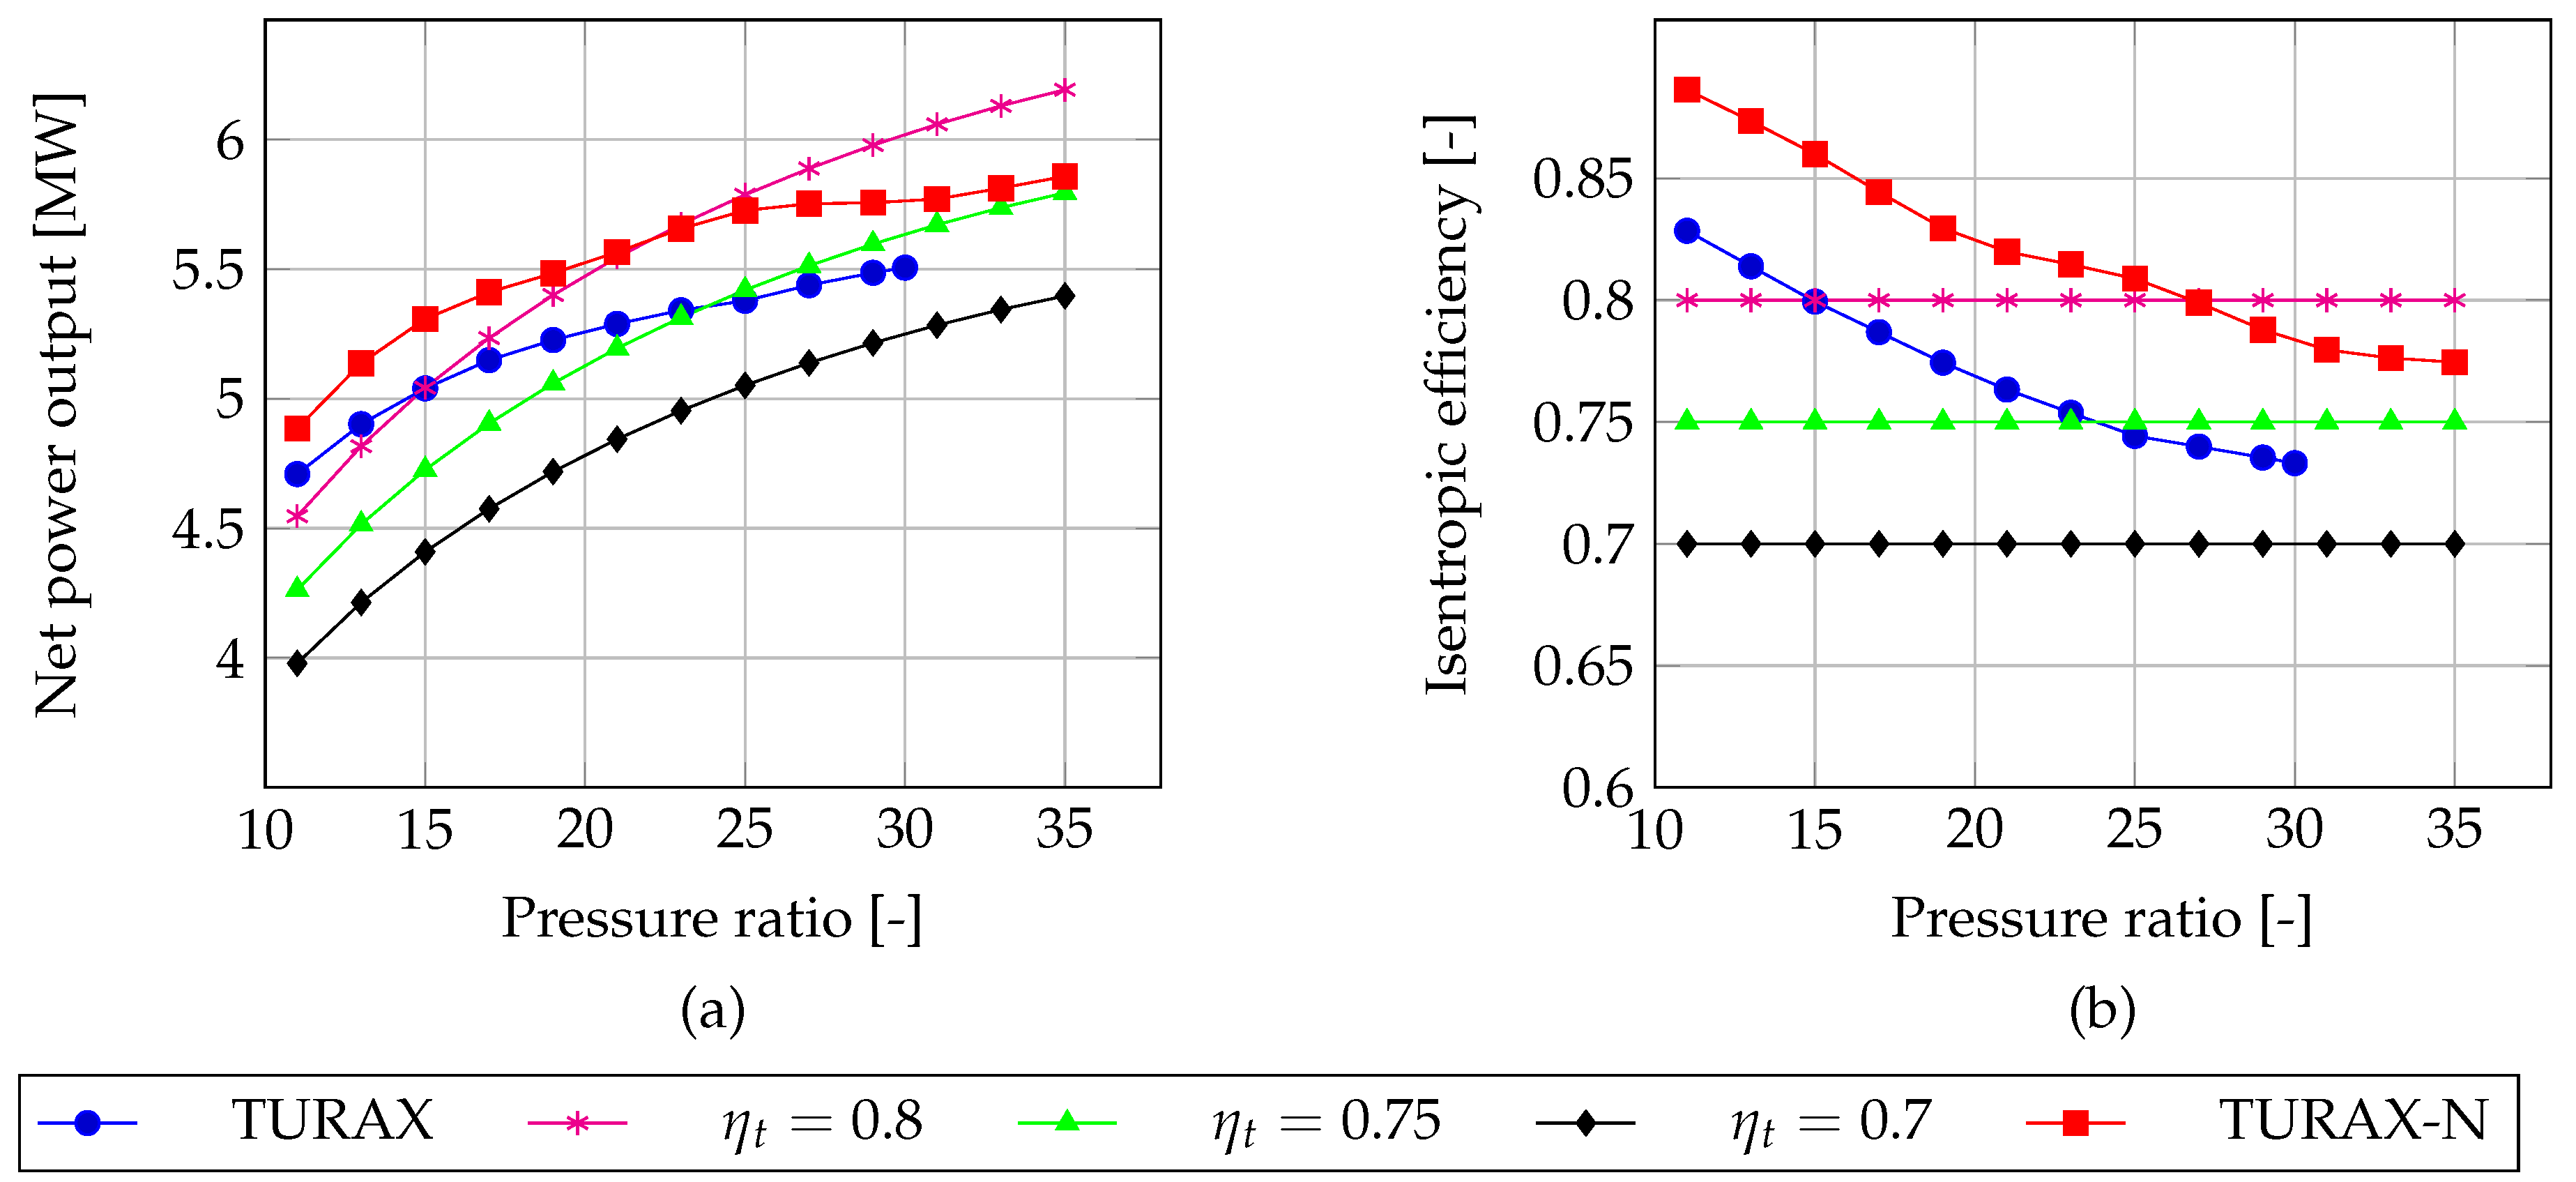
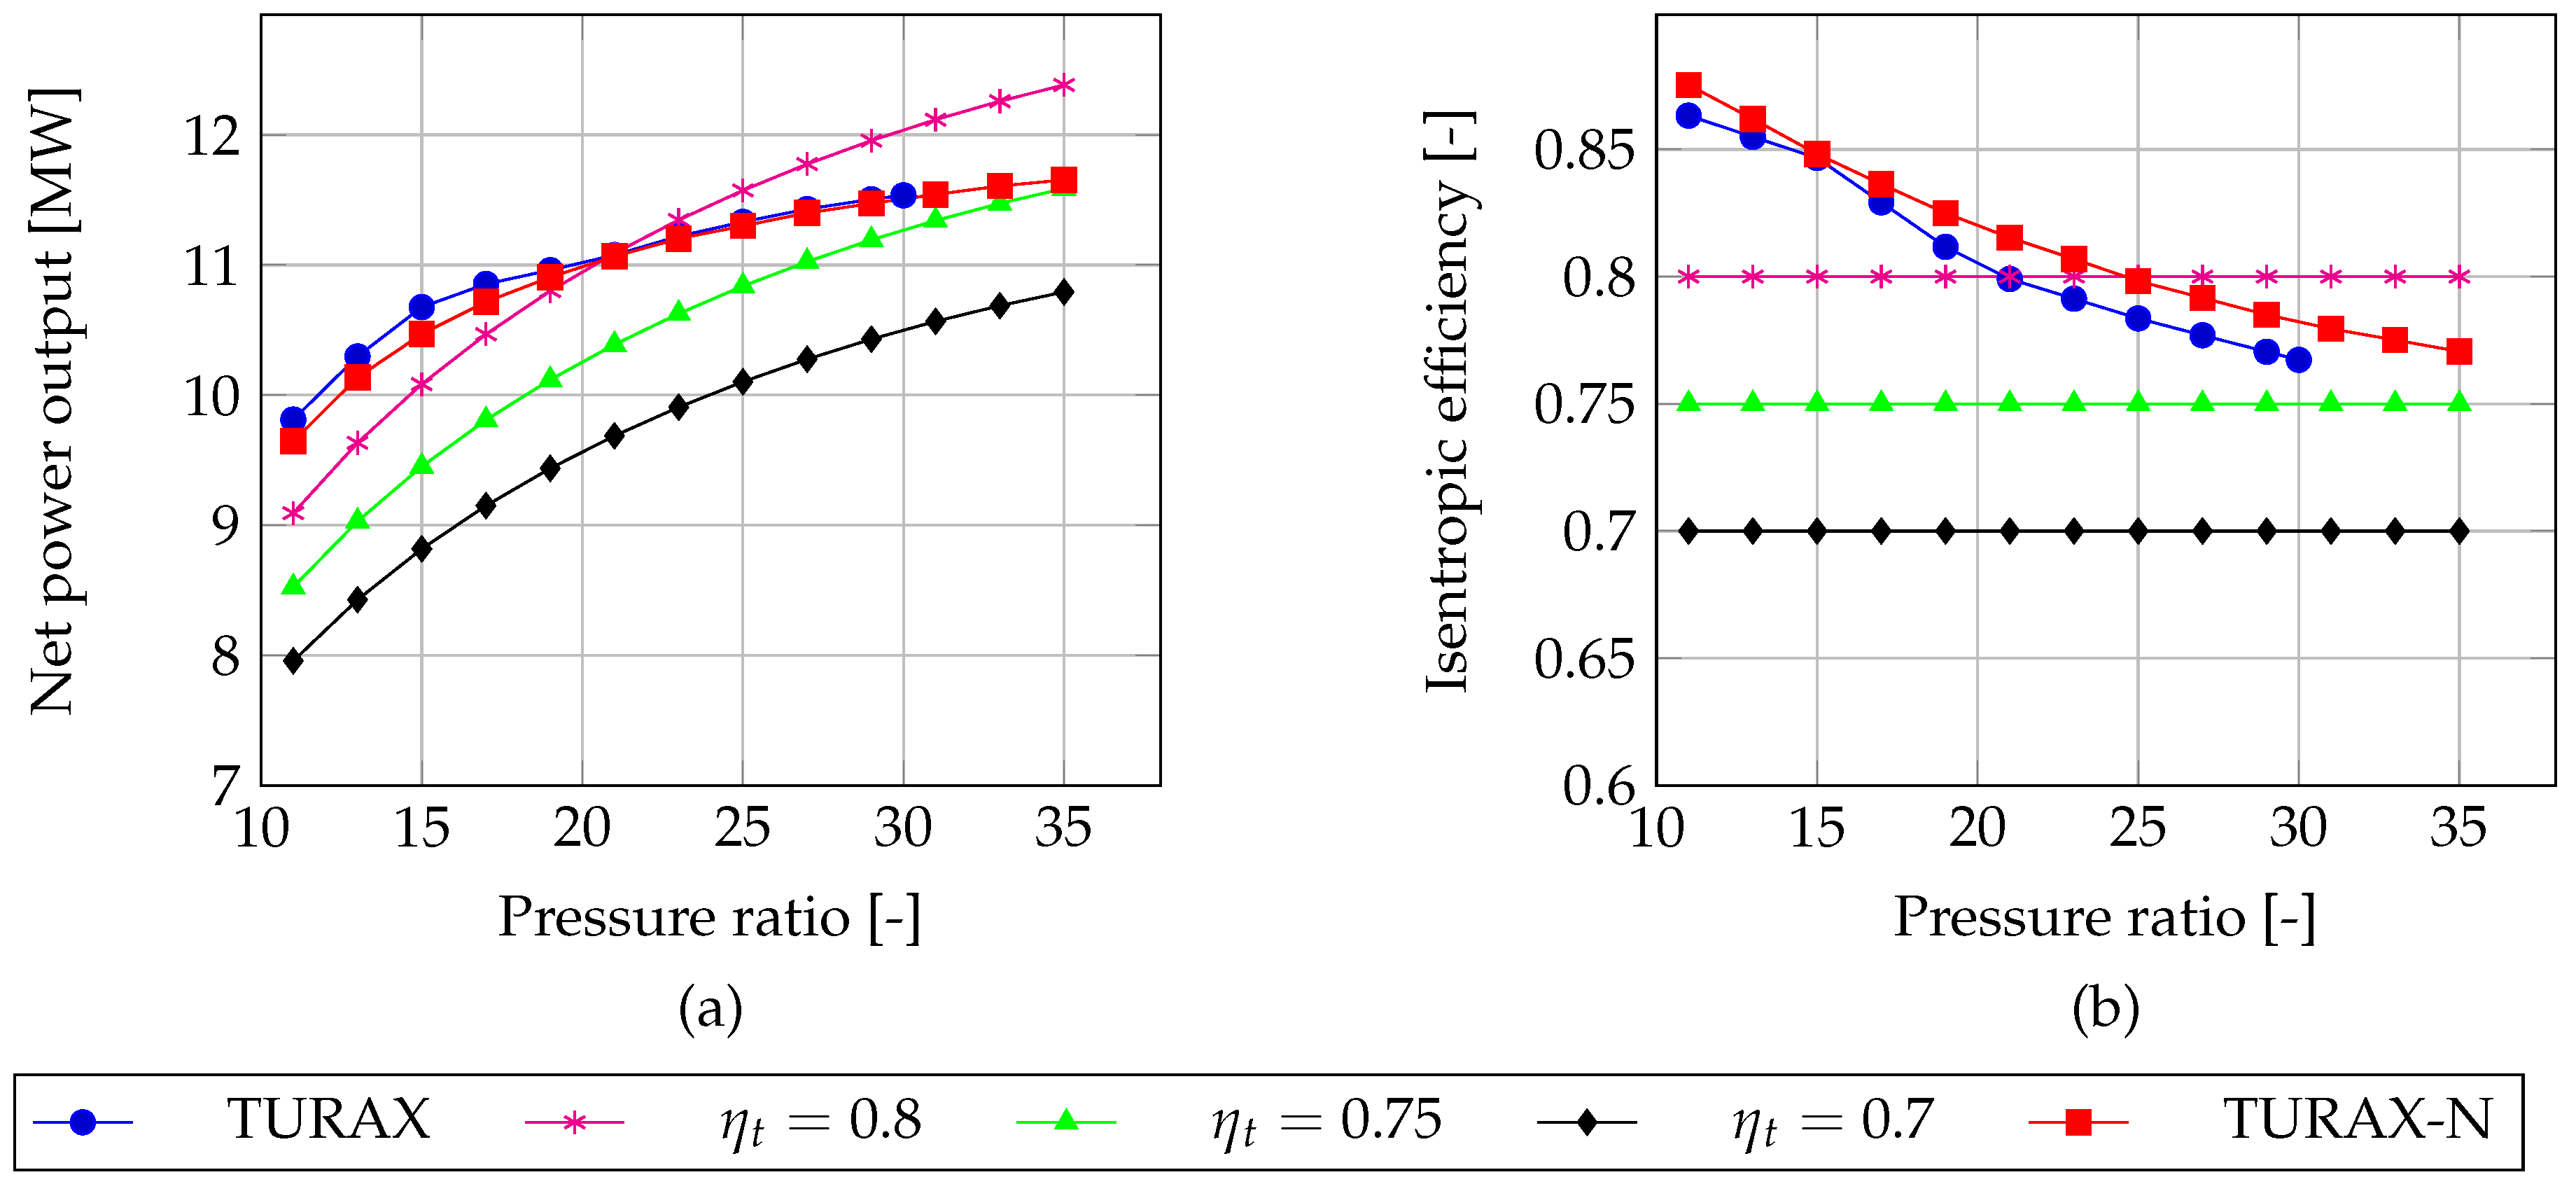
4. Results and Discussion
5. Conclusions
Acknowledgments
Author Contributions
Conflicts of Interest
Nomenclature
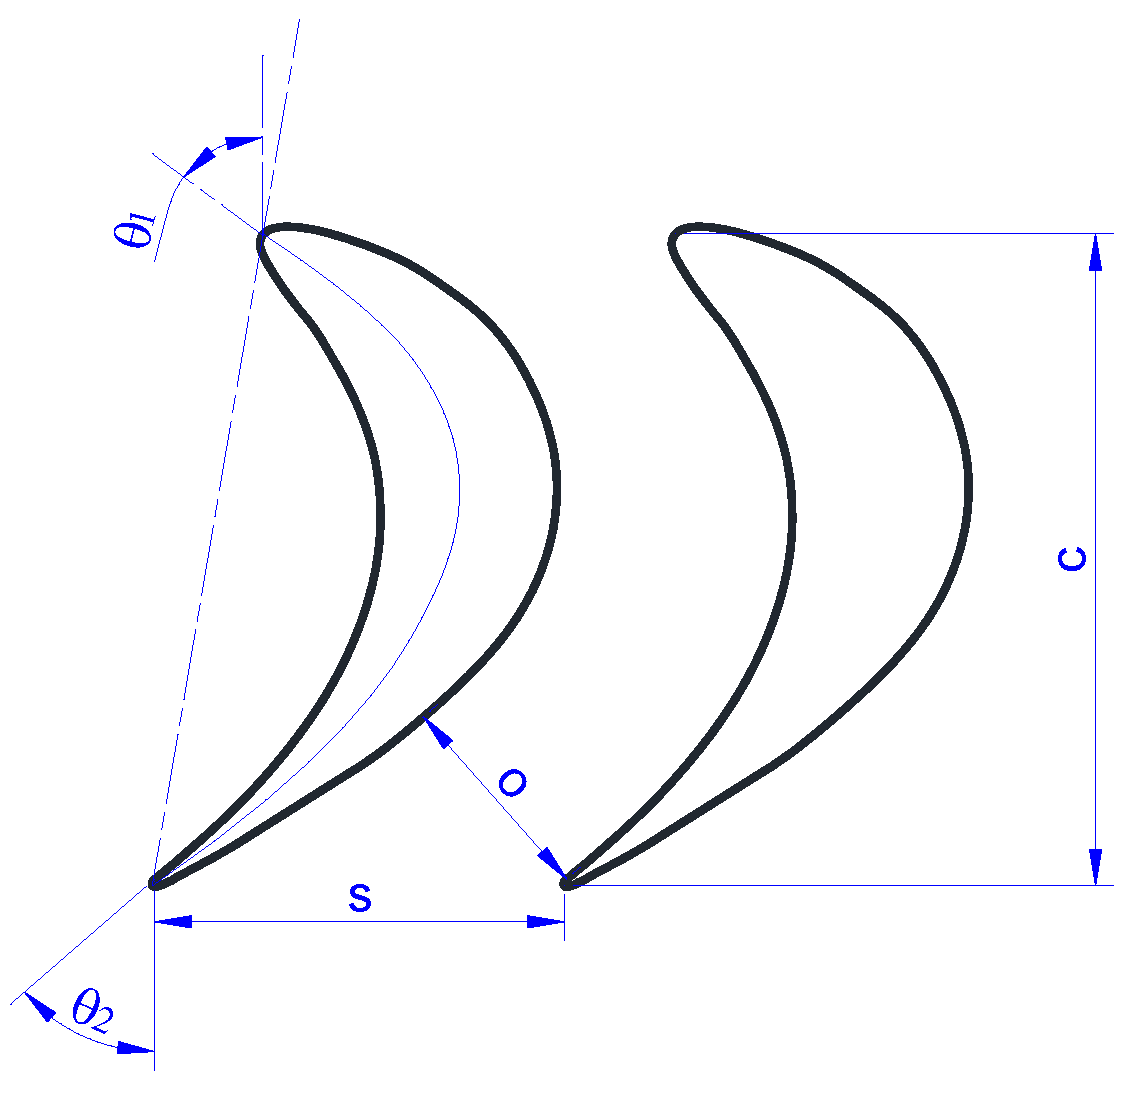
| C | Absolute fluid velocity () |
| D | Turbine diameter () |
Flare angle () | |
| M | Mach number (-) |
| N | Rotational speed () |
| U | Peripheral velocity () |
| W | Relative fluid velocity () |
Array of the optimizing variables | |
| c | Axial chord () |
| h | Blade height () |
| o | Blade opening () |
| p | Pressure () |
| s | Blade pitch () |
Abbreviations and Acronyms
| CC | Combustion chamber |
| GEN | Electric generator |
| GPS | Global pattern search |
| HPC | High pressure compressor |
| HPT | High pressure turbine |
| LPC | Low pressure compressor |
| LPT | Low pressure turbine |
| ORC | Organic Rankine cycle |
| OTB | Once-through boiler |
| PSO | Particle swarm optimization |
| PT | Power turbine |
| TUR | Organic Rankine cycle turbine |
Greek Letters
Blade deflection () | |
Turbine isentropic efficiency (-) | |
Pressure ratio (-) | |
Stage loading coefficient (-) | |
Blade angle () |
Subscripts
| 1 | Nozzle inlet |
| 2 | Rotor inlet |
| 3 | Rotor outlet |
| a | Axial component |
| m | Referred to the average diameter |
Minimum opening | |
| n | Nozzle |
| r | Rotor |
| W | Relative velocity |
References
- Colonna, P.; Casati, E.; Trapp, C.; Mathijssen, T.; Larjola, J.; Turunen-Saaresti, T.; Uusitalo, A. Organic Rankine Cycle Power Systems: From the Concept to Current Technology, Applications, and an Outlook to the Future. J. Eng. Gas Turbines Power 2015, 137, 1–19. [Google Scholar] [CrossRef]
- Lang, W.; Colonna, P.; Almbauer, R. Assessment of waste heat recovery from a heavy-duty truck engine by means of an ORC turbogenerator. J. Eng. Gas Turbines Power 2013, 135, 1–10. [Google Scholar]
- Casati, E.; Galli, A.; Colonna, P. Thermal energy storage for solar-powered organic Rankine cycle engines. Sol. Energy 2013, 96, 205–219. [Google Scholar] [CrossRef]
- Pierobon, L.; Nguyen, T.V.; Larsen, U.; Haglind, F.; Elmegaard, B. Multi-objective optimization of organic Rankine cycles for waste heat recovery: Application in an offshore platform. Energy 2013, 58, 538–549. [Google Scholar] [Green Version]
- Quoilin, S.; Orosz, M.; Hemond, H.; Lemort, V. Performance and design optimization of a low-cost solar organic Rankine cycle for remote power generation. Sol. Energy 2011, 85, 955–966. [Google Scholar]
- Macchi, E. Design criteria for turbines operating with fluids having a low speed of sound. Von Karman Inst. Fluid Dyn. 1977, 2, 1–64. [Google Scholar]
- Larsen, U.; Pierobon, L.; Haglind, F.; Gabrielii, C. Design and optimisation of organic Rankine cycles for waste heat recovery in marine applications using the principles of natural selection. Energy 2013, 55, 803–812. [Google Scholar] [CrossRef] [Green Version]
- Andreasen, J.G.; Larsen, U.; Knudsen, T.; Pierobon, L.; Haglind, F. Selection and optimization of pure and mixed working fluids for low grade heat utilization using organic Rankine cycles. Energy 2014, 73, 204–213. [Google Scholar] [CrossRef] [Green Version]
- Kang, S.H. Design and experimental study of ORC (organic Rankine cycle) and radial turbine using R245fa working fluid. Energy 2012, 41, 514–524. [Google Scholar] [CrossRef]
- Invernizzi, C.; Iora, P.; Silva, P. Bottoming micro-Rankine cycles for micro-gas turbines. Appl. Therm. Eng. 2007, 27, 100–110. [Google Scholar] [CrossRef]
- Astolfi, M.; Romano, M.C.; Bombarda, P.; Macchi, E. Binary ORC (Organic Rankine Cycles) power plants for the exploitation of medium low temperature geothermal sources - Part B: Techno-economic optimization. Energy 2014, 66, 435–446. [Google Scholar] [CrossRef]
- Astolfi, M.; Macchi, E. Efficiency correlations for axial flow turbines working with non-conventional fluids. In Proceedings of the 3rd International Seminar on ORC Power Systems, Brussels, Belgium, 12–14 October 2015; pp. 1–12.
- Meroni, A.; La Seta, A.; Andreasen, J.G.; Pierobon, L.; Persico, G.; Haglind, F. Combined Turbine and Cycle Optimization for Organic Rankine Cycle Power Systems-Part A: Turbine Model. Energies 2016, 9. [Google Scholar] [CrossRef] [Green Version]
- Uusitalo, A.; Turunen-Saaresti, T.; Gronman, A.; Honkatukia, J.; Backman, J. Combined Thermodynamic and Turbine Design Analysis of Small Capacity Waste Heat Recovery ORC. In Proceedings of the 3rd International Seminar on ORC Power Systems, Brussels, Belgium, 12–14 October 2015; pp. 1–10.
- Ventura, C.A.d.M.; Rowlands, A.S. Design and performance estimation of radial inflow turbines coupled with a thermodynamic cycle analysis procedure. In Proceedings of the 2nd International Seminar on ORC Power Systems, Rotterdam, The Netherlands, 7–8 October 2013; pp. 1–5.
- Siemens. Gas Turbine SGT-500. Available online: http://www.energy.siemens.com/nl/en/fossil-power-generation/gas-turbines/sgt-500.htm#content=Description (accessed on 16 May 2016).
- Del Turco, P.; Asti, A.; Del Greco, A.; Bacci, A.; Landi, G.; Seghi, G. The ORegen waste heat recovery cycle: Reducing the CO2 footprint by means of overall cycle efficiency improvement. In Proceedings of the ASME Turbo Expo 2011, Vancouver, BC, Canada, 6–10 June 2011; pp. 547–556.
- Pini, M.; Persico, G.; Casati, E.; Dossena, V. Preliminary design of a Centrifugal Turbine for Organic Rankine Cycles applications. J. Eng. Gas Turbines Power 2013, 135, 1–9. [Google Scholar] [CrossRef]
- Ainley, D.; Mathieson, G. An examination of the flow and pressure losses in blade rows of axial-flow turbines; Technical Report; Ministry of Supply-Aeronautical Research Council: London, UK, 1951. [Google Scholar]
- Craig, H.; Cox, H. Performance estimation of axial flow turbines. Proc. Inst. Mech. Eng. 1970, 185, 407–424. [Google Scholar] [CrossRef]
- The MathWorks, Inc. Optimization Toolbox TM User’s Guide; The MathWorks, Inc.: Natick, MA, USA, 2014. [Google Scholar]
- Eberhart, R.C.; Shi, Y. Particle swarm optimization: developments, applications and resources. In Proceedings of the 2001 Congress on Evolutionary Computation, Seoul, Korea, 27–30 May 2001; Volume 1, pp. 81–86.
- Audet, C.; Dennis, J.E. Analysis of generalized pattern searches. SIAM J. Opt. 2003, 13, 889–903. [Google Scholar] [CrossRef]
- Deb, K. Multi-Objective Optimization Using Evolutionary Algorithms; John Wiley & Sons, Inc.: West Sussex, UK, 2001; pp. 13–46. [Google Scholar]
- Pasquale, D.; Persico, G.; Rebay, S. Optimization of Turbomachinery Flow Surfaces Applying a CFD-based Throughflow Method. J. Turbomach. 2013, 136, 1–11. [Google Scholar] [CrossRef]
- Mahalakshmi, M.; Kalaivani, P.; Nesamalar, E. A Review on Genetic Algorithm and its Applications. Int. J. Comput. Algorithm 2013, 2, 415–423. [Google Scholar]
- Eberhart, R.C.; Shi, Y.; Porto, V.W.; Saravanan, N.; Waagen, D.; Eiben, A.E. Comparison between genetic algorithms and particle swarm optimization. In Evolutionary Programming VII; Springer: Berlin/Heidelberg, Germany, 1998; pp. 611–616. [Google Scholar]
- Shi, Y.; Eberhart, R.C. A modified particle swarm optimizer. In Proceedings of the 1998 IEEE International Conference on Evolutionary Computation, Anchorage, AK, USA, 4–9 May 1998; pp. 69–73.
- Macchi, E.; Perdichizzi, A. Efficiency prediction for axial-flow turbines operating with nonconventional fluids. J. Eng. Gas Turbine Power 1981, 103, 718–724. [Google Scholar] [CrossRef]
- Vavra, M.H. Axial Flow Turbines. Von Karman Inst. Fluid Dyn. 1969, 15, 1–117. [Google Scholar]
- Saravanamuttoo, H.I.H.; Rogers, G.F.C.; Cohen, H. Gas Turbine Theory; Pearson Education: Upper Saddle River, NJ, USA, 2001. [Google Scholar]
- Pasetti, M.; Invernizzi, C.M.; Iora, P. Thermal stability of working fluids for organic Rankine cycles: An improved survey method and experimental results for cyclopentane, isopentane and n-butane. Appl. Therm. Eng. 2014, 73, 762–772. [Google Scholar] [CrossRef]
- Walsh, P.; Fletcher, P. Gas Turbine Performance; Blackwell Science: Oxford, UK, 1998; pp. 1–628. [Google Scholar]


| Decision Variable | Lower Bound | Upper Bound |
|---|---|---|
| Stage loading coefficient (-) | 2 | 6 |
| Nozzle minimum opening (mm) | 2 | 100 |
| Rotor opening (mm) | 2 | 100 |
| Nozzle axial chord (mm) | 10 | 100 |
| Rotor axial chord (mm) | 10 | 100 |
| Nozzle outlet opening-to-pitch ratio (-) | 0.225 | 0.7 |
| Rotor outlet opening-to-pitch ratio (-) | 0.225 | 0.7 |
| Stage inlet axial velocity () | 0 | 100 |
| Rotor flow coefficient (-) | 0 | 1 |
| Rotational speed (if optimized) N (rpm) | 2000 | 100,000 |
| Additional constraints | ||
| Relative Mach number at the rotor inlet (-) | 0 | 0.8 |
| Relative Mach number at the rotor outlet (-) | 0 | 1.4 |
| Number of nozzle blades (-) | 10 | 130 |
| Number of rotor blades (-) | 10 | 130 |
| Flare angles () | −25 | 25 |
| Blade height to mean diameter ratio (-) | 0.001 | 0.25 |
| Axial chord to mean diameter ratio (-) | 0.001 | 0.2 |
| Reynolds number (-) | ||
| Fixed parameters | Value | |
| Rotor inlet height/nozzle outlet height (-) | 1 | |
| Mach number for the transition to converging-diverging nozzle (-) | 1.4 | |
| Nozzle trailing edge/pitch (-) | 0.05 | |
| Rotor trailing edge/pitch (-) | 0.05 | |
| Radius of blade rear suction side curvature (m) | ||
| Nozzle-rotor axial clearance (m) | ||
| Blade absolute surface roughness (m) | ||
| Minimum blade trailing edge thickness (m) | ||
| Minimum rotor tip clearance (m) | max |
© 2016 by the authors; licensee MDPI, Basel, Switzerland. This article is an open access article distributed under the terms and conditions of the Creative Commons Attribution (CC-BY) license (http://creativecommons.org/licenses/by/4.0/).
Share and Cite
La Seta, A.; Meroni, A.; Andreasen, J.G.; Pierobon, L.; Persico, G.; Haglind, F. Combined Turbine and Cycle Optimization for Organic Rankine Cycle Power Systems—Part B: Application on a Case Study. Energies 2016, 9, 393. https://doi.org/10.3390/en9060393
La Seta A, Meroni A, Andreasen JG, Pierobon L, Persico G, Haglind F. Combined Turbine and Cycle Optimization for Organic Rankine Cycle Power Systems—Part B: Application on a Case Study. Energies. 2016; 9(6):393. https://doi.org/10.3390/en9060393
Chicago/Turabian StyleLa Seta, Angelo, Andrea Meroni, Jesper Graa Andreasen, Leonardo Pierobon, Giacomo Persico, and Fredrik Haglind. 2016. "Combined Turbine and Cycle Optimization for Organic Rankine Cycle Power Systems—Part B: Application on a Case Study" Energies 9, no. 6: 393. https://doi.org/10.3390/en9060393