Article

A Study on Price-Based Charging Strategy for Electric Vehicles on Expressways

School of Electrical Engineering, Southeast University, No. 2 Sipailou, Nanjing 210096, China
*
Author to whom correspondence should be addressed.
Energies 2016, 9(5), 385; https://doi.org/10.3390/en9050385
Submission received: 28 March 2016 / Revised: 29 April 2016 / Accepted: 5 May 2016 / Published: 19 May 2016

Abstract

:
With the large-scale adoption of electric vehicles (EVs) on expressways, the exploration of a guiding-based charging method to effectively adjust interactions between EVs and the fast charging stations (CSs) is urgently needed. This paper proposes a status-of-use (SOU) price-based charging strategy that can motivate users to charge in advance. A queuing model for a CS cluster was established to verify the effectiveness of the strategy, and then a simulation of traveling and charging conditions of 12,000 pure EVs on the road network from 0:00 to 24:00 was performed according to the related data and using the Monte Carlo method, the Floyd-Warshall algorithm, and the queuing algorithm proposed in this paper. Compared to unordered charging (UC), SOU price-based charging can not only reduce the charging cost and waiting time for users, but also increase the utilization ratio of charging facilities in a CS cluster and thus lower their influence on the power grid and expressway traffic. SOU price-based charging can effectively adjust interactions between EVs and CSs.

1. Introduction

The world energy crisis, global warming, and environmental pollution have become focused problems to which people must find effective solutions. The development and use of electric vehicles (EVs) are widely considered as one of the solutions for energy-saving and emission-reduction in the world [1,2,3]. With the large-scale adoption of EVs on expressways, building fast-charging stations (CSs) (with CS planning technology [4]) will be necessary for people to drive the cars for a long distance. Fast-charging technology is increasingly being developed and improved. Battery-assisted charging system has been developed to improve the fast charging performance [5]. However, low efficiency of fast-charging is a key issue affecting EV adoption [6] (e.g., the Model S is the only EV able to charge at up to 120 kW at present, which corresponds to 273 kilometers of range in about 30 min, and the charging rate is about one-tenth of the refueling rate [7]). Even if there is a great breakthrough in charging technology in the future, the efficiency of fast-charging will be difficult to achieve the goal of high efficiency just like refueling.
On expressways, EVs charging and CSs operation influence each other. If EVs are charged without guidance, some impacts on EVs themselves, CSs, power grid, and expressway network will appear as follows: EVs may be concentrated in a few CSs, thus resulting in congestion in the stations, and on the other hand, some other CSs may have no car to serve; this condition would result in the waste of charging facilities, fluctuations in electric load of each CS, overlong waiting time for EVs to get recharged, and overlong queues in CSs, and these problems would further influence the surrounding traffic and other users’ traveling and end up in a vicious circle. Therefore, guiding-based charging is urgently needed to effectively adjust interactions between EVs and CSs. Research shows that guiding-based charging can lessen the impacts of EVs and CSs [8] (e.g., reduce the waiting time for EVs and workloads for CSs, etc.); nevertheless, guiding-based charging should still be further explored for different requirements.
Guided charging is divided into reservation guided charging (RGC) and electricity price guided charging (EPGC). RGC can be divided into active and passive RGC. Active RGC means the user positively chooses a CS to make a reservation for charging, while passive RGC means the user interacts with the platform which will then specify a CS for the user. Current research on RGC mainly focuses on passive RGC and the ordered reservation algorithm (e.g., optimum matching algorithm [8], artificial intelligence optimization algorithm [9], optimal path algorithm [10], and global information algorithm [11], etc.) employed by service plat forms to specify CSs for the users. Passive RGC lays more emphasis on how to offer suitable charging options for EV users, without considering either the impact of electricity prices on the user’s choice or management of the user’s charging process. EPGC is also divided into active and passive EPGC. Active EPGC means the user actively manages the EV charging process under the guidance of electricity price (e.g., independently choose or set the charging process), while passive EPGC means the user’s charging process is under control under the guidance of electricity price. Thus, it is similar with RGC in that positive EPGC also involves user choice, but it differs from RGC in that passive EPGC focuses more on effective management of the user’s charging process. The premise of passive RGC is that some of the vehicles with reservations for charging must have multiple charging options so as to conduct overall management of charging options of all vehicles with reservations based on adjustability of these vehicles. Therefore, RGC is suitable for CS intensive places. However, in the case of highways, given the long-established habit of refueling only when fuel vehicles are about to run out of fuel, EV users probably will charge their vehicles when the battery level reaches the alarm line. Additionally, CSs are sparsely distributed along highways (one CS every 50 km on average [12]). Therefore, RGC cannot meet EV users’ requirements for CSs on the highway.
Current research mainly focuses on the passive EPGC in the open electricity market. The charging start time for EV clusters in the parking lot was optimized in [13] to reduce charging costs for the users and achieve the objective of power grid peak load shifting. Partition optimization of charging power for EV clusters was conducted in [14] to track photovoltaic power generation, stabilize charging load fluctuation, and reduce charging costs for the users and maximum new energy consumption. Hernández-Arauzo et al. [15] proposed the efficient algorithm for making charging schedules for the users, in order to maintain three-phase line balance and make maximum use of distributable power. Crow [16] made an analysis of the optimum number of levels and price-duration of peak-valley time-of-use (TOU) prices for a given consumer demographic versus utility generation mix, which can incentivize customers to better manage their energy use. Deilami et al. [17] presented a real-time load intelligent management algorithm coordinating charging behavior of multiple EVs, to improve security and reliability of the power grid. Research on large-scale EV scattered charging control was conducted and the price based distributed pricing mechanism is proposed and analyzed with a game approach in [18]. However, EVs on highways mainly run in the daytime and passive EPGC does not involve user choice of CS, mainly focusing on management of the EV charging process. Hence, it can neither meet EV users’ requirements for CSs on the highway.
There are different requirements for EV charging and charging network operation on highways. EVs having charging needs always want to get charged at CSs without having to wait in a queue. CSs with EVs queuing up for charging wish there were no more vehicles to enter the station for charging to ease their operation burden, while CSs with no vehicles waiting for charging hope for vehicles to come to improve utilization of their charging facilities. However, these needs cannot always be well satisfied. In fact, EVs on highways do not necessarily start considering charging when the battery level reaches the alarm level and they can increase charging options through charging in advance. When EV charging is adjustable, users can decide whether to charge their vehicles based on whether a CS is busy or not, thereby adjusting the interaction between EVs and the charging network. To effectively accommodate this effect, it requires the addition of more vehicles with flexible charging options.
With this as the cutting point, this paper introduces a new electricity price form—status-of-use (SOU) price only related to the free/busy status of a CS (i.e., electricity price is high during busy hours and low during idle hours of the CS and the electricity prices during busy and idle hours are fixed) based on the operation characteristics of CSs and the users’ response to electricity price for charging. This customized electricity price should take into account interests of both EV users and CSs and it can be formulated based on pricing strategies of the electricity market [19]. Electricity price of an EV only depends on status of the CS when it enters into it, under no influence from vehicles following it. Hence, SOU pricing can satisfy requirements for CS operation and EV charging on highways, and is also easy to implement. For CSs, when busy hours start, they can restrain the entry of following vehicles by raising the electricity price to reduce workload of the CS, and during idle hours they can attract subsequent vehicles to come for charging by lowering the electricity price, thus improving utilization of charging facilities of the CS. For EVs, users with charging needs can charge their vehicles in advance (to increase charging options) at CSs that are not busy and actively choose the CSs for charging, thus achieving the least charging costs and waiting costs. The EV charging options can also improve operating efficiency of CSs and improvement in operating efficiency of CSs is, in turn, beneficial for EVs.
Therefore, this article proposes a SOU price-based charging strategy that can motivate users to charge in advance. The proposed charging strategy in this paper is also called an orderly charging (OC) strategy. The main contributions of this paper can be summarized as follows:
  • An OC strategy that can motivate users to charge in advance is proposed to guarantee the coordinated interactions between EVs and CSs and meet their own demands effectively;
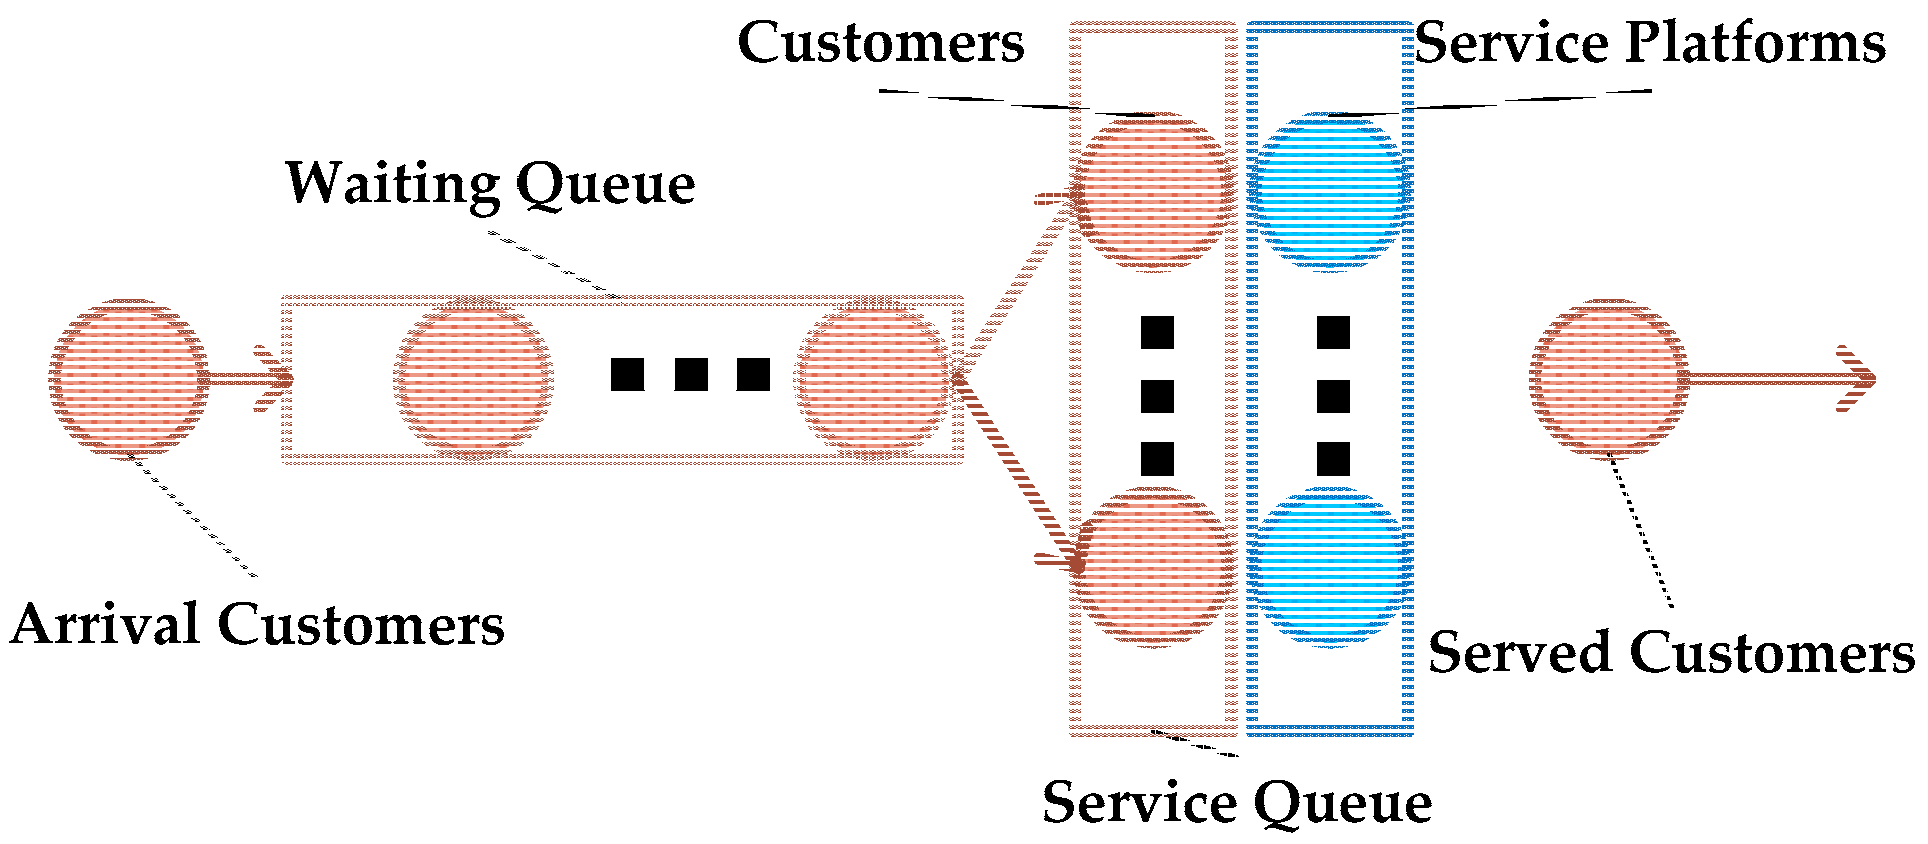
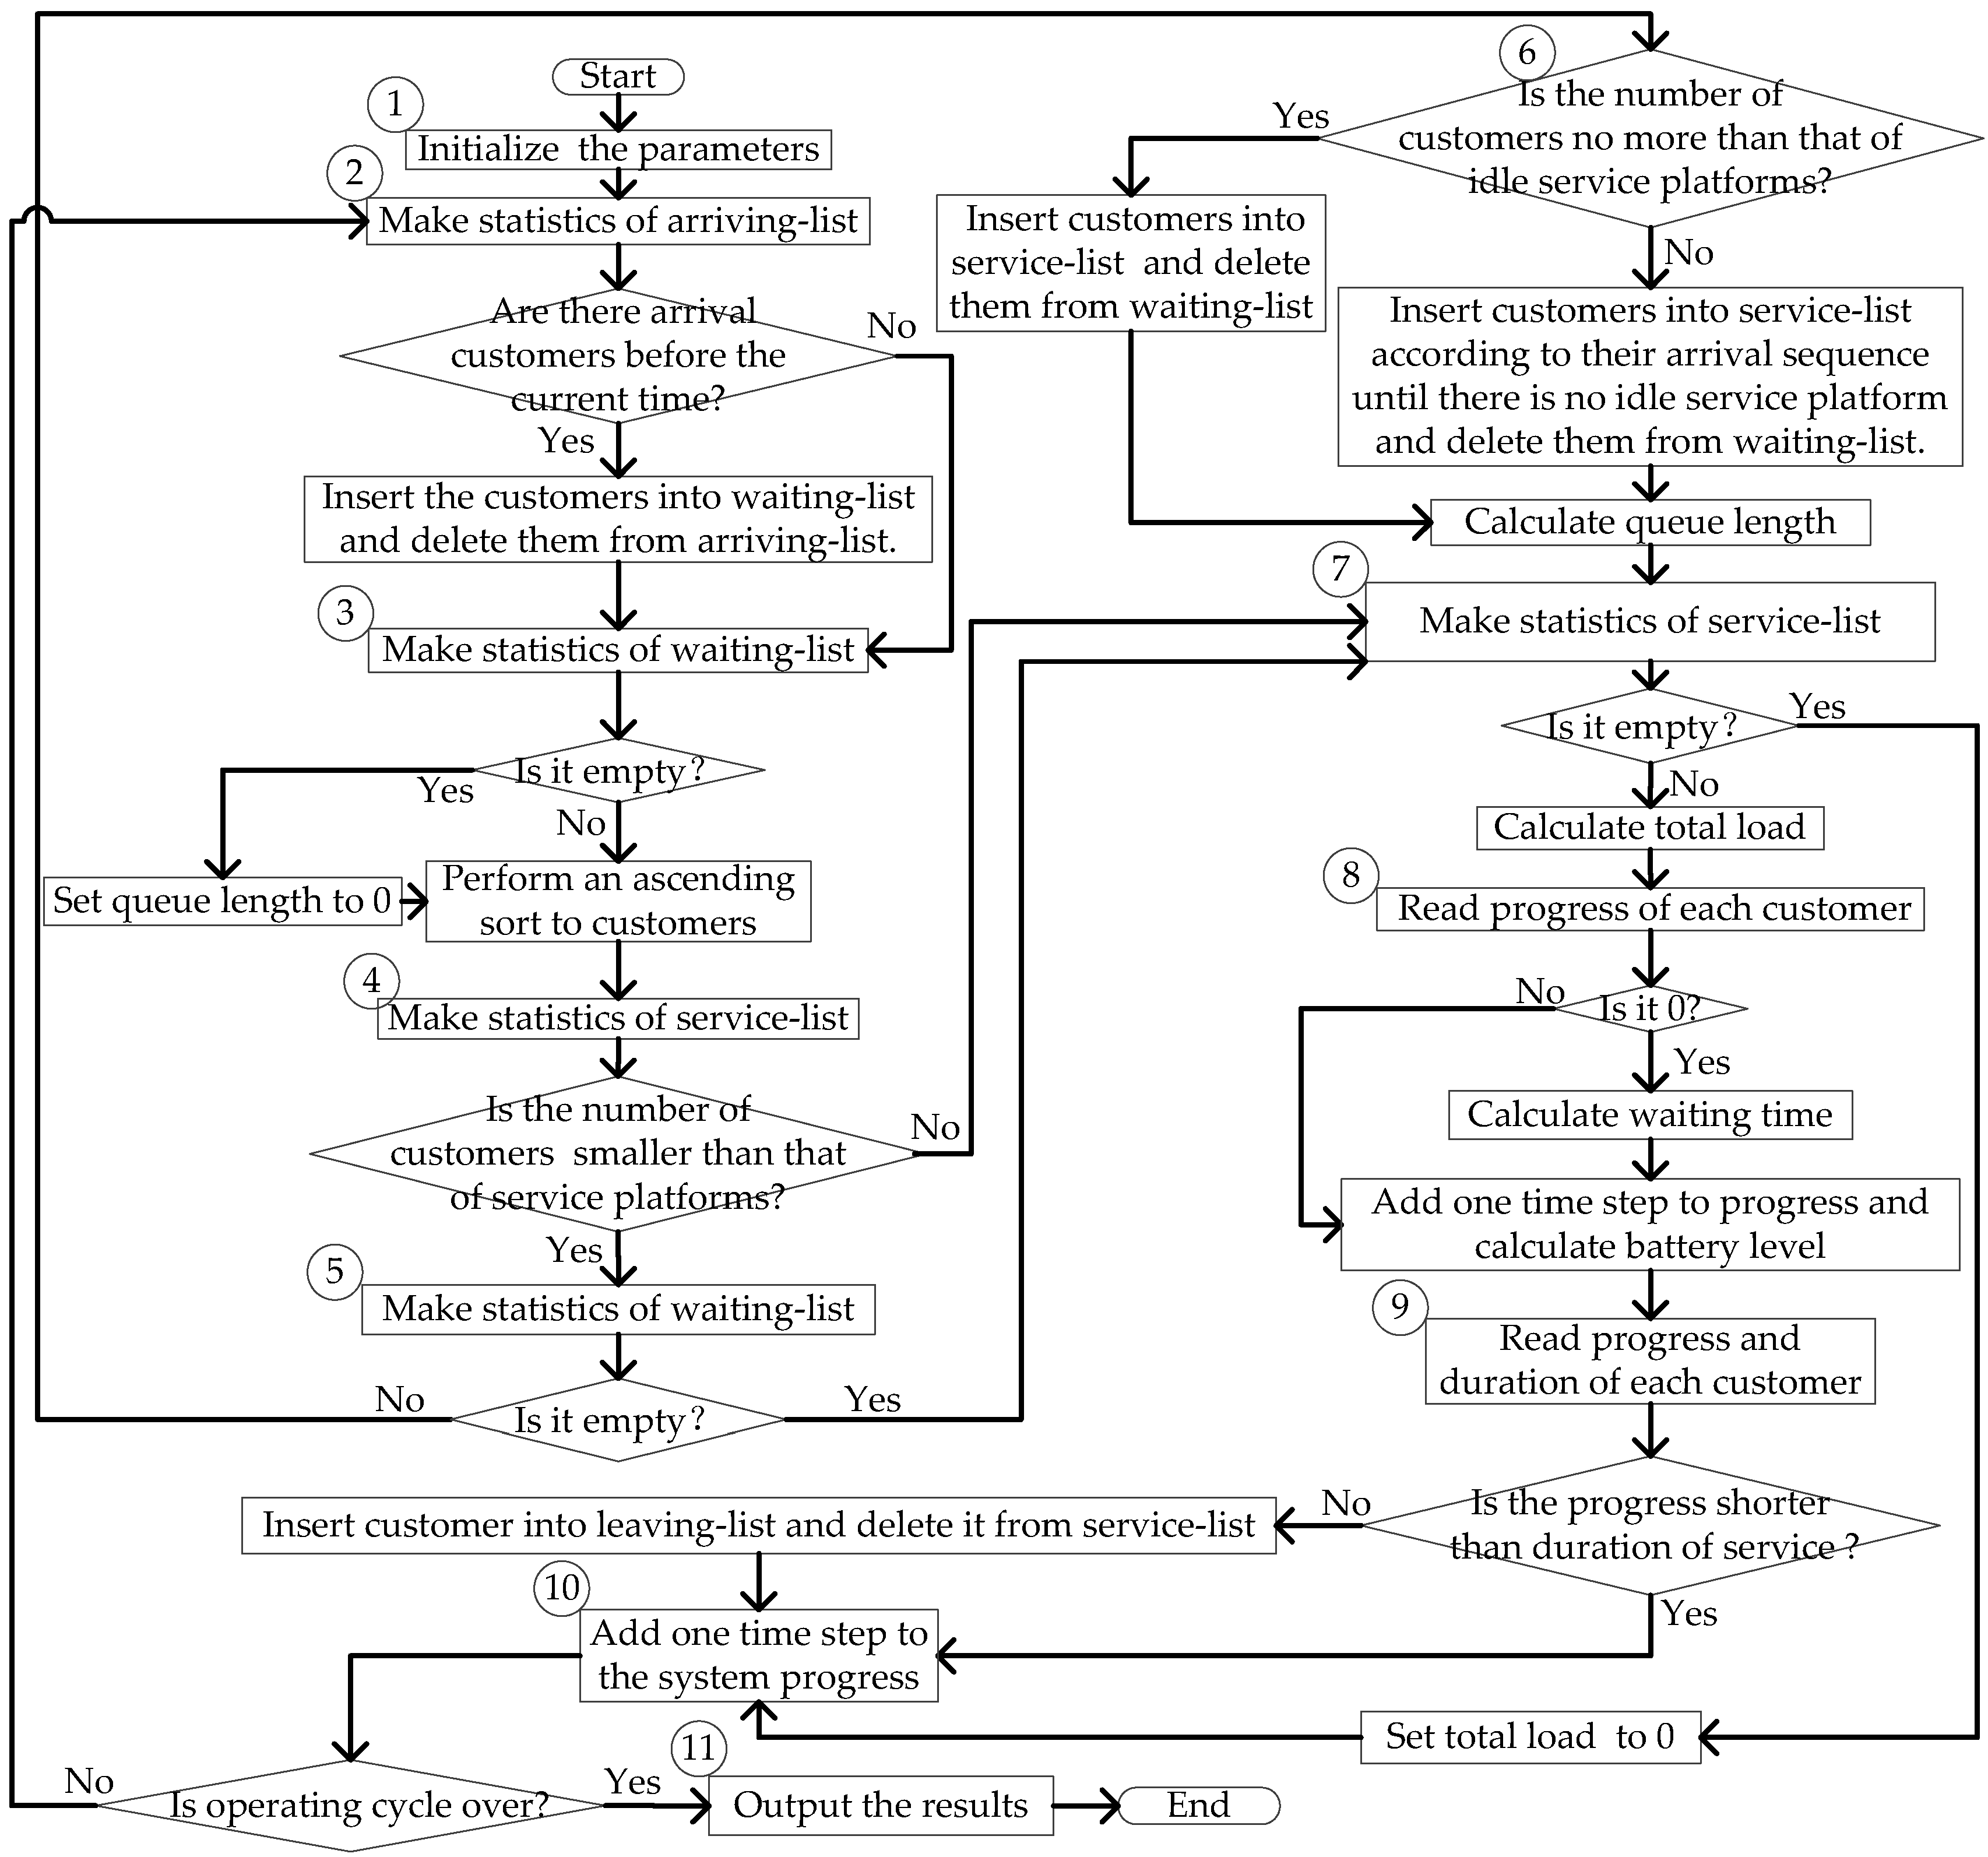
  • A solution for analysis and verification of the OC strategy is proposed, including an established queuing model for a CS cluster and a queuing algorithm.

2. Strategy of Orderly Charging with a New Electricity Pricing Scheme

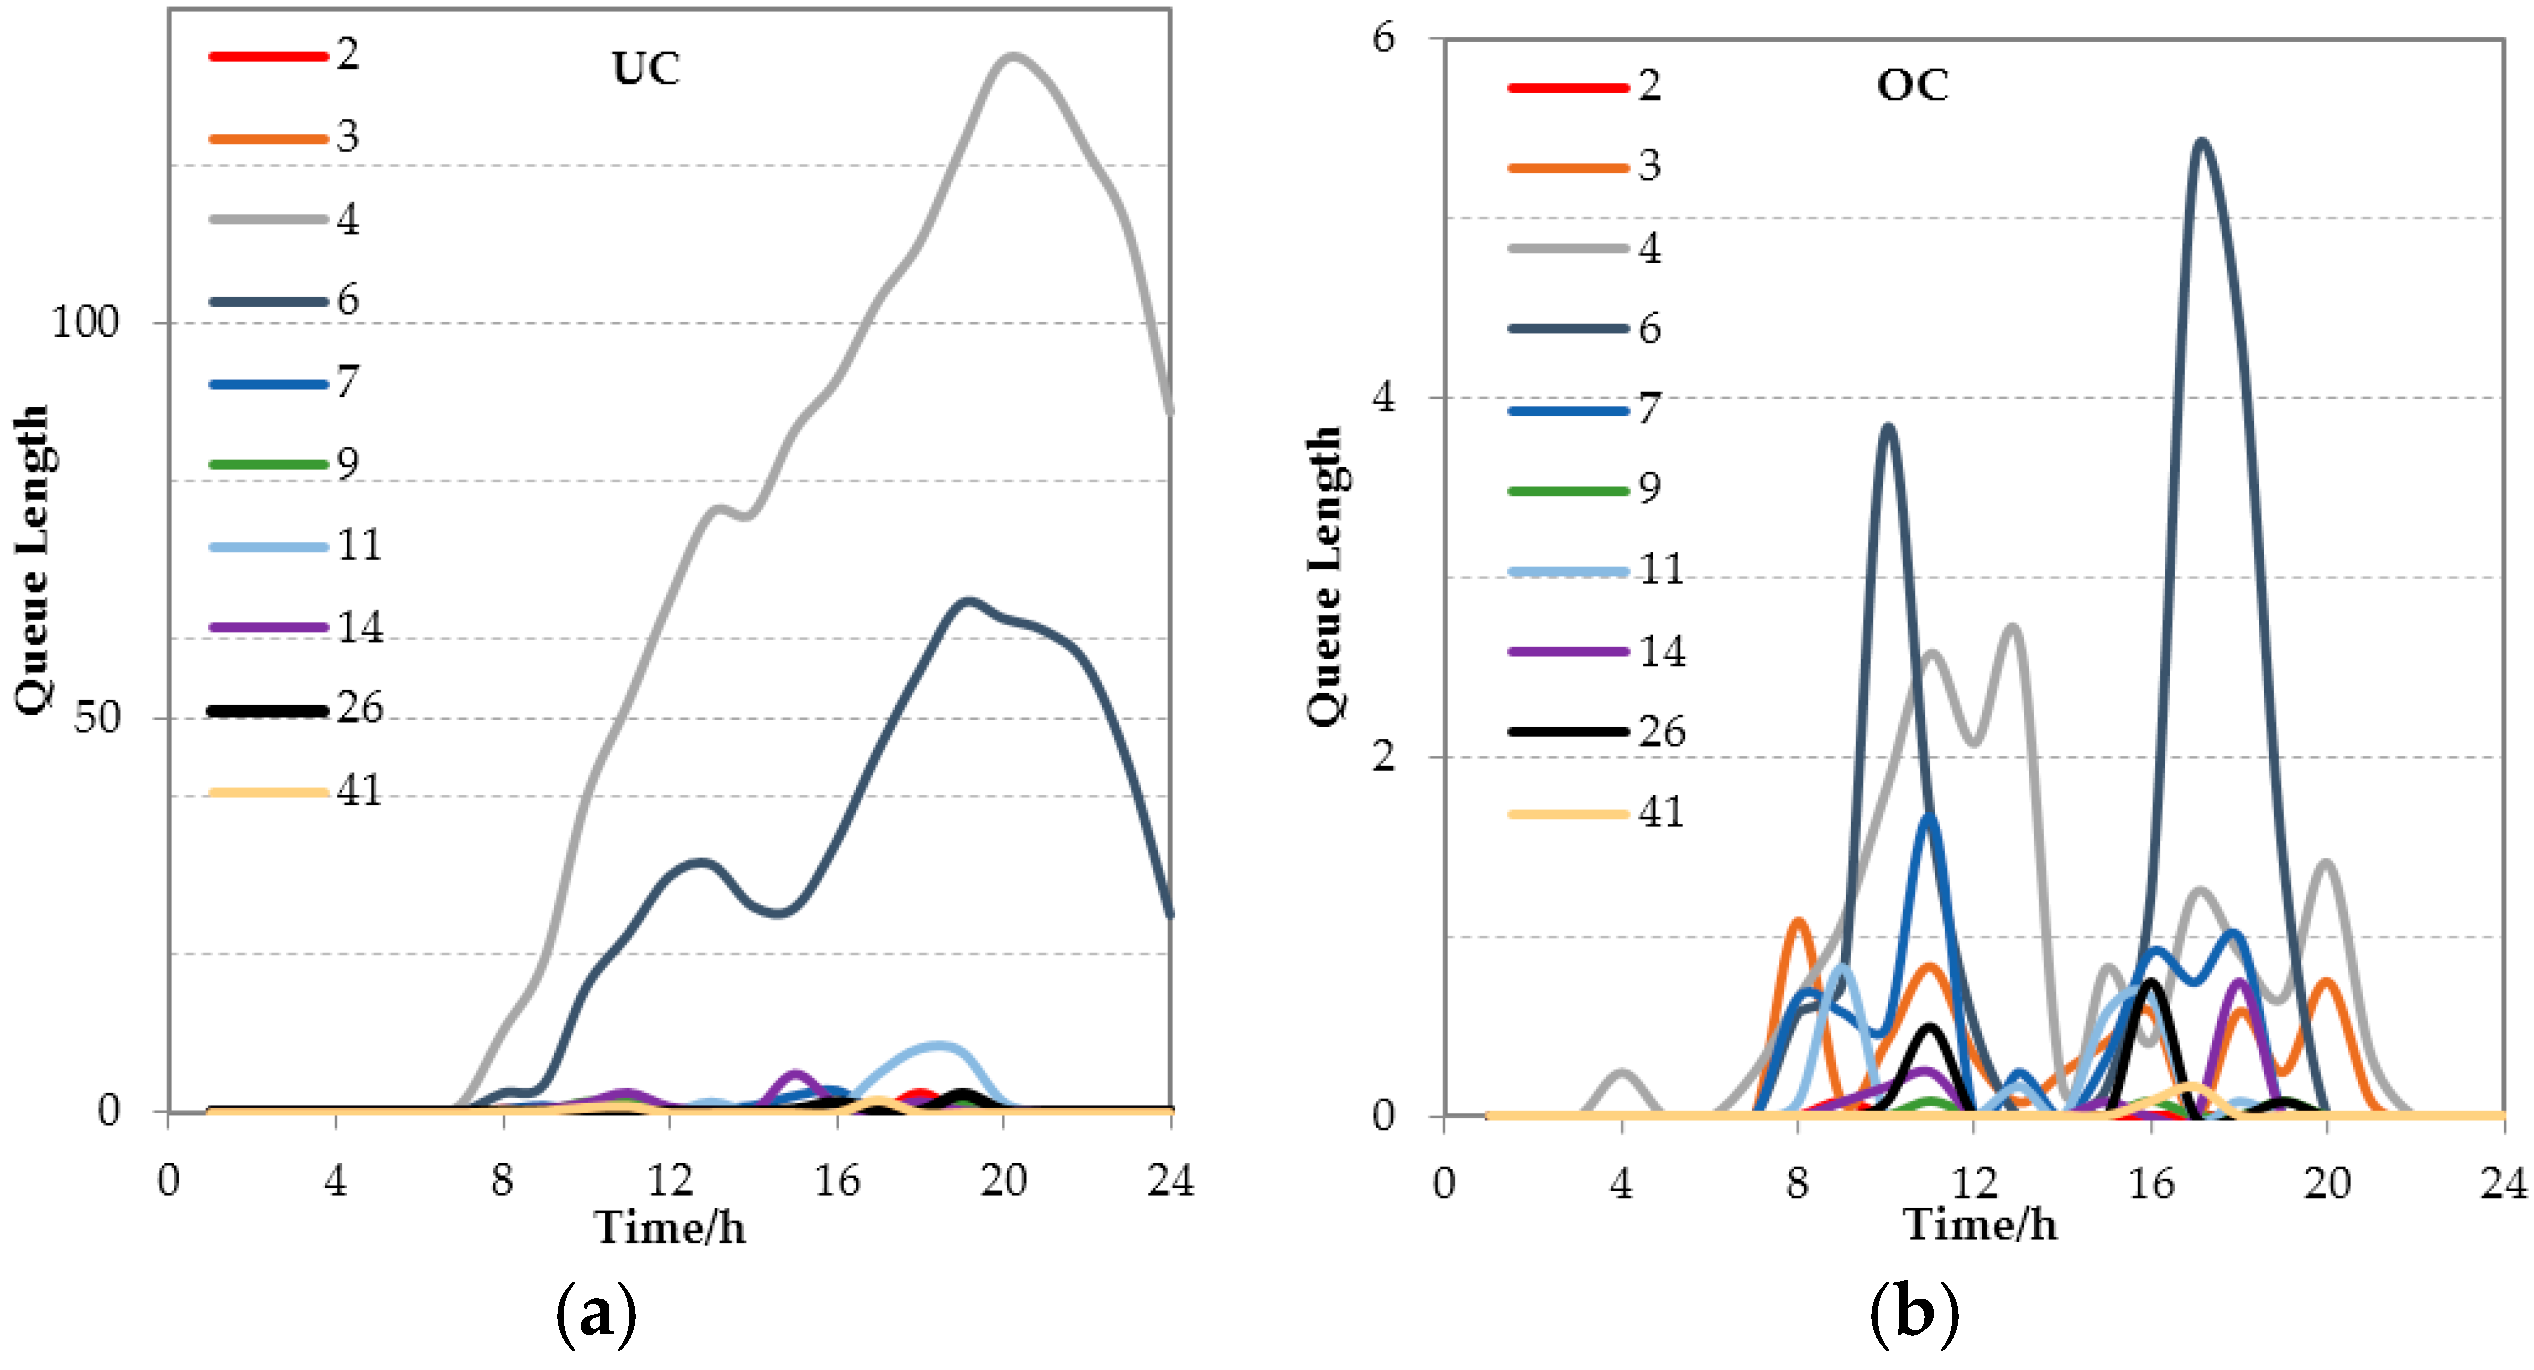
In the case of unordered charging (UC), a greater part of EV users, say 90%, would not recharge their cars until the battery level reduces to the warning value, due to the habit developed from their long-term use of fuel cars. On this occasion, the users have to charge their cars whether the CSs they are heading for are idle or not, or else the EVs would get stuck midway once the battery runs out. Thus, they have to conduct the forced charging action (FCA), which may lead to a lot of EVs entering a certain CS simultaneously and result in long waiting time for the cars as well as congestion in the station. Thus, EVs in FCA help little in adjusting the running state of CSs.
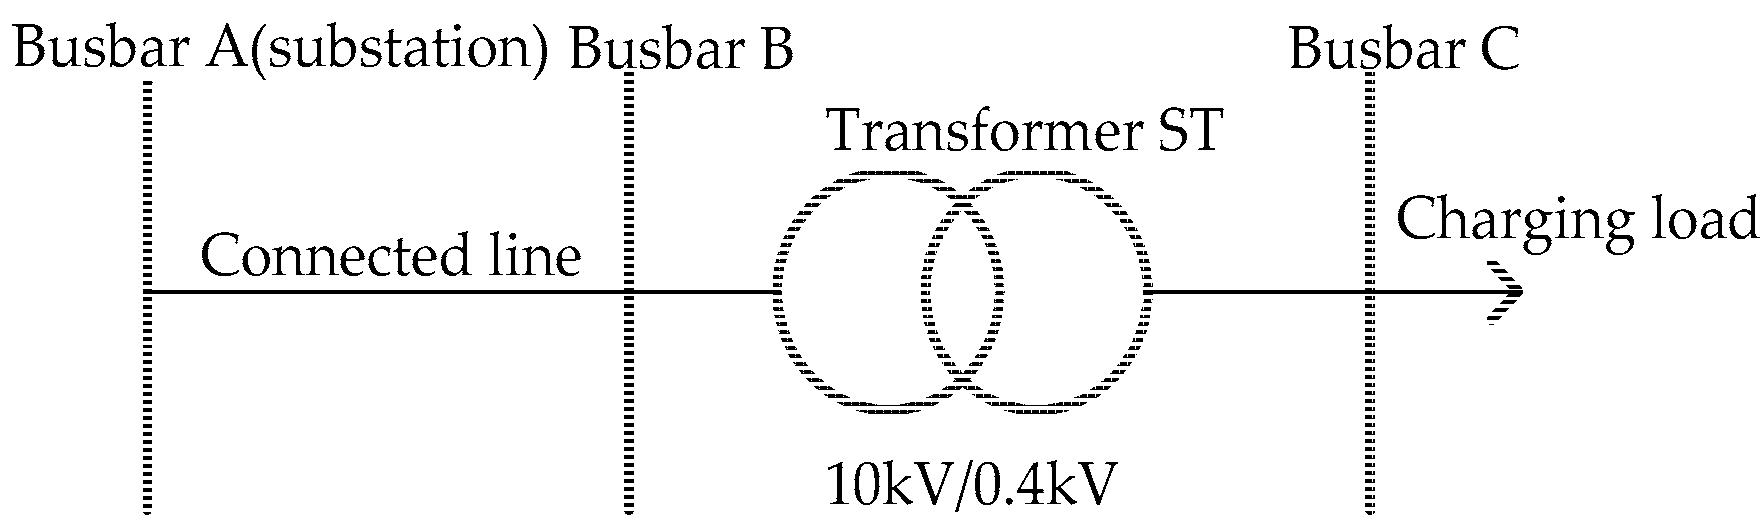
To effectively adjust interactions between EVs and CSs, it is necessary to guide EVs’ charging in advance by some practically effective economic or technical measures, which constitute the OC strategy in this paper. In the case of OC, on the assumption that 90% of EVs have battery level above the warning value and can make it to the next CS at least, the users can choose to get charged at the next CS to ease the burden of the current station if it is too busy. Since the charging activities of these users are somewhat adjustable and can be regarded as adjustable charging action (ACA), these users could be considered as the main objects to guide. This paper introduces a SOU price that is suitable for charging EVs on expressways after considering CSs’ running states, as shown in Table 1 (this paper sets α and β to 0.15 and 0.11 based on [20]).
It can be seen from the characteristics of users’ automatic response to the price incentive [21] that the new charging price succeeded in motivating users to turn to idle CSs to get charged to some extent. In addition, this pricing scheme guarantees users to enjoy the electricity price agreed before charging during the entire charging period. Since every EV user can perform either FCA or ACA, the new charging price scheme is fair to all EV users.

3. Queuing Model for a Charging Station Cluster

Every CS and EVs in the station constitute a queuing system, and EVs connect multiple queuing systems together. Several queuing systems constitute a CS cluster queuing system. A queuing model for the CS cluster consists of two models: EV model and CS model. Some parameters and variables used in the queuing model are first introduced, which are as follows:
S R a set of routes
ra route number
S CS r a set of CSs in the route r
S EV r a set of EVs in the route r
i r a CS number in the route r
k r an EV number in the route r
T a ( k r , i r ) / T w ( k r , i r ) / T c ( k r , i r ) arrival/waiting/charging time of EV k r at CS i r
T ε ( k r , i r ) charging progress of EV k r at CS i r
Q max k r battery capacity of EV k r
L max k r maximum mile of EV k r
Δ t time interval
SOC 0 ( k r , i r ) / SOC e ( k r , i r ) initial/expected state-of-charge of EV k r at CS i r

3.1. Electric Vehicle Model

3.1.1. Departure Time of Electric Vehicle Users at Origins

According to the statistical data of traffic flow on expressways [22], it is assumed that a probability density curve of the EV flow at the origin is shown in Figure 1.
Therefore, the evaluated departure time of the EV k r at the origin of the route r can be expressed as follows:
T O k r = ω × Unfi ( τ 1 , τ ) , κ ( ρ τ 1 , ρ τ ]
ρ 0 = 0 , ρ τ = i = 1 τ p i , τ { 1 , , s }
where κ is a random number between 0 and 1; ρ τ is the cumulative probability of τ curve sections; Unfi ( ) is a uniform random number generator; p i is the probability of curve section i ; s is the number of segments of uniform and discrete probability density curve; ω is a default value; If s = 24, then ω = 60.

3.1.2. State of Charge of Electric Vehicle Battery at Origins

A specific battery level is determined by the state of charge (SOC). SOC of the EV battery at origins vary from each other, and it is correlated to many random factors, such as carrying capacity of cars, travelling distance, road condition, and driving operation. With the increase of sample size, SOC of the battery becomes an event determined by several random factors, and the probability statistics result of the event is subject to an approximate normal distribution according to the law of large numbers and central-limit theorem. SOC of the battery of EV k r at the origin of the route r is expressed as:
f ( SOC O k r , μ , σ ) = 1 2 π , σ 2 e ( SOC O k r μ ) 2 / ( 2 σ 2 )
where μ is the average value of SOC and σ is standard deviation.

3.1.3. Driving Position and State of Charge of Electric Vehicle Battery

When an EV k r travels on the route r at time t, its driving position and SOC of battery are calculated as:
L t k r = { L t Δ t k r + Δ L t k r , Δ L t k r = V t Δ t k r × Δ t , if  t > T O k r , L t k r < L D k r L O k r , if  t = T O k r
SOC t k r = { SOC t Δ t k r ε k r × Δ L t k r / Q max k r , if  t > T O k r , L t k r < L D k r SOC O k r , if  t = T O k r
where L O k r ( L D k r ) is the position of the EV k r at the origin/destination; SOC t Δ t k r is the SOC of the EV k r battery at time t Δ t ; V t Δ t k r is the driving speed; Δ L t k is the driving length during Δ t ; ε k r is the electricity consumption per kilometer of EV k r , and based on the maximum mileage, it is expressed as:
ε k r = Q max k r / L max k r
When the EV k r stays at the CS i r at time t, the SOC of battery during waiting period and the SOC of battery during charging period with considering the time interval of the simulation are calculated as:
SOC t k r = { SOC 0 ( k r , i r ) , if  t [ t 1 , t 2 ) SOC 0 ( k r , i r ) + (SOC e ( k r , i r ) SOC 0 ( k r , i r ) ) × T ε ( k r , i r ) Int ( T c ( k r , i r ) / Δ t ) , T ε ( k r , i r ) { 1 , , Int ( T c ( k r , i r ) / Δ t ) } , if  t [ t 2 , t 3 ]
t 1 = T a ( k r , i r ) , t 2 = T a ( k r , i r ) + T w ( k r , i r ) , t 3 = T a ( k r , i r ) + T w ( k r , i r ) + T c ( k r , i r )
where Int ( ) is an integral function. SOC 0 ( k r , i r ) is the initial state-of-charge of EV; SOC e ( k r , i r ) is the expected state-of-charge of EV; T ε ( k r , i r ) is the charging progress of EV; T a ( k r , i r ) is the arrival time of EV; T w ( k r , i r ) is the waiting time of EV; T c ( k r , i r ) is the charging time of EV; t 1 , t 2 , and t 3 are the set boundary values.

3.1.4. Charging Probability of Electric Vehicle at a Charging Station

A few factors, including locations of EVs, SOC of batteries, and locations and running states of CSs, are considered in this model. The charging action of the EV k r at the CS i r can be expressed by the charging probability p c ( k r , i r ) . If p c ( k r , i r ) = 1 , then the EV needs charging. Otherwise, it never needs charging. When the EV k r arrives at the CS i r and performs FCA at time t, the charging probability is expressed as:
p c ( k r , i r ) = { 1 , if  δ min < SOC t k r α k r , L t k r = l cs ( k r , i r ) 0 , otherwise
where l cs ( k r , i r ) is the position of the CS i r ; α k r is a charging warning value, which is calculated as:
α k r = Δ L k r / L max k r + δ min
where Δ L k r is the path length between CS i r and CS i r + 1 on the route r before reaching the destination and the Δ L k r is set to 50 km when EV k r arrives at the destination; δ min is an electricity abundance, which is set to 0.05.
When the EV k r arrives at the CS i r and performs ACA at time t, the charging probability can be expressed as follows:
p c ( k r , i r ) = { 1 , if  α k r < SOC t k r < β k r , L t k r = l cs ( k r , i r ) , d t i r = 0 0 , otherwise
where d t i r is the running state of the CS i r at time t; If d t i r = 0 , then the CS i r is idle at time t; β k r is a charging threshold value, which is calculated as:
β k r = ( Δ L k r + Δ J k r ) / L max k r
where Δ J k r is the path length between CS i r + 1 and CS i r + 2 on the route before reaching the last but one CS, and when the EV k r arrives at the last but one CS or destination, the Δ J k r is set to 50 km.
If p c ( k r , i r ) = 1 , then the time t is the arrival time of EV k r arriving at the CS i r , which is expressed as:
T a ( k r , i r ) = t , if p c ( k r , i r ) = 1

3.2. Charging Station Model

3.2.1. Running State of a Charging Station

Queue length, which is defined as the number of the EV in waiting at time t, can reflect the running state of the CS which is idle or busy. Therefore, the running state of the CS i r can be expressed as:
d t i r = { 1 , if  L d i r > 0 0 , otherwise
where L d i r is the queue length of the CS i r at time t, which can be calculated by the proposed queuing algorithm; If L d i r > 0 , then d t i r = 1 and the CS is busy at time t. Otherwise, it is idle.

3.2.2. Waiting Time of Electric Vehicle

Waiting time is one of the key factors influencing users’ satisfaction [23]. While waiting in a line, users are subject to not only economic loss caused by the wasted time, but also the negative emotions like tension and uncertainty. If users can be provided with the information on waiting time, they will feel less nervous and uncertain while waiting and their cognition of remaining waiting time will be changed effectively. The waiting time of the EV k r at the CS i r is expressed as:
T w ( k r , i r ) = T b ( k r , i r ) T a ( k r , i r )
where T b ( k r , i r ) is the starting time of EV charging.

3.2.3. Charging Time of Electric Vehicle

At present, the typical strategy of the EV battery charging is a two stage method. The first stage is constant-current charging process which has a constant current and limited voltage and the second stage is constant-voltage charging process which has a constant voltage and limited current. During the whole charging process, most of the charging time would be the first stage in which the charging power has little change. As a result, EV battery could be considered as a constant power load so that the constant-voltage charging process could be ignored [14]. Based on the constant charging power, the charging time of the EV k r at the CS i r is calculated as:
T c ( k r , i r ) = ( SOC e ( k r , i r ) SOC 0 ( k r , i r ) ) × Q max k r P c ( k r , i r )
where P c ( k r , i r ) is the charging power at the CS i r .

3.2.4. Charging Cost of Electric Vehicle

According to the new prices listed in Table 1, the charging cost of the EV k r at the CS i r can be calculated by the following:
C ( k r , i r ) = η ( k r , i r ) × ( SOC e ( k r , i r ) SOC 0 ( k r , i r ) ) × Q max k r
where η ( k r , i r ) is agreed charging price before charging.

3.2.5. Utilization Ratios of Charging Facilities of Charging Station

Based on the total number of the running piles, the utilization ratio of charging facilities of the CS k r can be calculated as:
λ i r = t = 1 n D t i r / ( n × N c i r )
where n is the total number of period of time; N c i r is the maximum number of the charging piles of the CS i r ; D t i r is the number of running piles at time t.

3.2.6. Charging Load of Charging Station

Based on the number and charging power of running piles at time t, the charging load of the CS i r is expressed as:
P L i r = 1 φ z = 1 D t i r P c ( z , i r )
where φ is the efficiency of fast charger.

4. Proposed Queuing Algorithm

In order to solve the established model, an effective algorithm is needed. Queuing theory is commonly used in solving queuing problems, and this method requires two preconditions that the interval of users’ arrival time is subject to a Poisson distribution and the service time is fixed [24]. However, because EVs on expressways are correlated to each other in the time of their arriving at CSs and the charging time is unfixed, the above preconditions are not met and queuing theory cannot be used to solve the model parameters in this paper. Therefore, this paper proposes a queuing algorithm to solve the model parameters.

4.1. Description of Queueing System

Queuing is common when customers receive the service. Customers enter the queuing system for their demand for the service and the queuing system arranges services for them according to their arrival sequence and specific demands. A typical queuing system is shown in Figure 2. We assume that there are multiple service platforms in the queuing system; new customers are mutually independent in the time of arriving in the queuing system, which is unrelated to the system’s current state and the arriving time of the current customers; and the queuing system serves customers according to the service platforms’ working state and customers’ demands. If there are idle platforms in the queuing system, customers are served according to their arrival sequence; or else, customers need to wait in the queue. After the service, customers leave the system.

4.2. Computational Process of Queuing Algorithm

First-come-first-served (FCFS) queuing algorithm gives priority to the early arrived customer in the waiting queue and takes no consideration into the duration of service. Once a customer is served, the service will last until the end. Thus, this method is simple and feasible. For the convenience of describing the algorithm procedures, the states of customer and service platform are defined as follows: there are four customer states: arriving state, waiting state, service state, and leaving state. Customers in arriving and waiting states are entering the waiting queue or waiting for the service; customers in the service state are being served; customers in the leaving state have received the service and are leaving the queuing system. Service platforms have two states: busy state and idle state. Service platforms in the busy state are providing service to customers; and service platforms in the idle state stop working temporarily and can provide service to customers at any time. The flowchart of queuing algorithm is as shown in Figure 3 and the following are the specific procedures:
Step 1
Initialize the system’s operating cycle, time step, arriving-list (where the vector of the arrival customer in each line includes five variables such as the progress, duration and load in service, arriving and waiting time of the customer), waiting list, service list, leaving list, and the maximum number of service platforms. Assign the inputting values to the service duration and load, and arriving time of per customer. Input the maximum number of service platforms and set the values of other variables as 0.
Step 2
Make statistics of the arriving list and judge whether there is/are arrival customer(s) before the current time in it. If so, insert the customers into the waiting list (which means the customers’ states are set as waiting states in the waiting queue) and delete them from the arriving list.
Step 3
Make statistics of the waiting -list and judge whether there is/are the customer(s) at the current time in it. If so, perform an ascending sort to the customers in the waiting list according to their arrival time; if not, set the system’s queue length to 0.
Step 4
Make statistics of the service-list and judge whether the number of customers in it is smaller than that of service platforms. If so, go to Step 5; if not, go to Step 7.
Step 5
Make statistics of the waiting list and judge whether there is/are the customer(s) at the current time in it. If so, go to Step 6; if not, go to Step 7.
Step 6
Judge whether the number of customers in the waiting list is no more than that of idle service platforms. If so, insert the customers into the service list (which means the customers’ states are set as service states in the service queue) and delete them from the waiting list; if not, successively insert the customers into the service list according to their arrival sequence until there is no idle service platform and delete them from the waiting list. Make statistics of the current number of customers in waiting list and work out the queue length of the queue system.
Step 7
Make statistics of the service list and judge whether there is/are the customer(s) at the current time in it. If so, read the current loads for customers in service list and calculate the load of the system according to Equation (16), and go to Step 8; if not, set the load of the system to 0 and go the Step 10.
Step 8
Read the current progress of customers in service-list and judge whether it is 0. If so, calculate the waiting time by Equation (12) and assign it to the variable of the waiting time in the line. Add one time step to the service progress of each customer in service list and calculate the battery level by Equations (5).
Step 9
Read the current progress and duration of customers in service list. If the progress is shorter than the duration of service, this condition indicates the service for the customer has not finished yet; otherwie, the customer state shall be changed to the leaving state and insert him/her into the leaving list, and delete him/her from the service list.
Step 10
Add one time step to the system progress and judge whether the system’s operating cycle is over. If so, go to Step 11; if not, go to Step 2.
Step 11
Output the results and quit the program.
The above queuing algorithm is intended to solve the queue length, working load, and customers’ waiting time by inputting customers’ arriving time, service duration and load, and number of service platforms in a given period. Based on the current data, the parameters at the next moment can be calculated by inputting customers’ arriving time, service duration and load, and number of service platforms at the next moment.

5. Simulation Process

A simulation of traveling and charging conditions of pure EVs on the road network with a preset quantity and in a given period was performed according to the related data and model parameters and using the Monte Carlo method [25], Floyd-Warshall algorithm [26], and queuing algorithm proposed in this paper. The followings are the specific procedures:
Step 1
Initialize parameters. Set the period for the simulation, time step, and time progress t. Set the parameters related to expressway network, including road length, number, and node number. Set the parameters related to EVs according to their type, including the battery capacity, maximum mileage, and charging power. Set the parameters related to the CS cluster, including the number of CSs, location number, and maximum number of charging piles in a CS. Set EVs’ origins and destinations (OD) distribution related to road network and CSs. Set the values of other parameters as 0.
Step 2
Generate the origin arriving time, battery levels, maximum mileages, driving speeds, and locations of OD of EVs with the preset quantity using the Monte Carlo method and according to Equations (1a), (1b), and (2), driving speed, and traffic OD survey at each road segment of the network. Set the type of charging action for each EV according to the set percentage in the UC (OC) situation (e.g., generate the type of charging action of an EV by the set uniform probability density function). Generate the adjacent matrix and locations of OD of EVs according to the parameters related to both the road network and CS cluster. Generate the cars’ driving routes and the numbers of the CSs they pass by using the Floyd-Warshall algorithm. Arrange an ascending sequence for EVs according to their origin arriving time and set their state as traveling state.
Step 3
Read the status information of each EV on the road at t-1 (including traveling speed, battery level, maximum mileage, current location, and location of its destination), update its location and battery level according to Equations (3), and (4), and judge whether it arrives at the destination. If so, change its state to the arrival state.
Step 4
Judge whether each EV arrives at the CS along its route according to the location and type of charging action of the car, and the locations of CSs at the current time t, in the UC (OC) situation. If so, judge whether it needs to get charged considering its battery level and the state of the CS, and using Equations (6)–(7) and (11) in UC (Equations (6)–(9) and (11) in OC). If it needs, change its state to arriving state, record its arriving time using Equation (10), set its charging progress at 0, and calculate its charging time and cost using Equations (13) and (14).
Step 5
Read the arriving time, charging time, charging progress, and charging power for EVs being charged in each CS, the arriving time and charging time of EVs waiting in the queue, and the status information of leaving EVs at t-1. Take the above data together with the arriving time, charging time, charging progress, and charging power of EVs in each CS at time t as the input data. Calculate the queue length, charging load, and EVs’ waiting time at each CS at time t, by the queuing algorithm. Change the state of EVs leaving the station to traveling state, and update vehicle speed according to the set speed.
Step 6
Add one time step to the time progress, and then judge whether the simulation period is over. If so, go to Step 7; otherwise, go to Step 3.
Step 7
Output the results and quit the program.

6. Numerical Simulation

6.1. Parameter Settings of Simulation

6.1.1. Distribution and Capacity Allocation of Charging Stations in the Simplified Expressway Network

Provided that the CSs have been constructed and operated on expressways, EV users can drive the cars for a long distance. Based on the selected data of expressways in Jiangsu [27], a simplified expressway network, which consists of 14 nodes and 23 main road segments, can be designed and shown in Figure 4.
Generally, there are several service areas in per node or main road segment, but these adjacent service areas of the node can be combined into a single service area in this paper. We assume that one CS is located at per selected service area [11]. Therefore, a total of 58 CSs can be set up in the simplified expressway network according to the location of per service area and the distribution of the CSs in the network is shown in Figure 5. Without considering the optimal allocation of charging facilities, each CS is provided with 10 identical charging piles and the maximum charging power of each charging pile is 120 kW [7].

6.1.2. Origins and Destinations Distribution of Electric Vehicles

EVs were brought in the expressway network, and their OD were determined by the traffic OD distribution [28]. Based on the simplified network, the nodes from 1 to 9 (marked as “ Energies 09 00385 i001
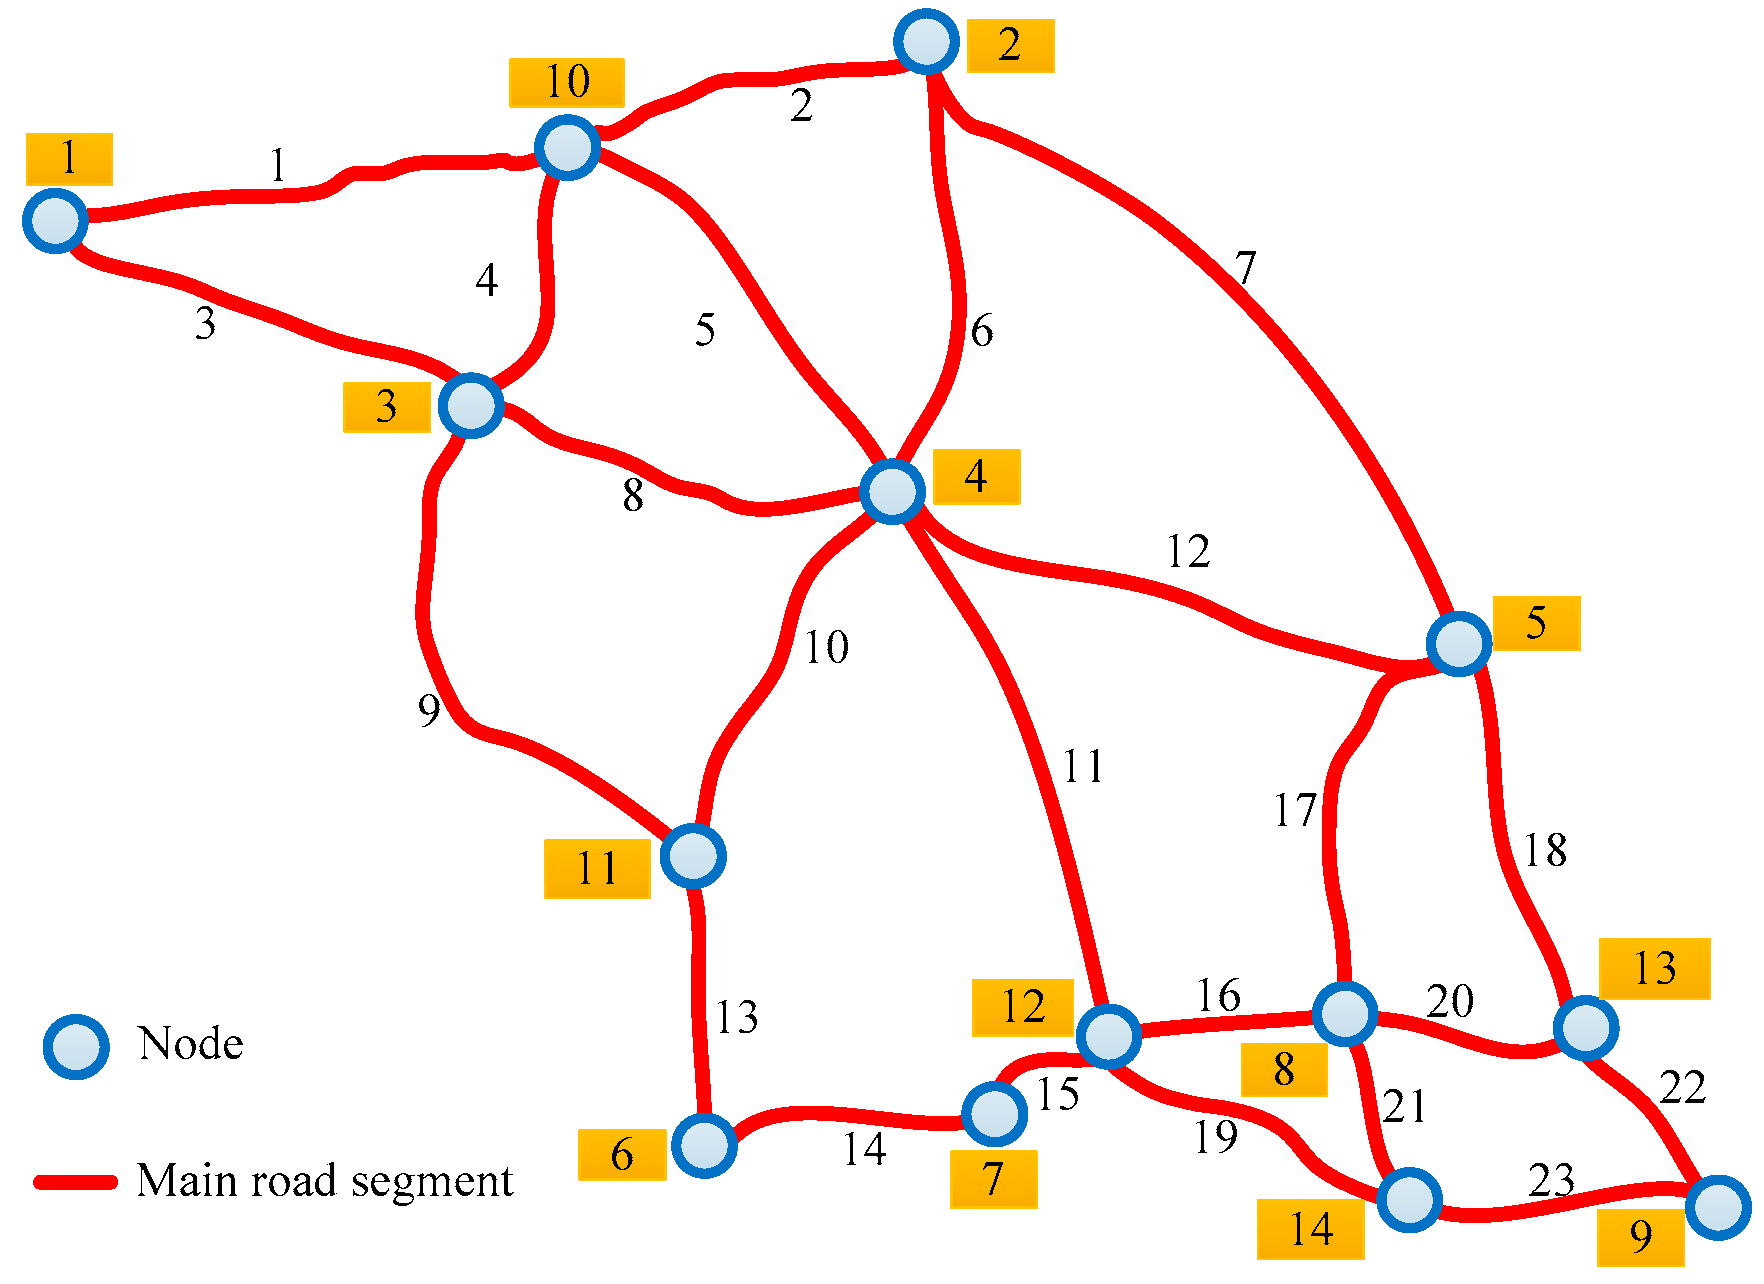
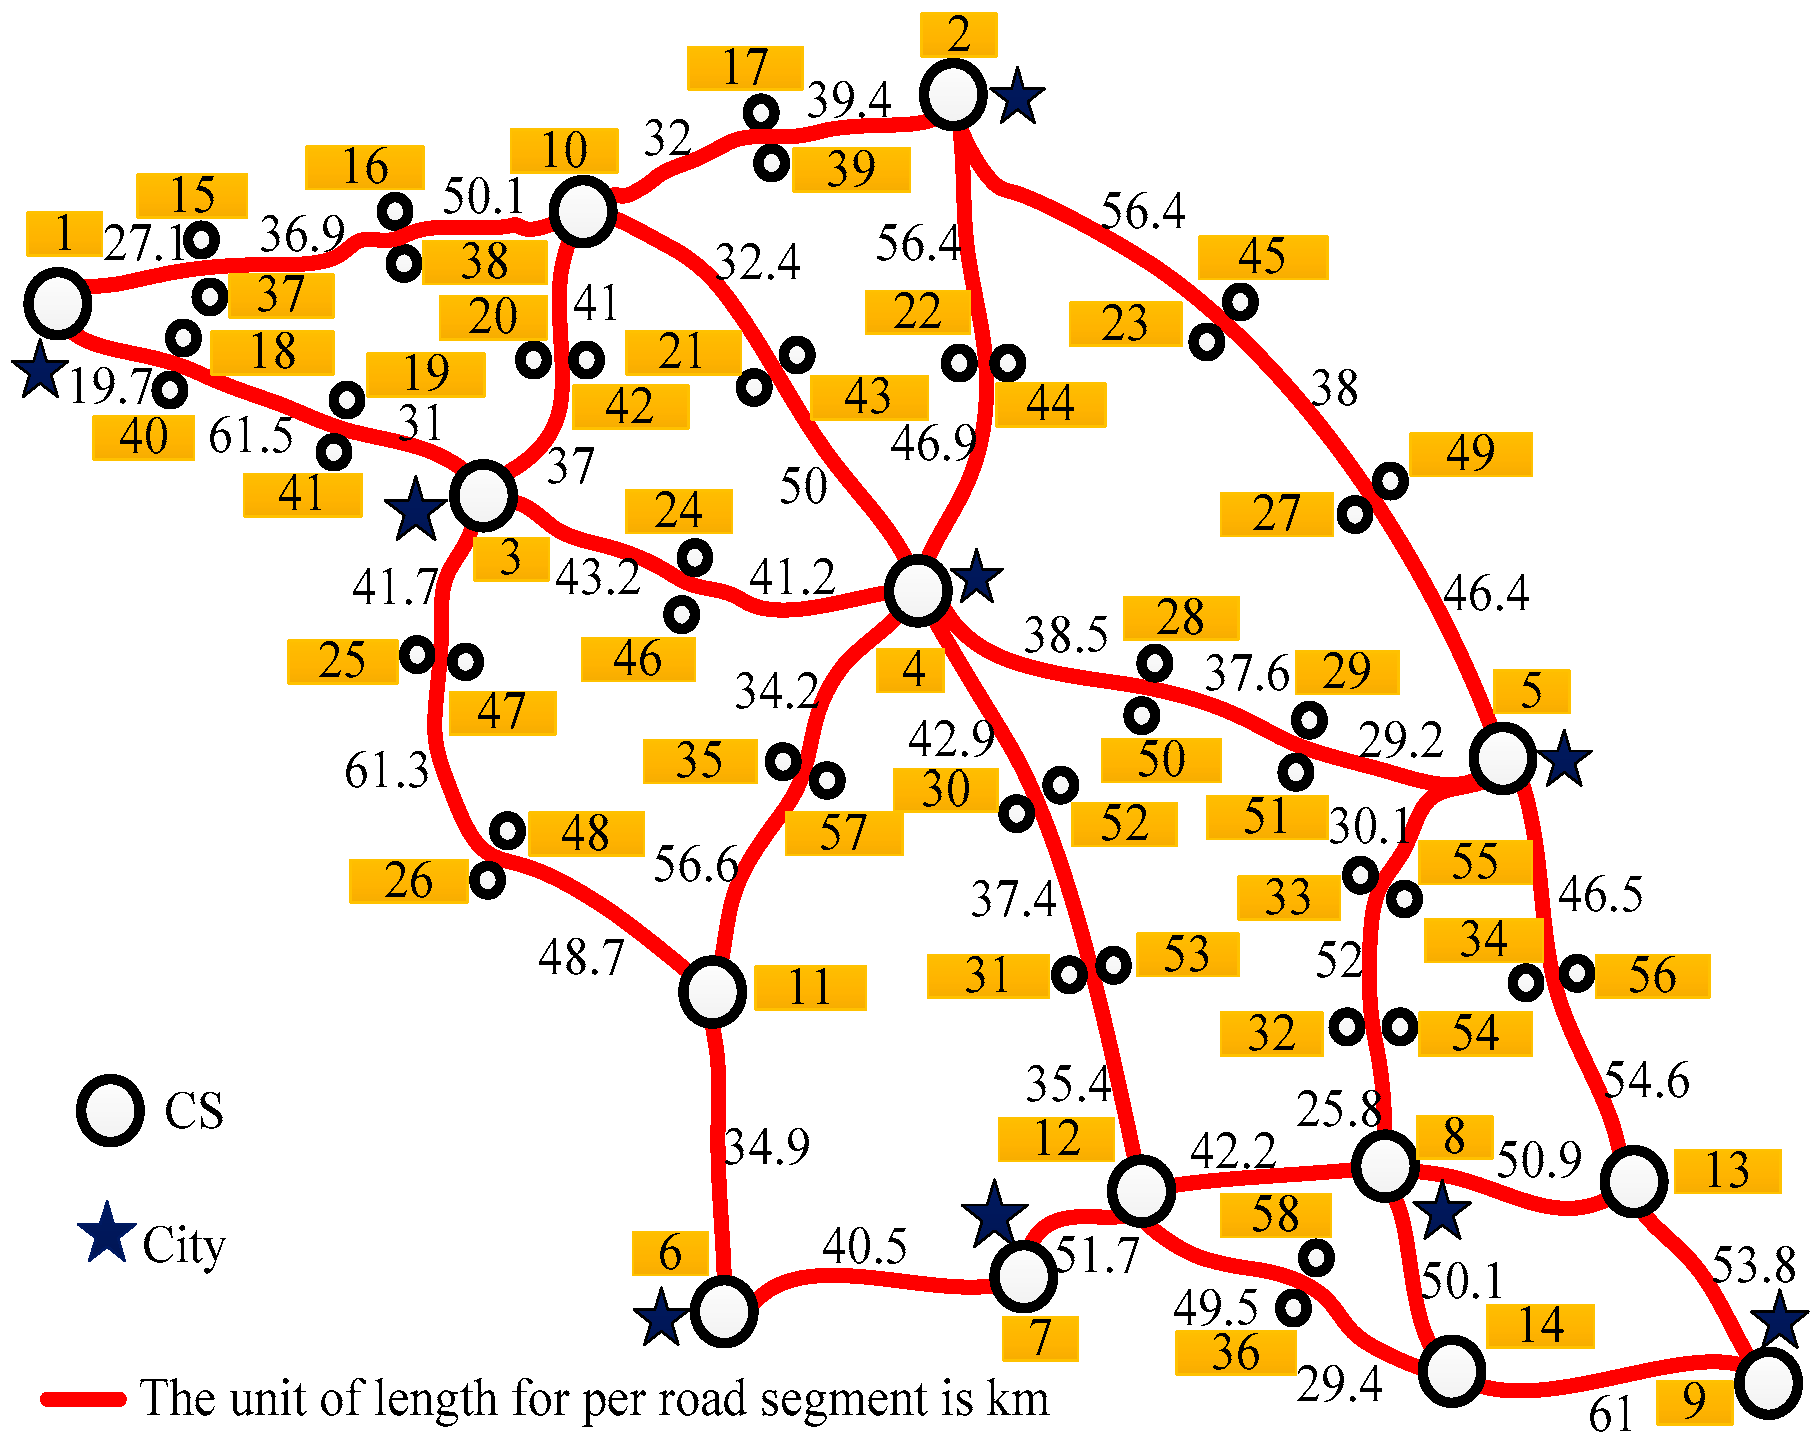
” in Figure 5) were selected as O or D nodes in this paper. According to the prediction based on the statistics of traffic flow in normal expressway networks and the permeability of EVs [29], we assume the traffic flow of EVs on expressways per day is 12,000. The OD distribution of EVs between the OD of the expressway network is shown in Table 2.

6.1.3. Parameter Settings of Electric Vehicle

Five types of EVs are selected for the simulation in this paper (it is a trend that the large-capacity battery for EVs will be adopted in the future). The capacity of EV battery, maximum mileage and charging power are shown in Table 3 and the ratio of EVs’ type is set to 1:1:1:1:1.
Since the maximum mileages of EVs are related to the factors, including the vehicle speed, outdoor temperature, and air conditioning which is opening or stopping, we assume that all of the EVs are running in a sunny winter day on expressways with good traffic status, and this means that the mileages of EVs are obtained with the test conditions, including the set vehicle speed 100 km/h, outdoor temperature −10 °C, and air conditioning set to opening [7]. The initial SOC of EV at the origin is assumed to follow approximately normal distribution whose mean value and standard deviation equal to 0.7 and 0.1. The expected SOC of each EV in the simulation is set to 0.8. The percentage of users conducting different charging actions in different charging situations is shown in Table 4.

6.2. The Results and Analysis of Simulation

Based on the distribution and capacity allocation of CSs in the simplified expressway network, OD distribution of EVs, parameter settings of EV and percentage of users conducting different charging actions in different charging situations, the simulation of traveling and charging conditions of 12,000 pure EVs on the road network from 0:00 to 24:00 was performed using the Monte Carlo method, the Floyd-Warshall algorithm and the queuing algorithm proposed in this paper where the time interval is 5 min. The impacts of two different charging situations on EVs, CSs, and power grid, expressway traffic network can be analyzed as follows:

6.2.1. Impacts of Different Charging Situations on Electric Vehicles

Since the total charging energy of all charged EVs is not the same in different charging situations, the mean value of price is used for evaluating the cost-reduction level of all charged EVs. Table 5 shows the simulation result of mean price for all charged EVs in different charging situations. In the case of OC, the average price of all the charged EVs was reduced by 2.3% compared to UC.
Since an EV may get charged more than once, the waiting time refers to the total time spent by the car in waiting. Figure 6 shows the simulation result of total waiting time of charged EVs in different charging situations. Compared to UC, in the case of OC, the percentage of EVs whose waiting time was less than 5 min increased by 26.6% and no car had a waiting time over 1 h (in the case of UC, the waiting time of 5.34% of the cars exceeded 1 h).
Furthermore, Table 6 and Figure 7 show the number and charging times of charged EVs in different charging situations. Compared to UC, in the case of OC, the number of charged EVs was increased by 11.2%, and the charging times of charged EVs at a busy CS were reduced by 53.1%. OC can bring a lower charging probability (0.101) to EVs at a busy CS than UC (0.248), namely a better charging quality. It is assumed that the total charging energy of all charged EVs is the same in different charging situations. Based on the calculated charging probability to EVs at a busy CS in each charging situation, in the case of OC, the cost-reduction level of all the charged EVs compared to UC is calculated as:
Γ = [ α p UC + β ( 1 p UC ) ] [ α p OC + β ( 1 p OC ) ] [ α p UC + β ( 1 p UC ) ] = p UC p OC p UC + 1 α β 1
where p UC is the charging probability to EVs at a busy CS in UC; p OC is the charging probability to EVs at a busy CS in OC; α and β are the SOU prices. Equation (17) indicates the result that if the charging probability to EVs at a busy CS in each charging situation is constant, the cost-reduction level Γ increases as the ratio between busy and idle prices ( α / β ) increases. However, Γ which is not obvious in the paper, is equal to 2.3% due to the low value α / β (0.15/0.11). If α and β are set to 0.18 and 0.11, the calculated Γ , which is obvious, is equal to 8.1%. Thus, compared to UC, OC can reduce the charging cost (by increasing appropriately the ratio between busy and idle prices) and waiting time for users and lessen the impacts of EVs.

6.2.2. Impacts of Different Charging Situations on Charging Stations

The utilization ratios of charging facilities in CSs in different charging situations can be calculated by using Equation (15), and the standard deviation and mean value of the overall utilization ratio of the CSs in different charging situations are shown in Table 7 and Figure 8. In the case of OC, the standard deviation was reduced by 7.19% and the mean value increased by 3.92% compared to UC. Thus, OC strategy can improve the overall utilization ratio of the CS cluster and lessen the impacts of CSs.

6.2.3. Impacts of Different Charging Situations on the Power Grid

Electrical energy for each constructed CS on expressways needs to be sourced from the nearby substation [30]. If the efficiency of per fast charger is 0.9, considering the capacity and other electrical load per CS in this paper, then the capacity of the selected distribution transformer is set to 1600 kVA with other parameters, including the transformation ratio (10 kV/0.4 kV), short-circuit impedance (6%), no-load loss (2.45 kW), load loss (11.73 kW), and open circuit current (1%) [31]. In addition, according to [32], each CS is connected with the nearby substation by the transformer and the line (the length, resistance and reactance of the connected line are set to 10 km, 0.1 Ω/km and 0.1 Ω/km), and equipped with stabilized voltage supply which can keep the voltage in a fixed level (0.4 kV). Therefore, each CS (whose the power factor is 0.9), the transformer and connected substation (which can be seen as a source [10]) constitute a simplified power system shown in Figure 9. Due to the dispersive distribution of CSs on expressways, the mutual influence among simplified power systems can be ignored and the power flow calculation of each system is executed independently.
In different charging situations, the standard deviation and mean value of average active charging load of CSs are shown in Table 8. In the case of OC, the mean value was increased by 4.03% and the standard deviation reduced by 7.24%, compared to UC. The distribution of charging load of CSs in OC was so relatively uniform that the distribution of the charging load in the power grid was reasonably assigned.
The active charging load of CSs during the day in different charging situations is shown in Figure 10.
Based on the active charging load and reactive load (calculated by the power factor and active charging load) of each CS in UC (OC) situation, the total active power loss (including the active power loss of the lines and the transformers) of all the simplified power systems was 8144.6(7999.3) kWh, obtained by the power flow calculation and the voltage deviation of each busbar A for the substation can fall in range between −5% and 5%. Therefore, OC can reduce the influence on the power grid with economical operation by dispersing the charging load of EVs and lessen the impacts of power grid.

6.2.4. Impacts of Different Charging Situations on the Expressway Traffic Network

The queue length in each CS in different charging situations is shown in Figure 11. In the case of UC, severe queuing congestion occurred in the CSs 4 and 6, and lasted for almost 16 h. The maximum queue length in the CS 4(6) was up to 133(64) vehicles, influencing the normal running of other vehicles on the nearby expressway and resulting in traffic congestion. By contrast, In the case of OC, slight queuing congestion occurred only in CSs 4 and 6, and the maximum queue length in the CS 6 was up to 5 vehicles, having no influence on nearby expressway traffic. Except for the CSs 2, 3, 4, 6, 7, 9, 11, 14, 26, and 41, the queue lengths of the other CSs were 0 vehicles in both the situations. Thus, OC can lessen the impacts of the highway traffic than UC.

7. Conclusions

Performing OC for EVs can effectively adjust interactions between EVs and the CSs and, thus, lower their influence on the power grid and expressway traffic. The main conclusions of this paper are as follows:
  • In terms of users, it reduced the charging cost and waiting time for them and, thus, improved their satisfaction by advocating users to response to the new electricity pricing scheme and adjust their charging in advance;
  • In terms of the charging station cluster, the strategy avoided the problem that a large number of EVs are concentrated in a few CSs and improved the overall utilization ratio of charging facilities in a charging station cluster by motivating users with ACA to charge their cars at idle CSs with the new electricity pricing scheme;
  • In terms of the power grid, it decreased the spatial load fluctuations of the charging station cluster and, thus, lowered their influence on power grid by dispersing the charging load for EVs;
  • In terms of the expressway network, it reduced the queue length in CSs and, thus, lowered the influence on the nearby road traffic by adjusting users’ charging activities.
In addition, the queuing algorithm proposed in this paper can be used to calculate the queue length and waiting time in CSs and provide an important basis for simulation.

Acknowledgments

This work was supported by State Grid Corporation of China, and Science and Technology Planning Project of Jiangsu Province (Grant no. BE2015004-4).

Author Contributions

The status-of-use price-based charging strategy and the solution for analysis and verification of the charging strategy (including an established queueing model for a CS cluster and a queueing algorithm) were done by Lixing Chen. He was also responsible for the simulation implementation for case study. Besides, this work was also performed under the advisement and regular feedback from Xueliang Huang, Long Jin and Zhong Chen.

Conflicts of Interest

The authors declare no conflict of interest.

References

  1. Williams, J.H.; DeBenedictis, A.; Ghanadan, R.; Mahone, A.; Moore, J.; Morrow, W.R., III; Price, S.; Torn, M.S. The technology path to deep greenhouse gas emissions cuts by 2050: The pivotal role of electricity. Science 2012, 335, 53–59. [Google Scholar] [CrossRef] [PubMed]
  2. Aziz, M.; Oda, T.; Mitani, T.; Watanabe, Y.; Kashiwagi, T. Utilization of electric vehicles and their used batteries for peak-load shifting. Energies 2015, 8, 3720–3738. [Google Scholar] [CrossRef]
  3. Graditi, G.; Langella, G.; Laterza, C.; Valenti, M. Conventional and Electric Vehicles: A Complete Economic and Environmental Comparison. In Proceedings of the 2015 International Conference on Clean Electrical Power (ICCEP), Taormina, Italy, 16–18 June 2015; IEEE: New York, NY, USA, 2015; pp. 660–665. [Google Scholar]
  4. Zhu, Z.H.; Gao, Z.Y.; Zheng, J.F.; Du, H.M. Charging station location problem of plug-in electric vehicles. J. Transp. Geogr. 2016, 52, 11–22. [Google Scholar] [CrossRef]
  5. Aziz, M.; Oda, T.; Ito, M. Battery-assisted charging system for simultaneous charging of electric vehicles. Energy 2016, 100, 82–90. [Google Scholar] [CrossRef]
  6. Zhang, S.; Zhang, C.; Xiong, R.; Zhou, W. Study on the optimal charging strategy for lithium-ion batteries used in electric vehicles. Energies 2014, 7, 6783–6797. [Google Scholar] [CrossRef]
  7. Tesla’s Official Website in China. Available online: https://www.tesla.cn/supercharger/ (accessed on 1 February 2016).
  8. Pu, Y. A matching problem and an existence with optimum algorithm. J. Chongqing Univ. 2014, 2, 62–68. (In Chinese) [Google Scholar]
  9. Yang, Y.; Zhang, W.; Niu, L.; Jiang, J. Coordinated charging strategy for electric taxis in temporal and spatial scale. Energies 2015, 8, 1256–1272. [Google Scholar] [CrossRef]
  10. Yan, Y.; Luo, Y.; Zhu, T.; Li, K. Optimal charging route recommendation method based on transportation and distribution information. Proc. CSEE 2015, 35, 310–318. [Google Scholar]
  11. Yang, S.-N.; Cheng, W.-H.; Hsu, Y.-C.; Gan, C.-H.; Lin, Y.-B. Charge scheduling of electric vehicles in highways. Math. Comput. Model. 2013, 57, 2873–2882. [Google Scholar] [CrossRef]
  12. Xing, M. Fast Charging Network on Highway from Beijing to Shanghai Joined up on January 15th. In Fiber Reinforced Plastics/Composites; Beijing FRP Research and Design Institute: Beijing, China, 2015; pp. 97–98. [Google Scholar]
  13. Di Silvestre, M.L.; Sanseverino, E.R.; Zizzo, G.; Graditi, G. An optimization approach for efficient management of EV parking lots with batteries recharging facilities. J. Ambient. Intell. Humaniz. Comput. 2013, 4, 641–649. [Google Scholar] [CrossRef]
  14. Zhao, G.; Huang, X.; Qiang, H. Coordinated control of PV generation and EVs charging based on improved DECell algorithm. Int. J. Photoenergy 2015, 2015. [Google Scholar] [CrossRef]
  15. Hernández-Arauzo, A.; Puente, J.; Varela, R.; Sedano, J. Electric vehicle charging under power and balance constraints as dynamic scheduling. Comput. Ind. Eng. 2015, 85, 306–315. [Google Scholar] [CrossRef]
  16. Crow, M.L. Economic scheduling of residential plug-in (hybrid) electric vehicle (PHEV) charging. Energies 2014, 7, 1876–1898. [Google Scholar]
  17. Deilami, S.; Masoum, A.S.; Moses, P.S.; Masoum, M.A.S. Real-time coordination of plug-in electric vehicle charging in smart grids to minimize power losses and improve voltage profile. In IEEE Transactions on Smart Grid; IEEE: New York, NY, USA, 2011; Volume 2, pp. 456–467. [Google Scholar]
  18. Ma, Z.; Callaway, D.S.; Hiskens, I.A. Decentralized charging control of large populations of plug-in electric vehicles. In IEEE Transactions on Control Systems Technology; IEEE: New York, NY, USA, 2013; Volume 21, pp. 67–78. [Google Scholar]
  19. Pinto, T.; Vale, Z.; Sousa, T.M.; Praça, I.; Santos, G.; Morais, H. Adaptive learning in agents behaviour: A framework for electricity markets simulation. Integr. Comput. Aided Eng. 2014, 21, 399–415. [Google Scholar]
  20. Xia, M.; Lai, Q.; Zhong, Y.; Li, C.; Chiang, H. Aggregator-based interactive charging management system for electric vehicle charging. Energies 2016, 9. [Google Scholar] [CrossRef]
  21. Galus, M.D.; Göran, A. Demand Management of Grid Connected Plug-in Hybrid Electric Vehicles (PHEV). In Proceedings of the Energy 2030 Conference, Energy 2008, Atlanta, GA, USA, 17–18 November 2008; IEEE: New York, NY, USA, 2008. [Google Scholar]
  22. Yu, X. Temporal and Spatial Analysis on Freeway Traffic; Shandong University of Science and Technology: Shandong, China, 2009. [Google Scholar]
  23. Fan, C.; Li, H.; Jia, J.; Hao, L. The relationships among waiting time, perceived economic loss and service satisfaction: A study of taxi drivers’ waiting for gas. Manag. Rev. 2014, 11, 99–105. [Google Scholar]
  24. El-Taha, M. Queueing Networks. University of southern Maine: Portland, USA, 2007; Available online: http://people.usm.maine.edu/eltaha/root_queue_09.pdf (accessed on 7 February 2016).
  25. Rubinstein, R.Y.; Kroese, D.P. Simulation and the Monte Carlo Method; John Wiley & Sons: Hoboken, NJ, USA, 2011. [Google Scholar]
  26. Aini, A.; Salehipour, A. Speeding up the Floyd–Warshall algorithm for the cycled shortest path problem. Appl. Math. Lett. 2012, 25, 1–5. [Google Scholar] [CrossRef]
  27. Baidu’s Official Website in China. Expressways in Jiangsu. Available online: http://map.baidu.com/ (accessed on 18 February 2016).
  28. Sun, H.-C.; Li, X.-H.; Chen, D.-H.; Xu, Z. A method for processing of egress traffic data collected by regional highway network OD study. J. Highw. Transp. Res. Dev. 2008, 8, 137–141. [Google Scholar]
  29. Luo, Z.; Hu, Z.; Song, Y.; Yang, X.; Zhan, K.; Wu, J. Study on plug-in electric vehicles charging load calculating. Autom. Electr. Power Syst. 2011, 35, 36–42. [Google Scholar]
  30. Jia, L.; Hu, Z.; Song, Y.; Ding, H. Planning of EV charging stations in highway network. Autom. Electr. Power Syst. 2015, 15, 82–89. [Google Scholar]
  31. Parameters of Transformers in SCB11 Series. Available online: http://detail.1688.com/offer/1237137856.html/ (accessed on 20 February 2016).
  32. General Requirements for EV Charging Station; GB/T 29781-2013; General Administration of Quality Supervision Inspection and Quarantine of the People’s Republic of China and Standardization Administration: Beijing, China, 2013.
Figure 1. A probability density curve of the EV flow at the origin.
Energies 09 00385 g001
Figure 2. A typical queuing system.
Energies 09 00385 g002
Figure 3. The flowchart of queuing algorithm.
Energies 09 00385 g003
Figure 4. A simplified expressway network.
Energies 09 00385 g004
Figure 5. Distribution of CSs in the network.
Energies 09 00385 g005
Figure 6. Waiting time of EVs in different charging situations.
Energies 09 00385 g006
Figure 7. Charging times of charged EVs in in different charging situations.
Energies 09 00385 g007
Figure 8. Utilization ratios of charging facilities of CSs under different charging conditions.
Energies 09 00385 g008
Figure 9. A simplified power system.
Energies 09 00385 g009
Figure 10. Active charging load of CSs in different charging situations: (a) unordered charging (b) orderly charging.
Energies 09 00385 g010
Figure 11. Queue length in each CS in different charging situations: (a) unordered charging (b) orderly charging.
Energies 09 00385 g011
Table 1. A status-of-use price suitable for charging electric vehicles (EVs) on expressways. CS: charging station.
PriceState of CSValue($/kW·h)
αBusy0.15
βIdle0.11
Table 2. Origins and destinations (OD) distribution of EVs.
OD
123456789
1016481116139518149226336
2167043647628281123185
3814103138140406191
411864310542005888130
5134743551023166101152
65401931432072480265401599
7174954667803000131194
825313767971174331240282
9348190921331605931712600
Table 3. Parameters of EVs.
TypeBattery CapacityMaximum MileageCharging Power
MODEL S7070 kWh332 km112 kW
MODEL S70D70 kWh337 km112 kW
MODEL S8585 kWh365 km120 kW
MODEL S85D85 kWh383 km120 kW
MODEL SP85D85 kWh364 km120 kW
Table 4. Percentage of users conducting different charging actions in different charging situations. UC: unordered charging; OC: orderly charging; ACA: adjustable charging action; FCA: forced charging action.
Charging SituationUCOC
Percentage of users conducting FCA90%10%
Percentage of users conducting ACA10%90%
Table 5. Total charging cost and electric energy of charged EVs in different charging situations.
Charging SituationUCOC
Cost ($)46,58147,347
Electric energy (kWh)359,390373,824
Mean price ($/kWh)0.12960.1266
Reduction-2.3%
Table 6. The number of charged EVs in different charging situations.
Charging SituationUCOC
Number of charged EVs70637851
Addition-11.2%
Table 7. Standard deviation and mean value of the overall utilization ratio of the CSs in different charging situations.
Charging SituationUCOC
Standard deviation0.20860.1936
Reduction-7.19%
Mean value0.19900.2068
Addition-3.92%
Table 8. Standard deviation and mean value of average active charging load of CSs in different charging situations.
Charging SituationUCOC
Standard deviation (kW)270.8251.2
Reduction-7.24%
Mean value (kW)258.2268.6
Addition-4.03%

